

Crypto World
Hyperliquid Revenue Rebounds Above $20M as Open Interest Hits 7.9% Record
TLDR:
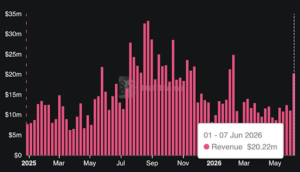
- Hyperliquid weekly revenue returns above $20.22M after months of $8M–$15M consolidation range phase shift.
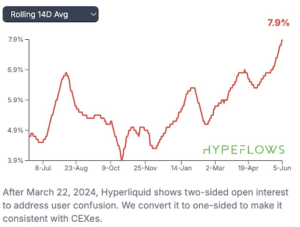
- Open interest share climbs to 7.9%, marking record gain against centralized derivatives exchange competitors.
- Platform maintains $5.9B TVL with $222B monthly volume and strong perpetual futures trading activity levels.
- Annualized fees exceed $1.05B while revenue reaches $881M, driven by sustained derivatives market usage.
Hyperliquid shows renewed momentum across revenue, liquidity, and derivatives positioning as weekly earnings return above $20 million in June 2026.
The protocol also records rising open interest share and sustained capital inflows, signaling continued activity across its trading ecosystem platform.
Revenue Recovery Signals Trading Cycle Reset
Hyperliquid recorded a return above $20.22 million in weekly revenue during the June 1–7, 2026 period. This marked the first break above the $20 million level since February 2026, ending a multi-month range of lower activity across the platform’s derivatives markets.

Source: Degen News(X)
Earlier in the cycle, Hyperliquid revenue fluctuated between $8 million and $15 million weekly, reflecting subdued volatility conditions after the 2025 expansion phase. Activity remained consistent, though far below the highs recorded during the previous market surge.
During August and September 2025, Hyperliquid reached weekly revenue peaks above $30 million, driven by elevated trading activity and increased participation across perpetual futures markets. Those conditions represented a volatility-heavy environment compared with 2026 trading behavior.
Market structure data shows Hyperliquid maintaining a stable revenue floor even during contraction phases. This indicates persistent engagement from core users, supported by continued derivatives trading activity across the ecosystem.
Open Interest and Capital Flows Point to Structural Shift
Hyperliquid’s share of aggregate perpetual futures open interest reached 7.9%, marking a record level against centralized exchange competitors.
The metric reflects increasing capital commitment, as traders allocate larger positions to decentralized infrastructure for derivatives execution.
Source: Degen News(X)
Total value locked on Hyperliquid stands near $5.9 billion, supported by consistent inflows across market cycles. Annualized fees exceed $1.05 billion, while revenue approaches $881 million, driven primarily by perpetual futures trading volume and sustained position activity.
Trading volume data shows $222 billion processed over a 30-day window, with open interest at $9.15 billion, indicating sustained positioning rather than short-term speculative turnover.
Liquidity conditions have remained stable across volatility shifts, supporting continuous derivatives activity on the platform.
Capital allocation trends suggest users are increasingly treating decentralized venues as primary execution layers rather than alternative markets.
The progression of market share in perpetual futures trading continues to expand, supported by improved execution efficiency and deeper order book participation.
Hyperliquid continues to operate within a competitive landscape dominated by centralized exchanges, yet its share of activity has increased steadily across 2026.
The platform’s ability to maintain liquidity during both expansion and contraction phases reflects persistent usage across diverse trader segments.


It is the longest losing streak the spot Bitcoin ETFs have ever recorded.
Summary
- U.S. spot Bitcoin ETFs recorded a record 13 consecutive trading days of net outflows, with roughly $4.37 billion leaving the funds between May 15 and June 3.
- BlackRock’s IBIT accounted for about $3.3 billion of the withdrawals as total spot Bitcoin ETF assets fell from $104.29 billion to $82.83 billion.
- The streak highlighted the growing influence of ETF flows on Bitcoin price action, though cumulative net inflows since launch still exceed $55 billion.
Between May 15 and June 3, 2026, US-listed spot Bitcoin ETFs bled cash for 13 consecutive trading days, draining roughly $4.37 billion from the complex and flipping the year’s cumulative flows negative for the first time since the funds launched in January 2024.
BlackRock’s iShares Bitcoin Trust absorbed about three-quarters of the damage, shedding $3.3 billion on its own. Total assets across all US spot Bitcoin ETFs fell from $104.29 billion to $82.83 billion in roughly three weeks, a $21.46 billion drop, as redemptions and a falling Bitcoin price compounded each other.
The streak finally broke on June 4 with a token $3 million net inflow, but the number that matters is not the one that ended it.
The real story is what an unprecedented 13-day run reveals about how Bitcoin actually works now, and the answer is more interesting than the bearish headline.
ETF flows have become part of Bitcoin’s price machinery, and this streak is the clearest demonstration yet of what that means in both directions. This piece breaks down the streak, what it signals, and how to read it without panicking or hoping.
The streak, by the numbers
Start with the full scope, because the scale is what makes this more than a routine pullback.
US spot Bitcoin ETFs recorded net outflows for 13 straight trading sessions from May 15 through June 3, the longest such streak since the products launched in January 2024. The previous record was eight consecutive days, set during a February 2025 correction, so this run did not just break the record, it shattered it by more than half again. Over those 13 days, approximately $4.37 billion left the funds, equivalent to around 59,000 Bitcoin at the prices involved.
The concentration matters. BlackRock’s IBIT, the largest spot Bitcoin ETF by assets, accounted for roughly $3.3 billion of the outflows, about 75% of the total. Fidelity’s FBTC was the second-largest contributor at around $456 million, followed by Grayscale’s GBTC at roughly $303 million. The fact that one fund drove three-quarters of the bleed tells you this was led by large institutional redemptions through the dominant vehicle, not a broad retail panic spread evenly across the complex.
The combined effect on assets was severe. Total net assets across all US spot Bitcoin ETFs fell from $104.29 billion on May 15, the last session before the streak began, to $82.83 billion on June 3. That $21.46 billion decline came from two forces working together: the redemptions themselves and the drop in Bitcoin’s (BTC) price, which fell about 21% over the same window from above $80,000 toward $63,000. ETF holdings now equal roughly 6.36% of Bitcoin’s circulating market cap, down from above 7% at the mid-May peak.
Galaxy Research added a detail that underlines how sustained the selling was: the trailing 7-day, 10-day, and 20-day outflow windows all set all-time records during the streak, with the 20-day window reaching $5.42 billion and 73,080 Bitcoin, the heaviest readings ever in both dollar and coin terms. This was not one bad day dragging the average down. It was nearly three weeks of consistent, intensive selling, which is precisely what makes it significant as a signal, not noise.
Why a streak means more than a single day
A common mistake in reading ETF flows is to fixate on the largest single-day number. The streak structure is more informative than any one session, and understanding why is the key to interpreting this event.
A single large outflow day can be almost anything: one institution rebalancing, a quarterly portfolio adjustment, a tactical hedge, a fat-finger block trade. It is a data point, easily explained away, and often reversed the next session. A 13-day streak cannot be explained that way. Sustained, consecutive selling over nearly three weeks means the selling pressure is structural, not incidental, that a broad set of holders kept deciding, day after day, to reduce exposure. Persistence is the signal. It says the move reflects a genuine shift in sentiment and positioning, not a one-off event.
That is why the all-time-record 7, 10, and 20-day windows matter more than the single worst day. They show the selling was distributed across the entire period rather than concentrated in one wave that then exhausted itself. In market-structure terms, a concentrated single-day dump often marks capitulation, a final flush after which selling pressure eases. A prolonged streak, by contrast, suggests ongoing distribution, a steady reallocation away from the asset that can continue until the underlying reason changes. The shape of the selling tells you about its nature, and this shape says the pressure was deep and sustained.
There is a flip side that the streak structure also reveals, and it is the more important long-term point. For the streak to matter this much, ETF flows have to matter this much, and they do now in a way they did not in previous Bitcoin cycles. That is the real lesson buried in the 13-day run.
The deeper signal: ETFs are now Bitcoin’s marginal bid
The most important thing the streak reveals is structural, and it reframes how to think about Bitcoin entirely. The spot ETFs have become part of Bitcoin’s price machinery, the marginal source of buying and selling that moves the price at the edges.
One analysis put a striking number on it: ETF flows now drive roughly 45% of weekly Bitcoin price moves. Whether or not that exact figure is precise, the direction is unmistakable. Since their January 2024 launch, the spot ETFs have grown large enough that their daily creation and redemption activity is a major input into Bitcoin’s price, not a sideshow. When the ETFs are buying, they provide a steady bid that absorbs supply and amplifies rallies. When they are selling, as during this streak, they become a source of supply that drags the price down and removes the dip-buyer that might otherwise stabilize it.
This is a genuine change in Bitcoin’s nature. In the 2017 and 2021 cycles, Bitcoin’s price was driven primarily by retail speculation, miner selling, and crypto-native flows. There was no institutional ETF channel because the ETFs did not exist. Now they do, and they have become what one analysis called Bitcoin’s marginal bid. That cuts both ways and is the key insight for interpreting flow data going forward. The same mechanism that powered Bitcoin’s 2024-2025 rise to $126,000, a relentless ETF bid absorbing supply, is the mechanism that drove this decline when it reversed. The ETFs did not just passively reflect the selloff. As a major share of marginal flow, they were part of the machinery producing it.
So the 13-day streak is really two signals at once. In the short term, it is a bearish indicator of sustained distribution and negative sentiment. In the structural sense, it is confirmation that Bitcoin has been institutionalized to the point where regulated fund flows are a primary price driver, for better and for worse. The asset that was supposed to be beyond the traditional financial system now moves substantially on the buying and selling decisions made inside it.
The context the panic headlines leave out
For all the record-breaking alarm, several pieces of context complicate the purely bearish read, and leaving them out produces a distorted picture.
The first is the lifetime number. Despite the $4.37 billion that left during the streak, cumulative lifetime net inflows into the Bitcoin ETFs since January 2024 still exceed $55 billion, according to Bloomberg ETF analyst Eric Balchunas, less than $10 billion below the all-time high-water mark. In other words, the streak gave back a small fraction of the enormous capital that flowed in over two years. The funds undid part of a recent recovery and pushed 2026’s flows negative, but the structural position built since launch remains overwhelmingly intact. A $4 billion outflow against $55 billion in lifetime inflows is a meaningful momentum reversal, not a structural collapse.
The second is what happened to the Bitcoin that was left. The redemptions do not necessarily mean the Bitcoin was dumped into oblivion. Analysts noted the streak partly reflects a redistribution of supply toward long-term holders, the cohort that tends to accumulate during weakness and hold through cycles. When ETF shares are redeemed in a falling market, some of that Bitcoin moves from short-term, price-sensitive ETF allocations into the hands of holders with longer horizons. That kind of redistribution from weak hands to strong hands has historically been a feature of bottoms, not tops.
The third is the comparison to April. The selling marks a sharp reversal from April 2026, which were the funds’ strongest month of the year with $1.97 billion in inflows. That whiplash, from best inflow month to worst outflow streak in a matter of weeks, points to a sentiment and macro shift rather than a fundamental breakdown in the ETF thesis. The plumbing did not break. The direction of the flow through it is reversed, driven by the same macro forces, rising Treasury yields, hawkish Fed expectations, and capital rotating toward AI, that pressured all risk assets.
And the fourth is that the streak ended. June 4 broke the run with a small net inflow, modest at around $3 million, but a directional change nonetheless. One green day does not erase a 13-day red streak, but it suggests the most intensive phase of selling may have run its course, at least temporarily.
How to actually read it
Pulling it together, the practical way to interpret the 13-day streak avoids both the doom and the hopium, and focuses on what the flow data can and cannot tell you.
What it tells you for certain: institutional sentiment turned sharply negative for nearly three weeks, the selling was sustained and broad, not a one-off, and ETF flows are now a dominant enough force that a streak like this is a genuine driver of price rather than a passive symptom. The institutionalization of Bitcoin is complete enough that watching ETF flows is no longer optional for understanding the market. They are the marginal bid, and the marginal bid turned into a marginal offer.
What it does not tell you: whether this is a bottom or a continuation. A sustained streak can mark the distribution phase before further declines, or it can mark the capitulation that precedes a recovery, and the flow data alone cannot distinguish between them. The bullish reading points to the redistribution toward long-term holders, the extreme fear readings that have historically preceded recoveries, and the intact $55 billion lifetime position. The bearish reading points to the record-breaking persistence of the selling, the macro headwinds that have not resolved, and the reality that 45% of weekly price action now rides on a flow that turned negative.
The honest synthesis is that the streak is a significant negative event whose ultimate meaning depends on what the flows do next. The single most useful thing to watch is not the price but whether the June 4 inflow was a one-day blip or the start of a return to sustained positive flows. If the ETFs resume steady buying, the streak will look in hindsight like a deep correction within an institutionalized bull market. If they keep bleeding after the brief pause, the negative turn is structural, and the marginal bid stays a marginal offer. Either way, the 13-day streak’s lasting lesson is the one that survives whatever happens next: Bitcoin is now a fund-flow asset, and the funds, not the cypherpunks, hold the marginal vote on its price
This article is for informational purposes and does not constitute financial or investment advice. Cryptocurrency markets are highly volatile. The figures and analysis described reflect data available as of June 5, 2026. Always do your own research and consult with qualified financial professionals before making investment decisions


Bitcoin’s latest oversold RSI mirrors 2020 and February 2026 setups that preceded 50% and 30% rebounds, putting $70K back in focus.

TLDR:
- Bitcoin dropped 83%, 84%, and 77% following the last three Federal Reserve leadership transitions.
- New Fed chairs typically adopt hawkish rhetoric early, tightening liquidity and pressuring risk assets.
- The Fed ended quantitative tightening in December 2025 and resumed short-term Treasury purchases.
- Warsh’s hawkish history and renewed inflation signals cloud hopes for dovish policy at June FOMC.
Bitcoin is hovering near $63,000 as the Federal Reserve prepares for a leadership change in May 2026. Jerome Powell will hand over the chair to Kevin Warsh amid subdued crypto markets.
Equities continue hitting all-time highs, yet Bitcoin remains roughly 50% below its $125,000 peak. A recurring historical pattern now draws renewed attention: every Fed Chair transition has coincided with a major Bitcoin drawdown.
Bitcoin Fed Chair Transitions and the Drawdown Pattern
The data behind this pattern is difficult to ignore. Bitcoin dropped approximately 83% after Janet Yellen assumed office in 2014.
A similar 84% decline followed Jerome Powell’s first term beginning in 2018. Powell’s reappointment in 2022 preceded a 77% collapse tied to the most aggressive tightening cycle in modern history.
MacroMicro research attributes these declines to several recurring forces. Early in a new chair’s tenure, institutional investors reduce exposure to volatile assets while policy direction remains unclear.
New chairs also tend to adopt hawkish rhetoric to establish inflation-fighting credibility, which tightens liquidity conditions.
Markets further compound the effect through anticipation. Tightening expectations often get priced in before formal policy shifts occur, producing classic “buy the rumor, sell the news” behavior. External shocks then frequently amplify whatever policy pressure already exists.
Each historical cycle shows this combination clearly. The Mt. Gox collapse in February 2014 hit just as Yellen took office and QE tapering began.
The ICO unraveling in 2018 coincided with rate hikes and balance sheet reduction under Powell. In 2022, the Terra and FTX collapses struck as the Fed raised rates at an unprecedented pace.
Why This Cycle May Differ for Bitcoin
The current transition carries meaningful differences from prior episodes. The Federal Reserve formally ended quantitative tightening in December 2025 and has since resumed purchases of short-term Treasury securities. This shift keeps baseline liquidity conditions more stable than during the 2018 or 2022 cycles.
MacroMicro’s research notes that a liquidity-driven Bitcoin selloff, similar to previous transitions, carries reduced risk this time around.
Stable liquidity foundations remove one of the central mechanics that turned prior drawdowns into prolonged bear markets.
That said, uncertainty around Warsh’s policy direction remains. His historically hawkish stance and signs of renewed inflation suggest the June FOMC meeting may not deliver the dovish signals some market participants expect. Trump’s pressure on Warsh to support rate cuts adds another layer of unpredictability.
Investors watching Bitcoin through this transition should focus less on the historical curse and more on the Fed’s actual policy trajectory.
Whether the new chair tilts accommodative or restrictive will likely determine whether Bitcoin breaks the pattern or repeats it.

Kraken is expanding access to a SpaceX IPO through its tokenized equities platform, xStocks, highlighting a broader push to blend crypto-style trading rails with traditional capital markets. SpaceX will be the first public offering available via xStocks IPO Access, with eligible Kraken users able to apply for IPO participation directly in the mobile app. The move underscores the growing willingness of crypto-enabled platforms to anchor mainstream equity events in tokenized form.
Participation through IPO Access requires a verified Kraken account on the company’s mobile app, and the offering is not accessible via Kraken Pro or the desktop platform. Kraken says the service is available across the European Economic Area and more than 110 international markets, though regulatory constraints exclude participation from the United States, Canada, Australia, and the United Kingdom for now.
Under the tokenized structure, investors who receive an allocation will be issued SPCXx, a tokenized representation of SpaceX equity that is backed 1:1 by the underlying shares. These SPCXx tokens are tradable 24/7 on Kraken and on other participating xStocks platforms, providing continuous liquidity for participants in a way that traditional IPO access does not offer.
The SpaceX IPO comes with high expectations. Bloomberg reported that demand for the offering has already outstripped the available shares, with SpaceX aiming to raise roughly $75 billion at a valuation of at least $1.8 trillion. If achieved, the listing would be one of the largest in history, potentially eclipsing the record set by Saudi Aramco’s 2019 IPO. The coverage notes that SpaceX’s growth narrative relies heavily on Starlink, the satellite internet business that has become a significant revenue driver, even as the company continues to shoulder substantial costs associated with launches and ongoing space ventures.
Key takeaways
- First tokenized IPO via xStocks: SpaceX will launch on Kraken’s xStocks IPO Access, with tokens representing 1:1 SpaceX equity backed by the underlying shares and tradable around the clock.
- Global reach with regulatory limits: IPO Access spans the EEA and 110+ markets, but participation is restricted in the U.S., Canada, Australia, and the U.K. due to regulatory considerations.
- Massive fundraising potential: Bloomberg indicates demand has exceeded supply, with SpaceX seeking roughly $75 billion and a valuation of at least $1.8 trillion, which would set new IPO records if realized.
- SpaceX growth linked to Starlink: The satellite internet business is a central pillar of SpaceX’s revenue model, though the company’s capital-intensive operations raise questions about long-term valuation and profitability.
- xStocks momentum and ecosystem: The tokenized equities platform has gained notable traction, with prior coverage highlighting substantial volume and thousands of on-chain holders.
SpaceX’s IPO path and what tokenized access means for markets
The combination of a high-profile IPO and a tokenized access framework is a notable test of how traditional capital markets can coexist with crypto-native infrastructure. By issuing SPCXx tokens that correspond 1:1 to SpaceX shares, Kraken aims to offer a parallel path to public ownership that sidesteps some of the friction inherent in conventional IPO processes—such as book-building, pro rata allocations, and limited trading windows before and after listing. In practice, tokenized access could broaden participation beyond institutional buyers and accredited investors, particularly in jurisdictions where IPO investment is accessible via digital-asset rails. Yet it also introduces a different set of risks and questions, including how tokenized allocations align with actual share availability, how price discovery will unfold in a 24/7 trading environment, and how cross-border regulatory regimes will adapt to tokenized equity structures.
SpaceX’s publicly valued potential hinges on more than the number of shares offered. Bloomberg’s reporting frames the deal as a validation of SpaceX’s multi-pronged growth strategy, with Starlink as a driving engine for revenue and profitability. At the same time, the company’s launch cadence, capital expenditure, and ongoing R&D intensity create an environment where investors must weigh growth prospects against near-term cash burn and long-term capital needs. If the market delivers on SpaceX’s ambitious IPO aspirations, it could redefine how investors approach high-profile ventures that straddle private innovation and public ownership—an area where tokenized equities are increasingly being pitched as a bridge between worlds.
The broader crypto market context adds another layer. xStocks, as a platform, has already demonstrated substantial activity, with prior coverage noting more than $25 billion in tokenized-equities volume and thousands of on-chain holders. The SpaceX entry through xStocks could serve as a litmus test for how scalable tokenized IPO access can be, not just as a novelty but as a replicable model for future listings. That trajectory will depend on how regulators respond to tokenized offerings, how liquidity and execution align with underlying share trading, and whether more blue-chip IPOs follow suit.
What investors should watch next
As SpaceX approaches its planned public debut date, investors on xStocks and beyond will be closely watching several key factors. First, the pace and size of initial allocations will influence the perceived accessibility of tokenized IPOs and the signaling value for broader markets. Second, trading dynamics for SPCXx tokens—particularly how they track SpaceX’s underlying stock price and how liquidity holds up in times of market stress—will be critical to assess. Third, regulatory clarity across major jurisdictions will determine the feasibility of expanding tokenized IPO access to additional markets, including the U.S. and the U.K., where restrictions currently apply.
Finally, the SpaceX IPO itself will set a benchmark for how investors value a company at the intersection of aerospace prowess and consumer-facing connectivity infrastructure. The outcome may influence how ventures with heavy upfront costs and high growth potential are perceived by public markets, especially when tokenized instruments promise around-the-clock trading and novel allocation mechanics. If the market embraces SpaceX via tokenized anchors, it could accelerate further experiments in tokenized equity and cross-market collaboration between crypto ecosystems and traditional stock markets.
As the listing date draws nearer, market participants should stay attentive to updates from Kraken about eligibility, allocation timelines, and any shifts in available jurisdictions. The evolving dynamic between tokenized access and conventional IPO mechanics will continue to shape how investors navigate this new frontier.
Note: Bloomberg’s reporting on SpaceX’s IPO dynamics and demand provides the latest context for the deal’s scale and potential implications. For readers tracking the broader xStocks ecosystem, prior coverage highlighted significant volumes and growing on-chain participation in tokenized equities.
Security researcher Taylor Hornby plans to add Monero (XMR) to his audit queue after using Anthropic’s Claude Opus 4.8 to expose a critical counterfeiting flaw in Zcash (ZEC).
Hornby confirmed the move when asked whether he could probe other privacy coins. His Zcash discovery erased roughly 30% from ZEC before developers shipped an emergency patch.
How an AI Audit Found the Zcash Bug
Hornby, commissioned by nonprofit developer Shielded Labs in April, ran a custom auditing agent paired with Opus 4.8 on May 29.
Within a day, he flagged a soundness flaw in the Orchard shielded pool. Anthropic had released the model only a day earlier, making the find one of its first high-profile security catches.
The bug, an under-constrained elliptic curve check, had survived since Orchard launched in May 2022. It could have minted unlimited, undetectable ZEC counterfeits within the pool.
Engineers closed the hole on June 2. Shielded Labs said prior exploitation looks unlikely but cannot be ruled out cryptographically, a tension central to the AI-assisted Zcash bug disclosure.
Why Monero Is Next
Monero is the largest default-privacy cryptocurrency. It hides every transaction by design rather than offering Zcash’s optional shielding.
A recent Monero network upgrade added further privacy features, widening the surface Hornby could examine in the ongoing privacy coin race.
Follow us on X to get the latest news as it happens
He said other privacy-focused projects also sit on the list. He intends to apply for a Zcash coinholder grant to fund the work.
“To get ahead of scams, if you’re interested in donating to me for finding the Zcash bug, my addresses are in this post or in my replies below…donations are much appreciated but not necessary!” Taylor Hornby appealed.
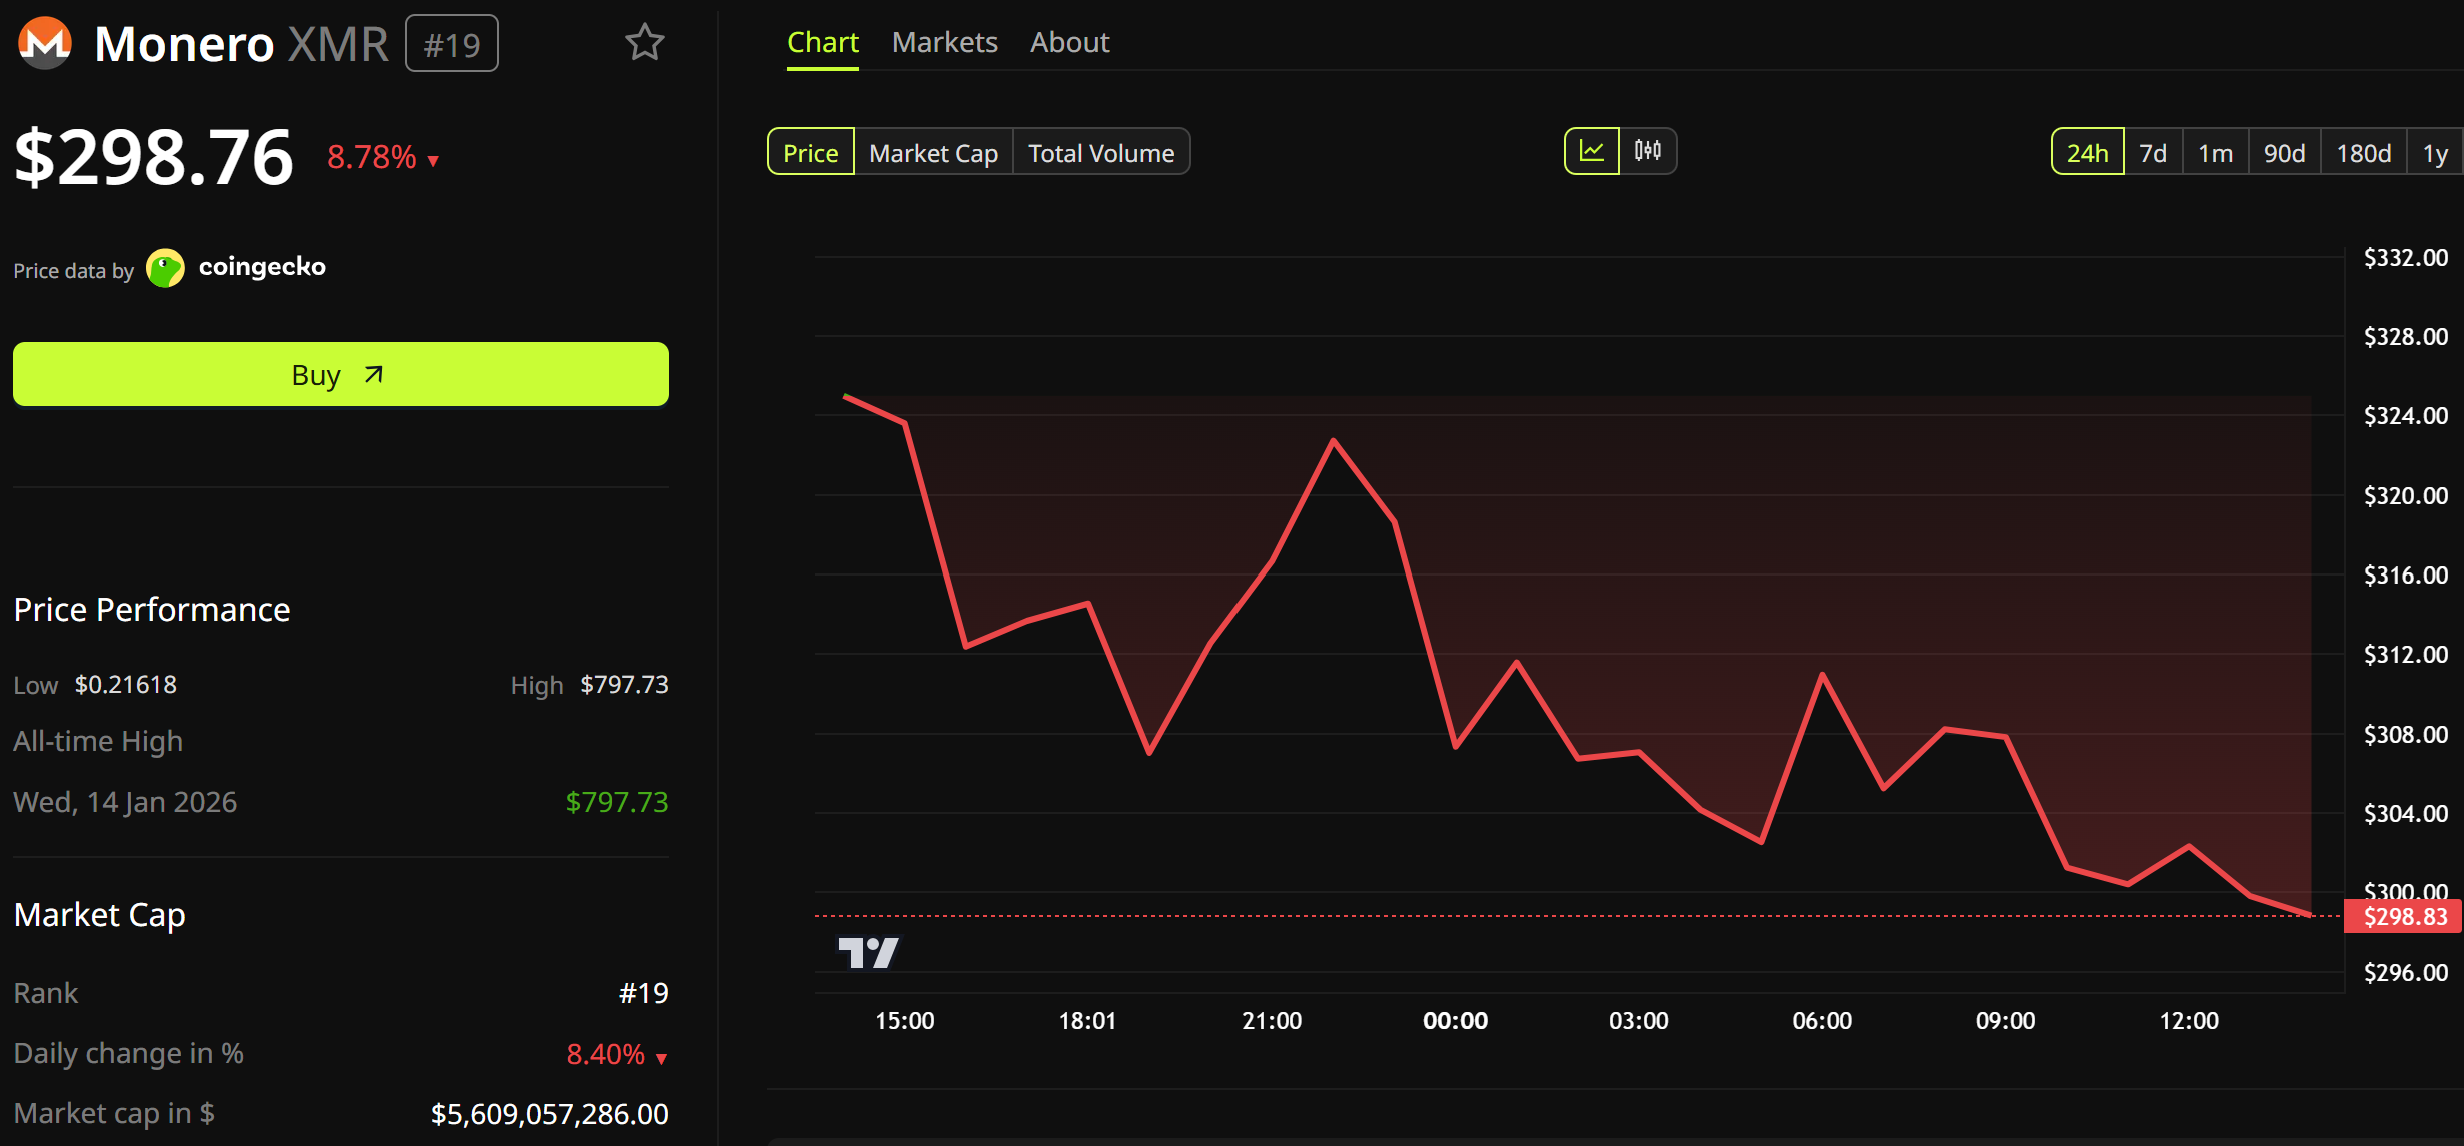
ZEC has since steadied near $363, recovering by nearly 20% in the last 24 hours. As of this writing, the Zcash token was trading for $373.27.
In turn, Monero’s XMR token has fallen by nearly 10%, and was trading for $298.76 as of this writing.

Meanwhile, as institutions holding ZEC weigh the fallout, a formal verification push backed by the Winklevoss twins now aims to prevent similar flaws.
The episode shows AI tools surfacing bugs that human reviewers missed for years.
The post Researcher Who Found Zcash Bug Adds Monero to Audit Queue, XMR Price Falls 10% appeared first on BeInCrypto.
Ethereum has entered a decisive bearish phase after losing multiple high-timeframe support levels in a matter of days. The latest sell-off pushed ETH through a major confluence zone that had previously acted as support throughout the first half of the year, placing the market at a critical juncture where buyers must defend lower demand levels to prevent a deeper correction.
Ethereum Price Analysis: The Weekly Chart
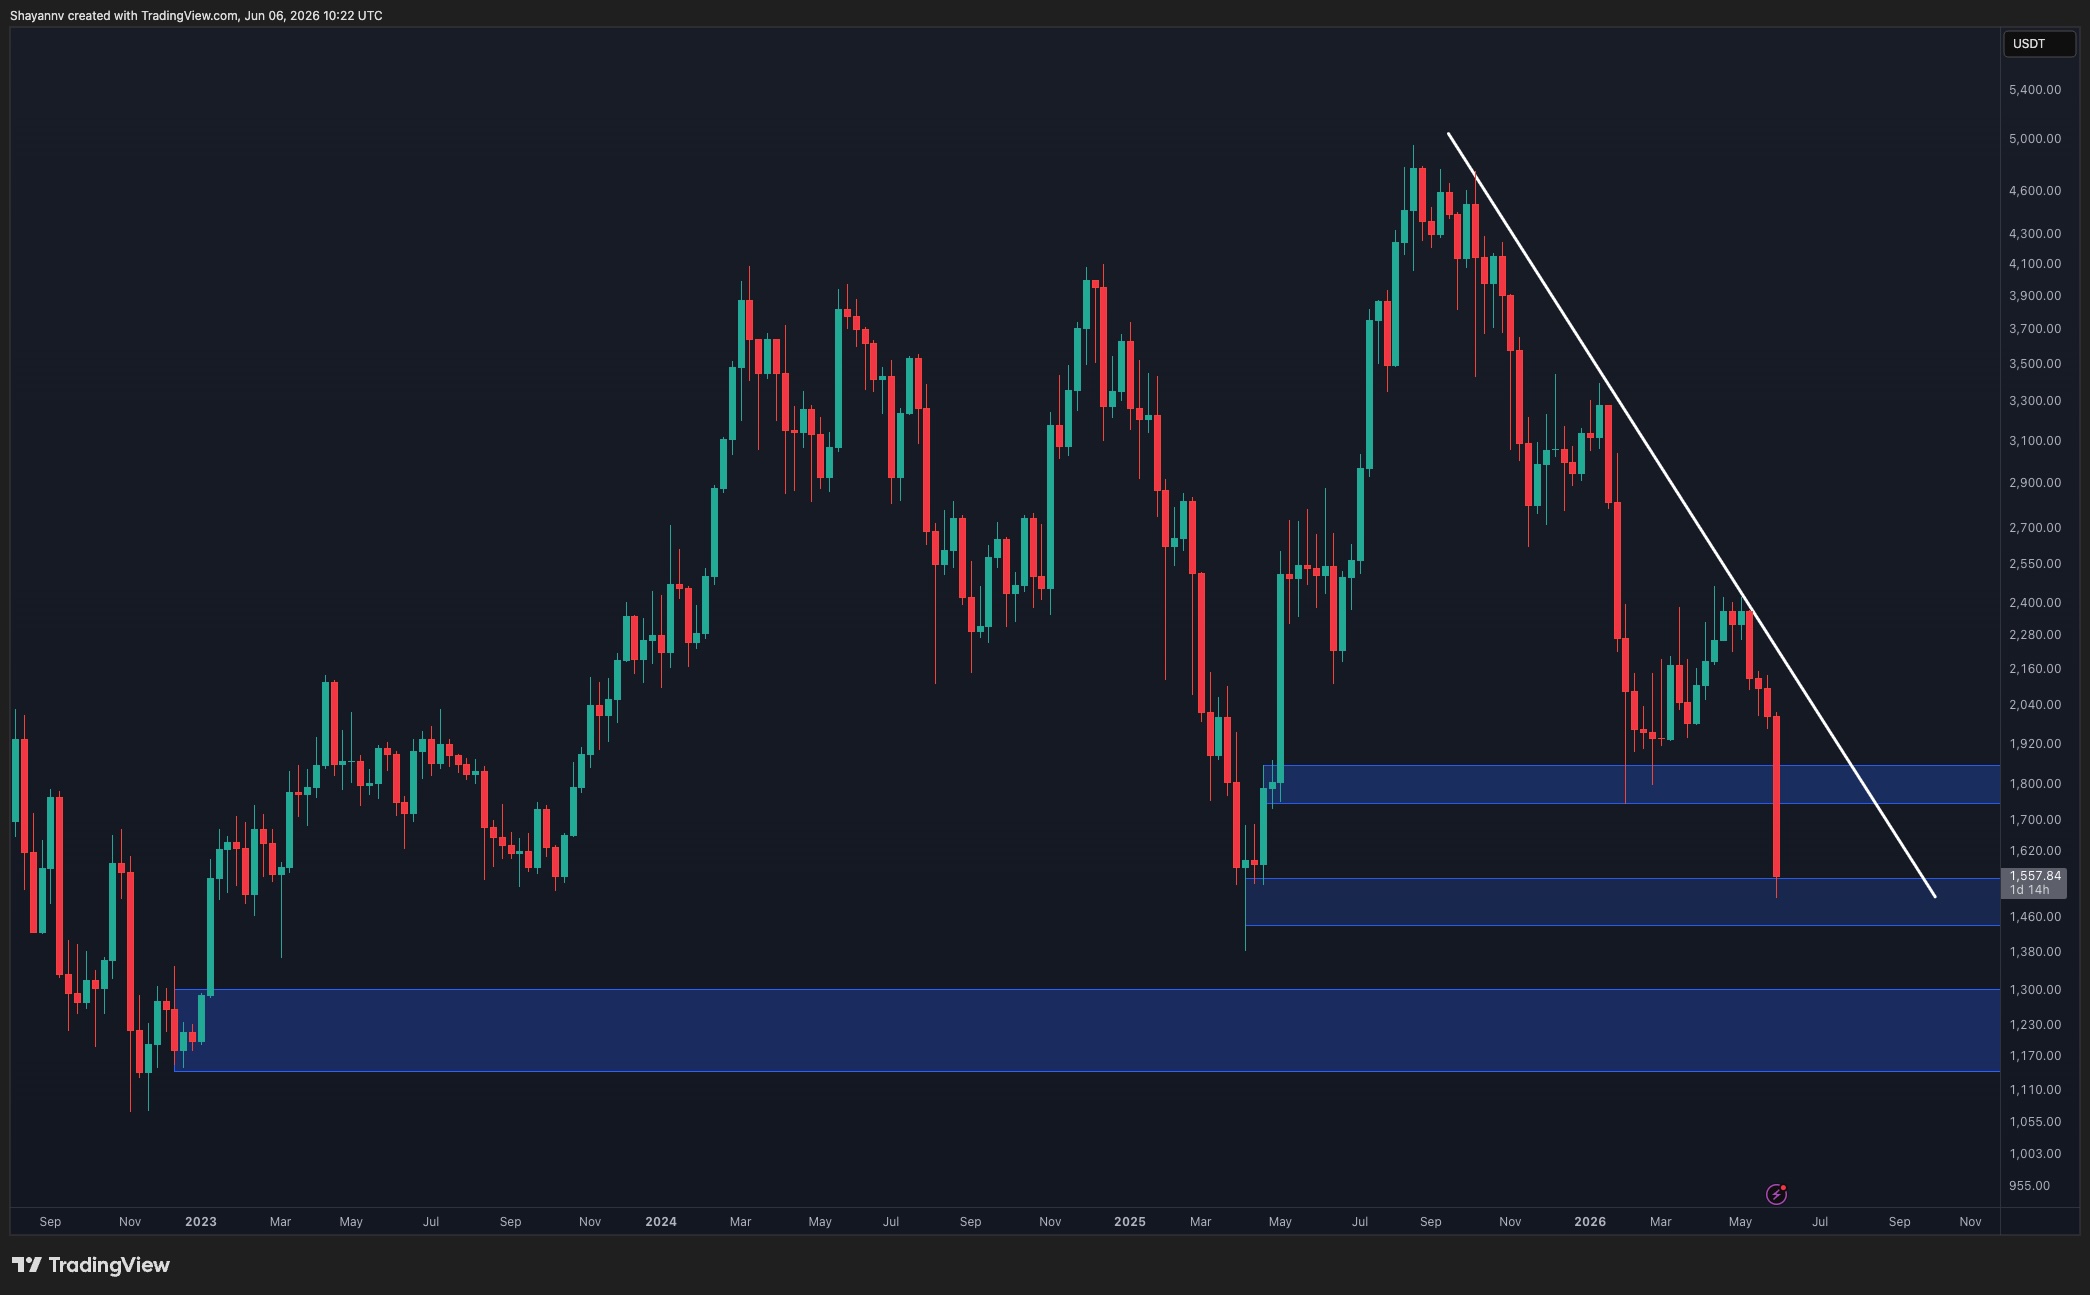
The weekly chart shows a significant deterioration in market structure. After peaking near $5K, ETH established a series of lower highs beneath a descending trendline that has capped every major recovery attempt since late 2025. The recent rejection from this trendline reinforced bearish control and accelerated the latest downside move.
More importantly, ETH has now broken below the major support area around $1.75K-$1.85K, a zone that previously acted as a key pivot during the March rebound. The breakdown confirms a bearish continuation pattern and shifts focus toward the next demand region around $1.45K-$1.55K.
The current weekly candle is testing the upper boundary of that support zone, with price trading near $1.56K. A weekly close below this region would significantly increase the probability of an extension toward the broader demand area around $1.15K-$1.30K, which represents the next major historical support visible on the chart.
For bulls to regain momentum, ETH would first need to reclaim the broken $1.75K-$1.85K region and eventually break above the descending trendline resistance. Until then, the broader structure remains bearish.
ETH/USDT 4-Hour Chart
The 4-hour chart highlights the severity of the recent sell-off. ETH broke down from a prolonged descending structure without establishing any meaningful support. The blue support zone between roughly $1.74K and $1.85K, which had previously acted as a major demand area and also aligns with the 0.5-0.618 Fib levels, failed to contain selling pressure and has now turned into resistance.
ETH is currently testing the lower demand zone around $1.50K-$1.57K, where some reactive buying has emerged. However, the rebound remains limited and does not yet indicate a sustainable trend reversal. If this support area fails to hold, the next downside objective could emerge below $1.50K. On the other hand, any relief rally would likely encounter resistance around $1.74K-$1.85K, followed by the Fibonacci cluster between $1.88K and $1.92K.

Sentiment Analysis
The 3-month liquidation heatmap suggests that a substantial amount of downside liquidity has already been cleared during the latest cascade lower. As ETH plunged from above $2K toward $1.5K, most of the notable liquidation clusters beneath the market were swept, reducing the immediate magnetic effect from lower levels.
Meanwhile, the most significant remaining liquidity concentrations are now positioned above the current price, particularly in the $1.7K-$1.9K region and extending toward the $2.4K-$2.5K area. This creates an interesting dynamic where the market lacks major nearby liquidity targets below spot while maintaining sizeable overhead liquidation pools.
However, the absence of significant liquidity beneath price does not necessarily imply an immediate reversal. Instead, it suggests that ETH may enter a period of consolidation or corrective rebound before establishing its next directional move. If buyers fail to reclaim broken support levels, the market could still experience a deeper retracement driven by spot selling rather than liquidation hunting.
For now, Ethereum remains under strong bearish pressure, but with most nearby downside liquidity already swept, traders should closely monitor whether the $1.45K-$1.55K support zone can stabilise price and trigger a relief recovery toward the newly formed resistance overhead.

The post Ethereum Price Prediction: Will ETH Dump Toward $1K Next? appeared first on CryptoPotato.
TLDR:
- Arthur Hayes-linked token picks posted major corrections, with ZEC leading losses above 61%.
- WLD, HYPE, NEAR, and ZEC attracted strong retail interest before sharp market reversals.
- Social media debate intensified following claims surrounding Hayes’ reported WLD position exit.
- WLD is testing a major demand zone that could determine its next directional move.
Arthur Hayes crypto picks have come under renewed market scrutiny after several tokens he publicly discussed recorded sharp declines from recent highs.
As debate grows around retail participation and influencer-driven narratives, traders are increasingly turning their attention to Worldcoin, where a key technical support zone is now emerging as the market’s next focal point.
Arthur Hayes Crypto Picks Spark Debate After Major Token Declines
Arthur Hayes Crypto Picks have become the center of a growing market discussion after four closely watched tokens posted substantial corrections.
NEAR Protocol (NEAR), Hyperliquid (HYPE), Zcash (ZEC), and Worldcoin (WLD) all attracted strong retail interest following public commentary linked to the former BitMEX CEO.
Recent market data shows the extent of the pullback. WLD has fallen roughly 36% from its local high, while HYPE declined about 25%.
NEAR recorded a steeper correction of more than 41%, whereas ZEC suffered the deepest drawdown, losing over 61% from peak levels highlighted on market charts.
The losses have reignited conversations around the influence of prominent market participants in crypto. Social media discussions have questioned whether retail traders entered positions based on conviction generated by public commentary, only to face heavy losses during subsequent corrections.
Particular attention has centered on Worldcoin. Community members circulated claims that Hayes exited a WLD position shortly after publicly indicating confidence in the asset. While the full context remains debated, the timing became a major talking point across crypto platforms.
The situation also reflects a broader reality within digital asset markets. High-profile investors can quickly shape market sentiment, and bullish narratives often attract significant buying activity within a short period.
However, professional traders frequently operate under different strategies, risk tolerances, and investment horizons than retail participants.
Worldcoin Price Defends Key Demand Zone Amid Market Uncertainty
Despite the controversy surrounding Arthur Hayes Crypto Picks, traders are increasingly focused on Worldcoin’s technical structure.
After rallying from the $0.24-$0.30 range to nearly $0.55, WLD entered a sharp corrective phase that pushed price back toward a critical support region.
The $0.40-$0.43 area has emerged as a major battleground between buyers and sellers. Before the breakout, this zone acted as resistance for several months. Technical traders often view such levels as potential support once a breakout is confirmed.
Price action around the zone has remained relatively constructive. Selling pressure accelerated following the rally, yet buyers repeatedly stepped in to prevent a decisive breakdown below support.
Market participants are now watching for confirmation through candle closes above the demand region. If support continues holding, attention could shift toward a recovery into the $0.48-$0.50 range. A stronger move may eventually open the path toward a retest of the recent high near $0.55.
For now, Worldcoin’s ability to maintain this support level remains one of the most closely monitored developments among traders tracking the aftermath of the recent correction.

In March, when Meta announced plans to begin paying creators in USDC across Colombia and the Philippines, with expansion to more than 160 countries expected by the end of the year, the move was widely interpreted as another milestone for stablecoins entering the financial mainstream. A company responsible for nearly $3 billion in annual creator payouts choosing onchain settlement over traditional banking rails is unquestionably significant. What Meta introduced, however, was not a complete payments experience. It was a faster way to move money between accounts.
For many users, particularly in emerging markets, the difficult part begins only after the payment arrives. Stablecoins have largely solved cross-border digital settlement, but integration into local consumer financial systems remains uneven. That is precisely where the next phase of payments competition will be decided.
The real friction starts after settlement
Creators receiving USDC payouts from Meta must connect external wallets, choose a supported network such as Solana or Polygon and manage their own custody. Meta warns that funds sent to the wrong address or an unsupported chain cannot be recovered. From that point onward, the platform steps out of the transaction entirely.
The transfer itself is efficient. Settlement is near-instant, costs are negligible and cross-border movement is effectively frictionless compared to traditional banking rails. But a creator in Manila or Bogotá will often still need to convert USDC into local currency to participate fully in the local consumer economy. That means sending funds to an exchange or liquidity provider, passing compliance checks, selling into fiat and withdrawing through domestic banking infrastructure. Each step introduces fees, delays and operational friction that sit entirely outside Meta’s ecosystem. For a creator whose expertise is content, not crypto, that is a significant amount of complexity to navigate just to access their own earnings.
And this is where stablecoin payments reveal their structural limitations. The infrastructure optimizes settlement, while usability still varies significantly by market.
The choice of the Philippines and Colombia as pilot markets makes this tension even more apparent. Both countries combine strong creator economies with costly cross-border payment systems, where conversion and transfer fees can consume a meaningful share of smaller payouts. In the Philippines in particular, mobile wallet adoption is already deeply embedded in everyday commerce, supported by platforms such as GCash and Maya and reinforced by the arrival of tokenized payment services from global technology companies. These are precisely the kinds of markets where stablecoin payouts should have a compelling advantage. Yet the off-ramp infrastructure remains fragmented, with uneven liquidity, compliance requirements, fees and user experience across providers and jurisdictions.
Card rails are starting from the other end
Card networks have taken a different approach. Instead of starting with blockchain settlement and leaving conversion to the user, they have focused on embedding stablecoins into existing financial infrastructure.
Mastercard’s $1.8 billion acquisition of BVNK expands its stablecoin settlement capabilities across more than 130 jurisdictions, integrated into established reporting and compliance systems. Visa’s partnership with Bridge enables stablecoin-linked cards that allow users to spend digital dollar balances at any merchant that accepts Visa, with conversion handled in the background.
The distinction reflects a deeper architectural choice about where complexity should sit. In Meta’s model, a payout requires a multi-step journey through wallets, exchanges and withdrawal queues before it becomes spendable. While this lighter-touch approach may also reflect the regulatory and operational burden of directly offering fiat conversion and custody services across dozens of jurisdictions, the user is ultimately responsible for navigating the crypto layer. In the card network model, stablecoins exist entirely behind the scenes. Users never see USDC balances or manage blockchain networks. Fiat enters and exits the system as normal, while stablecoins handle settlement invisibly.
Both models use stablecoins in the settlement layer, but they differ significantly in how user-facing complexity is handled.
Where stablecoin adoption actually scales
Stablecoin transaction volumes reached $33 trillion in 2025, up 72 percent on the previous year, with institutional adoption continuing to accelerate. At this point, the question for the payments industry is no longer whether stablecoins will become part of global financial infrastructure – that shift is effectively underway – but whether the off-ramp layer can scale at the same pace as onchain settlement.
The systems that will ultimately scale are those that make blockchain infrastructure invisible to the end user. Stablecoins may sit in the middle of the stack, but the user experience will be defined entirely in fiat terms: pesos in a wallet, a card balance, or a payment accepted at checkout, with no awareness of the underlying rails.
This is where current implementations, including Meta’s, expose the industry’s remaining friction. By surfacing wallets, networks, and conversion steps directly to creators, they reveal the operational complexity that still sits beneath what is marketed as instant global payments. The infrastructure is efficient at settlement but fragmented at integration, reflecting an industry that has progressed faster in building onchain systems than at embedding them cleanly into existing financial workflows.
Meta has helped push the conversation forward, but the next phase of adoption will be defined less by transaction speed or blockchain throughput and more by seamless integration into the financial stack: card networks, banking apps and merchant terminals. In that end state, stablecoins will be present in the system but largely invisible to users. That work is already underway across the card networks; the platforms handling payouts will need to keep pace.


SpaceX is set to price the largest IPO in history next week, at a valuation near $1.77 trillion. Its own filings show a company that was profitable until the xAI merger turned it into a loss-making company.
The roadshow leans on artificial intelligence. The financial statements tell a more complicated story about what investors are actually buying.
The Valuation Rests on a Market that Barely Exists Yet
At $135 per share, the offering values SpaceX at roughly 94 times its 2025 revenue of $18.7 billion. Research firm Morningstar has called that close to twice fair value.
The filing pins most of the case on a $28.5 trillion total addressable market (TAM). AI accounts for $26.5 trillion of that figure, including $22.7 trillion in enterprise applications.
SpaceX describes the opportunity in unusually bold terms.
“We believe we have identified the largest actionable TAM in human history.”
What the document does not detail is how the company captures that market against Google, OpenAI, and Microsoft. Some analysts argue SpaceX is worth far less on current earnings.
The xAI Merger Flipped Profit into Deepening Losses
In 2024, before the deal, SpaceX earned $791 million in net income. After the all-stock xAI merger closed in February, the 2025 result swung to a $4.94 billion net loss.
The company then posted a $4.28 billion first quarter loss in 2026. Its accumulated deficit has reached $41.3 billion, and the AI unit alone lost $6.36 billion from operations last year.
Profitable launch services and Starlink are funding that buildout. The recent Anthropic compute deal and the new Google contract may ease the strain, though either party can cancel both on 90 days’ notice.
Supporters counter that Starlink remains highly profitable on its own and that the compute contracts add tens of billions in visible revenue.
They also point to the reusable-rocket record as evidence Musk delivers on hard targets.
Follow us on X to get the latest news as it happens
Strong Headline Numbers Hide Softer Trends
Starlink looks like the safest part of the story. Subscribers more than doubled to 10.3 million in the year to March 2026.
Per-user economics moved the other way. Average revenue per user fell about 23%, from $99 a month in 2023 to $66, as Starlink expanded into cheaper markets.
Governance adds another wrinkle. Musk holds about 42% of the equity but 85.1% of the voting power, and SpaceX will claim controlled-company status after listing.
The offering also reserves up to 30% for retail buyers, roughly triple a typical mega-IPO. That structure has raised investor questions before IPO about who absorbs shares from early backers.
None of this is hidden. The risks sit in the filing, alongside profitability rules that have already prompted index exclusion concerns.
The open question is whether $1.77 trillion is the right price for a company still proving its biggest segment.
The post What SpaceX Downplays in Its $1.77 Trillion IPO Filing appeared first on BeInCrypto.


America’s largest banks are preparing a direct response to one of crypto’s fastest-growing products: stablecoins.
JPMorgan Chase, Bank of America, Citigroup and other major lenders said Friday that they plan to launch a shared tokenized deposit network through The Clearing House by the first half of 2027. The project would allow bank deposits to move across blockchain infrastructure with round-the-clock settlement, giving traditional bank money some of the same capabilities that have helped stablecoins gain traction.
The move highlights the growing competition to become the preferred form of cash on blockchain networks.
“Following the GENIUS Act, a competition seems to be emerging between stablecoins, tokenized deposits and tokenized money market funds to become the preferred onchain cash instrument,” said Reid Noch, vice president of U.S. equity market structure at TD Securities.
Stablecoins, specifically Circle’s (CRCL) USDC and Tether’s USDT, currently dominate that market. The dollar-pegged tokens are widely used for crypto trading, cross-border payments and increasingly for savings products. But banks are concerned that if stablecoins become mainstream, deposits could migrate from traditional accounts into crypto wallets.
Tokenized deposits allow banks to bring customers onchain without losing control of their deposits. A customer’s bank deposit would be represented as a digital token that can move across blockchain rails. Unlike stablecoins, the funds would remain inside the banking system.
Noch said tokenized deposits address long-standing inefficiencies in global payments.
“Anyone who has ever wired money, especially internationally, knows the process can be expensive and often takes one or two business days to complete,” said Noch. By using blockchain infrastructure, tokenized deposits could allow near-instant transfers around the clock while reducing costs and settlement frictions, he said.
The initiative also signals how far blockchain technology has moved into the financial mainstream.
“The biggest banks in America are voluntarily coming onchain,” said Digital Chamber CEO Cody Carbone. “When the country’s largest institutions decide the future of finance runs on blockchain, they’re proving exactly what our industry has been building toward all along.”
Significant competition
Still, the banking industry’s approach differs sharply from crypto’s vision of open networks.
Noelle Acheson, author of “Crypto is Macro Now,” noted that banks have spent years experimenting with private blockchain systems that move money internally while maintaining strict control over users and transactions. The planned Clearing House network expands that model across multiple banks but remains far removed from public blockchain ecosystems where stablecoins circulate freely.
Acheson argued that the project demonstrates that banks are taking stablecoins seriously despite public comments from some executives, including JPM CEO Jamie Dimon, who downplayed the threat. While stablecoins offer greater liquidity and flexibility, she said many corporate customers may prefer a bank-backed system that fits within existing compliance frameworks.
In a report in March, Jeffries said it estimates that stablecoins could drive a 3% to 5% runoff in core deposits over the next five years and shrink average bank earnings by about 3%.
The outcome could reshape how money moves on blockchain networks.
If successful, the Clearing House initiative could emerge as a significant competitor to stablecoins for corporate payments and treasury operations. At the same time, it underscores a broader trend: traditional finance is increasingly adopting blockchain technology, even as it competes with crypto-native alternatives built on the same infrastructure.

Cryptocurrency For Beginners in Bengali | What is Cryptocurrency, Blockchain @ArijitChakrabortysongs
Teacher ‘pulled a sickie’ for Portugal stag do then ripped pages from passport

My Bullish Call On Bank Of America Aligns With Its Seeking Alpha Quant Rating (NYSE:BAC)


-

 Business5 days ago
Jade Biosciences, Inc. (JBIO) Discusses Positive Interim Results From JADE101 Phase I Healthy Volunteer Study and Development Plans Transcript
-

 Fashion24 hours ago
Weekend Open Thread: Evereve – Corporette.com
-

 Sports4 days ago
French Open 2026 results: Alexander Zverev beats Rafael Jodar and will play Jakub Mensik in semi-finals
-
 Crypto World1 day ago
Jensen Huang Approves Samsung, SK Hynix, and Micron for NVIDIA (NVDA) HBM4 Memory Supply
-

 Tech4 days ago
CryZENx Releases Fresh Playable Content Deep Inside Jabu-Jabu for His Ocarina of Time Remake
-

 Business4 days ago
Trump Taps Housing Chief Bill Pulte as Acting Intelligence Director After Gabbard Exit
-
Crypto World1 day ago
LBank Surpasses 25 Million Users Worldwide as AFA Partnership Continues to Drive Global Growth
-
 Crypto World4 days ago
Seagate (STX) Stock Surges to Record High on AI Boom and Legal Settlement
-
 NewsBeat4 days ago
Republicans balk at Trump’s attempt to appoint a MAGA enforcer to lead National Intelligence
-
Crypto World4 days ago
EU AI Data Center Project Faces Delays as Funding Gaps Grow
-

 Entertainment4 days ago
Did The Mandalorian And Grogu Already Ruin The Next Star Wars Movie?
-

 Tech1 day ago
RCS Messages Between iPhone and Android Get End-to-End Encryption With iOS 26.5
-

 Business4 days ago
Aehr Test Systems Stock Soars 17% Amid Surging AI Demand and Conference Spotlight
-

 Business4 days ago
Relay Therapeutics Shares Surge 20% on ASCO Momentum for Zovegalisib Breast Cancer Program
-
 Business4 days ago
Claude AI Down Today Reason: Why Anthropic’s AI is not working today? What’s the latest quota update
-

 Tech4 days ago
Instagram will stop bombarding teens with the same kind of obsessively unhealthy content
-
 Crypto World1 day ago
Merlin (MRLN) Stock Soars 32% on Major USSOCOM Autonomy Milestone
-
Crypto World5 days ago
Tether Brings Google’s TurboQuant to Production, Unlocking Long-Context AI on Everyday Devices
-

 Business4 days ago
Dow Jones Climbs Near Record Highs as AI Optimism Offsets Geopolitical Risks
-
 Entertainment4 days ago
‘Aliens’ Star Reveals How the US Military Co-Opted James Cameron’s Sci-Fi Tech [Exclusive]
You must be logged in to post a comment Login