

Crypto World
BloFin War of Whales 2026 Grand Prix opens registration for $5M trading championship

May 15, 2026, Press release – BloFin, a prominent global cryptocurrency exchange, has officially opened registration for its highly anticipated trading competition, the WOW (War of Whales) 2026 Grand Prix. Returning bigger and bolder than ever, this year’s edition boasts an extraordinary total prize pool of up to $5,000,000 USDT, exclusive luxury giveaways, and a groundbreaking new twist — for the first time, human traders will go head-to-head against AI in a battle to claim the title of the ultimate whale.
Under the rallying cry “Squad Up. Beat AI.”, WOW 2026 is set to become one of the most dynamic and forward-looking trading events of the year, bringing together crypto traders, elite squads, and algorithmic challengers worldwide.

Four thrilling competition formats, one epic trading season
This year’s WOW Grand Prix offers participants multiple distinct ways to compete and win big. The formats include the Trading Competition (Futures), Treasure Box Prize Hunt, Lucky Spin Draw, and Grand Lotto Giveaway — alongside the brand-new Human vs AI Showdown, where traders are challenged to outperform BloFin’s AI-driven benchmarks for a share of bonus prize tiers.

Throughout the competition window, traders can engage in team battles, climb individual leaderboards, unlock random rewards, spin their way toward exclusive prizes, and prove that human intuition still has an edge over the machines — creating a truly immersive next-generation trading experience.
Scaling prize pool — up to $5,000,000 USDT
The prize pool for the WOW 2026 Grand Prix is designed to scale with total trading volume milestones, starting at a base reward tier and expanding to a massive $5,000,000 USDT as community trading volume grows. The more participants trade, the larger the total prize pool becomes for everyone.
The prize distribution is structured as follows:
- 40% — Team Competition (by Trading Volume)
- 20% — Team Competition (by PNL %)
- 25% — Individual Competition (by Trading Volume)
- 15% — Individual Competition (by PNL %)
Additional top-tier rewards include a marquee luxury grand prize for the top-performing team and premium giveaways for individual champions across the leaderboards.
Introducing the WOW 2026 PNL Card — Now AI-Enhanced
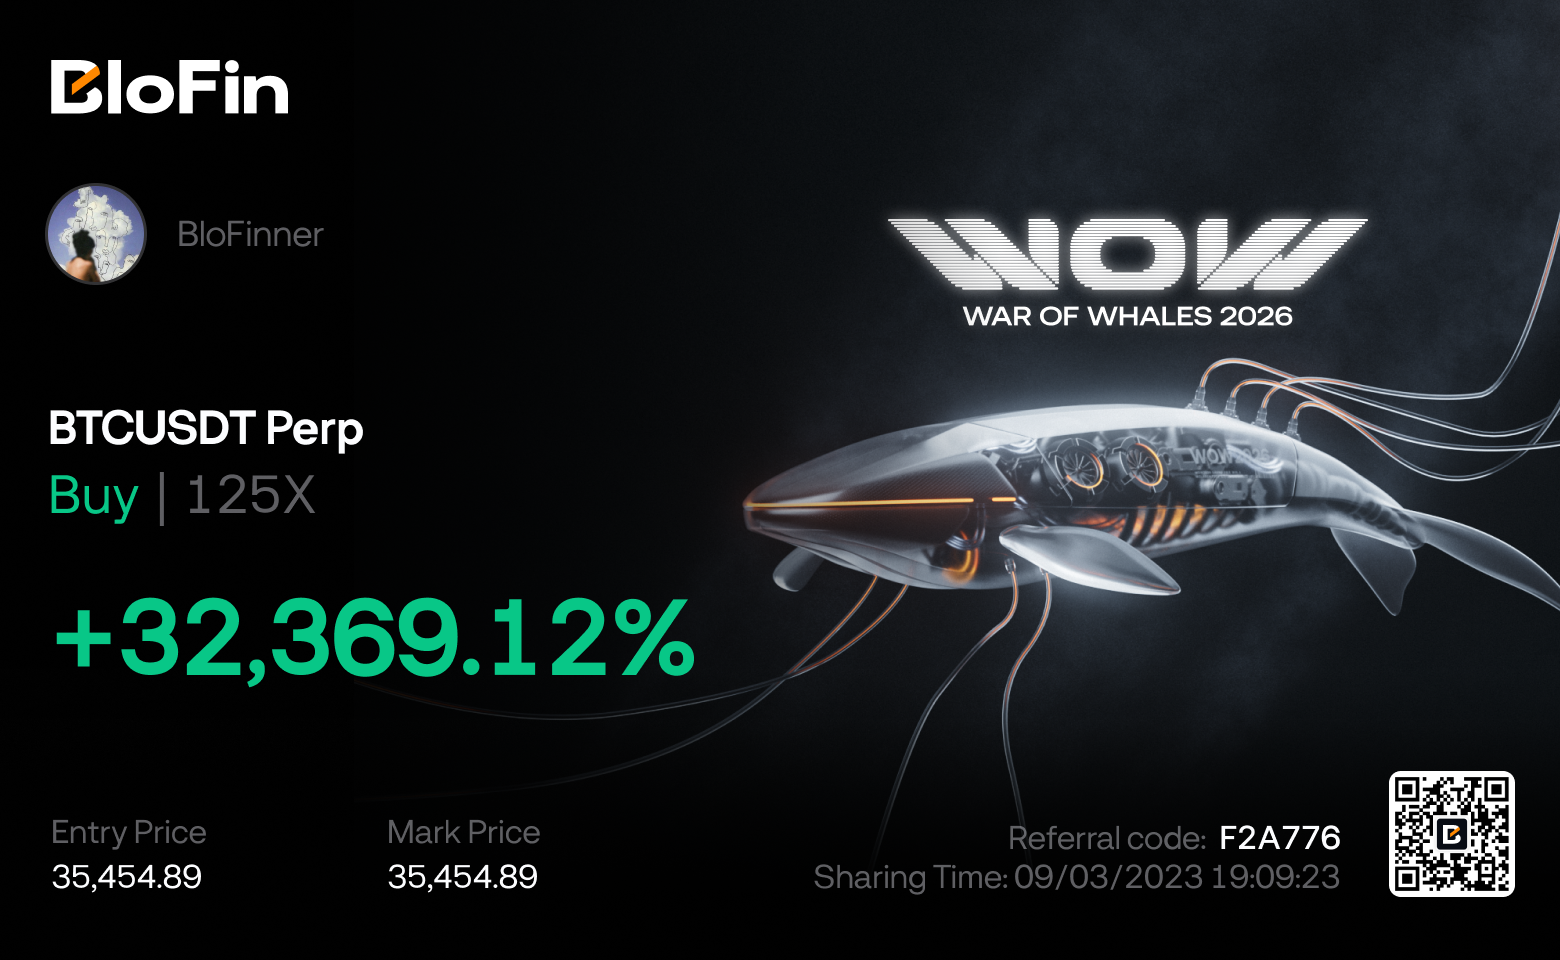
Building on last year’s success, BloFin is unveiling the next evolution of the WOW (War of Whales) 2026 PNL Card — a distinctive digital emblem crafted for elite competitors. Inspired by the cyber-themed aesthetic of the WOW Grand Prix and infused with this year’s AI-versus-human narrative, this limited-edition PNL Card serves as a personalized record of each trader’s performance throughout the competition.
Participants can proudly display their achievements, track their battle stats, showcase their Human vs AI scorecards, and share their milestones within the crypto trading community.
Registration now open
Registration for the WOW 2026 Grand Prix is now open. Team leaders can create squads, and users are encouraged to join early to maximize their competitive edge before the trading window begins.
About BloFin
BloFin is a top-tier cryptocurrency exchange that specializes in futures trading. The platform offers a wide range of trading options, including 550+ USDT-M perpetual pairs, Coin-Margined Perpetual Contracts, spot trading, copy trading, API access, unified account management, and advanced sub-account solutions. Committed to security and compliance, BloFin integrates Fireblocks and Chainalysis to ensure robust asset protection. By partnering with top affiliates, BloFin delivers scalable trading solutions, efficient fund management, and enhanced flexibility for professional traders. As a constant sponsor of TOKEN2049, BloFin continues to expand its global presence, reinforcing its position as the place “WHERE WHALES ARE MADE.”
Media contact:


TLDR
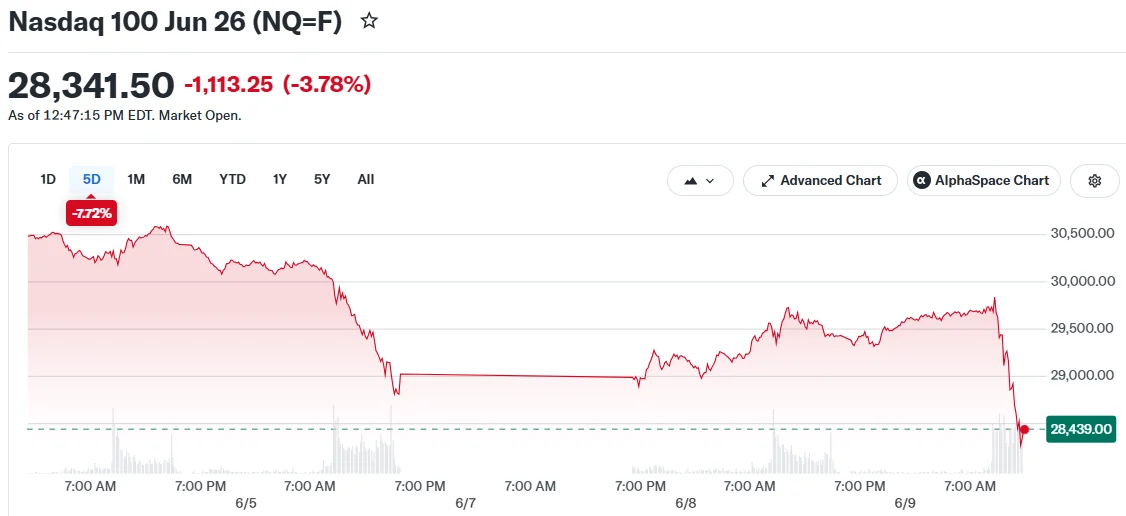
- The Nasdaq experienced a sharp 3% decline driven by widespread selling in AI and chip stocks
- Intel shares retreated over 4% following a recent surge linked to potential Alphabet partnership
- Brent crude plummeted more than 4%, approaching the $90 threshold
- Market speculation intensifies around a potential OpenAI public listing
- Nuvalent shares soared on M&A speculation in the biotech sector
The Nasdaq experienced a sharp downturn, tumbling approximately 3% during one of its most challenging trading sessions in weeks. The selloff primarily targeted semiconductor manufacturers, artificial intelligence infrastructure providers, and high-growth technology names that had previously dominated market gains throughout the year.
The downturn arrived following an extended period of gains in artificial intelligence-related equities that drove valuations to elevated levels. Many market participants opted to realize gains instead of maintaining exposure amid growing uncertainty.
Broader market indices experienced significant pressure as well. The concentration of capital in a limited number of technology giants created vulnerability across major benchmarks when investor sentiment reversed course.
Intel Reverses Course Following Alphabet Manufacturing Speculation
Intel shares declined more than 4% after experiencing a recent uptick based on speculation that Alphabet might utilize its foundry operations for producing next-generation AI processors. Market participants had interpreted this development as a potentially significant milestone for Intel’s efforts to restore its manufacturing competitiveness.
The reversal demonstrates the volatility inherent in technology equities when overall market sentiment deteriorates. Market observers continue monitoring whether Intel can secure major client relationships and narrow the competitive divide with Taiwan Semiconductor Manufacturing.
Crude Oil Tumbles Toward $90 Benchmark
Brent crude experienced a decline exceeding 4%, drifting toward the $90 per barrel level. The downturn materialized as anxieties surrounding Middle Eastern supply interruptions diminished.
The retreat in oil prices provided a boost to airline equities, given that fuel expenses represent their largest operational cost. Conversely, energy sector companies encountered selling pressure as earnings forecasts were adjusted downward.
The shift also refocused attention on inflation dynamics. Reduced energy costs could potentially alleviate some inflationary pressures that have challenged markets throughout the current year.
OpenAI Public Offering Speculation Intensifies
OpenAI continues operating as a privately held entity, yet speculation surrounding a potential public market debut attracted increasing attention. The organization responsible for ChatGPT has emerged as one of the artificial intelligence sector’s most prominent players.
A potential public offering would likely represent one of the most highly anticipated technology market debuts in recent memory. Investors continue analyzing what implications a publicly traded OpenAI might hold for valuations throughout the artificial intelligence ecosystem.
Nuvalent Rallies on Buyout Speculation
Biotechnology company Nuvalent emerged as one of the session’s standout performers. Shares jumped sharply following acquisition-related developments that captured investor attention and fueled speculation regarding merger activity within the biotechnology sector.
The surge highlighted a broader pattern of investors exploring opportunities beyond saturated technology positions. Healthcare and biotechnology equities have underperformed relative to the AI-driven market rally, positioning them as compelling alternatives for investors pursuing fresh opportunities.
The Nuvalent advance underscored that merger and acquisition activity continues serving as a critical catalyst for returns in healthcare, particularly for smaller-cap companies possessing robust product development pipelines.

Crypto World
Kalshi perpetual futures trading ‘perps’ crosses $1 billion in volume within a week of launch
Kalshi’s logo appears on a smartphone placed on a reflective surface, with a blurry betting curve projected in the background in Creteil, France, on March 9, 2026, during a major scandal and $54 million lawsuit concerning bets related to recent strikes in Iran.
Nurphoto | Nurphoto | Getty Images
Prediction market platform Kalshi’s perpetual futures have already crossed $1 billion in trading volume within a week of their launch last week, the company shared exclusively with CNBC.
The company officially launched trading on crypto perpetual futures, or “perps,” on Wednesday, and in the first 24 hours saw more than $100 million in volume.
Perps are futures contracts with no expiration date that allow traders to speculate on a price without owning the underlying asset. Contracts track the price of an asset continuously, with funding payments keeping the perpetual contract price aligned with the market.
The asset class has over $90 trillion in annual global volume, according to Bank of America, but before Kalshi there wasn’t a way to trade the contracts in the U.S.
(Kalshi CEO Tarek Mansour will make an appearance on CNBC’s “Fast Money” on Tuesday at 5 p.m. ET.)
Kalshi received regulatory approval from the Commodity Futures Trading Commission on May 29 to be the first company in the U.S. to offer perp contracts. Coinbase on the same day also received approval from regulators to offer its U.S. traders access to global perp contracts through an affiliate.
Pent up domestic demand has been reflected on Kalshi since the launch. A spokesperson said that at one point the waitlist to access perps on the platform had more than 1 million people on it, and that it’s the fastest growing product in the company’s history. It took Kalshi 40 months to see $1 billion in trading volumes across its event contracts.
Perpetuals marked the company’s biggest product launch since it first launched its prediction markets.
Disclosure: CNBC and Kalshi have a commercial relationship that includes customer acquisition and a minority investment.


Key takeaways
- Stellar (XLM) remains under pressure despite a modest rebound following last week’s sharp correction.
- Derivatives data shows a bearish bias, with long-to-short ratios below 1 and funding rates turning negative for the asset.
Stellar (XLM) remained under pressure on Tuesday despite staging a modest recovery following last week’s steep market-wide correction.
Weak derivatives positioning and mixed on-chain signals suggest that recent gains may be corrective rather than the start of a sustained bullish reversal.
Market data indicates traders continue to favor downside exposure, reinforcing a cautious outlook for both assets.
Derivatives markets signal growing bearish sentiment
Recent derivatives data from CoinGlass points to increasing pessimism among traders. The long-to-short ratio for XLM fell to 0.73 on Tuesday, approaching its lowest readings in more than a month.
A ratio below 1 indicates that short positions outweigh long positions, highlighting expectations for further price declines.
The bearish bias is further reflected in funding rates. XLM’s funding rate turned negative on Monday and continued trending lower into Tuesday.
Negative funding rates indicate that short sellers are paying long-position holders, a sign that traders are increasingly positioning for downside movement.
CryptoQuant’s market summary data presents a mixed but slightly negative outlook for XLM. Data shows elevated activity across both spot and futures markets, with increased retail participation and buy-side dominance.
While rising buying activity may seem positive, overheated market conditions often precede short-term pullbacks, limiting the potential for a sustained recovery.
Stellar price forecast: Momentum begins to fade
Stellar is trading near $0.195 on Tuesday, holding above its 50-day and 100-day EMAs at $0.182 and $0.179, respectively.
While this positioning supports a neutral-to-slightly bullish short-term outlook, XLM continues to face resistance at the 200-day EMA near $0.198.
Technical indicators suggest momentum is cooling. The RSI sits near 45, indicating balanced market conditions. The MACD has slipped below the zero line, signaling weakening bullish momentum and raising the risk of another downside move if buyers fail to regain control.
If the rally resumes, immediate resistance lies at the 200-day EMA at $0.198, with the next upside target at $0.226

However, if the sellers stay in control, initial support is seen at $0.185, with the next level at the 50-day EMA at $0.182.
A daily candle close below these levels would expose lower support zones at $1.79 and $1.43.

Ethereum News: ETH Price is trading at $1,691, clawing back from a June low near $1,505 but still pinned below the resistance zone that has capped every rally since April.
BitMine Immersion Technologies just executed its largest weekly Ethereum accumulation of 2026, 126,971 ETH added during the dip, yet the MACD remains deeply negative, and the Aroon Oscillator screams seller control.
Two forces are directly opposed. One of them will break.

Discover: The Best Crypto to Diversify Your Portfolio
Ethereum News: BitMine’s $9 Billion Bet: Largest Weekly ETH Buy of 2026
BitMine Immersion Technologies purchased 126,971 ETH during last week’s weakness, its single largest weekly Ethereum accumulation of 2026.
That buy lifted its total corporate treasury holdings to 5,543,872 ETH, equal to approximately 4.59% of Ethereum’s estimated circulating supply.
The position is valued at ~$9.04 billion using a reference price of $1,630. Of that total, 4,718,677 ETH is actively staked.
BitMine Chairman Tom Lee reported annualized staking revenue now projected at $230 million, a yield-generating angle that separates this corporate treasury strategy from pure spot accumulation plays like Strategy’s Bitcoin model.
The scale of the Ethereum accumulation positions BitMine as a structural whale in the market. Buying 126,971 ETH at a declining price is a deliberate averaging-down strategy, one that signals conviction in the longer-term value even as near-term charts argue against it.
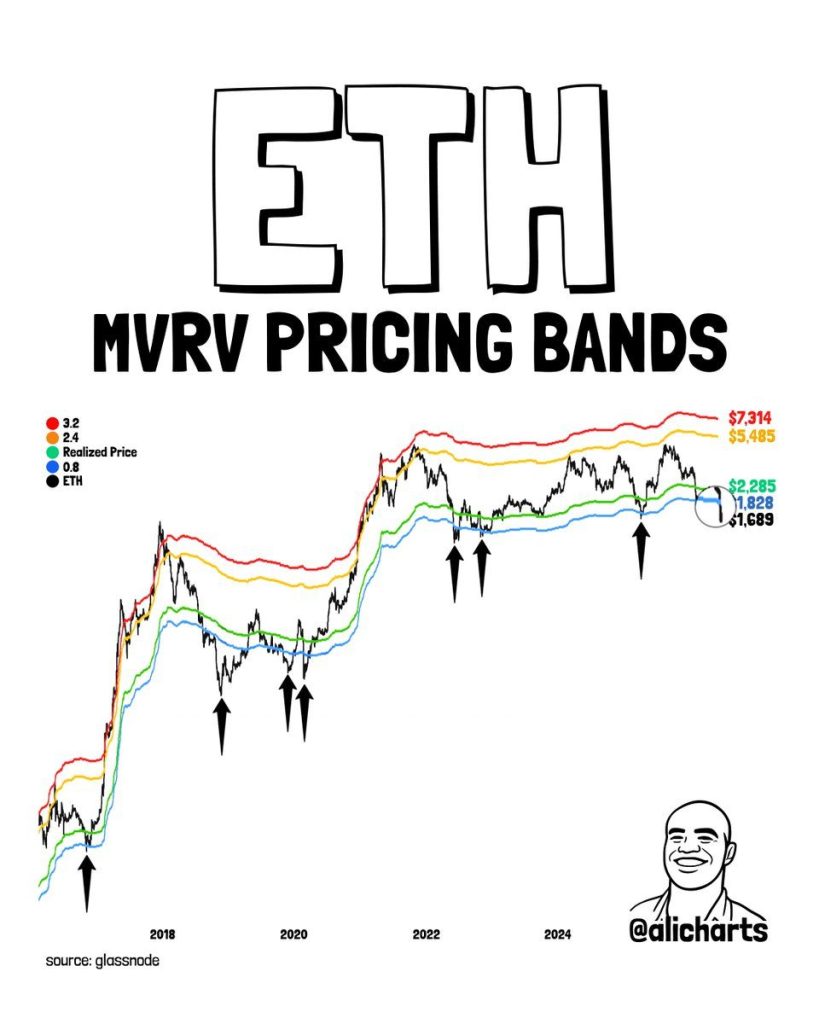
Analyst Ali Martinez offered supporting evidence from on-chain data, noting that ETH trading below the 0.8 market-value-to-realized-value band has historically flagged accumulation zones and that a TD Sequential buy signal flags potential seller exhaustion.
That said, corporate treasury demand has not reversed structurally bearish setups before in this cycle. BitMine bought aggressively during the earlier 2026 corrections, too, and sellers reasserted control each time.
$1,500 or $2,000: The Levels That Decide the Next Move
ETH holds $1,650 support, closes convincingly above $1,715 on sustained volume, and ETF inflows follow through after the June 8 reversal day. That sequence opens the path to $1,875 first, then the $1,900 to $2,000 resistance cluster. A clean break above $2,000 begins to repair market structure and brings the weekly 200 MA at $2,471 into view as a longer-term target.
If conflicting signals persist, corporate accumulation absorbing ETF outflow sell pressure without a decisive move in either direction, ETH consolidates between $1,500 and $1,700. US CPI data becomes the macro catalyst that determines whether the range breaks up or down.
Failure to hold $1,650 sends sellers back to the June low at $1,505. A weekly close below $1,500 triggers the scenario Ash Crypto outlined. Below that level there is no established support shelf until $1,000 to $1,100. Volume data from the recent sell-off suggests that the breakdown would not be gentle.
The weight of evidence currently favors the base case, trending toward bearish resolution. MACD negative. Aroon deeply in seller territory. ETF outflows were dominant through most of June. On-chain profitability at multi-year lows. BitMine’s Ethereum accumulation provides a real demand floor, but it has not been enough to flip the technical picture yet.
BitMine holds 4.59% of Ethereum’s supply and stakes nearly all of it, generating $230 million in projected annual revenue. That conviction is either the smartest institutional trade of the cycle or a painful averaging-down exercise. The answer depends entirely on whether $1,500 holds.
Watch the weekly close. That is the only level that matters right now.
Discover: The Best Token Presales
The post Ethereum Price Halts Near $1,700 as BitMine Fires Huge ETH Buy At Bears appeared first on Cryptonews.
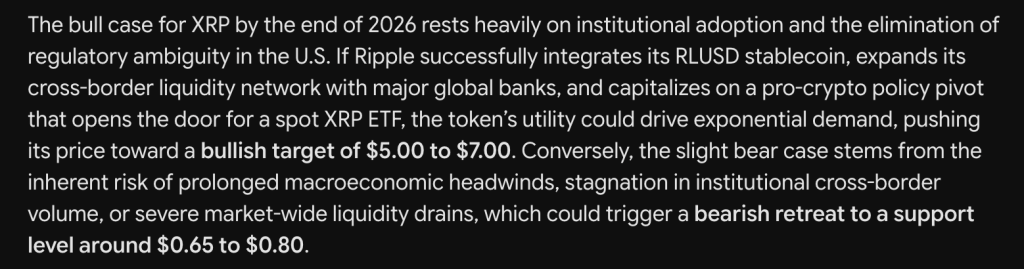
Google Gemini AI just put XRP on the map again with a price prediction target of $5.00 to $7.00 by the end of 2026. With XRP changing hands near $1.16 right now, that is a 4x to 6x call on a coin most holders had written off.
The bull case hangs on two big pillars, institutional adoption and the death of regulatory ambiguity in the U.S. If Ripple pulls off a clean RLUSD stablecoin integration, expands its cross-border liquidity network with major global banks, and rides a pro-crypto policy pivot that cracks open the door for a spot XRP ETF, demand could go vertical.

That kind of real utility flowing into the token is what drives the push toward $5.00 to $7.00. It is a story built on XRP finally being used at scale, not just traded.
The bear case is a softer landing, not a wipeout. If prolonged macro headwinds drag on, institutional cross-border volume stalls out, or a market wide liquidity drain hits, XRP could slide back toward the $0.65 to $0.80 support level.
That is the zone where the thesis cools off and patience gets tested. Still, even that downside is shallow compared to the size of the upside if the utility story plays out the way the bulls expect.
XRP Price Prediction: When Utility Finally Outruns The Charts
XRP price is on the daily and price sits at $1.16 after a long bleed from the $3.65 top set last July.
The structure is a textbook downtrend, a steady run of lower highs and lower lows that just carved a fresh local low near $1.04.
Pattern wise this is a descending channel, and price is now trying to put in a small bounce off that low.
Key support sits right here at $1.10, with the next shelf near $1.00 and major demand back at $0.80. Resistance stacks at $1.40, then $1.60, and the heavier zone at $1.80.
RSI is reading 33.35 with its signal line at 32.05. So momentum is sitting just above its average and crawling up out of oversold.
That tight gap of about 1.3 points with RSI back over the signal is an early sign the selling is drying up. A clean push above the 40 zone would confirm buyers are stepping back in.
Tie it together and the chart is beaten down hard, exactly the kind of base the prediction wants before any 4x dream. Reclaim $1.40 and the road toward $5.00 starts to look a little less wild.
Here is Why Gemini AI Prediction For LiquidChain is Bullish
Cycles do not reward patience at resistance. They reward positioning before the move.
Bitcoin, Ethereum, and XRP are all testing the same bands they have been stuck under for weeks. The macro catalyst is always one data print away. The institutional inflows are always one quarter away. The ceiling is visible, it is not moving, and everyone sitting in large caps waiting for a breakout is waiting on a decision that belongs to someone else.
Early stage infrastructure operates in a different reality entirely. Capital that would not move Bitcoin’s price by a single percentage point can reprice a small cap project dramatically. The opportunity exists in the gap between what something is genuinely worth and what the market has assigned it so far. That gap is only available while the project remains undiscovered. Discovery closes it permanently.
Multi-chain fragmentation has been extracting value from DeFi users since the first bridge launched and nothing has fixed it. Bitcoin, Ethereum, and Solana were built as separate systems with no shared architecture and no native interoperability. Every transaction that crosses those boundaries pays for that design decision in fees, slippage, and execution failures. Bridges did not solve the problem. They monetized it.
LiquidChain removes the problem entirely. All 3 networks collapse into a single execution layer where developers deploy once and users interact across every ecosystem without absorbing a cross-chain tax on every move.
ChatGPT AI has flagged it as a project worth watching. The presale is at $0.01454 with just over $820,000 raised.
Execution risk is real. Adoption is unproven. Established assets offer a smoother ride toward a ceiling that is already fully priced. LiquidChain is a seat at a table that has not been set yet.
Explore the LiquidChain Presale
The post Nobody Wants To Admit Google Gemini AI Might Be Right About XRP Price Prediction appeared first on Cryptonews.

Bitcoin (BTC) slipped to week-to-date lows as markets opened on Tuesday, with traders eyeing the $65,000 region as the threshold bulls must clear to regain momentum. The early session underscored a cautious mood ahead of the key US inflation print, as BTC hovered near notable support levels.
Data from TradingView showed BTC down about 1.2% on the day, after a double rejection near $64,200 set the stage for another test of the $60,000 area. The persistent struggle at the $65,000 mark has kept bulls on the back foot even as the broader market awaits new cues.
Key takeaways
- 65k hurdle remains critical for bulls: A break above $65,000 could trigger a renewed rally toward the $72,000–$74,000 zone, according to well-known market analyst Michaël van de Poppe.
- Bear-market patterns resurface: Analysts note BTC has already fallen through or near several classic bear-market markers, including the 50-month exponential moving average and a triangle support pattern, echoing characteristics seen in 2018 and 2022.
- Macro backdrop softens near-term mood: Oil markets moved lower as Iran peace momentum reemerged, while US indices traded higher in early action, underscoring a mixed macro backdrop for risk assets including crypto.
- Last week’s macro low remains a reference point: Traders highlight the bound near $59,100 as part of the ongoing debate about how much further downside is possible in the current cycle.
- Oil volatility and crypto correlations: WTI crude slipped below $88 per barrel, marking a June-like low, while equities opened with gains, illustrating the complex, sometimes divergent, macro forces shaping crypto sentiment.
BTC price action: bear-market echoes and key levels
Bitcoin’s Tuesday session unfolded with selling pressure building ahead of a fresh read on inflation data in the United States. A 1.2% drop on the day left BTC testing the lower boundary of the recent range, with a notable rejection at about $64,200 raising the risk of a test of the critical $60,000 support floor.
Analysts have been weighing the implications of the current price action against historical bear-market pathways. Michaël van de Poppe, a trader and analyst known for his market theses, emphasized that breaking the $65,000 barrier is essential for shifting the momentum back in favor of the bulls. “Bitcoin is stalling beneath $65K; breaking that level would trigger a strong run to $72K–$74K,” he explained, underscoring the level’s role as a resistance pivot after a February decline.
“The $65K support level was the previous level of support after the crash early in February and is now acting as the resistance to break through.”
Another influential voice in the space, Rekt Capital, drew comparisons between the present pattern and past cycle bottoms. He pointed to two hallmarks—loss of the 50-month EMA and a breach of a triangle support—that occurred in 2018 and 2022. “Now Bitcoin needs to fully confirm this breakdown to enter additional Bearish Acceleration to the downside,” he remarked in a recent update. The broader takeaway is that the market is watching for a decisive move beyond a few pivotal levels before signaling a durable trend reversal.
Those watching the macro landscape note that last week’s dip to around $59,100 remains a point of reference. While some participants view the recent selloff as irrational by some measures, the current setup suggests that traders will seek a clear breakout—above $65,000 or below the lower bounds of the nearby range—to confirm the next phase of the cycle.
Macro backdrop: oil moves, Iran peace momentum and market timing
In contrast to the crypto market’s tug-of-war, traditional markets opened with a cautious tilt, as the S&P 500 and Nasdaq rose by roughly 1% in early trading. The broader mood was tempered by ongoing macro narratives, including calls for peace in broader geopolitical tensions and the related impact on energy markets.
Oil prices moved notably lower in early trade, with WTI crude slipping under $88 per barrel and hitting its lowest level since late May. The move came as Iran peace momentum re-entered the market narrative, contributing to a volatile energy backdrop that can ripple through risk assets, including crypto, in the near term.
Market chatter also drew on a widely reported quote attributed to former US President Donald Trump, who was described by Al Jazeera and other outlets as saying that “It’ll happen very soon, and oil prices will come tumbling down” in a tele-rally focused on a Republican candidate. While the tone underscored hopes for easing energy costs, the immediate market reaction remained nuanced, with equities rising while crude prices retreated.
The confluence of these macro threads—energy-price moves, inflation expectations, and geopolitical headlines—helps explain why BTC’s price action continues to contrast with pockets of risk-on appetite in traditional markets.
Looking ahead, traders will be watching how BTC behaves around the $65,000 threshold and whether the 50-month EMA can stabilize or give way to further downside. The upcoming inflation print remains a key catalyst, with market participants parsing the central bank signal as part of a broader assessment of risk assets. As always in crypto, the next moves will hinge on the balance of technical confirmations and macro developments.
Readers should keep an eye on whether BTC can reclaim $65,000 and establish a convincing higher-low, while also monitoring whether the oil and inflation narrative supports a broader risk-on tilt or keeps the market in a cautious, data-driven posture.


Key takeaways
- WLD is down by more than 3% in the last 24 hours and could dip lower in the near term.
- Derivatives metrics remain supportive, with WLD’s Open Interest rising steadily alongside a mildly growing number of long positions.
Worldcoin (WLD) has declined by more than 3% on Tuesday, trading below $0.50 while holding above a cluster of key Exponential Moving Averages (EMAs).
Strengthening derivatives activity and favorable technical indicators suggest the token may have room to extend its recent recovery in the near term.
Rising open interest signals growing market confidence
Data from CoinGlass shows that Worldcoin futures Open Interest (OI) has climbed to $406.86 million, up from $377.25 million recorded on Sunday.
The metric has been trending higher since mid-May, indicating fresh capital is flowing into the market.
An increase in OI is typically viewed as a sign of growing trader participation and can reinforce ongoing price trends. In WLD’s case, the surge suggests investors are increasingly positioning for additional upside.
Adding to the bullish narrative, CoinGlass data shows the WLD long-to-short ratio has recovered to 1.01.
A reading above 1 indicates that long positions slightly outnumber shorts, reflecting a market bias toward higher prices. Continued improvement in this ratio could further strengthen bullish sentiment.
Despite the positive derivatives backdrop, some cautionary signals are emerging. According to CryptoQuant’s market summary data, both spot and futures markets are experiencing elevated retail participation and increasingly heated trading conditions.
The data also points to sell-side dominance, suggesting profit-taking activity could limit the pace of any further gains.
These factors may create short-term headwinds even as broader sentiment remains constructive.
Worldcoin price forecast: Bulls defend key support levels
Worldcoin was trading near $0.509 at the time of writing, maintaining a bullish technical structure above a dense cluster of EMAs.
The 23.6% Fibonacci retracement level near $0.504 has emerged as immediate support, sitting just below the current market price.
Meanwhile, the 50-day, 100-day, and 200-day EMAs remain beneath the market, providing a strong support zone stretching from the upper-$0.30 range to the mid-$0.40 area.
Momentum indicators continue to favor buyers. The Relative Strength Index (RSI) stands near 53, indicating strong bullish momentum while remaining below overbought levels.
The Moving Average Convergence Divergence (MACD) indicator remains in positive territory, signaling that upward momentum is still intact.
If the downtrend continues, immediate support lies at $0.459 (200-day EMA). A daily candle close above this level could expose WLD to lower levels at the mid-$0.30 area near the 100-day and 50-day EMAs
However, if the rally resumes, initial resistance lies at $0.567, with the next target at $0.676 (38.2% Fibonacci retracement).

Worldcoin’s improving derivatives metrics, rising Open Interest, and bullish technical setup continue to support a positive near-term outlook.
While elevated retail participation and selling pressure warrant caution, maintaining support above the $0.50 region could pave the way for a move toward the $0.567 and $0.676 resistance levels in the sessions ahead.
Crypto World
Bitcoin falls back to $61,000 amid broader market bloodbitcoin falls back to $61,000 amid broader market bloodbathath


Higher by more than 1% at the open, the Nasdaq has turned decidedly lower just ahead of the noon hour on the East Coast, now down 1.9% and below its close on Friday.
The S&P 500 is off by 1% and the DJIA is down 0.5%.
Declines are being led by AI favorites like Nvidia, Intel, and Micron, all lower by 2%-4%.
The drop can’t be blamed on Middle East tensions as crude oil is at a session low, down 4% to $87.58 per barrel. Gold and silver are also taking part in the quick dive, each dropping more than 2% over roughly the past hour.
Bitcoin (BTC) is also near its session low at $61,300.
With the AI trade leading losses, bitcoin miners turned AI infrastructure players are all sharply lower. Hut 8 (HUT) is down 6.3%, MARA Holdings (MARA) 4.9%, and IREN (IREN) 8%.


BlackRock is closely watching Wednesday’s May U.S. inflation report for the first clear signal of how the U.S.-Iran conflict is feeding into already sticky prices.
“We look to May U.S. inflation figures for a clearer read on how the Mideast conflict energy shock is impacting already sticky inflation. The full breadth of the shock has yet to show and will depend on how it evolves,” BlackRock Investment Institute said in its weekly market commentary.
The U.S. consumer price index (CPI) for May is scheduled for release on Wednesday at 08:30 am ET. Economists polled by Reuters forecast that the CPI jumped 4.2% year-on-year, the sharpest increase since April 2023 and up from 3.8% in April.
The expected acceleration would mark another reminder that inflation remains stubbornly above the Federal Reserve’s 2% target, reinforcing the prospect that the Fed’s next move could be an interest rate hike rather than cuts, as markets were expecting early this year.
Higher borrowing costs typically disincentivize investing in risk assets, including cryptocurrencies. In other words, the expected CPI increase could add to bearish pressure in the crypto market. Bitcoin has already taken a beating last week, falling nearly 14% to under $60,000.
A major risk factor, according to BlackRock, is the possibility of a prolonged closure of the Strait of Hormuz stretching into July. Such a disruption would push the energy shock into the forefront of inflation dynamics, especially as U.S. oil inventories could fall to their lowest levels in four decades.
“We think a prolonged closure of the Strait of Hormuz into July could bring the impact of the shock to the fore more prominently, especially as U.S. oil inventories potentially hit four-decade lows,” the firm said.
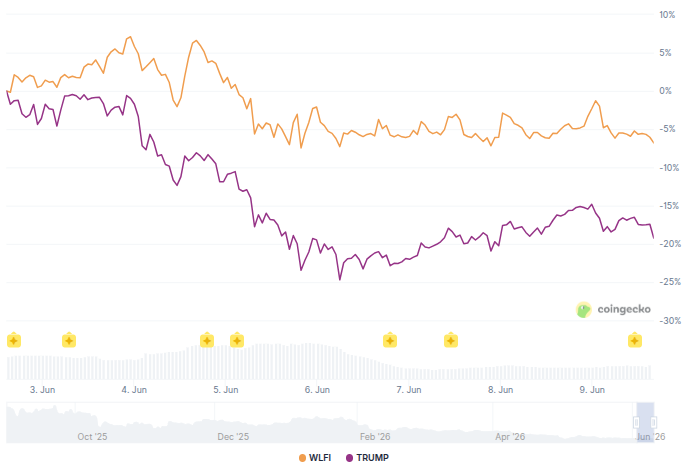
The Trump crypto empire generated estimated profits of $2.3 billion as affiliated projects expanded across digital assets and attracted significant investor participation.
At the same time, losses reported among outside buyers reignited debate about risk, influence, and accountability in crypto.
What Powered Trump’s Crypto Empire
The Trump crypto empire developed around a strategy that combined political visibility, brand licensing, and rapid expansion into digital assets. Unlike traditional business models, several ventures required little direct capital while creating large financial upside.
The largest contributor was World Liberty Financial, the family’s flagship decentralized finance project. The structure reportedly granted Trump-linked entities a 75% percent share of token sale proceeds.
Follow us on X to get the latest news as it happens
World Liberty Financial raised approximately $1.4 billion through the sale of 30 billion governance tokens. After expenses, estimates suggest nearly $987 million flowed to the family. Additional sales involving roughly three billion more tokens may have pushed total proceeds above $1.4 billion.
Analysts cited by Reuters noted that early token sales and exchange activity were unusual for a project at that stage, raising questions about insider selling patterns.
The second major source was the TRUMP meme coin. Blockchain analysis estimated total sales at roughly $1.2 billion. Based on estimated allocations and marketing influence, family-related proceeds may have reached approximately $616 million.

Two additional public market vehicles expanded the ecosystem. ALT5 Sigma, later renamed AI Financial Corp., reportedly purchased more than $700 million in World Liberty Financial tokens, directing over $500 million toward Trump-linked entities.
American Bitcoin became another contributor. Trump family members reportedly received ownership stakes without direct purchase costs. By late April, Eric Trump’s position alone was valued at more than $70 million.
Another report also reveals that the Trump Family’s gains outperform major industry players, including Coinbase ($2.1 billion), IREN Ltd., and BlackRock, while far exceeding those posting losses, such as Galaxy Digital.

Why Investors Experienced the Opposite Result
While profits expanded rapidly, investor outcomes moved in the opposite direction: World Liberty Financial buyers accumulated estimated losses approaching $674 million. A significant portion of early holdings remained restricted, resulting in accounting values close to zero until unlock periods.
TRUMP meme coin investors also suffered substantial declines. Buyers entered aggressively during peaks that reached approximately $75 per token.
By late April, the token traded near $2.38, contributing to estimated investor losses of more than $700 million. While early large traders captured gains, many smaller participants remained exposed to the downside.
Public companies connected to the ecosystem also declined sharply. ALT5 Sigma fell from more than $9 to approximately $75 cents. American Bitcoin dropped from around $11 to near $1.15 by late April. Combined investor losses across those vehicles exceeded $875 million.

Supporters describe the strategy as efficient entrepreneurship supported by disclosed risks. Critics argue that the timing, influence, and regulatory environment raise broader questions about conflicts of interest.
Regardless of interpretation, the Trump crypto ventures illustrate how political reach, media attention, and digital assets can generate extraordinary outcomes for both winners and losers.
The post Trump Family Cashes in $2.3 Billion from Crypto Empire, While Investors get Crushed appeared first on BeInCrypto.

Seattle slips in ranking of best U.S. cities for foreign investment, fueling concerns about business climate

money money green green #shorts #ibispaintx #capcut #kinitopet #trend #moneymoneygreengreen #art

York Irish bar The Dubliner expansion plans approved


-

 Fashion4 days ago
Weekend Open Thread: Evereve – Corporette.com
-
 Crypto World4 days ago
Jensen Huang Approves Samsung, SK Hynix, and Micron for NVIDIA (NVDA) HBM4 Memory Supply
-

 Sports7 days ago
French Open 2026 results: Alexander Zverev beats Rafael Jodar and will play Jakub Mensik in semi-finals
-

 Business7 days ago
Trump Taps Housing Chief Bill Pulte as Acting Intelligence Director After Gabbard Exit
-

 Crypto World2 days ago
Anatomy of the June crypto crash: Fed, Iran, Saylor
-
 NewsBeat7 days ago
Republicans balk at Trump’s attempt to appoint a MAGA enforcer to lead National Intelligence
-
 Crypto World3 days ago
Senator Cynthia Lummis Calls CLARITY Act the Most Consequential Financial Legislation of This Generation
-
 Business3 days ago
The Pain Points Taking a Fragile Tech Rally Down a Notch
-
 Entertainment3 days ago
The Best Mystery Series of All Time Is Surging on Streaming 30 Years After It Ended
-

 Tech4 days ago
Microsoft launches MXC, an OS-level sandbox for AI agents, with OpenAI and Nvidia already on board
-

 Tech2 days ago
Microsoft unveils seven homegrown AI models in new bid for ‘long term self-sufficiency’
-

 NewsBeat2 days ago
Alexander Zverev wins the French Open to finally earn a 1st Grand Slam title
-
Crypto World4 days ago
LBank Surpasses 25 Million Users Worldwide as AFA Partnership Continues to Drive Global Growth
-

 Business7 days ago
PagerDuty, Inc. (PD) Presents at Bank of America 2026 Global Technology Conference Transcript
-

 Tech4 days ago
Suspicious Polyfill login prompts pop up on Toshiba, Muji websites
-

 Crypto World2 days ago
Trump’s AI Ownership Plan Could Benefit Anthropic at OpenAI’s Expense
-

 Business4 days ago
(VIDEO) Justin Bieber Delivers Surprise Happy Birthday Serenade to Diners at Los Angeles Mexican Restaurant
-

 Tech4 days ago
Meta steals a tactic from Tesla and builds data centers in tents
-

 Tech4 days ago
RCS Messages Between iPhone and Android Get End-to-End Encryption With iOS 26.5
-
 Crypto World1 day ago
Eli Lilly (LLY) Stock Surges 4% Following Breakthrough Sleep Apnea Trial Results
You must be logged in to post a comment Login