

Crypto World
The Good News for Ethereum (ETH) After Collapse to $1.5K: Details
Ethereum’s controversial history during the time of extreme distress continues, as the asset was among the poorest performers on Friday (and overall since the correction began), dumping to a 14-month low at $1,500.
After the recent FUD spread on X that ConsenSys’ Joseph Lubin might be selling, here’s a portion of good news for Ethereum, including technical tools and who’s buying.
The Technical Setup
The largest altcoin by market cap traded at over $2,400 by mid-May when the entire market seemed in a lot more favorable state, with assets charting multi-month highs. However, the subsequent rejection drove it south hard, which culminated, as mentioned, on Friday.
After this $900 decline, representing a near-40% drop, some technical indicators suggest a bigger rebound is in the making. The first is the TD Sequential, a metric used to determine the underlying asset’s exhaustion in either direction, which has finally flashed a buy signal on a daily chart, according to Ali Martinez.
The second is actually against BTC. ETH has been dipping hard against the market leader, and it dropped to 0.026 during the market-wide crash on Friday. Michaël van de Poppe believes accumulation here could be a “wise strategy,” especially since “yields are likely peaking in the short-term and CLARITY Act vote is around the corner.”
There we go, 0.026 has been reached.
This is the area where I think accumulating $ETH is a wise strategy, especially since:
– Yields are likely peaking in the short-term.
– Clarity Act vote is around the corner.The latter one is a ‘Sell the rumor, buy the news’ type of event,… https://t.co/wuOprXjwK1
— Michaël van de Poppe (@CryptoMichNL) June 7, 2026
Who Is Buying?
In addition to the technical tools, on-chain data has revealed that different sorts of investors have started to reaccumulate. The first is an Ethereum OG whale who sold at prices above $2,000 but has returned to the buying scene by purchasing $56 million worth of the asset at under $1,570 per token. The second came from a wallet linked to Chun Wang, which accumulated over $28.5 million worth of ETH, according to data from Lookonchain.
The last one outlined by the analytics company is rather intriguing, as it’s not a typical investor per se. Instead, it’s the anonymous hacker behind the Pando Rings attack, who spent 10 million DAI to purchase 6,234 ETH at $1,602 earlier.
Even the hacker is buying the $ETH dip.
The Pando Rings hacker spent 10M $DAI to buy 6,243 $ETH at $1,602 just 6 hours ago.https://t.co/jFwsxtU0s6 pic.twitter.com/Cqph1Z7aLc
— Lookonchain (@lookonchain) June 6, 2026
The post The Good News for Ethereum (ETH) After Collapse to $1.5K: Details appeared first on CryptoPotato.

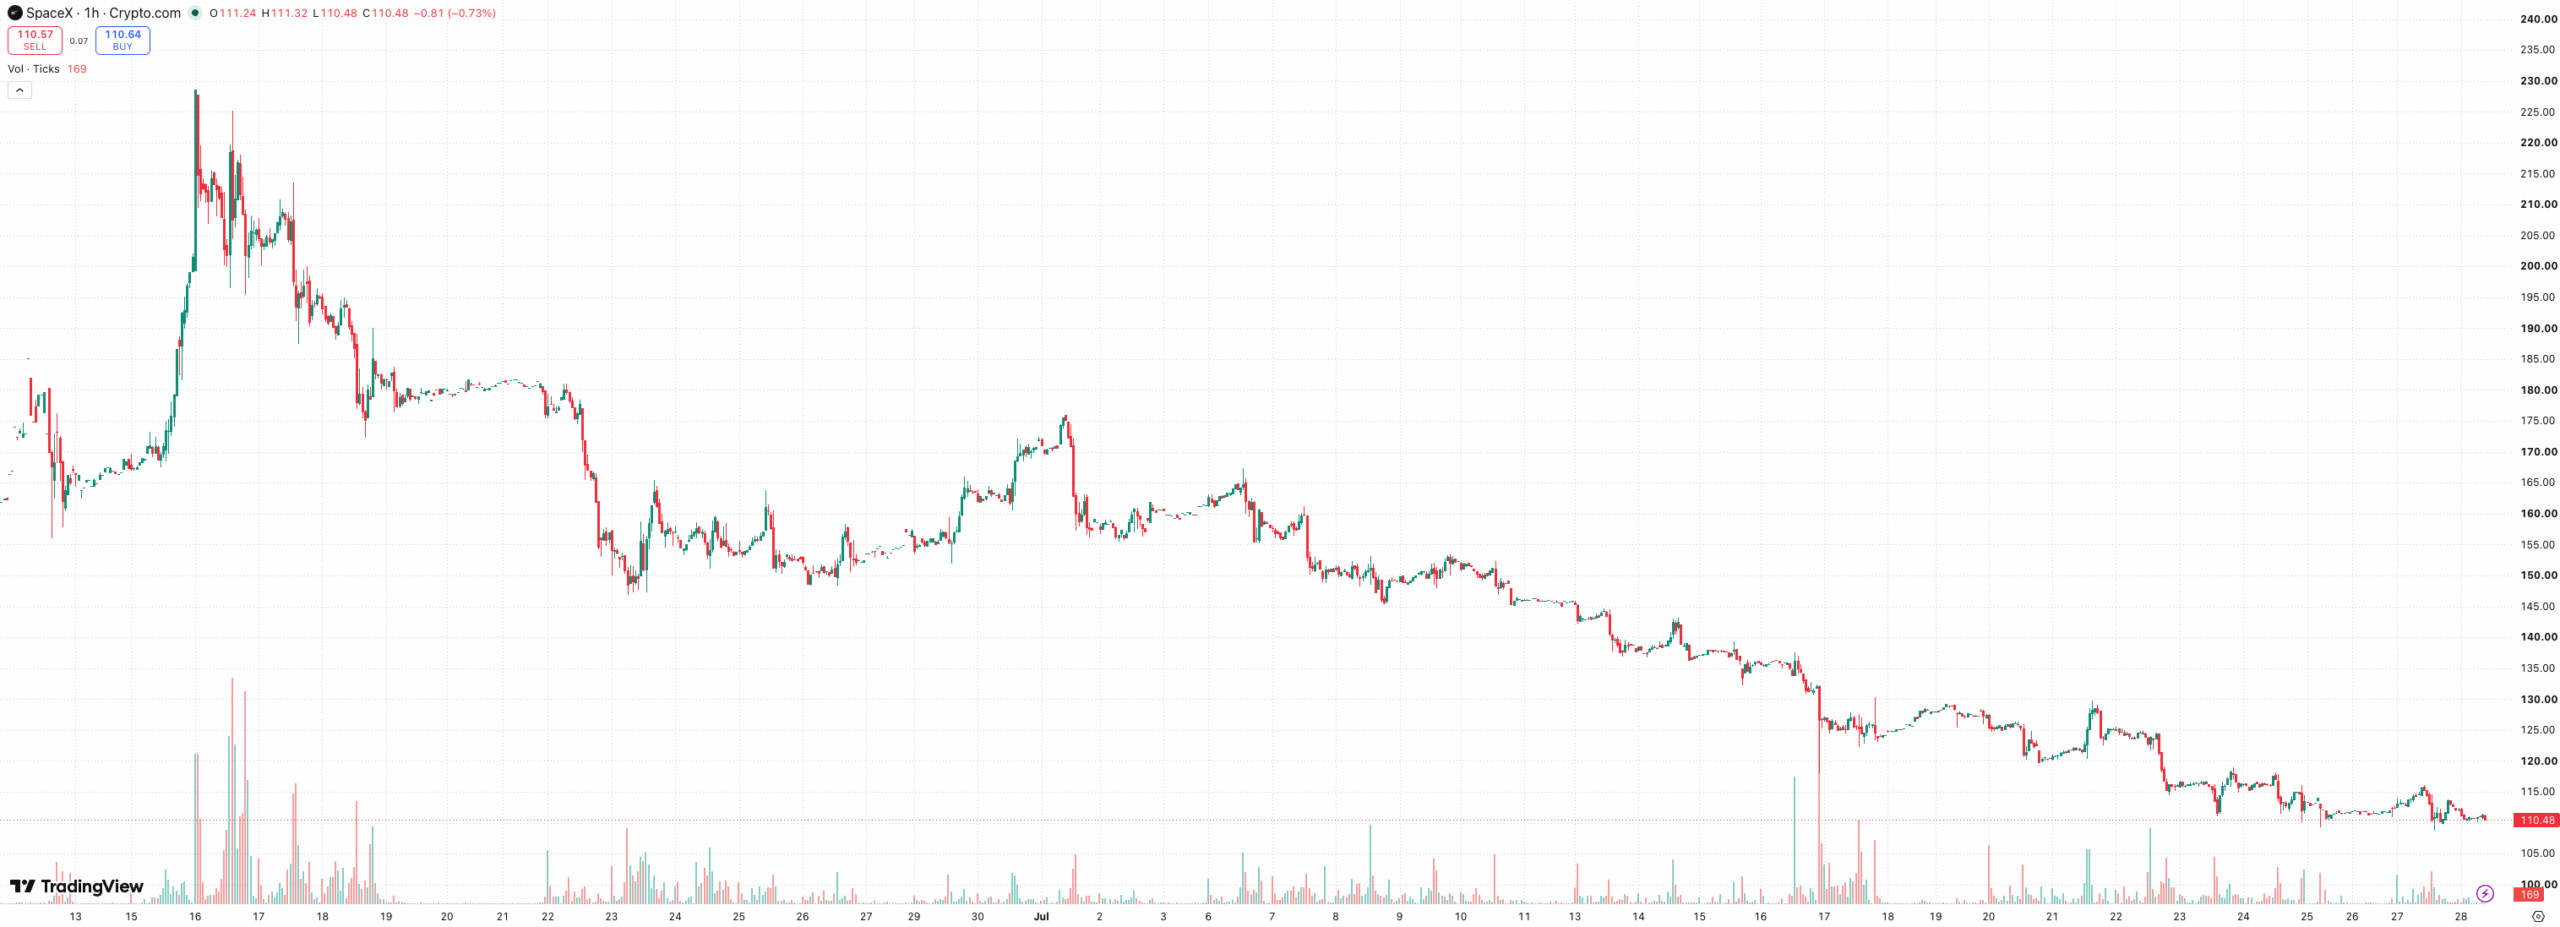
SpaceX stock fell to a record closing low of $113.50 on July 27, extending a very sharp reversal that began shortly after the company saw its debut on June 12.
The shares have now lost almost half of their value from the post-IP high above $225 and trade well below the offering price of $135.
It’s worth noting that SpaceX was the most-traded tokenized stock before and after its initial public offering on platforms such as Hyperliquid, Binance, and more.
Investors Reassess SpaceX’s Valuation
After the SpaceX IPO, the firm reached a market capitalization above $2.6 trillion, albeit briefly. By July 27, that figure had fallen to around $1.5 trillion, erasing slightly less than 50% of its gains.
The initial rally may have been driven by a number of factors, including speculation. However, it appears to have priced in substantial future growth from Starlink, reusable rockets, artificial intelligence, and proposed orbital data centers. Investors have since become less willing to pay for projects that may require years of development before producing any meaningful returns. This is evident in the chart.
According to official SpaceX reports, the company lost $4.9 billion last year on revenue of close to $19 billion. It’s worth noting that they also raised $25 billion through the bond market to support expensive technology infrastructure, adding concerns about higher borrowing costs as well as debt-funded AI spending.
Some analysts have noted that profit-taking, as well as the unwinding of extremely bullish post-IPO positions, has undoubtedly contributed to and accelerated the decline.
Lockup Fears Add More Selling Pressure
In addition to the above, the approaching expiration of SpaceX’s first post-IPO lockup period represents another concern investors have. After the company reports its first public quarterly results, some early investors, as well as eligible employees, will be allowed to sell a part of their holdings. This starts on August 6th – two days after the report, which is scheduled for August 4th.
Short sellers have also increased their positions, somewhat expectedly.
All in all, the attention is now entirely focused on August 4 and it’s interesting to see the details regarding the firm’s revenue, losses, AI spending, the growth of Starlink, as well as the potential supply of newly tradable shares.
The post Why SpaceX (SPCX) Stock Has Crashed Nearly 50% Since Its June Peak appeared first on CryptoPotato.
Japan’s central bank is in focus this week as its next interest-rate meeting comes amid new 40-year yen lows against the US dollar.
Key points:
- The Japanese yen is approaching new 40-year lows against the US dollar, nearly beating its latest record from last week.
- The Bank of Japan will decide on interest-rate changes on July 31, with rates already at 1%, their highest since September 1995.
- Analysts have been warning that the yen carry trade could unwind again, repeating a major crypto headwind from 2024.
Dollar-yen seeks to reclaim 40-year record
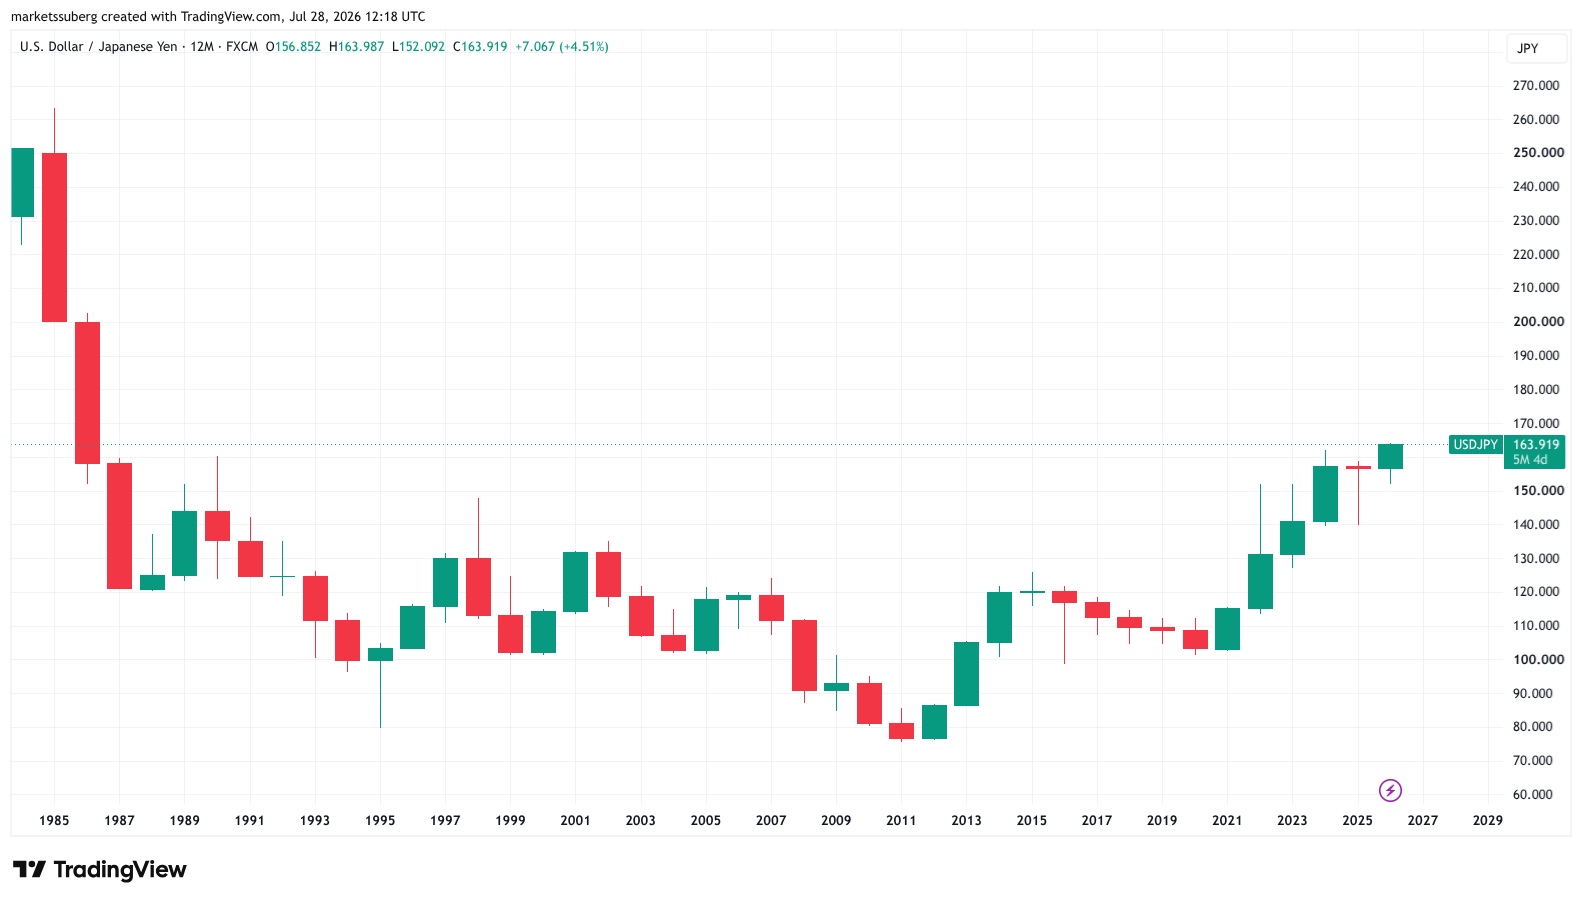
Data from TradingView showed USD/JPY approaching 164 on Tuesday, just a fraction below new 40-year highs seen last week.

USD/JPY 12-month chart. Source: Cointelegraph/TradingView
The yen’s status as a funding currency is making BoJ monetary policy have an outsized influence on global markets. Japan’s currency markets are characterized by minimal capital controls and unmatched liquidity among non-dollar currencies.
Japan’s persistent current account and trade surpluses in earlier decades along with systemically low interest rates have made JPY the most important global funding currency. However, since Japanese inflation picked up in 2022, this has created the risk of carry trade unwinds accompanied by a liquidity crunch.
On Thursday and Friday, the Bank of Japan (BoJ) will decide on whether to adjust its benchmark rate, which at 1.0% is currently at its highest since 1995.
Markets expect rates to stay the same, with market-implied probabilities of a rate hold at 98%, given that policymakers enacted their latest raise in June. Prediction service Polymarket puts the odds of no change at 99% as of Tuesday.
At the time, however, the BoJ suggested that fresh hikes would come later. In a summary from the June meeting, it referenced inflationary trends in the form of the Consumer Price Index (CPI), coupled with historically low rates in place for the past three decades, as grounds for the change.
“As for the future conduct of monetary policy, given that underlying CPI inflation has been approaching 2% and financial conditions have been accommodative, it is appropriate for the Bank to continue to raise the policy interest rate and adjust the degree of monetary accommodation, in response to developments in economic activity and prices as well as financial conditions,” BoJ said.
Since then, a concurrent headwind, the weakening of the yen, has gathered pace, staying above the key 160 level against the dollar despite a dip following the June rate hike.
The BoJ previously noted the potential for a weaker yen to weigh on CPI growth, constricting consumer spending power.
“Attention should also be paid to the point that, with firms’ behavior shifting more toward raising wages and prices recently, exchange rate developments are, compared to the past, more likely to affect prices, and that such moves could affect underlying CPI inflation through changes in inflation expectations,” its Outlook for Economic And Prices document, issued after its April meeting, read.
Yen carry trade unwind risks global spread
For crypto traders, developments in the yen are of key importance. The yen carry trade, which can act as a liquidity source for crypto markets, is heavily influenced by BoJ moves to stabilize the yen’s exchange rate against the dollar. As Cointelegraph reported, interventions in August 2024 sparked a snap “unwinding” of the carry trade, with an immediate detrimental impact on Bitcoin and altcoins.
Related: Rate path still divides investors: Five things to know in Bitcoin this week
Now, with USD/JPY building on new 40-year highs, concerns of a repeat are growing.
“That trade only works if two conditions remain intact. Japanese interest rates remain exceptionally low. The yen remains broadly stable or continues depreciating,” analyst Ricky Ho wrote in his latest X commentary on Monday.
Ho said that carry-trade unwinds are “rarely gradual” thanks to high amounts of leverage deployed by participants.
He warned that any changes in BoJ policy could thus have wider-reaching consequences for a global economy already accustomed to the Japanese economic status quo.
“Ultimately, we think investors remain too focused on whether the BOJ hikes in September, October or December. The more important issue is that the direction of policy has fundamentally changed,” Ho said.


John Oliver’s return to Last Week Tonight landed on crypto’s most politically charged fault line. The TRUMP crypto memecoin is trading near $1.48, down about 6% over the past day. Meanwhile, Bitcoin sits around $63,460 after slipping roughly 2%, reflecting cautious sentiment ahead of key macro events.
Oliver’s HBO exposé highlighted one striking figure. Trump’s first year back in office reportedly generated more than $2.2 billion in personal income. Around $1.4 billion came from crypto ventures, including NFTs, memecoins, and World Liberty Financial. He called Trump “the first crypto president” and traced his shift from dismissing Bitcoin to embracing digital assets.
The segment also described the TRUMP memecoin as a classic pump and dump. Oliver argued insiders sold into strength while many retail investors absorbed steep losses. He tied that criticism to the Trump family’s expanding crypto business and questioned whether political influence amplified investor demand.
For markets, the bigger issue is regulation. Ethics lawyers argue that a sitting president earning substantial crypto revenue creates an obvious conflict of interest. Whether that leads to tighter oversight or fuels more speculation around Trump crypto tokens remains a key question traders continue to weigh.
Discover: The Best Crypto to Diversify Your Portfolio
Can TRUMP Crypto Memecoin Recover, or Is $1.50 the New Ceiling?
At $1.48, TRUMP is pressing against a range that has offered little meaningful technical support since its sharp post-launch decline. The recent 24-hour range sits between roughly $1.47 and $1.56. Sellers continue rejecting rallies near the upper boundary, while buyers struggle to defend recent lows with conviction.
Volume remains the key factor. Oliver’s segment has brought fresh attention, but attention cuts both ways for a memecoin. It attracts speculative traders while reinforcing the pump-and-dump narrative for a much wider audience. Meanwhile, Bitcoin trades near $63,460, down about 2% on the day, offering little support for risk assets.
The bullish case depends on political headlines fueling speculative inflows. If TRUMP reclaims $1.56 with sustained volume, it could target $1.75 next. Even so, that outcome looks difficult unless Bitcoin regains momentum and market sentiment improves.
The base case favors consolidation between $1.45 and $1.56 as Oliver’s criticism continues circulating. Regulatory scrutiny may also keep buyers cautious. As a result, many holders could remain trapped on thin margins while waiting for a stronger catalyst.
The bearish case starts with a decisive break below $1.47. That would expose the $1.40 area if selling pressure accelerates. Any meaningful congressional action involving crypto conflicts of interest could intensify downside pressure, although no formal action has been announced.2 hours.
Trade Memecoins on Bybit and Get a Chance to Win Our $1,000 USDT Airdrop
Bitcoin Hyper Eyes Early-Stage Entry as Political Heat Pressures Meme Plays
When politically exposed tokens carry headline risk, and BTC softens on macro pressure, rotation tends to find infrastructure plays rather than narrative ones. The current market structure, with BTC dominance in flux and alt-season signals emerging, rewards projects that offer technical utility over political adjacency. That’s the environment Bitcoin Hyper ($HYPER) is raising into.
The project’s positioning is straightforward and technically specific: it is the first-ever Bitcoin Layer 2 integrating the Solana Virtual Machine (SVM), delivering smart contract execution and transaction throughput that, by design, outperforms Solana itself at the infrastructure level.
While inheriting Bitcoin’s security and trust model. That’s a meaningful combination if the architecture delivers, addressing Bitcoin’s three core limitations (slow finality, high fees, no programmability) without abandoning the base layer’s guarantees. The Decentralized Canonical Bridge handles BTC transfers natively.
Presale numbers as of this writing: $0.0136838 per $HYPER, with $33 million raised. Staking is live with a high APY incentive for early participants. With BTC under near-term pressure, a Bitcoin-native infrastructure presale absorbs a different risk profile than a memecoin.
Research Bitcoin Hyper before the current stage closes.
Discover: The Best Token Presales
The post John Oliver Rips Trump Crypto Involvement as “Flagrantly Corrupt and Compromised” appeared first on Cryptonews.

SEC Crypto: Securitize Capital, the advisory subsidiary of tokenized asset platform Securitize, has registered with the SEC as a full investment adviser, unlocking expanded institutional mandates for its onchain capital markets business.
The move graduates the firm from exempt reporting adviser status, under which it operated with constraints that limited the scope of the assets and clients it could serve.
Securitize announced the registration on Monday, framing it as a direct expansion of its regulated business stack. CEO Carlos Domingo said the registration strengthens the company’s ability to help institutions develop and manage investment strategies for onchain capital markets, according to Securitize.

Discover: The Best Crypto to Diversify Your Portfolio
What the Registration Actually Changes For Securitize
As an exempt reporting adviser, Securitize Capital operated under a lighter regulatory regime, primarily suited to venture capital or private funds with limited U.S. assets.
Full SEC registration under the Investment Advisers Act imposes additional disclosure, compliance, recordkeeping, and examination requirements, but it also removes the constraints on who the firm can advise and at what scale.
The practical effect: Securitize can now pursue a wider range of institutional advisory mandates, separately managed accounts, broader private fund structures, and formal investment strategies built around its tokenization infrastructure, without the cap imposed by exempt status.
This also completes Securitize’s U.S. regulatory stack in a meaningful way. The firm already operates an SEC-registered broker-dealer, an alternative trading system, a transfer agent, and fund administration services.
Adding a full RIA license positions it as a vertically integrated, regulated infrastructure provider for tokenized securities, a configuration few competitors can match. For context on the broader push toward regulated institutional infrastructure in crypto, the regulatory momentum driving institutional adoption has been building across multiple fronts in 2026.
Scale and Asset Manager Relationships
Securitize is the largest tokenization platform by onchain asset value, with approximately $4.8 billion in tokenized assets across funds managed by BlackRock, Apollo, KKR, VanEck, Hamilton Lane, and other institutional asset managers.
That existing franchise is what the advisory registration layers on top of; this is not a startup building toward institutional relevance, it’s a firm with established AUM relationships formalizing the advisory wrapper around them.
The Apollo relationship is worth flagging specifically. Securitize Capital has been listed as the contact on SEC filings tied to the Securitize Tokenized Apollo Diversified Credit Fund, indicating active work in tokenized credit strategies. Full RIA status makes structuring and managing those types of mandates more straightforward from a regulatory standpoint.
The trajectory here mirrors what’s happening elsewhere in institutional crypto infrastructure. Ripple’s push into institutional finance with RLUSD and prime brokerage and Fasanara Capital’s on-chain activity in institutional DeFi both reflect the same pattern: traditional capital isn’t waiting for perfect regulatory clarity before committing infrastructure spend to onchain markets.
Public Company Context and Stock Performance
Securitize began trading on the New York Stock Exchange under the ticker SECZ on July 2, after completing a merger with Cantor Equity Partners II. Shares have since fallen roughly 46% from their first-day closing price – a sharp correction that adds some irony to a week of regulatory milestone announcements.
The neoclassical facade of the New York Stock Exchange building on Wall Street.

The stock decline doesn’t directly undercut the strategic logic of the RIA registration, but it does put the compliance build-out in context: Securitize is now a public company with earnings obligations, and the advisory license needs to translate into fee-generating mandates to justify the increased regulatory overhead.
The infrastructure is compelling; the revenue model tied to it is what the market is apparently still pricing in.
For institutional asset managers already running tokenized funds through Securitize’s platform, full RIA status likely reduces friction around adding advisory services to existing relationships.
Whether that converts into new AUM inflows or an expanded mandate scope in the near term is the open question that the registration itself doesn’t answer.
Trade Ripple XRP on Bybit and Get a Chance to Win Our $1,000 USDT Airdrop
The post Securitize Gains Full RIA Status to Expand Onchain Advisory Mandates appeared first on Cryptonews.
Ripple has become one of the largest corporate political donors in the United States this election cycle, while the market structure bill backed by the crypto industry remains before the Senate ahead of the August recess.
Public Citizen estimates Ripple has contributed about $48 million during the 2026 election cycle, placing it among the country’s largest corporate political donors. Andreessen Horowitz ranks slightly higher at roughly $51.65 million, while Coinbase’s reported total differs because organizations count different PACs and contribution vehicles.
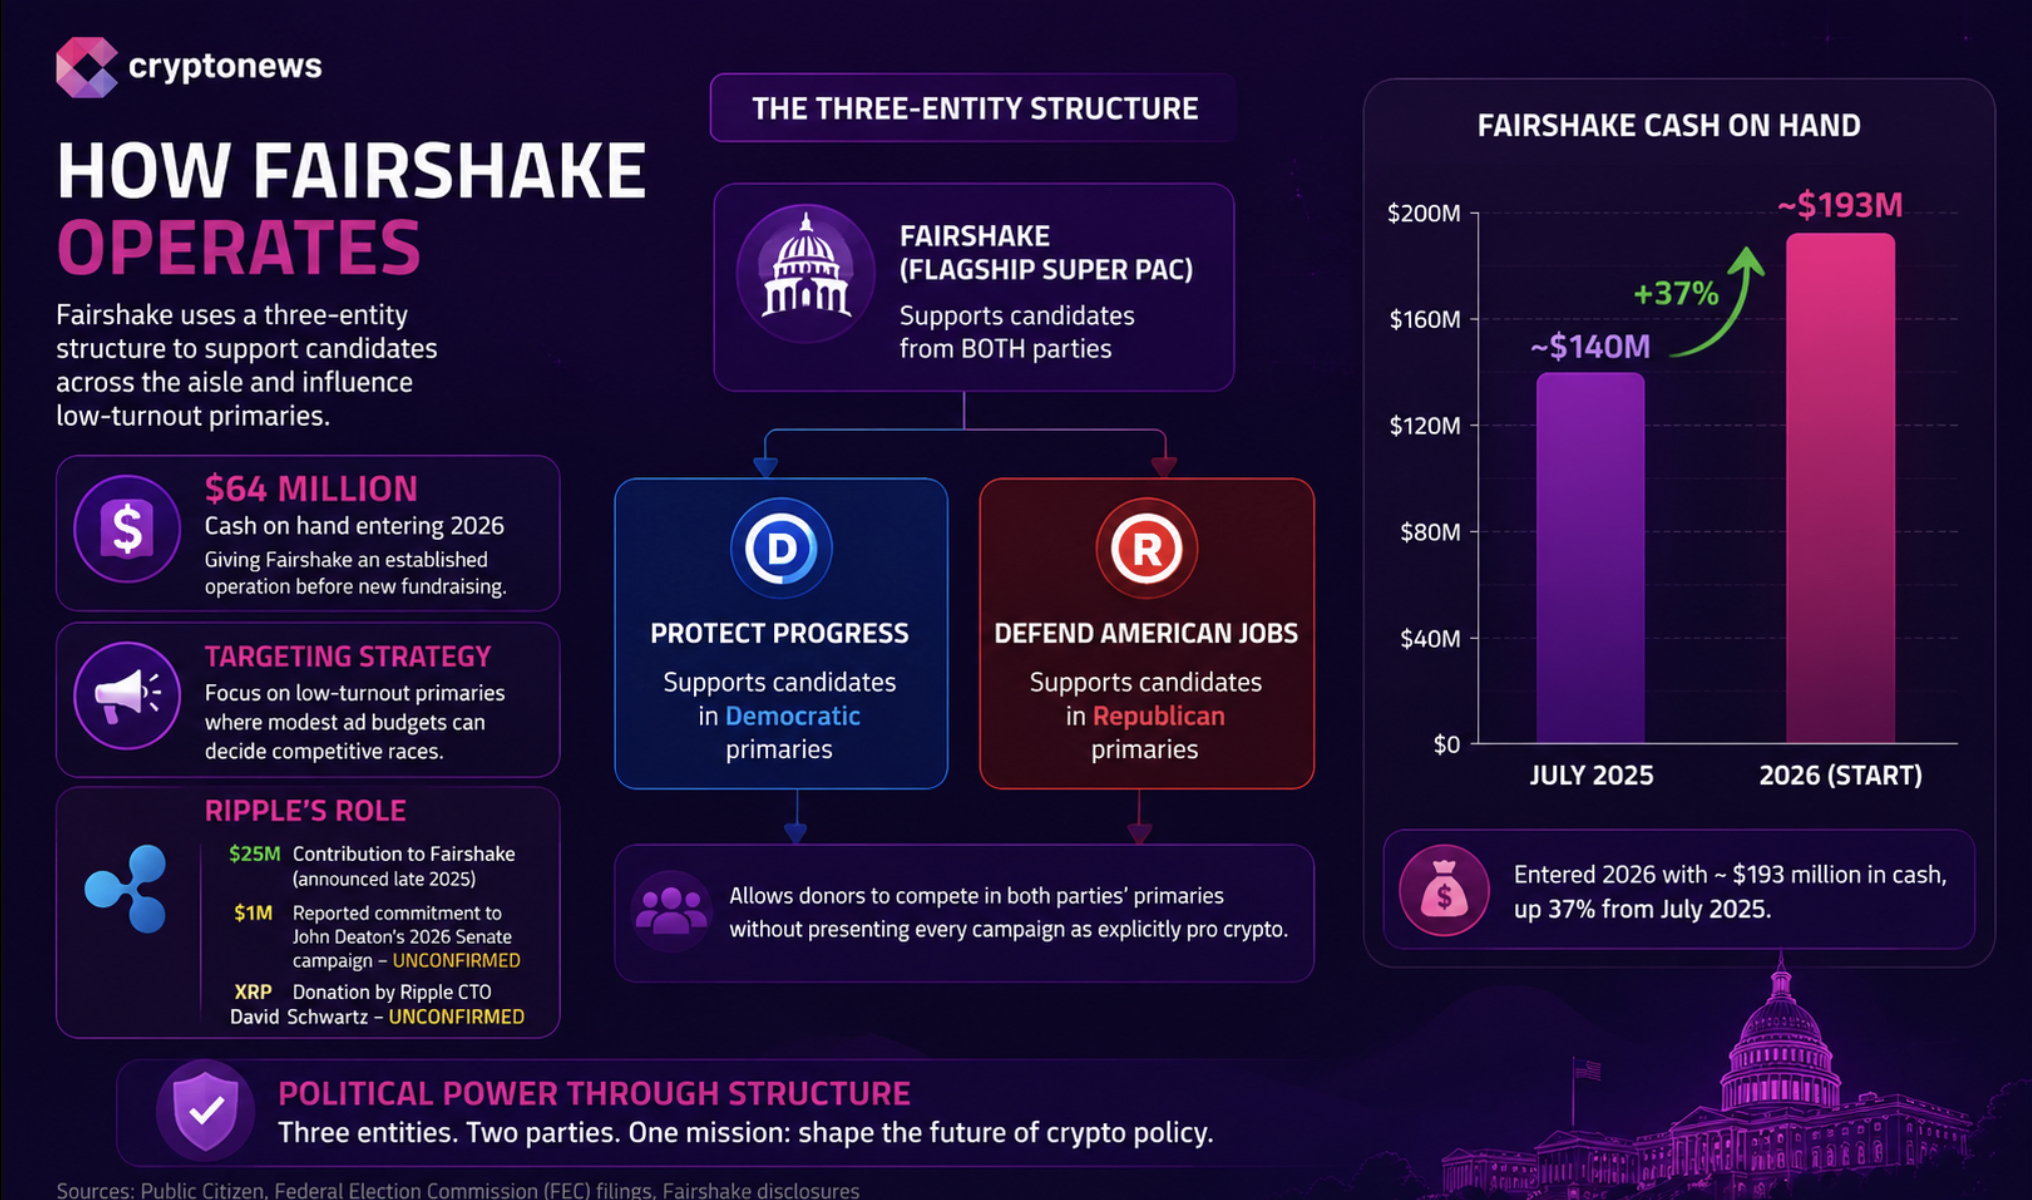
Most of the funding flows through Fairshake, the crypto industry’s leading super PAC network. Fairshake and its affiliated committees entered the 2026 midterms with roughly $193 million in cash, about 37% above their July 2025 level. Coinbase, Ripple, and Andreessen Horowitz together committed around $74 million during the second half of 2025.
Public Citizen estimates crypto companies have spent roughly $189 million, representing about 37% of all corporate election spending this cycle. By comparison, artificial intelligence and Big Tech contributed about $60 million, while online gambling accounted for roughly $45.6 million. By that measure, crypto has become the largest corporate political spending sector.
Discover: The Best Token Presales
How Ripple Mechanism Works
Fairshake operates through three organizations. The flagship super PAC supports candidates from both parties, while Protect Progress backs Democrats and Defend American Jobs supports Republicans. This structure lets donors compete in both parties’ primaries without presenting every campaign as explicitly pro crypto.
The network mainly targets low-turnout primaries, where relatively modest advertising budgets can influence competitive races. Fairshake entered 2026 with about $64 million already available, giving it an established political operation before new fundraising began.

Ripple’s largest disclosed commitment this cycle is a $25 million contribution to Fairshake, announced in late 2025. However, reports that Ripple has already committed $1 million directly to John Deaton’s 2026 Senate campaign remain unconfirmed through public campaign finance records. Claims that Ripple CTO David Schwartz donated XRP to Deaton’s campaign also lack official confirmation.
Discover: The Best Crypto to Diversify Your Portfolio
What the Spending Achieved and the Senate Test
Fairshake and its affiliates raised about $93 million during the 2023 to 2024 cycle and spent more than $130 million supporting preferred candidates. Representatives Jamaal Bowman and Cori Bush both lost Democratic primaries after heavy Fairshake-backed advertising, reinforcing the industry’s growing political influence even though neither race centered on crypto policy.
Congressional momentum followed. The House approved the CLARITY Act, while the GENIUS Act advanced separately with bipartisan backing. Although campaign spending alone cannot explain those results, the industry’s expanding political presence coincided with stronger congressional support for crypto legislation.
Massachusetts remains an important exception. John Deaton lost to Elizabeth Warren by nearly 20 percentage points in 2024 despite significant outside support, suggesting Fairshake’s strategy remains more effective in lower turnout primaries than statewide general elections.
Critics argue crypto’s influence comes from its concentration, with one industry supplying more than one third of corporate election spending. The industry counters that banking, energy, and pharmaceutical companies have long used similar political strategies. More than 200 crypto firms, including Coinbase, Ripple, and Kraken, have urged the Senate to pass the CLARITY Act, arguing clear rules are needed to keep innovation in the United States.
The legislation now faces a crucial Senate window before the August recess. Ripple CEO Brad Garlinghouse has remained one of its strongest advocates. If the bill passes, Fairshake will carry a substantial campaign reserve into the general election. If it fails, those resources could instead target future primary races.
Ripple’s political spending complements its broader investment in institutional finance, including RLUSD, custody services, and the Hidden Road acquisition, making regulatory clarity a strategic business priority rather than an XRP-specific objective.
Trade Crypto Before The Clarity Act Passes on Bybit and Get a Chance to Win Our $1,000 USDT Airdrop
The post Fairshake, $48M, and the Senate Vote Ripple Is Racing to Win appeared first on Cryptonews.


In 2023 a group of developers forked the XRP Ledger because its validators would not adopt smart contracts. Three years later the parent chain is shipping its own programmability layer, and the drafted specification names the fork’s technology as an inspiration. Here is what actually happened, what it means for XAH, and why three competing architectures now answer the same question.
Summary
- Xahau launched in 2023 as a fork of the XRP Ledger’s rippled codebase, carrying the Hooks amendment that XRPL validators never adopted, with its own token, its own validator set, and a governance system run through a genesis account hook.
- The XRP Ledger is now building programmability natively: XLS-100d Smart Escrows, using WebAssembly, sits among known amendments with a devnet live, and XLS-101 Smart Contracts is a drafted specification that cites both Hooks and the Ethereum Virtual Machine as influences.
- Xahau rejects the sidechain framing entirely, positioning itself as an independent Layer 1 that diverged in its own direction, with features the parent lacks and vice versa, and describing the borrowing as mutual.
- Three architectures now answer the same question for one ecosystem: Hooks on Xahau, Solidity through the EVM sidechain whose first year this publication audited at $25,741 in total value locked, and WebAssembly natively on the main ledger.
- The open question is what a fork is worth once the chain it left ships the capability it forked for, and XAH is the asset where that question gets priced.
Forks in crypto usually happen over money or ideology. This one happened over a feature. In 2023, after years in which the XRP Ledger’s validators declined to adopt Hooks, a lightweight smart-contract system that would let small pieces of code live on accounts and govern the transactions those accounts send and receive, the developers behind it stopped waiting. They took the ledger’s open-source rippled codebase, added Hooks, launched a network called Xahau with its own token and its own validators, and shipped the capability the parent chain would not. Ripple’s chief technology officer publicly supported the move at the time, saying he could not think of a better path forward for the technology. Three years later the parent chain is building programmability after all. XLS-100d, a WebAssembly-based Smart Escrows amendment, is among the known amendments with a devnet running, and XLS-101d, a drafted specification for general smart contracts, explicitly names both Hooks and the Ethereum Virtual Machine among its influences. This piece examines what that convergence actually means: for the ledger that spent years refusing, for the fork that stopped waiting, and for an ecosystem that now has three separate answers to the question of how a payments chain becomes programmable.
What Xahau took, and what it built
Understanding the fork requires understanding what it kept, because Xahau is not a departure from the XRP Ledger’s design so much as an addition to it.
The network preserved the core: the consensus protocol, the native decentralized exchange, and the fee-and-reserve logic that protects the ledger against spam by charging and burning fees in the native token. What it added was Hooks, small pieces of code installed on an account that impose rules on transactions before those transactions execute, enabling functions such as time locks on transfers, social-recovery arrangements for accounts, and self-custodial direct debits. The design philosophy is deliberately narrow. Hooks were never intended to replicate a general-purpose virtual machine; they are lightweight logic reacting to ledger events, executing fast enough to preserve settlement speed and cheap enough to suit a payments chain.
Two further design choices distinguish it. Xahau substituted a simpler token standard for the parent’s NFT implementation, and it built a governance system in which the genesis account itself is controlled by a hook that regulates matters including the emission of new XAH, administered through a two-tiered arrangement with up to twenty independently owned validators as participants. Governance by smart contract, on a chain whose reason for existing is smart contracts, is at least internally consistent. XAH functions as the network’s fee and reserve asset, with a balance-rewards mechanism that has no equivalent on the parent chain.
The launch was contentious in the way ecosystem splits usually are, with parts of the XRP community expressing unease at the lack of official involvement, and with the fork’s supporters arguing that validators refusing an amendment for years had left no alternative. The relevant point for today is that Xahau shipped and kept shipping, accumulating a validator set, an exchange listing history, and a working developer story around a capability the main ledger did not have.
What the parent is shipping now
The XRP Ledger’s current roadmap describes a different route to the same destination, and the specifications are public.
XLS-100d, Smart Escrows, brings WebAssembly-based conditional logic to escrow objects, allowing programmable conditions to govern the release of funds, and it appears among the ledger’s known amendments with a dedicated devnet for developers to test against.
That is a narrow, payments-native form of programmability: not a general computing environment, but escrows that can enforce arbitrary conditions written in a widely supported bytecode format. XLS-101d, Smart Contracts, is the broader specification, drafted in 2025, proposing general smart contract capability on the ledger and citing both Hooks and the EVM among the designs it draws from.
The choice of WebAssembly instead of a bespoke virtual machine is the interesting technical decision, because it imports an existing toolchain and developer base rather than asking builders to learn something proprietary. It is also, in its way, an admission: the ledger that resisted programmability for years is now adopting a mainstream execution standard, and doing so with public acknowledgment of the technology that forked away over exactly this question.
The timing places three approaches in the same ecosystem simultaneously. Hooks run on Xahau. Solidity runs on the XRPL EVM sidechain, whose first year this publication audited and found holding $25,741 in total value locked, a figure that remains the sharpest available evidence that architectural compatibility does not produce developer gravity by itself. And WebAssembly is arriving natively on the main ledger. Three answers, one ecosystem, and no consolidation in sight.
The fork refuses the frame
The narrative that writes itself, that a parent chain has absorbed the innovation its fork proved out, is one Xahau explicitly rejects, and its objection deserves fair treatment because it complicates the story usefully.
The current positioning from the Xahau side is that it is not a sidechain and never was one in any meaningful operational sense: it is an independent Layer 1, built from a fork of the XRPL codebase, that has evolved in a completely different direction with its own validators, its own governance, and its own economics. On this account the two networks occasionally adopt ideas from one another and otherwise develop separately, with features existing on each that do not exist on the other. The sidechain confusion, the argument goes, comes from early marketing history and not from present reality.
That framing is defensible on the technical facts and self-interested at the same time, which is normal for any project describing itself. Independence is real: separate consensus, separate validator set, separate token with its own monetary policy. Mutual borrowing is also real, since specifications flow in both directions among developers who largely know each other. But the asymmetry is equally real and no framing dissolves it. When the parent ledger ships general programmability, a developer choosing where to build weighs Xahau’s head start and Hooks’ elegance against the main ledger’s liquidity, its institutional relationships, its exchange support, and the ecosystem’s marketing gravity. Forks that exist to supply a missing capability face their hardest test at exactly the moment the capability stops being missing, and no amount of correct positioning about independence changes the competitive arithmetic a builder actually runs.
The threshold that decides everything
Everything in this piece depends on a governance mechanic that outsiders consistently underestimate, and the ledger’s own recent history supplies the cautionary case.
XRP Ledger amendments activate only when validators on the default list signal support at or above eighty percent, and that support must hold continuously for two weeks before the change takes effect. Fall below the line at any point in the window and the clock resets. There is no foundation that can force adoption, no core team veto, and no timetable: an amendment can sit in the known-amendments list indefinitely, gathering partial support, activating never. Hooks itself is the proof. The specification existed, the implementation worked, the technology was sound enough that the ledger’s own chief technology officer publicly endorsed the fork that shipped it, and the amendment still never reached the threshold on the main chain. Years of availability produced no activation, which is precisely why Xahau exists at all.
That history should discipline every forecast about XLS-100d and XLS-101d. A specification in the known-amendments list is a proposal that validators may or may not adopt, and a drafted specification like the general smart contracts proposal is a step earlier still. Both could activate this year; both could sit for three years; either outcome would be consistent with the ledger’s record. The ecosystem’s more recent experience cuts the same way in the opposite direction, since a maintenance amendment this summer sat near forty-eight percent support for a month before validators moved and carried it past the threshold at eighty-six percent, showing that stalled votes can turn quickly once the coalition assembles. Prediction is unwise in both directions.
The threshold also shapes the competitive dynamic between the two chains in a way neither side usually discusses. Xahau’s governance runs through a hook on its genesis account under a two-tier arrangement with up to twenty validators, which is a materially different mechanism from the parent’s eighty percent supermajority, and the fork’s ability to ship features it decides to ship is not a small advantage for a network whose entire premise is programmability. A chain that can adopt is structurally different from a chain that must persuade. Whether that speed advantage matters more than the parent’s liquidity is the actual competition, and it is a question about governance architecture more than about virtual machines.
For a reader tracking this, the practical instruction is simple: ignore roadmap announcements and watch the validator vote count, published continuously, on the specific amendments. Announcements are intentions. The count is the only thing that has ever decided what the XRP Ledger does.
What it means for XAH
The honest assessment splits into a bear case and a bull case that are both stronger than the ecosystem’s usual discourse allows.
The bear case is straightforward. XAH’s investment thesis has substantially been that Xahau is where XRPL-ecosystem smart contracts live. If XLS-100d and XLS-101d ship and function, that thesis erodes toward a narrower claim: Xahau is where a particular style of lightweight account-attached logic lives, competing against native WebAssembly contracts on a chain with vastly more liquidity, more integrations, and more attention. Fee-burn value accrual on a chain whose activity moves elsewhere is the same problem this publication has documented across the value-accrual arc, arriving in a smaller ecosystem with less cushion.
The bull case rests on three points that deserve their weight. First, shipping schedules: XLS-101d is a draft, amendments require validator adoption at an eighty percent threshold sustained over two weeks, and the ledger’s own history, including the years Hooks spent unadopted, is the strongest available evidence that XRPL amendments can stall indefinitely. Xahau’s capability exists today; the parent’s is a specification and a devnet. Second, design divergence: Hooks and WebAssembly contracts are not substitutes for every purpose, and lightweight event-triggered logic on accounts has properties a general contract environment does not. Third, and most underrated, the governance experiment: a chain whose emission and genesis account are administered by a hook under a two-tier validator arrangement is running a live test of on-chain governance that the parent has not attempted, and if that works at scale it is an independent reason for the network to exist.
The verdict this piece can honestly offer is narrower than either case: the fork’s premise has changed, and the market has not repriced it because the parent’s capability is not live yet. When XLS-100d activates, the question stops being theoretical, and XAH becomes the cleanest available measure of what a fork is worth after the reason for forking has been addressed at home.
What to watch
XLS-100d’s amendment vote. Smart Escrows crossing the eighty percent validator threshold and completing its two-week activation window is the event that converts this from a roadmap story into a live competitive fact. Watch the vote count, not the announcements.
XLS-101d’s progression. A drafted specification is a long way from an activated amendment. Whether the general smart-contract proposal moves toward candidate status within the year, or joins the long list of XRPL specifications that never reached a vote, determines the scale of the challenge to Xahau.
Developer migration signals. New deployments, tooling investment, and grant activity across the three environments are the leading indicators. The EVM sidechain’s first-year experience is the cautionary baseline: compatibility alone moved nothing.
Xahau’s differentiation response. The fork’s strongest move is to lean into what the parent will not copy, meaning its governance model, its balance rewards, and Hooks’ specific ergonomics. Whether the project pivots toward those or defends the general smart-contract ground is the strategic tell worth watching.
A closing observation about what this episode says about the ecosystem’s decision-making, since the technical story has a governance moral. The XRP Ledger’s amendment threshold is a genuine decentralization feature, the same property this publication has praised when validators declined to follow Ripple’s own signaling on other proposals, and it is also the reason a capability the ecosystem clearly wanted took six years and a fork to arrive. Both statements are true, and the tension between them is the permanent condition of any network that makes protocol change hard on purpose. Chains that can ship quickly capture opportunities and make mistakes quickly; chains that require supermajorities avoid mistakes and miss windows. Neither is a flaw to be fixed.
What the Xahau episode adds is the observation that in an open-source ecosystem, the slow chain does not actually prevent the feature from existing. It only determines where the feature lives, who benefits from it, and which token captures whatever value it generates. The developers who wanted Hooks did not wait; they left, built, and launched, and the parent chain’s caution cost it three years of programmability and handed a competitor its founding purpose. Now the parent is building the capability anyway, on its own timeline, with the fork’s work as a reference. That is either the system working exactly as designed, with experimentation happening safely outside the main ledger before the ideas mature into it, or an expensive way to arrive at a destination the ecosystem could have reached directly. Both readings have adherents, and the amendment vote will not settle which is right.
Disclaimer: This article is for information and educational purposes only and does not constitute financial or investment advice. Protocol specifications, amendment statuses, and roadmaps change, and drafted proposals may never activate. Nothing here is a recommendation to buy, sell, or hold any asset. Always do your own research. Information is accurate as of July 27, 2026.
Frequently Asked Questions
What is Xahau?
An independent Layer 1 blockchain launched in 2023 as a fork of the XRP Ledger’s open-source rippled codebase, created to implement Hooks, a lightweight smart contract system that XRPL validators had not adopted. It retains the parent’s consensus protocol, decentralized exchange, and fee-burning design while adding programmability, its own token XAH, its own validator set, and a governance system administered through a hook on the genesis account.
What are Hooks?
Small pieces of code installed on an account that impose rules on transactions the account sends or receives, executing before those transactions complete. They enable functions such as transaction time locks, social-recovery arrangements, and self-custodial direct debits. Hooks were designed for speed and low cost rather than to replicate a general-purpose virtual machine, which is the core design difference from EVM-style smart contracts.
What is the XRP Ledger building now?
Two things. XLS-100d, Smart Escrows, uses WebAssembly to allow programmable conditions on escrow releases and appears among known amendments with a devnet available. XLS-101d, Smart Contracts, is a drafted specification for general smart contract capability that cites both Hooks and the Ethereum Virtual Machine among its influences. Neither is yet activated on the main ledger.
Is XRPL copying Xahau?
Borrowing openly, in one direction, while the fork maintains that exchange runs both ways. The drafted XRPL specification names Hooks as an influence, which is a public acknowledgment. Xahau’s position is that it is an independent chain that has evolved in its own direction, with features on each network absent from the other, and that both occasionally adopt ideas from the other.
How many ways can you write smart contracts in the XRP ecosystem?
Three, currently. Hooks on Xahau, Solidity via the XRPL EVM sidechain, and WebAssembly natively on the main ledger once the relevant amendments activate. The EVM sidechain’s first year, which this publication audited at $25,741 in total value locked, is the ecosystem’s own evidence that offering an execution environment does not by itself attract developers.
What does this mean for the XAH token?
It puts pressure on the fork’s core premise. If the parent ledger ships working programmability, Xahau’s claim narrows from being the ecosystem’s smart contract chain to offering a particular style of lightweight logic against a far more liquid competitor. The counterweights are timing, since XRPL amendments require sustained eighty percent validator support and can stall for years, and genuine design differences between the two approaches.
Why did XRPL validators never adopt Hooks?
The amendment never reached the sustained supermajority the ledger’s governance requires, and no single public explanation covers it. Ripple’s chief technology officer stated at the time of the fork that he did not believe validators were voting on political grounds and that Xahau had made good decisions, describing the fork as a reasonable path forward for the technology.
What would settle the competition?
Activation and adoption, in that order. The amendment vote on Smart Escrows converts the parent’s programmability from a roadmap to a fact, and developer behavior afterward, new deployments and where tooling investment goes, decides which environment accumulates gravity. Ecosystem history suggests capability alone does not determine the outcome. This is educational analysis, not investment advice.


Data center operator Core Scientific (CORZ) announced an infrastructure partnership with Advanced Micro Devices (AMD) anchored by 15-year leases for 529 megawatts of U.S. AI capacity, which the company said could generate more than $14 billion in base contracted revenue.
The capacity is expected to support AMD customer deployments beginning in 2027. The agreements give AMD, under certain conditions, the right to reserve another 1,925 MW through Dec. 28, 2028, potentially expanding the partnership to roughly 2.5 gigawatts.
AMD directly leased 377 MW across Core Scientific sites in Pecos and Hunt County, Texas, and Muskogee, Oklahoma, according to the company’s quarterly filing.
An unnamed cloud provider leased another 152 MW in Auburn, Alabama, and Dalton, Georgia, under agreements supported by AMD.
Core Scientific and AMD will collaborate on data-center design and the deployment of AMD Instinct graphics processing units, EPYC processors and ROCm software, the companies said.
AMD also received warrants to purchase up to 30 million Core Scientific shares at $23.47 per share. About 6.5 million vested when the initial leases were signed, with further warrants vesting as additional capacity is contracted.

XRP price fell about 5% to $1.05 on July 28 as a broader risk-off move and forced long liquidations pushed the token below a closely watched technical floor.
Summary
- XRP dropped from roughly $1.11 to $1.05, breaking support near $1.054.
- The 4-hour RSI fell to 25.93, placing XRP in oversold territory.
- Daily Chaikin Money Flow reached -0.12, showing continued net capital outflows.
- Liquidation clusters near $1.075 and $1.097 could limit an early recovery.
XRP price breaks below a double-top neckline
According to data from crypto.news, XRP (XRP) price traded at $1.049 at the time of writing after reaching an intraday low of $1.0486 on Binance. The decline extended a broader downtrend that has kept the token under pressure since May.
The 4-hour chart shows XRP forming two rounded peaks near $1.17, creating a double-top structure. Both advances lost momentum before buyers could establish support above $1.15.
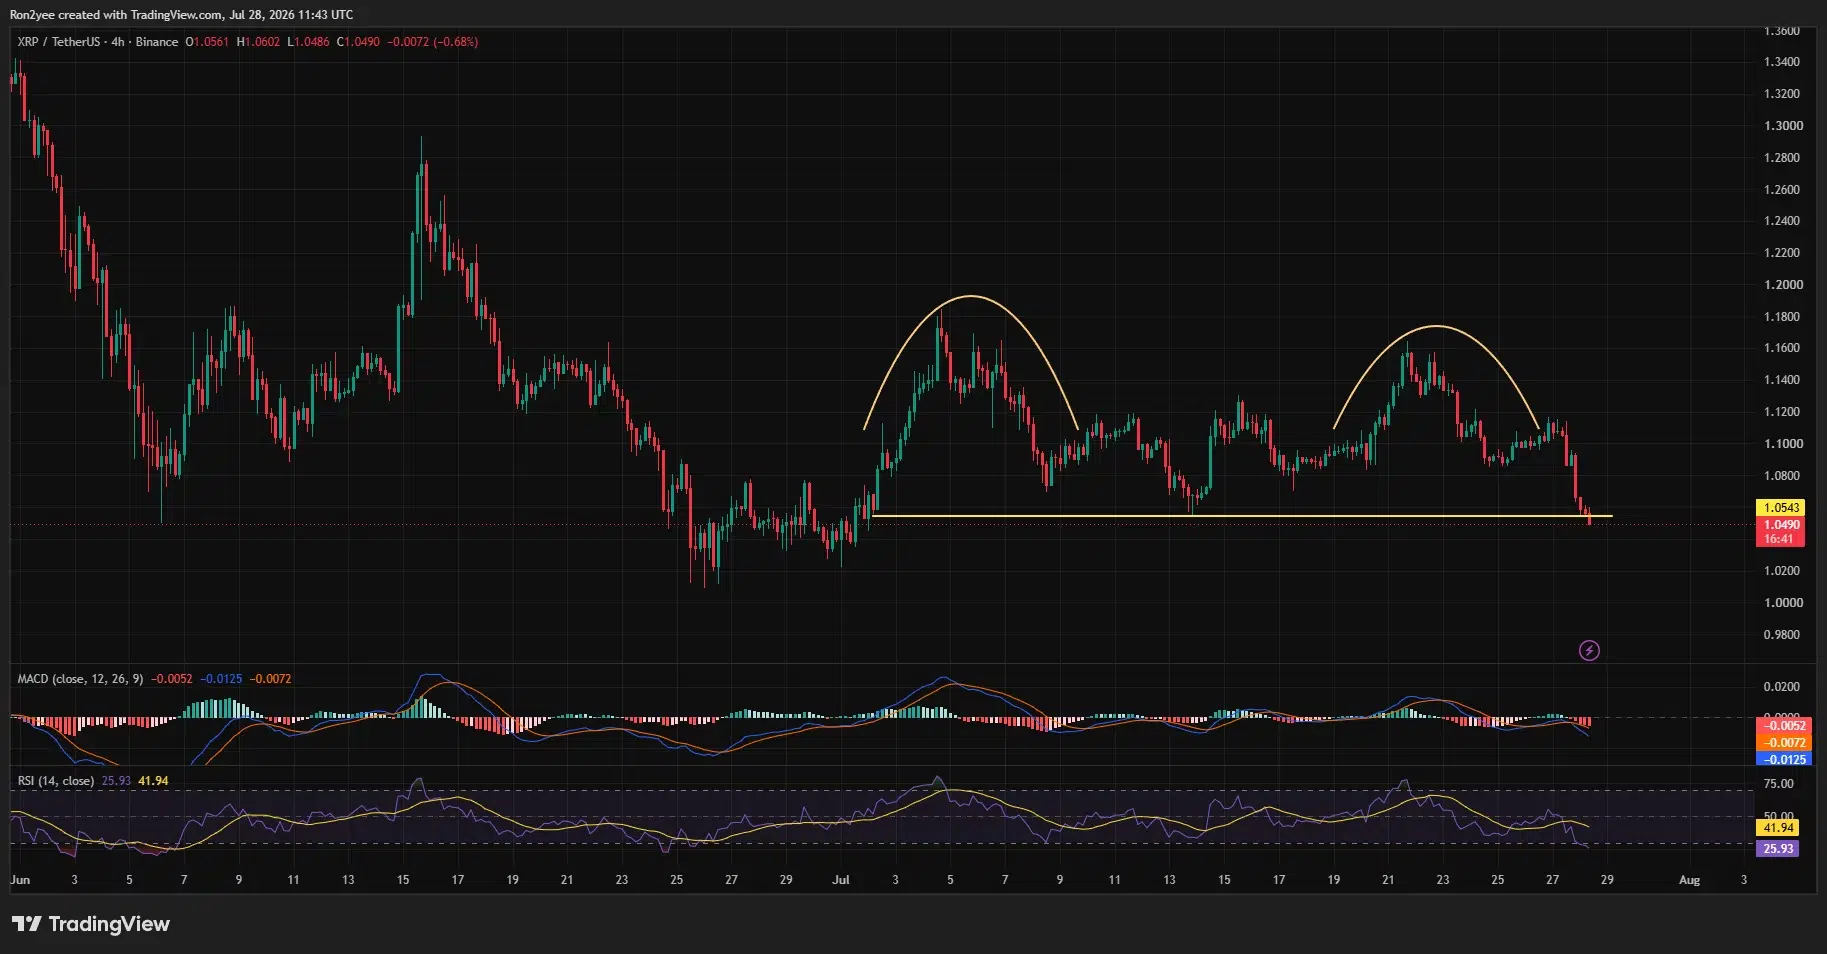
A horizontal neckline near $1.054 separated the pattern from its bearish confirmation. XRP moved below that level on July 28, exposing the psychological $1 mark and the late-June lows between $1.01 and $1.03.
The breakdown followed repeated failures around $1.11 during the previous sessions. Sellers took control once XRP lost $1.08, with the decline accelerating as the price approached the double-top neckline.
Momentum indicators reflect the speed of the move. XRP’s 4-hour relative strength index fell to 25.93, below the 30 level commonly associated with oversold conditions. Its RSI moving average remained much higher at 41.94, showing how rapidly short-term momentum weakened.
Oversold readings can support a temporary rebound, but they do not confirm that a bottom has formed. XRP would first need to recover the broken $1.054 level and then establish a higher low.
Liquidations accelerate XRP’s decline
CoinGlass’ 24-hour liquidation heatmap shows XRP falling from around $1.105 to $1.05 as the market moved through several leveraged trading zones.
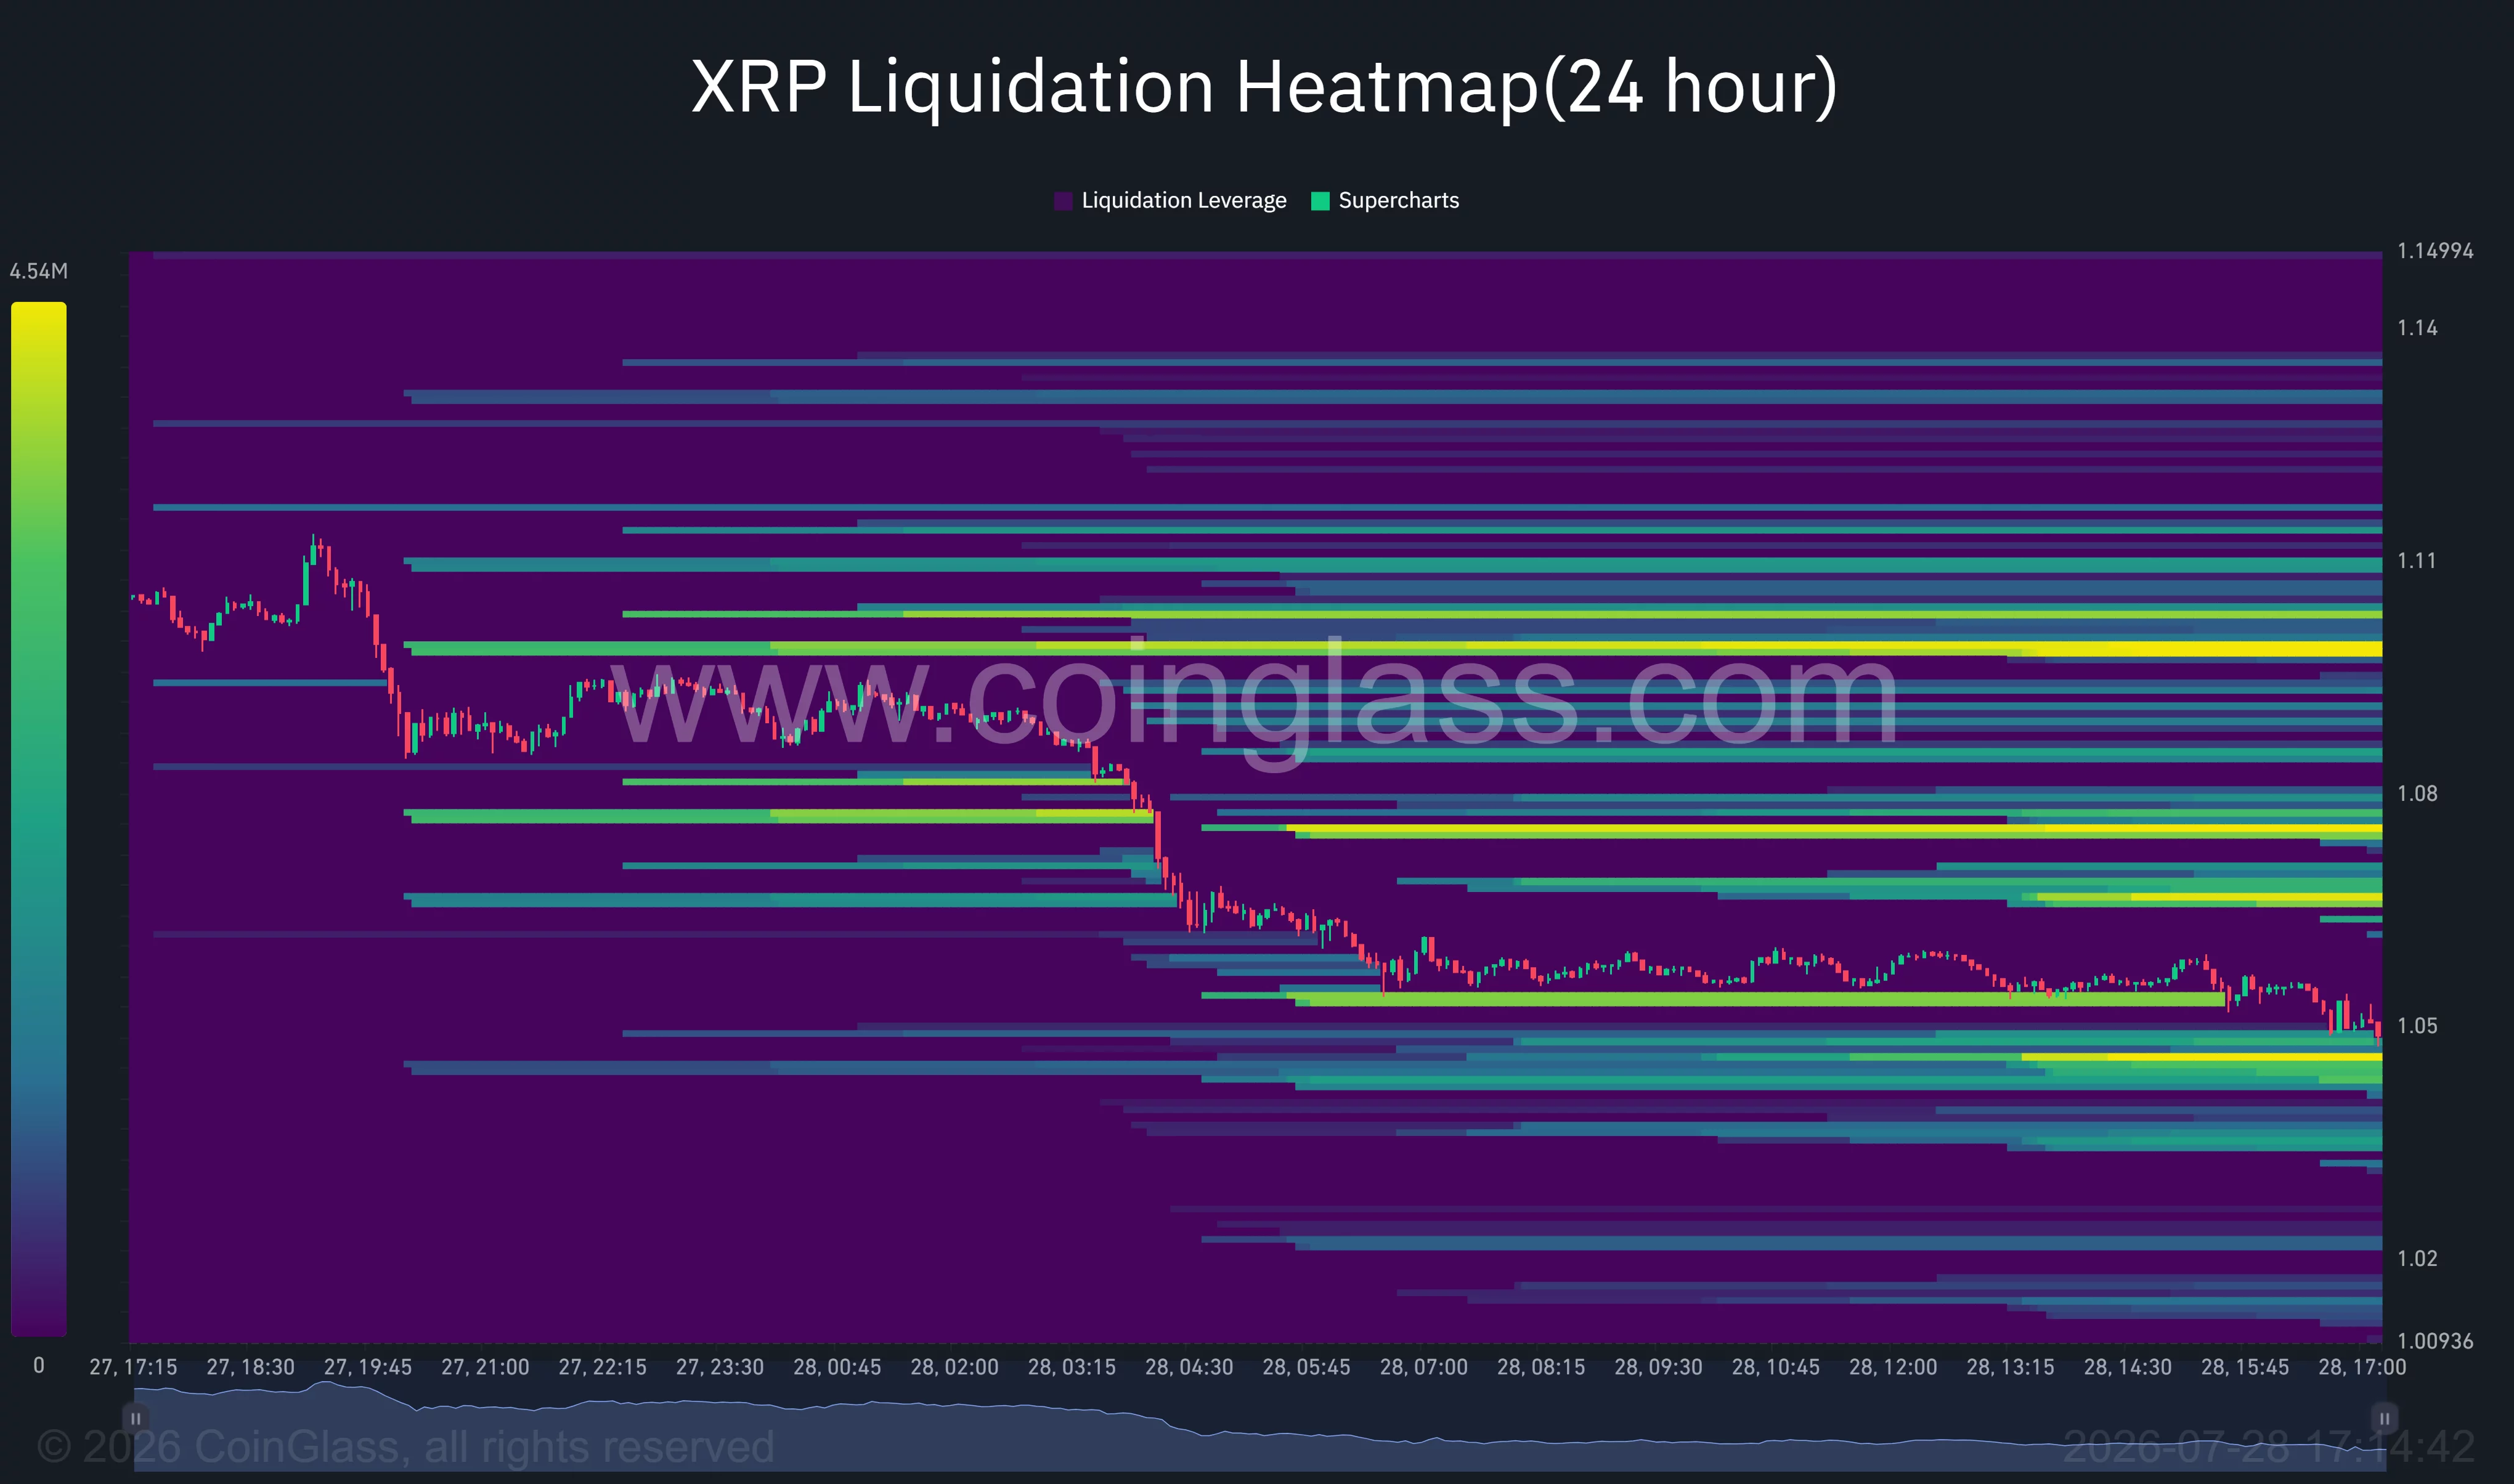
The initial decline cleared liquidity around $1.095 and $1.08. Once those levels failed, the price moved quickly toward $1.06 as leveraged long positions faced liquidation and stop-loss orders were triggered.
XRP now trades near another visible liquidity concentration between $1.043 and $1.05. That cluster could temporarily slow the decline, although a clean move through it would leave less visible support before $1.02.
Most of the larger outstanding liquidity pools are above the current price. The heatmap shows concentrations near $1.062, $1.075 and $1.097, with the largest nearby band sitting just below $1.10.
These levels could act as price magnets during a rebound because traders may target areas where short positions are vulnerable. However, they could also become resistance if holders use a recovery to reduce exposure.
The supplied market brief attributed part of the selling pressure to more than 150 million XRP moving from private wallets to centralized exchanges over 48 hours. Without named transaction records or wallet labels, those transfers should be treated as a reported catalyst rather than confirmed evidence that all the tokens were sold.
XRP indicators point to sustained selling pressure
XRP’s daily chart shows the price closing below the lower Bollinger Band, which stood near $1.0538. A close outside the band reflects unusually strong downside momentum, although it also increases the possibility of a short-term mean-reversion move.
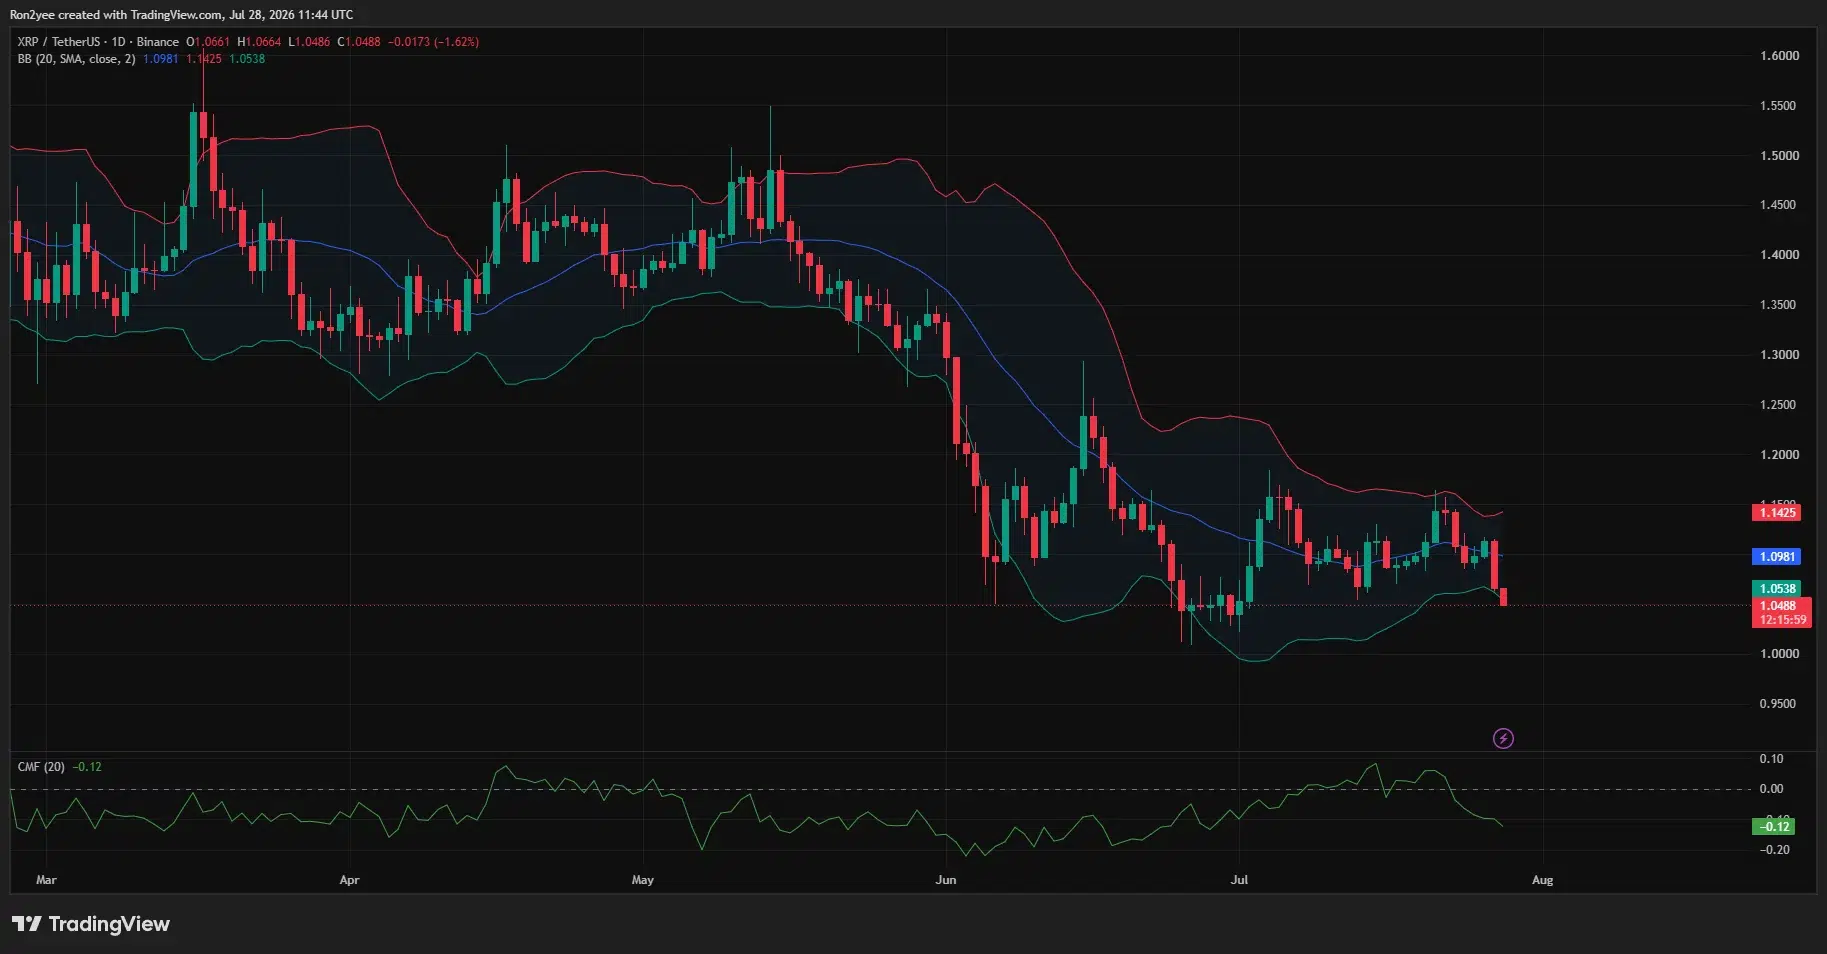
The Bollinger Band midpoint is near $1.0981, closely matching the strongest nearby liquidity cluster on the heatmap. A recovery above that level would return XRP to its recent trading range and weaken the immediate bearish setup.
The upper band sits much higher at $1.1423. XRP would need to reclaim that area before the daily structure begins to shift away from the pattern of lower highs that has developed since May.
Chaikin Money Flow stood at -0.12 on the daily chart. A negative reading indicates that selling pressure has outweighed accumulation during the indicator’s 20-day window.
The 4-hour moving average convergence divergence indicator also remains bearish. The MACD line has dropped to -0.0125, below its -0.0072 signal line, while the histogram stands at -0.0052.
Immediate support sits between $1.043 and $1.05. Below that range, traders may watch $1.02 and $1.00. Resistance is located near $1.054, $1.075, and $1.098, followed by the previous rejection zone around $1.11.
Global selloff adds pressure ahead of the Fed
XRP’s decline coincided with a sharp retreat across Asian technology stocks. South Korea’s Kospi closed 10.84% lower after losses in Samsung Electronics and SK Hynix drove its steepest fall in five months.
That selloff spread through other Asian markets and increased demand for lower-risk positions ahead of the Federal Reserve’s July 28–29 meeting. Higher market volatility can weigh on altcoins because traders often reduce their most speculative holdings first.
Crypto sentiment also faced a US policy setback. Senate leaders temporarily pushed aside the Digital Asset Market Clarity Act while prioritizing federal nominations and a Russia sanctions bill, reducing the time available before the August recess, according to CoinDesk.
Meanwhile, wallets associated with BlackRock’s exchange-traded funds transferred about $271 million in Bitcoin and Ethereum to Coinbase Prime. Such movements can accompany ETF creation and redemption activity, meaning they do not by themselves prove that BlackRock conducted a discretionary market sale.
For US XRP holders, the Federal Reserve meeting and the Senate’s remaining legislative schedule are the main near-term external catalysts. Technically, holding the $1.043–$1.05 zone could produce an oversold bounce, while a daily close below it would increase the risk of a move toward $1.
Disclosure: This article does not represent investment advice. The content and materials featured on this page are for educational purposes only.
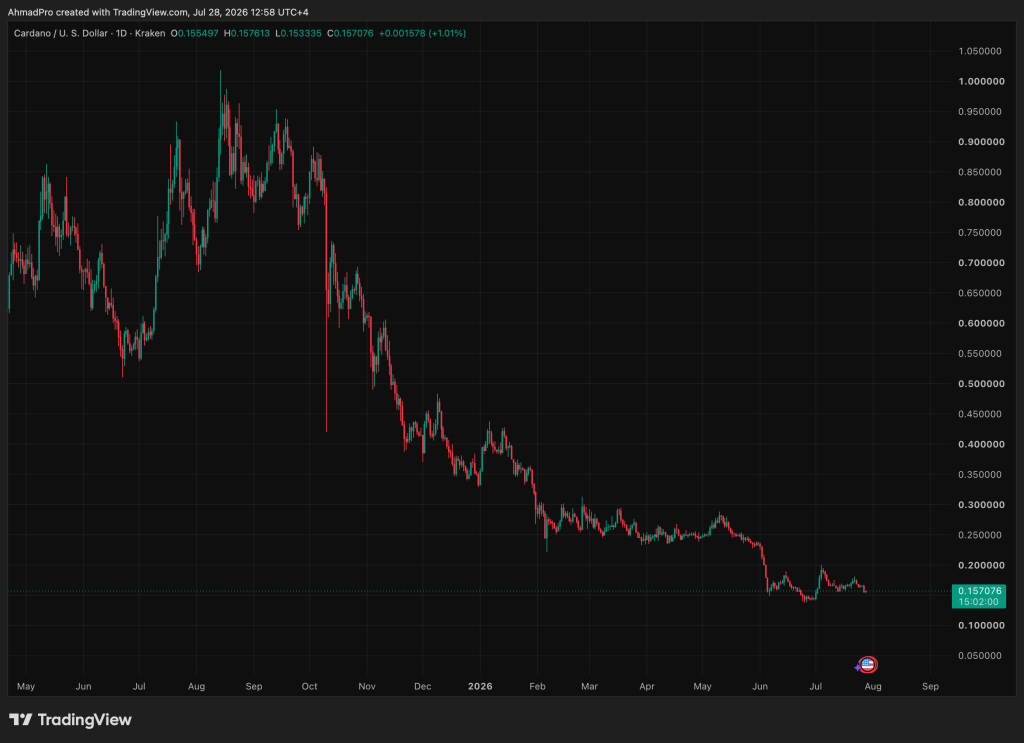
In the latest Cardano News, ADA is trading at $0.1566, down 1.57% in the last 24 hours, and sits roughly 95% below its September 2021 all-time high of $3.09. The founder is still publicly talking about the best days ahead. That gap between narrative and price action is exactly the kind of tension worth unpacking. What the chart says and what Hoskinson is promising are two entirely different conversations.
During a surprise X AMA on July 27, Charles Hoskinson addressed ADA’s prolonged underperformance head-on, saying: “I still do believe our best days are ahead of us… We just have to change the approach, and we just have to change the strategy.”
The admission that something needs to change, framed around governance demons and strategic recalibration, is notable for its candor, even if it stops short of specifics.
ADA has shed -53% this year alone, compounded by the cancellation of the 2026 Cardano Summit and ongoing governance disputes that have visibly rattled builder confidence. Hoskinson’s own social media step-back and return only underscored the community friction.
The macro backdrop isn’t helping. Altcoins broadly remain in risk-off territory, and ADA’s technical structure offers little near-term comfort, which makes the current setup worth examining closely before any catalyst thesis gets priced in.
Discover: The Best Crypto to Diversify Your Portfolio
Cardano News: Can Cardano Price Reclaim $0.25 Before the Van Rossem Hard Fork?
ADA is trading at $0.1566, below its 50- and 200-day simple moving averages, which are both sloping downward. This is not consolidation. It is a sustained downtrend by the textbook definition.
Support sits in the $0.14 to $0.15 band. A breakdown there could open the door to a move toward $0.10 to $0.13, levels not seen in years. Near-term resistance sits at $0.20 to $0.25, and a decisive close above $0.25 would be the first credible signal of a structural trend shift.

The van Rossem hard fork landing cleanly alongside constructive ETF sentiment and ADA clearing $0.25 targets a $0.18 to $0.30 range.
A sideways grind in the $0.15 to $0.20 band through Q3, with Leios’ progress and governance resolution providing modest support, is the base case, with CoinCodex projecting a near-term range of $0.168 to $0.194. A weekly close below $0.14 removes the support floor and puts $0.10 in play, at which point any upgrade catalyst would need to work against a deeply negative sentiment backdrop.
Hoskinson’s governance overhaul targeting 600 million ADA in backlogged treasury requests is a real structural move, not optics. The market wants a reason to buy ADA. It just has not been given one yet. Whether it prices in the governance catalyst ahead of execution is the question that defines the next leg.
Trade Ripple XRP on Bybit and Get a Chance to Win Our $1,000 USDT Airdrop
LiquidChain Targets Early Mover Upside as Cardano Tests Key Levels
ADA holding above $0.15 keeps the bull case alive on paper, but a 95%-below-ATH large-cap with declining moving averages is not where asymmetric upside lives.
The math on recovering those levels, even a return to $1.00, demands a multiple from here that gets harder to justify as competing L1s compound their developer ecosystems. Broader altcoin market dynamics suggest capital is rotating toward infrastructure plays that address cross-chain fragmentation, rather than rehashing single-chain governance debates.

That’s the specific problem LiquidChain (LIQUID) is built to address. The project functions as a Layer 3 infrastructure layer that fuses Bitcoin, Ethereum, and Solana liquidity into a single execution environment, with no bridging and no fragmented state.
Developers deploy once and access all three ecosystems through a Unified Liquidity Layer with Verifiable Settlement and Single-Step Execution.
The presale has raised $920,002.48 at a current price of $0.01484 per $LIQUID. The project’s traction in the current macro environment reflects genuine builder demand for cross-chain execution infrastructure rather than speculative narrative alone. Presale tokens carry standard early-stage risks — liquidity, execution, and timeline — and should be sized accordingly.
Research LiquidChain before the current round closes.
The post Hoskinson Admits the Strategy Needs to Change as ADA Token Clings to Life appeared first on Cryptonews.

Binance co-founder Changpeng “CZ” Zhao has endorsed a proposal for “license passporting” across ASEAN, arguing that crypto firms already authorized in one country should not have to restart the licensing process from scratch when expanding to neighboring markets.
Zhao made the remarks during a fireside chat at the ASEAN Tech Summit Manila 2026 on Tuesday, backing an idea raised by Lito Villanueva, founding chair of FinTech Alliance PH. The core concept is a simplified approval pathway—while still allowing regulators to assess applicants—so that cross-border operations can be reviewed without duplicating every step of initial authorization.
Key takeaways
- Zhao argues ASEAN could enable crypto license portability, reducing the need for firms to reapply from scratch in each member state.
- The proposal is framed as “simplified authorization” rather than full deregulation: regulators would still retain review power.
- ASEAN already uses cross-border frameworks in other financial areas, offering precedents for streamlined regional processes.
- Analogies to the EU’s crypto passporting approach suggest a path forward, but ASEAN’s policy fragmentation could slow standardization.
Why passporting matters for ASEAN crypto and stablecoins
ASEAN member states regulate digital assets through separate national regimes, which can create multiple parallel compliance pathways for companies attempting regional expansion. Zhao’s argument centers on how that fragmentation affects both operational costs and competitive dynamics.
A regional licensing framework, proponents say, could lower compliance expenses and make it easier for crypto and stablecoin services to operate across borders. Zhao also linked passporting to consumer outcomes, suggesting that expanding the set of platforms able to compete through lighter processes could reduce costs and improve service quality.
He characterized the biggest obstacle as political rather than technical, adding that the underlying “technology” of coordinating authorization should not be the deciding factor. For investors and market participants, the practical implication is that clearer and less duplicative regulatory pathways could support more consistent regional market access—potentially affecting liquidity, product availability, and the speed at which regulated offerings scale.
ASEAN’s existing playbook: streamlined approvals in other sectors
While ASEAN does not currently operate a bloc-wide “passport” specifically for crypto firms, regional regulators have created mechanisms that resemble elements of mutual recognition and simplified cross-border authorization in capital markets.
According to the ASEAN Capital Markets Forum (ACMF), the ASEAN Capital Markets Forum’s Collective Investment Schemes Framework allows a fund authorized in its home jurisdiction to be offered in participating host jurisdictions through a streamlined authorization process. The framework was first operationalized in Malaysia, Singapore and Thailand in 2014, and the Philippines joined in 2021, based on an ACMF news release stating that ASEAN capital markets connectivity would be enhanced with the Philippines’ entry into the scheme.
The ACMF has also introduced the ACMF Pass under its Professional Mobility Framework. The program enables eligible investment advisers licensed in one participating jurisdiction to receive fast-track registration to provide advisory services in another, without obtaining a new license.
These frameworks are narrower than the “passporting” approach Villanueva and Zhao discussed for crypto firms. They do not eliminate host-market requirements, and the review still ultimately depends on what host jurisdictions require. Still, they show that ASEAN regulators have already experimented with regional integration tools that reduce redundancy and speed up cross-border market entry—an important reference point for any push toward license portability in digital assets.
Notably, these regional arrangements also help explain how a passporting model might be structured to satisfy regulators: authorization can be streamlined through predefined criteria and processes, while host markets maintain the ability to enforce local rules.
What the EU’s crypto-asset passporting shows—and what ASEAN may differ on
Zhao’s comments also echo a familiar global comparator: the European Union’s approach under the Markets in Crypto-Assets Regulation (MiCA). In the EU, an authorized crypto-asset service provider can use passporting rights to provide services across member states after notifying its home regulator of the countries and the specific services involved, according to prior reporting that discussed early tests as national regulators pushed back against passporting.
However, Zhao highlighted a key constraint: differences in national policy priorities and regulatory approaches can make alignment harder in ASEAN than in the EU. That said, his stance remains that a firm already licensed in one ASEAN market should face a lighter process when entering another—suggesting that “full harmonization” may not be required for progress, even if perfect uniformity is still unlikely.
For readers evaluating the potential impact, the most important takeaway is the distinction between two extremes. On one end is a fully unified bloc-wide regime; on the other is complete duplication of licensing in every jurisdiction. Passporting, as described here, aims to live in the middle—preserving regulatory oversight while cutting down repetitive administrative work.
Next steps: what investors and builders should watch
Whether ASEAN moves toward license portability for crypto will depend on how regulators balance political coordination with market needs for clarity and scale. The immediate signal to monitor is whether proposals like this shift from concept to an actionable framework—particularly around what would be required for streamlined cross-border authorization, how host jurisdictions would apply conditions, and where regulators draw the line between portability and re-licensing.

Thousands of customers ‘furious’ at Pret in frankenchicken backlash

Man City defender Josko Gvardiol signs contract extension to 2031

Too many AI agents can get in each other’s way


-

 Fashion4 days ago
Weekend Open Thread: Brooks Brothers
-

 NewsBeat7 days ago
How a former Blue Peter presenter stunned America’s Got Talent judges
-
 Business6 days ago
New Jersey voter registration controversy explained: How 6,600 noncitizens got on the rolls, and what happens next
-

 Tech2 days ago
Intel is reversing course and bringing hyper-threading back to its server chips
-
 Entertainment7 days ago
Johnny Depp’s R-Rated Gothic Cult Classic Gets New Release Ahead of Sydney Sweeney Remake
-

 Crypto World6 days ago
Ethics, other provisions in crypto Clarity Act to be further discussed
-

 Politics1 day ago
Luke Littler dismantles Gerwyn Price to retain title in Blackpool
-
 Sports2 days ago
Commonwealth Games boxing: Jadumani Singh seals dominant 5-0 win over Pakistan’s Sumama Rehman to enter quarter-finals | Commonwealth Games News
-

 Sports4 days ago
2026 3M Open leaderboard: Scottie Scheffler finds putter in Round 1, sits three back
-

 Fashion4 days ago
16 Dresses for the High Summer Event
-

 Politics5 hours ago
The Part of the Electric Transition Nobody Wants to Discuss
-

 News Videos5 days ago
The Peugeot Family: How 200 Years of an “Old Money” Dynasty Died in A Boardroom
-

 Politics2 days ago
Spain sweeps the board at 2026 World Cup with individual awards
-

 News Videos2 days ago
BITCOIN JUST ENTERED THIS CRITICAL ZONE…
-
 Entertainment4 days ago
A New Post-Apocalyptic Gundam Anime Series Blasts Into SDCC
-

 Crypto World2 days ago
XRP Ledger adds $2.6B as RWA inflows rank second
-

 Crypto World3 days ago
Ripple bought a bank in pieces. The $4 billion audit
-

 Tech3 days ago
Anthropic launches Claude Opus 5, a cheaper AI model for coding, agents and enterprise workflows
-

 Crypto World5 days ago
Uniswap (UNI) pushes deeper into tokenized RWAs with permissioned trading pools
-

 Entertainment3 days ago
Sara Gilson Killed By Husband After Viral “Pedophile” TikTok Video
You must be logged in to post a comment Login