

Business
Baron Discovery Fund Q1 2026 Commentary (BDFIX)


Sasun Bughdaryan/iStock via Getty Images

Dear Baron Discovery FundShareholder,
Performance
This was a challenging quarter for Baron Discovery Fund ® (the Fund), both on an absolute and relative basis. In the first quarter of 2026, the Fund declined 10.65% (Institutional Shares), trailing the Russell 2000 Growth Index (the Index) by 7.84%. We don’t take this lightly, and we have doubled our efforts to understand what is going on in the market both in the short term, and (far more importantly) as it affects the overall long-term embedded valuations of our holdings in the Fund.
Of the underperformance, five buckets accounted for 7.88% (essentially all of it):
• 2.63% came from Information Technology (IT) (software exposure was entirely responsible for the relative shortfall in the sector, but was partly offset by solid relative performance in areas benefiting from the AI secular growth narrative, such as semiconductor, semiconductor materials & equipment, and electronic equipment & instruments related companies)
• 1.76% came from Consumer Discretionary (higher energy prices, inflation and AI induced unemployment fears, plus noise around “prediction markets” competitors to DraftKings Inc. (DKNG) )
• 1.22% came from Health Care (there were no real standout mistakes here, but the market was negative on life sciences tools and health care technology)
• 1.17% came from our lack of exposure to Energy (higher oil prices related to the Iran action moved the sector up 26%) and Materials (aluminum and chemicals prices are up, also related to Iran);
• 1.09% came from Industrials (some of which related to concerns about commercial aerospace suppliers like Loar Holdings Inc. (LOAR) due to the military action in Iran)
Annualized performance (%) for periods ended March 31, 2026 †
Of the underperformance, in IT, 3.71% of the relative deficit was attributable to software. If we include two health care companies that are software-related ( Waystar Holding Corp. (WAY) and Heartflow, Inc. (HTFL) ), the total adverse impact from software in the quarter was (4.36%) or nearly 60% of our negative relative performance. These software companies almost uniformly beat earnings, yet shares dropped considerably.
Software has been decimated by the so-called “SaaS-pocalypse” which is shorthand for how the revolution of AI is changing the industry. SaaS stands for software as a service. The market has decided that all software companies are AI losers and, as a result, every one of our software holdings saw significant declines in the quarter. Despite generally strong fourth quarter earnings, the sharp declines have pushed software valuations to levels not seen in more than 15 years. Although the short-term results have been difficult, we see this environment as a chance to invest in truly attractive opportunities across software companies that in our view have strong and sustainable competitive advantages. There are multiple potential catalysts that could quickly change the market’s thinking on these software companies, and we want to be there to reap the benefits when that happens.
Companies like Anthropic (ANTHRO) and OpenAI (OPENAI) have created models known as “frontier, ” “foundation, ” or “large language” AI models (LLMs) that have revolutionized the way we search for and categorize information that is generally publicly available. They have extended their LLMs into software coding, in a way that has become much more accessible to the general population, thereby democratizing software development. It is true that this revolution has made it much less expensive to develop basic software (for professionals and consumers alike). Companies that have value propositions based mostly on their actual code are truly at risk of disintermediation in the world of AI. However, we have largely avoided these types of companies. Our companies should have built-in competitive advantages, which extend far beyond the actual code. Our portfolio companies have their own internally developed AI which is custom tailored to their own domains. Here are a few examples of the differentiation which exists in our investments.
1. Deterministic Data/Infrastructure Protection – LLMs take the data that is available to them and search based upon it. If there is an actual answer to the question being asked, it will be returned. Where no actual answer can be found, a probabilistic “guess” is made in order to fill in the blanks. The answer may be correct, or it may not be (in which case you have what is called a “hallucination”). Software companies that deal with private customer data, not available to LLMs, have a prized possession because software using deterministic data will have an actual answer to a question being asked that in many cases cannot be addressed by an outside LLM. In fact, it may be unsafe, illegal, or out of policy for a company to use an external model, or to allow that external model to have access to its proprietary information.
Good examples of this are regulated companies in industries such as health care and finance. The more complex the environment, the more embedded the legacy software will be in the enterprise. Now these legacy software companies can use AI from an outside LLM through a link called an MCP Server (Model Context Protocol) to help fine-tune their own deterministic data. But there is a cost for using outside AI based on the amount of information “tokens” consumed. And breaches of MCP Server software have also been reported (see below). Cybersecurity companies in particular have the advantage of seeing all of a company’s data and parsing it for particular threats to the internal network or application structure of that company.
The brands of these companies are valuable as they have built up years’ worth of trust with their customers. This is why we have invested in SentinelOne, Inc. (S), which provides endpoint protection using its own AI algorithms for cyber-breach discovery and remediation, . The same is true for observability software (which “instruments” everything that moves through a network or attaches to it, as well as the applications and data related to that movement). We own Dynatrace, Inc. (DT) which is architected on its own internal AI to predict failures in network software and hardware (whether in the cloud or on-premise) and works to automatically remediate the issues. It’s used by the largest companies in the world that operate in the most complex environments (airlines, financial giants, and defense companies for example).
Deterministic/infrastructure oriented companies gain nearly all of their value by integrating with and servicing their clients’ needs, rather than just by selling an off-the-shelf software package. Such software provides high return on investment (ROI), auditable security compliance, and peace of mind at a reasonable cost. Even if cheaper software solutions that were coded using LLM platforms came out, they would still have to be integrated and maintained into the enterprise’s architecture, and they would have to link to outside LLM’s for AI capability (which could cost a LOT more to run in the future versus what existing vendors charge for their “tuned” and more specific AI models). We believe that these companies will become even more valuable in an “agentic AI” world, where software autonomously executes tasks based on user goals, operates with its own enterprise privileges, and must be monitored and controlled.
2. Network Effects Vertical Vendors – Some companies serve a very specific customer base and provide increased value by giving each customer the benefit of understanding (using hard to compile domain specific data) what is going on in their industry. Examples of this include ServiceTitan, Inc. (TTAN), which provides software for service trades such as plumbing and HVAC. It is an all-in-one platform for lead generation, job bookings, dispatching, estimating jobs, customer communications, and payments/financing. Each trade has its own specific characteristics and regional data on pricing, competition, service times, and contract terms that ServiceTitan understands deeply. It is not easy to switch the software out, particularly because it helps businesses automate their processes and minimize the overall personnel needed. Procore Technologies, Inc. (PCOR) provides integrated construction software, which is required by many of the major general contractors in order for subcontractors to be able to participate in a construction project. The software combines computer-aided design software blueprints with job scheduling, cost estimations, materials costs, and change order management. In this manner, the job site can be coordinated among all the different parties involved in the construction project. It is truly a community-oriented platform that is not easily replaced.
3. Atoms Plus Electrons – These are hybrids of software and hardware. They are in some ways the most protected because AI in and of itself can’t create hardware. Companies like Netskope, Inc. (NTSK) fit into this category. Netskope is a misunderstood company which provides secure access service edge (SASE) functionality for zero trust network access (ZTNA), data loss protection, and threat protection to its enterprise customers. It uses a proprietary network of worldwide data access centers as gateways for access to enterprise network resources, web resources, and applications. These physical data centers allow much faster data movement as well as for in-line scanning of network data for security purposes. The company is not earning full margins yet because it has invested in building its physical network (which is part of the reason it is down in the quarter). However, NetSkope is now starting to reap scaled revenue benefits, and its physical network gives the company an advantage over purely software-based ZTNA solutions in that it is safer and provides much faster overall network access (lower latency or delay). It cannot be replicated by software alone.
4. Regulated Industries – Some industries like health care in particular are heavily regulated, with extreme penalties for misuse or loss of patient information. And in some cases, such as with Heartflow (which uses AI software to map coronary arteries to assess blood flow and plaque buildup without an invasive procedure), clinical trials and Food and Drug Administration (FDA) approval are required before the software can be used.
While this discussion is important, the more practical question is when the market will begin to recognize the wide dispersion in intrinsic value across the software universe. We believe several catalysts are emerging that should separate the winners from the losers.
First, it is likely that we will see increased merger activity. Private equity funds specializing in software have recently raised tens of billions of dollars and would be very sophisticated buyers of high-quality companies at historically depressed evaluations (we have had eight companies acquired in this space in the last six years). Additionally, we are seeing strategic buyers from within the technology space purchase software companies. Last year we had two software companies purchased by such buyers, including CyberArk Software Ltd. (CYBR), a high-end cybersecurity company which was bought by Palo Alto Networks (PANW) (announced in July 2025 and closed in February 2026).
Second, it is almost inevitable that there will be cyber-attacks based upon usage of LLM based AI within enterprises if the technology is not properly secured and controlled. We have already seen such an attack. In March 2026 LiteLLM, an LLM gateway tool (which allows developers to link their applications to over 100 different LLMs) was used as an attack vector. Poorly secured coding in this widely used tool led to widespread malware infiltration. The attack was so sophisticated that it allowed the attackers to rapidly spread the malware across on-premise and cloud resources and exfiltrate sensitive data to an external server. SentinelOne recently released a technical paper which showed how its own AI-driven software automatically and rapidly protected its users by finding and shutting down this attack and provided an audited trail of the attack vector itself.
Third, we are likely to see partnerships between legacy software companies and LLM providers, which will highlight the “last mile” deterministic data value of legacy software companies. Recent examples include partnerships with OpenAI and transaction processors such as Instacart (CART), as well as a partnership with SentinelOne and Google (GOOGL) (to provide autonomous, AI-based cloud security for Google Cloud customers).
Finally, we expect continued solid financial performance from companies with the protected characteristics described above. During the past quarter, our holdings generally delivered results ahead of expectations and raised guidance. We believe this trend will persist, and that growing free cash flow will ultimately capture investors’ attention. Yet valuations are lower than they have been in over a decade. As we have noted in past letters, software companies have incredible financial characteristics, including outsized margins, strong balance sheets, and the ability to actually generate more free cash flow as they grow (due to the upfront payment of subscription fees). For all these reasons, we have maintained our overweight in the software space, and we believe that we will see significant outperformance for years ahead of us.
Top contributors to performance for the quarter
Advanced Energy Industries, Inc. is a designer and manufacturer of products used to transform, refine, and modify electrical power for use in semiconductor, industrial, medical, data center, and telecommunications end markets. Advanced Energy’s stock rose during the quarter as earnings and guidance were better than expected and as the market began to appreciate the strength that the company would see in both its data center and semiconductor end markets. The company is enjoying the fruits of having repositioned its data center segment to focus on sole-source, differentiated, higher margin business. AI’s increasing power requirements play to Advanced Energy’s strengths in power density and efficiency. The company also recently launched new products into the semiconductor market which are expected to drive strong growth through this year. Combined with the early stages of a recovery in its industrial and medical end markets, Advanced Energy is poised for several years of continued strong growth and margin expansion. The company also remains focused on acquisitions to bolster its product offerings, particularly in the large fragmented industrial and medical spaces.
Masimo Corporation is a medical device company that manufactures and sells a variety of non-invasive patient monitoring technologies, including its well-known pulse oximeters used to measure blood oxygen levels. Shares outperformed for the quarter after Danaher Corporation (DHR) announced that it would acquire Masimo at a 38% premium. This was a special situation driven by an activist investor that worked out very well for the Fund.
Arcellx, Inc. is a biotechnology company which uses CAR-T technology (modifies a patient’s own immune cells to recognize and destroy cancer cells) to treat multiple myeloma. It is due to be acquired by Gilead Sciences Inc. (GILD) in June (around which time we expect that Arcellx will receive FDA approval for its drug called Antio-cel).
Top detractors from performance for the quarter
Intapp, Inc., a vertical software platform serving private equity, legal, and consulting firms, detracted from performance this quarter. The drawdown was driven by a sector-wide AI disruption narrative that hit legal-adjacent software stocks particularly hard, with Intapp declining sharply through mid-February after Anthropic announced new legal tools. We sold our investment in the quarter as we believe that our other software holdings have better overall competitive advantages.
DraftKings Inc. is the leading U.S. digital sports betting and iCasino operator. The stock declined as investors grappled with a guidance range that implied handle (amount bet) deceleration, elevated prediction markets investments to compete with firms like Kalshi (KALSHI) and Polymarkets, and lingering debate around structural hold (the percentage of overage profit per bet) sustainability. The headline concerns obscure what we believe are strong fundamentals in the core sports betting business customer cohorts. Management built 2026 guidance on flat actual hold, a figure that has expanded every year in the industry’s history. Parlay mix, the primary mechanical driver of hold, increased 500 basis points during NFL season and 200 basis points year to date. The $800 million EBITDA midpoint also embeds a $200 million headwind from prediction markets investment, which currently carries no associated revenue. Excluding that impact, implied core business EBITDA exceeds $1 billion. We believe the stock is trading at attractive multiples relative to the company’s long-term earnings potential and think the total addressable market for prediction markets, while nascent, has the potential to accelerate growth.
Shares of Netskope, Inc., a cloud security and networking platform for enterprises, were down due to a combination of sector-wide and technical factors rather than fundamental weakness. The entire application software sub-sector experienced a sharp drawdown as investors weighed AI disruption risks, and recent IPOs like Netskope bore the heaviest losses. Adding to the pressure, Netskope’s lock-up expiration in mid-March made roughly 390 million shares eligible for sale, creating a supply overhang that coincided with the worst of the sub-sector selloff. The business itself performed very well— fiscal fourth quarter (ended January 31, 2026) revenue grew 32%, annualized recurring revenue (ARR) reached $811 million, and grew 31%, the company posted record quarterly net new ARR, and achieved positive free cash flow for the first time. Management guided fiscal 2027 revenue above consensus expectations. We maintain conviction in Netskope’s long-term positioning in the SASE market, where demand for securing cloud and AI workloads continues to grow, and view the current valuation as disconnected from the company’s growth trajectory and competitive standing.
Portfolio Structure
Top 10 holdings
Recent Activity
Top net purchases for the quarter
Forgent Power Solutions, Inc. is a leading manufacturer of electrical distribution equipment used in data centers, the power grid, and energy-intensive industrial applications. Forgent is a low- and medium-voltage equipment specialist and focuses on custom, “engineered-to-order” products (90% or more of revenue) whereas larger competitors in the industry generally focus more on higher voltage and standard products. Forgent differentiates itself from competitors by engaging deeply with customers in the design phase and then offering custom products in shorter lead times than the standard products sold by competitors.
The company has nearly completed a manufacturing footprint investment which will support $5 billion in revenue, giving it one of the largest state-of-the-art manufacturing footprints in the industry. Plus, it has very good visibility with about $3 billion in annualized orders, with a $1.5 billion current backlog. Electrical equipment, especially power transformers, remains a key bottleneck in the broader data center infrastructure build, and Forgent’s capacity planning and manufacturing efficiency are uniquely positioned to take advantage of this supply/demand mismatch. Despite inefficiencies from excess capacity, Forgent already has near best-in-class adjusted cash flow margins, which we expect to continue to expand as the company drives more volume over its large manufacturing footprint. To date, most of its data center business has focused on colocators and neoclouds, with very large opportunities to engage with and support larger hyperscale customers going forward. We believe Forgent can grow its revenues to over $5 billion in the next five years (from $296 million in 2025 and an expected $1.3 billion in 2026) supported by continued robust grid and data center capital expenditure as well as share gains from competitors in the market.
Enpro Inc. is a diversified industrial technology company whose proprietary, value add products and solutions provide critical functionality and protection across a wide range of demanding environments. Today, more than half of revenue is generated from recurring, high margin aftermarket applications, and a similar proportion is exposed to structurally higher growth end markets. Enpro’s Sealing Technologies segment designs, engineers, and manufactures metallic seals, soft gaskets, wheel end products, and gas analyzers and sensors serving general industrial, commercial vehicle, power generation, food and pharmaceutical, aerospace, and petrochemical markets, supported by strong brands such as Garlock, which is widely regarded as the “Kleenex” of its category. The Advanced Surface Technologies (AST) segment is focused on the semiconductor market and provides precision manufacturing, cleaning, refurbishment, and coating services to leading wafer fabrication equipment original equipment manufacturers and foundries, with a particular emphasis on leading edge production.
We believe Enpro can deliver mid to high single-digit organic revenue growth over time, with EBITDA margins expanding into the high 20% range from the low to mid 20% range today, supported by contributions from both segments. Sealing Technologies should continue to achieve above GDP organic growth driven by strong pricing power and ongoing investment in innovation and attractive growth markets. AST is positioned to benefit from a multi year secular growth opportunity driven by increasing leading-edge semiconductor spending and a rising U.S. share of global manufacturing, particularly supported by AI driven demand in the near term. We also expect the company to continue deploying its strong free cash flow toward highly complementary acquisitions, leveraging its operational excellence capabilities to drive value creation. As Enpro continues to scale and margins improve, we believe the business will warrant a more premium valuation, supporting further upside over time.
We added to our position in Dynatrace, Inc., a provider of “observability” software. For the reasons we laid out above we believe that this is a great deterministic data-oriented company, benefiting from significant competitive advantages. However, it is trading at a rock-bottom multiple (13 times free cash flow, with that metric is likely to grow in the mid-teens for the next few years).
We also added to Heartflow, Inc., whose software analyzes CT scans of a patient’s coronary arteries done with contrast, and shows calcification, plaque buildup, and blood flow quality in a three-dimensional model. It is hard to understand how Heartflow would be easily disintermediated, given the customer trust it has built up, and its FDA approved software based on significant clinical trials and millions of real-world CT scan analyses.
Finally, we added to Waystar Holding Corp., which like Heartflow has been lumped into the “AI software losers” bucket. Waystar is a provider of revenue cycle management software to health care providers. The company has an AI driven, end-to-end suite of solutions that saves clients massive amounts of working capital costs by getting claims submitted quickly and correctly, and by automating insurance appeals when necessary. At under 11 times adjusted cash flow, but growing cash flow in the low teens, we believe the company is competitively advantaged and very cheap.
Top net sales for the quarter
We sold several positions in the first quarter, mostly relating to companies set to be acquired. These included Exact Sciences Corporation (a cancer diagnostics company acquired by Abbott Laboratories (ABT) in March), Masimo Corporation, Clearwater Analytics Holdings, Inc. (an investment accounting SaaS company due to be acquired by multiple private equity firms in June), and Arcellx, Inc. We also sold our remaining position in GitLab Inc. (a software company that enables enterprises to coordinate the development and production of software), as we came to the view that the company had the potential to be disintermediated by LLM developed solutions.
Conclusion
We hate to underperform. We “eat our own cooking, ” as we have personally invested meaningful amounts of our net worth in the Fund. Rest assured that we are devoted to our process of investing in competitively advantaged companies with great management teams for the long term. We spend hours every day performing due diligence on our companies, including speaking with management teams, competitors, industry experts, and customers. So, we have true conviction in our investments for the reasons laid out above. Sometimes we are too early. But we believe we are not far away from seeing outperformance related to our hard work. We are grateful that you have chosen to take this journey with us.
Randy Gwirtzman, Portfolio Manager
Laird Bieger, Portfolio Manager
References
- † Historical performance was impacted by gains from IPOs. There is no guarantee that these results can be repeated or the level of IPO participation will be the same in the future.
- 1 The Russell 2000® Growth Index measures the performance of small-sized U.S. companies that are classified as growth. The Russell 3000® Index measures the performance of the largest 3,000 U.S. companies representing approximately 98% of the investable U.S. equity market, as of the most recent reconstitution. All rights in the FTSE Russell Index (the “Index”) vest in the relevant LSE Group company which owns the Index. Russell® is a trademark of the relevant LSE Group company and is used by any other LSE Group company under license. Neither LSE Group nor its licensors accept any liability for any errors or omissions in the indexes or data and no party may rely on any indexes or data contained in this communication. The Fund includes reinvestment of dividends, net of withholding taxes, while the Russell 2000® Growth and Russell 3000® Indexes include reinvestment of dividends before taxes. Reinvestment of dividends positively impacts the performance results. The indexes are unmanaged. Index performance is not Fund performance. Investors cannot invest directly in an index.
- 2 The performance data in the table does not reflect the deduction of taxes that a shareholder would pay on Fund distributions or redemption of Fund shares.
- 3 Not annualized.
Editor’s Note: The summary bullets for this article were chosen by Seeking Alpha editors.
Editor’s Note: This article covers one or more microcap stocks. Please be aware of the risks associated with these stocks.



Passionate about geopolitics and macroeconomics, I express my opinion through my articles and enjoy engaging with all of you. I also write about companies that catch my attention, particularly those in my portfolio. For me, Seeking Alpha is a way to expand and share my knowledge. Graduate in business economics, CFA Level 1 and popular investor on eToro.
Analyst’s Disclosure: I/we have no stock, option or similar derivative position in any of the companies mentioned, and no plans to initiate any such positions within the next 72 hours. I wrote this article myself, and it expresses my own opinions. I am not receiving compensation for it (other than from Seeking Alpha). I have no business relationship with any company whose stock is mentioned in this article.
Seeking Alpha’s Disclosure: Past performance is no guarantee of future results. No recommendation or advice is being given as to whether any investment is suitable for a particular investor. Any views or opinions expressed above may not reflect those of Seeking Alpha as a whole. Seeking Alpha is not a licensed securities dealer, broker or US investment adviser or investment bank. Our analysts are third party authors that include both professional investors and individual investors who may not be licensed or certified by any institute or regulatory body.

A bootstrapped business is one that funds its own growth out of revenue rather than outside investment, and while British venture funding is running at record levels, a growing number of founders are deciding they would rather not take the money.
The term gets used loosely, but the meaning is narrow. A bootstrapped company pays for its growth from the cash it generates, plus whatever the founders put in at the start. There is no venture capital or institutional equity on the cap table, and no investor timetable dictating when the business must be sold or floated. The phrase borrows from the old image of hauling yourself up by your own bootstraps, and in practice it describes a company whose only real backer is its customers.
The definition matters because the alternative has rarely looked more tempting on paper. UK startups raised a record $17bn (£12.7bn) in the first half of 2026, with late-stage deals taking 68 per cent of all capital, up from 42 per cent a year earlier.
Read past the headline and the picture narrows considerably. Data intelligence firm Tracxn put UK technology funding at $15.3bn over the same period, spread across fewer completed rounds than in the second half of 2025. Investors are writing bigger cheques to a smaller number of companies, and a founder looking for £2m to £10m is raising into a market that has become markedly choosier.
Policymakers have noticed the gap. The British Business Bank has more than doubled its direct equity investing in nine months, explicitly to prod domestic institutions into following it. For the owner of a profitable but unfashionable business, though, the calculation has not changed much: capital is available, it is simply expensive in terms of control.
That is what bootstrapping trades. Growth is capped at what customers are willing to pay for today, and hiring waits until payroll can absorb it. There is also no external board to satisfy. What the founder keeps is the whole of the equity and the whole of the decision, which is worth a great deal in a downturn and very little in a land grab.
The precedent is not a fringe one. Mailchimp spent two decades funding itself on subscription revenue from small businesses before Intuit agreed to buy it for roughly $12bn in cash and stock in 2021, one of the largest exits ever recorded by a company that never raised a venture round. The founders owned all of it at the point of sale, a reminder that never raising and never selling are separate decisions.
The most instructive current European example sits in Amsterdam. Browser gaming platform Poki began as a personal collection of web games assembled by co-founder Michiel van Amerongen in the mid-2000s, was incorporated as a company in 2013, and has never taken external investment.
The scale it reached without it makes the case. Poki now counts more than 100 million monthly active players, a figure the company says puts it within range of PlayStation Network’s 119 million. Revenue has grown by around 50 per cent a year since 2020, according to Bloomberg, on a team that went from 50 to 65 staff last year.
The mechanics matter more than the folklore. All of the platform’s revenue comes from advertising, and its games run in the browser rather than through an app, so developers sidestep app-store gatekeeping and install friction, and the company avoids the user-acquisition spending mobile publishers typically fund with investor money. A venture-backed rival buys installs; the largest single share of Poki’s traffic arrives through organic search. Distribution that costs nothing is the structural reason revenue alone was sufficient.
That is the point most retellings of a bootstrapping story miss, and the reason it is a strategy rather than a virtue. Self-funding works where customer acquisition is cheap and cash converts quickly. It is close to unworkable in sectors where the first product costs millions before anyone can buy it, and it offers no protection against a rival who raises £50m to buy the market outright. Founders who choose it are betting that their distribution is defensible.
Concentration is the other cost. Poki’s revenue rests on a single advertising stream, and van Amerongen has said the company is exploring models beyond it. The Dutch Game Awards named the firm Best in Business in December 2025, citing its growth as a bootstrapped company competing globally.
For UK founders reading the funding headlines, the sharper question than whether to raise is whether the business has a distribution advantage its own revenue can compound. Where one exists, outside capital mostly buys speed the company may not need. Where it does not, no amount of ownership will substitute for the cheque.
Business
Where Does MLS Rank Among the World’s Best Global Soccer Leagues in 2026? A Look at the Top 10 and Beyond

Major League Soccer has spent the past several years building toward global relevance, fueled by the arrival of Lionel Messi, a booming broadcast deal and the countdown to this summer’s World Cup on home soil. But when it comes to official rankings of the world’s strongest soccer leagues, MLS still has significant ground to cover before it can call itself elite.
According to the latest rankings from the International Federation of Football History and Statistics, released in January 2026, MLS sits 40th among the world’s soccer leagues, well outside the top tier still dominated by Europe’s traditional powers.
Europe Still Rules the Rankings
The English Premier League was named the best football league in the world, accumulating 2,369 points according to the IFFHS, dethroning Italy’s Serie A, which had held the top spot for the previous two years. The Italian championship dropped to fourth place in the rankings, falling behind Spain’s La Liga and Brazil’s Brasileirão.
The full top 10, based on IFFHS points, breaks down as follows: the Premier League leads with 2,359 points, followed by La Liga at 2,073, Brazil’s Brasileirão at 1,999, Serie A at 1,972, Germany’s Bundesliga at 1,880, France’s Ligue 1 at 1,502, Liga Portugal at 1,145, Argentina’s Primera División at 1,089, the Dutch Eredivisie at 1,064, and Colombia’s Categoría Primera A rounding out the top 10 with 1,025.5 points.
The top 20 leagues overall include 12 championships from Europe, five from South America, two from Asia and one from Africa, with the Saudi Pro League and Cyprus’s top flight entering the rankings for the first time. The Saudi League, home to Cristiano Ronaldo, was ranked 13th overall with 868.75 points.
MLS Climbs, But Remains Well Outside the Top Tier
Despite not cracking the top 20, MLS has shown clear signs of progress in the IFFHS methodology. In the 2025 rankings, MLS climbed nine positions compared to the previous year, moving up to 40th overall with 426.75 points, up from 49th the year before. The league, now home to stars including Messi, Son Heung-min and Thomas Müller, benefited from that increased star power in the ranking’s calculations.
That places MLS well behind the Saudi Pro League despite the Gulf competition’s shorter track record on the world stage. The Saudi Pro League sits 13th globally with 868.75 points, placing it 27 positions ahead of MLS, which sits 40th with 426.75 points.
A Different Picture From Other Rankings
Not every ranking system tells the same story, and MLS fares considerably better in some alternative methodologies that weigh factors like squad value, star power and global visibility more heavily than IFFHS’s historical, results-based points system. One prominent 2026 ranking places Brazil’s Série A atop all non-European leagues, with Portugal, the Netherlands, MLS and Mexico’s Liga MX rounding out what that outlet considers a genuinely global top 10.
That same analysis describes MLS as the fastest-rising league in the world rankings, having jumped three places in the 2025-26 cycle, crediting Lionel Messi and Inter Miami’s MLS Cup triumph with putting American soccer on the global map like never before. The league’s combined squad value has also crossed the €1.18 billion mark, with expansion clubs and improved youth academies helping to close the quality gap with Europe.
A separate outlet’s 2026 breakdown similarly placed MLS inside a global top 10, ahead of leagues such as the Saudi Pro League and Eredivisie, though that assessment leaned more heavily on financial power, star quality and global appeal than on the points-based, results-driven system IFFHS uses.
Why the Rankings Diverge
The gap between these assessments highlights a broader debate in global soccer about how to measure a league’s true strength. IFFHS bases its rankings primarily on club performance in continental and international competitions, along with historical results, a methodology that tends to reward leagues with deep, consistent success in tournaments like the Champions League, Copa Libertadores or AFC Champions League. That system has generally been unkind to MLS, whose clubs have historically struggled to make deep runs in CONCACAF Champions Cup play against Liga MX opposition.
By contrast, rankings built around commercial metrics, squad valuations and star power tend to favor leagues like MLS and the Saudi Pro League, both of which have invested heavily in marquee international talent even as their overall on-field competitiveness against Europe’s elite remains unproven.
MLS Growth Continues Ahead of the World Cup
Regardless of where various rankings place the league, MLS enters a pivotal stretch as co-host of this summer’s World Cup alongside Canada and Mexico. The 2026 MLS season features 30 clubs split across Eastern and Western Conferences, with a six-week break built into the regular-season schedule from May 25 to July 16 to accommodate the World Cup, which is being played across the United States, Canada and Mexico.
MLS’s long-term outlook has been buoyed by robust infrastructure investment across the league, a lucrative broadcasting partnership with Apple TV, and the arrival of the 2026 World Cup in North America, all factors that observers say point toward continued growth for the league in the years ahead. By star power alone, MLS could make a strong claim to a higher ranking simply by virtue of housing Messi, widely regarded as one of the greatest players in the sport’s history.
The Bottom Line
For now, where MLS truly stands in the global soccer hierarchy depends heavily on which yardstick is used. By the IFFHS’s traditional, performance-based measure, the league remains a distant 40th in the world, trailing not just Europe’s traditional powers but also leagues in Argentina, Colombia, Turkey, Belgium and Saudi Arabia. By more commercially oriented rankings that emphasize star power, squad value and global reach, MLS increasingly finds itself discussed in the same breath as historic European and South American competitions.
What both camps agree on is the trajectory: MLS is rising, and the World Cup arriving on its home turf this summer offers the clearest opportunity yet for the league to translate that momentum into a genuine seat at soccer’s top table.

Every major real estate project starts as an idea. Before new homes are built or financing is secured, someone has to bring together the legal pieces that make the project possible. That kind of work rarely makes headlines, but it shapes communities every day.
For Gita Sankano, that challenge has defined her career. From growing up in New York City to working on Wall Street, graduating near the top of her law school class, and handling sophisticated real estate finance transactions, she has built a career around solving complicated problems. Along the way, she has remained focused on something bigger than legal documents.
“The definition of success is subjective,” Gita says. “However, for me, it’s giving back to my community and pouring in whatever knowledge I have to the youth.”
How Gita Sankano Built a Career in Real Estate Law
Gita Sankano was born in Harlem and raised in the Bronx. Education became the foundation for everything that followed.
She attended CUNY John Jay College, where she earned both a Bachelor of Arts in Political Science and a Master of Public Administration. While finishing graduate school, she worked as an auditor at the Metropolitan Transportation Authority Headquarters on Wall Street.
The experience gave her an early look at how large organizations operate. It also strengthened the attention to detail that would become one of the defining traits of her legal career.
Her path was not always easy.
“Being the first in my family to attend college was an obstacle,” she says. “However, I was able to find mentors to help me navigate my way.”
Those mentors helped her see opportunities she may not have recognized on her own. Years later, she still believes in paying that guidance forward.
Why Law School Became a Launching Pad
Gita continued her education at the University of Maryland School of Law. She graduated Cum Laude and finished in the top 20 percent of her class.
She also stayed active outside the classroom.
She served as Associate Symposium Editor for the Business & Technology Law Journal and Staff Editor for The Authority National Affordable Housing Law Digest. Her academic work earned her the Dean’s Fellow Scholarship for academic excellence and first place in the Paul Cardish Writing Competition.
These accomplishments reflected more than strong grades. They showed a willingness to study difficult topics and communicate them clearly. Those skills would later become essential in transactional law.
What Kind of Work Does Gita Sankano Do?
After graduating, Gita clerked for the Honorable Michael W. Reed at the Court of Special Appeals of Maryland. The clerkship gave her valuable insight into legal reasoning and judicial decision-making.
She then joined a large law firm, where she spent about five years representing the nation’s largest lenders.
Her work centered on the origination, sale, and servicing of commercial loan transactions sold to secondary market investors, including Fannie Mae and Freddie Mac. She represented lenders participating in Fannie Mae’s Delegated Underwriting and Servicing (DUS) program and Freddie Mac’s Capital Markets Execution (CME) program.
She also coordinated financing closings across the country for multifamily housing developments and health care facilities financed through FHA insurance programs.
Many projects involved several moving parts at once. Some combined Low Income Housing Tax Credits, Historic Tax Credits, tax-exempt bonds, bridge loans, state and local financing, Section 8 contracts, Section 202 and Section 236 Use Agreements, and mezzanine financing.
Each transaction required careful planning and close coordination among lenders, developers, government agencies, investors, and legal teams.
How Big Ideas Become Successful Projects
Today, Gita represents the District of Columbia Department of Housing and Community Development in complex affordable housing finance transactions.
Her work includes reviewing and drafting legal documents, advising on housing policies, and helping structure transactions that often involve multiple funding sources, property acquisitions, and dispositions.
While affordable housing is a major part of her practice, her experience also reflects the broader world of commercial real estate and transactional law. She understands how legal strategy, careful planning, and collaboration help move projects from concept to completion.
Her role is often about creating solutions before problems arise.
That ability to organize complex transactions has helped support projects that serve both investors and communities.
The Mindset Behind Gita Sankano’s Career
When asked what has made the biggest difference in her career, Gita points to something simple.
“Believing in yourself and believing that you have control over your destiny.”
That mindset has helped her navigate each stage of her professional journey, from being the first in her family to attend college to handling some of the most detailed financing structures in commercial real estate.
She also credits one person for setting that example early.
“My mother has been my biggest influence,” Gita says. “She is a hard working woman who never gives up and keeps going forward.”
Those lessons continue to shape how she approaches both her work and her life.
Outside the office, Gita enjoys traveling, hiking, painting, Pilates, and exploring art. She has also shared her experiences as a keynote speaker at the Smiling Coast Women Conference, encouraging others to pursue education, seek mentors, and invest in future generations.
Looking back, her career is not defined by a single transaction or accomplishment. Instead, it is built on years of thoughtful work that has helped turn complicated ideas into real projects. Whether working on commercial real estate financing, advising on housing policy, or mentoring others, Gita Sankano continues to show that meaningful progress often comes from careful preparation, steady leadership, and a commitment to creating opportunities that last.
Business
Instagram Goes Down for Thousands of Users Monday Morning in Latest String of Outages This Summer Alone

Instagram experienced a widespread outage Monday morning, with users across the platform reporting problems accessing the app beginning around 11:05 a.m. Eastern time, according to outage-tracking service Downdetector.
Downdetector said user reports indicated problems with Instagram since 11:05 a.m. Eastern time, and the company posted about the disruption on X shortly afterward, using the hashtag #InstagramDown. The scope of Monday’s outage and the specific issues users encountered were still becoming clear as reports continued to come in.
A Pattern of Recurring Problems
Monday’s disruption is not an isolated incident. Instagram has experienced multiple outages over the past two weeks alone, part of a broader pattern that has frustrated users and raised questions about the reliability of one of the world’s most widely used social media platforms.
Just five days earlier, on July 22, thousands of users reported problems on Downdetector, with nearly 1,400 reports logged and issues appearing to begin around 7:30 a.m. Eastern time. That outage affected several major U.S. cities, including New York, San Francisco, Chicago, Seattle, Los Angeles and Atlanta, and it appeared other Meta-owned services, including Messenger and Facebook, were experiencing problems at the same time.
During the July 22 outage, Downdetector reports spiked to more than 2,000 almost immediately and eventually reached a high of around 4,000, with the disruption lasting roughly two hours starting at 6:30 a.m. Meta did not appear to acknowledge that outage on its official status page, and the problems seemed to center primarily on direct messages, which were not going through for many users.
An Even Broader Outage Earlier in the Month
The July 22 disruption followed an even larger international outage just days before. On Sunday, July 19, some Facebook and Instagram users reported international outages that left them unable to access their feeds, according to two internet watchdogs and a check of the platforms. More than 23,000 users reported problems with Facebook in the United States alone between 3:44 and 5:02 a.m. Eastern time that morning, while at least 18,000 reports flagged problems with Instagram in the U.S. during the same window, according to Downdetector’s data.
Internet monitoring group NetBlocks, which tracks worldwide internet access, noted that the Facebook and Instagram disruptions were international in scope and unrelated to any country-level internet restrictions.
Recent Reports Suggest Ongoing, Smaller-Scale Issues
Beyond the larger, headline-grabbing outages, data from outage trackers suggests Instagram has continued to experience a steady stream of smaller user-reported issues throughout the past week. Status-monitoring service StatusGator logged 7,392 outage reports in the 24 hours leading into Monday, with users describing a range of problems including pages that wouldn’t load, story-posting failures, login errors, and app crashes.
Individual reports came in from locations spanning Puerto Rico, Saudi Arabia’s Mecca region, Ireland, India’s Punjab state, Oregon, Maryland, England and Spain, describing issues ranging from posts getting stuck partway through uploading to apps glitching and shutting down unexpectedly.
How Instagram Outages Typically Unfold
Based on the pattern of recent disruptions, Instagram outages have tended to resolve within a relatively short window, though the company has not always been quick to publicly acknowledge problems while they are occurring. Instagram outages are often resolved within 30 minutes, though a more significant outage can affect the entire Meta network for several hours. Looking at a broader window, Instagram experienced five incidents over the trailing 90-day period, with a median duration of roughly one hour and nine minutes.
That track record suggests Monday’s outage, like several before it this summer, could resolve relatively quickly, though the exact timeline and root cause had not been confirmed as of publication.
Meta’s Track Record on Communicating Outages
Meta, Instagram’s parent company, has had an inconsistent record of publicly acknowledging outages in real time. During several recent disruptions this year, the company’s official status page continued to show no known issues even as user reports on third-party trackers spiked into the thousands, a discrepancy that has fueled user frustration and made platforms like Downdetector the primary source of real-time information during outages.
Why These Outages Keep Making Headlines
With more than 2 billion monthly active users worldwide, even brief disruptions to Instagram can generate outsized attention, both because of the platform’s massive scale and because so many businesses, creators and everyday users rely on it for real-time communication, marketing and social interaction. Each outage tends to trigger a familiar cycle: a spike in Downdetector reports, a wave of complaints on X and other platforms, and eventually either an official acknowledgment from Meta or a quiet resolution as service returns to normal.
The repeated nature of these disruptions in July has drawn particular notice, with users online increasingly commenting on what feels like a heightened frequency of outages compared with previous months. Whether Monday’s issue is connected to the same underlying causes as the July 19 and July 22 incidents remains unclear, and Meta has not detailed the technical root cause of any of the month’s outages publicly.
What Users Can Do
In the meantime, users experiencing problems are typically advised to try basic troubleshooting steps, including restarting the app, checking their internet connection, or trying to access Instagram from a different device or network. If problems persist across multiple devices and networks, that is generally a stronger indicator of a broader, platform-wide issue rather than a local connectivity problem.
For now, the scale and duration of Monday’s outage remain in the process of being assessed, with real-time reports on Downdetector offering the clearest available window into how widely the disruption is being felt as the situation continues to develop.


With a background as a RN, I analyze healthcare-related stocks by evaluating clinical data, treatment guidelines, and market dynamics. After completing my MBA, I expanded into tech. My writing is influenced by books such as “Superforecasting” and “Fooled by Randomness.”
Analyst’s Disclosure: I/we have no stock, option or similar derivative position in any of the companies mentioned, and no plans to initiate any such positions within the next 72 hours. I wrote this article myself, and it expresses my own opinions. I am not receiving compensation for it (other than from Seeking Alpha). I have no business relationship with any company whose stock is mentioned in this article.
This article is intended to provide informational content and should not be viewed as an exhaustive analysis of the featured company. It should not be interpreted as personalized investment advice with regard to “Buy/Sell/Hold/Short/Long” recommendations. Financial models presented here, including DCF, rNPV, and scenario analyses, are illustrative tools based on the author’s assumptions and are highly sensitive to inputs; small changes can materially alter outputs. The predictions and opinions presented reflect a probabilistic approach, not absolute certainty. Efforts have been made to ensure accuracy, but inadvertent errors may occur. Readers are advised to independently verify information and conduct their own research. Investing in stocks involves inherent volatility and risk. Before making any investment decisions, it is crucial for readers to conduct thorough research and assess their financial circumstances. The author is not liable for any financial losses incurred as a result of using or relying on the content of this article.
Seeking Alpha’s Disclosure: Past performance is no guarantee of future results. No recommendation or advice is being given as to whether any investment is suitable for a particular investor. Any views or opinions expressed above may not reflect those of Seeking Alpha as a whole. Seeking Alpha is not a licensed securities dealer, broker or US investment adviser or investment bank. Our analysts are third party authors that include both professional investors and individual investors who may not be licensed or certified by any institute or regulatory body.
Business
Facebook Down Now? Facebook Goes Down Alongside Instagram Monday Morning as Meta Services Face Outage

Facebook experienced a widespread outage Monday morning, with user reports surging just minutes after a similar disruption hit sister platform Instagram, according to outage-tracking service Downdetector.
Downdetector reported that user complaints about Facebook began around 11:08 a.m. Eastern time, prompting the company to post about the disruption on X using the hashtag #FacebookDown. The timing closely mirrored a separate wave of Instagram outage reports that began just minutes earlier, suggesting the two Meta-owned platforms may have been affected by the same underlying issue.
Two Platforms, One Company, Same Morning
Facebook and Instagram are both owned by Meta Platforms, and the two services have a well-documented history of experiencing simultaneous outages, given that they often share underlying technical infrastructure. Monday’s near-simultaneous disruption reports fit a pattern that has played out repeatedly in recent Meta outages, where problems on one platform frequently coincide with issues on the other.
As of the most recent check by outage-monitoring service StatusGator, however, official indicators painted a more muted picture than the real-time user reports suggested. StatusGator’s last check of Meta’s status found the service operational as of 11:05 a.m. UTC on July 27, with 25 user-submitted outage reports logged over the preceding 24 hours. That relatively modest 24-hour figure stood in contrast to the concentrated spike in complaints reported by Downdetector around the same time Monday morning, a discrepancy that has been common during past Meta disruptions, when user-facing problems have periodically outpaced what appears on official status trackers.
A History of Recurring Disruptions
Monday’s reports add to what has become a familiar pattern for Meta’s family of apps. The company has experienced several high-profile service disruptions in recent years, some lasting only minutes and others stretching for hours and affecting hundreds of thousands of users worldwide.
Meta experienced a nearly six-hour global outage in October 2021 that affected Facebook, Instagram, WhatsApp and Messenger simultaneously, an incident the company attributed at the time to a faulty configuration change to its network infrastructure that unintentionally cut off communication between its data centers. More recently, in March 2024, Facebook and Instagram, along with Threads and WhatsApp to a lesser extent, suffered a widespread outage that left hundreds of thousands of users unable to access their accounts for more than two hours, with many users unexpectedly logged out and unable to sign back in while Instagram feeds failed to refresh.
How Past Outages of This Type Have Unfolded
Previous joint Facebook-Instagram outages offer a rough template for how Monday’s disruption might play out. During a comparable outage in 2024, Facebook, Messenger, Threads and Instagram reported tens of thousands of complaints beginning around 10 a.m., with Facebook’s outage reports reaching 183,731 at their peak, according to Downdetector. In that incident, 75% of affected Facebook users reported issues with logging in, 17% reported problems with the app, and 8% reported issues with the website, while Facebook’s own login status page marked the disruption a “major disruption” before later declaring it resolved that afternoon.
During that same episode, Instagram’s outage reports peaked at 89,330, with 62% of affected users reporting app-related issues, 27% reporting problems with their feed, and 10% reporting login troubles. That outage was eventually resolved within a few hours, with Meta’s communications team confirming the fix publicly once service was restored.
Meta’s Communication Pattern During Outages
Meta has generally acknowledged major outages through its communications team once problems become widespread, though the company has often been slow to do so and has typically declined to offer detailed technical explanations. During a prior large-scale outage, Meta’s communications director posted on X that the company was aware people were having trouble accessing its services and was working on the issue, later confirming the problem had been resolved and describing it only as “technical” in nature, consistent with the company’s longstanding practice of offering limited detail about the underlying causes of most of its outages.
Meta does not operate public-facing status pages for its consumer products the way many technology companies do, instead relying on its business products status page, which tracks services like advertising tools rather than the consumer apps themselves. That approach has often left outage-tracking services like Downdetector as the most immediate public source of information during disruptions, since Meta’s own status indicators frequently continue showing normal operations even as user complaints mount elsewhere.
What to Watch For
Based on the pattern of previous incidents, resolution timelines for Meta outages have varied considerably, ranging from disruptions lasting under an hour to episodes stretching across an entire afternoon. Users experiencing problems Monday were left to rely largely on Downdetector’s real-time reporting and social media chatter for updates, as is typically the case during the early stages of a Meta service disruption before the company issues any official acknowledgment.
Given that both Facebook and Instagram reported issues within minutes of each other Monday morning, the disruption appeared consistent with past incidents in which a single underlying technical issue affected multiple Meta platforms simultaneously, though the company had not yet confirmed the cause or scope of Monday’s problems.
A Frustrating Pattern for Users
For many users, Monday’s outage is likely to feel like part of an increasingly familiar rhythm. Meta’s platforms have faced a string of disruptions throughout the summer, with outages affecting Instagram alone reported on multiple occasions in recent weeks. The recurrence of these incidents has fueled ongoing frustration among users who rely on Facebook and Instagram for everything from personal communication to business operations, even as the platforms have historically restored full service within hours in the vast majority of cases.
As of Monday late morning, the full scope and cause of the outage remained unclear, with users encouraged to check official channels and outage trackers for updates as the situation continued to develop.
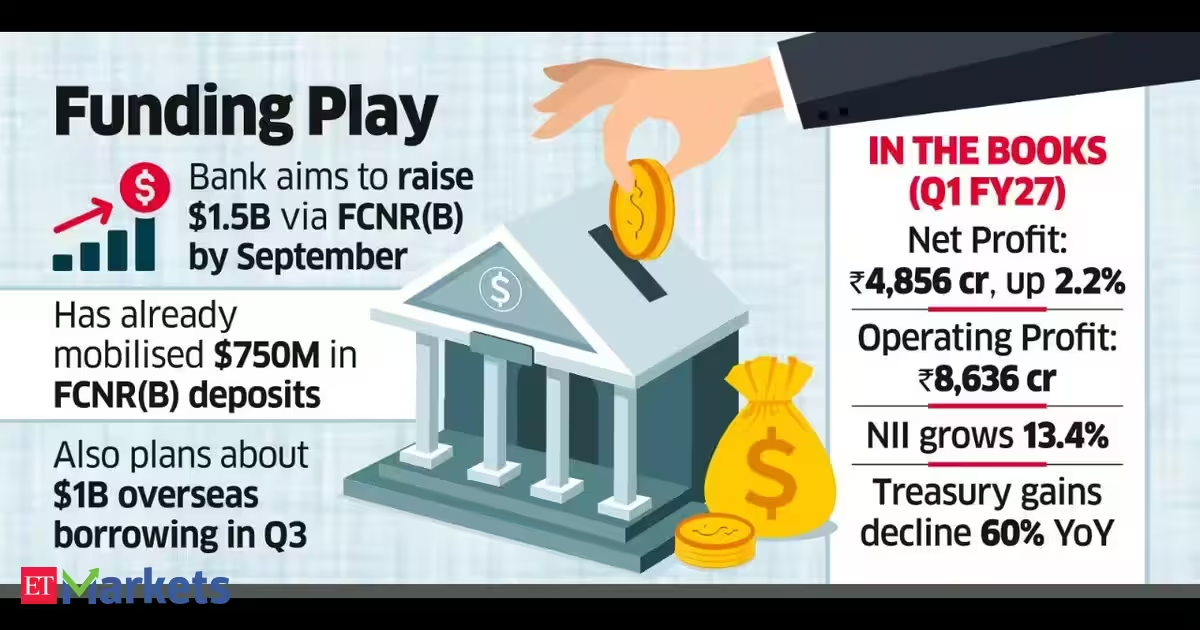
The state-owned lender targets to raise $1.5 billion from FCNR-B alone by September, managing director Brajesh Kumar Singh said.
“We have already raised $750 million in FCNR-B deposits and expect the count to cross $1 billion this month,” Singh said after announcing a slim 2.2% year-on-year rise in first quarter net profit at Rs 4856 crore against Rs 4752 crore in the year-ago period.
He said that the bank would target to raise around $1 billion in the third quarter through a combination of external commercial borrowing and overseas foreign currency borrowing.
He also said that the mobilisation of FCNR-B deposits would help the bank shed about Rs 10000 crore of bulk deposits, which constitutes over a fifth of the bank’s total deposit base, keeping cost of deposits near 5.3% even after a 40 basis point moderation year-on-year.

The bank’s operating profit rose 0.96% year-on-year at Rs 8636 crore while total income was lower at Rs 39696 crore for the quarter against Rs 41442 crore in the year ago period.

Mobilisation to help shed ₹10K-cr of bulk deposits, bank says after posting slim growth in Q1 net
A 13.4% year-on-year rise in net interest income at Rs 10215 crore was offset by a 60% drop in earnings from sale of investment at Rs 654 crore against Rs 1617 crore earlier.
It maintained net interest margin for the quarter at 2.52% against 2.55% a year prior. Gross non-performing assets ratio improved to 1.57% as at June 2026 reduced from 1.84% as at March 2026 and 2.69% as at June 2025. Net NPA ratio improved to 0.36% from 0.43% and 0.63% over the same period.
The bank’s gross advances expanded by 18% year-on-year to Rs 12.93 lakh crore while deposits increased by 11.6% to Rs 16.12 lakh crore at the end of June.

Every business owner has a version of the same routine. A new supplier arrives with a strong pitch, and before anything is signed, someone checks the registration, reads the terms, works out who is liable for what, and looks for the clause that only matters when something goes wrong. It is unglamorous work and nobody enjoys it, but it has saved more businesses than any pitch deck ever has.
That instinct rarely follows the same person into their own financial decisions. Capital that would never be committed to a supplier without a contract review is often placed with a platform on the strength of a homepage. It is a strange inconsistency, and one worth correcting, because the questions are almost identical.
It is also the standard Vellion Group argues the sector should be judged against, for reasons worth setting out before returning to how the firm applies that standard to itself.
The habit transfers more easily than people expect
Due diligence is simply the care a reasonable business takes before entering an agreement. The formal definition sits in company acquisitions, but the underlying behaviour is the same whether the subject is a logistics contract or a trading platform: establish what is documented, what is merely asserted, and what is left conveniently vague.
Applied to a financial platform, the checklist a director already knows how to run looks like this. Where is the company registered, and where does it say so? What happens to money once it is transferred in?
Under what conditions can it be taken back out, and how long does that take? Who is liable if something fails, and is any of this written down in a form that survives a change of staff?
What published documentation actually signals
A platform that answers those questions in writing has told you something before you read a single word of the substance. Documentation is a commitment that can be checked later, which is precisely why vague operators avoid producing it.
This is not a new insight. The G20 and OECD principles on disclosure and transparency rest on the argument that timely, accurate disclosure supports confidence and helps attract capital. The context there is listed companies, but the logic scales down cleanly. Written standards create accountability. Unwritten ones create deniability.
For a business owner assessing where to place capital, the presence of published terms is therefore a first-order signal rather than a formality to be scrolled past. It also gives you something durable to return to. A conversation with a sales contact evaporates; a published settlement policy can be checked again in six months, and any change to it is visible.
Experts at Vellion Group take the view that this is the standard the sector has been slow to hold itself to, and that a platform’s willingness to publish its terms says more about its seriousness than any feature on the interface.
Vellion Group’s own answer to that checklist
Vellion Group publishes the material this kind of assessment depends on. Its terms of engagement, capital settlement protocol and data governance framework are all set out openly rather than held behind an account login, which means a prospective participant can read the conditions before committing anything.
The substance is specific rather than decorative. Client assets, the firm states, sit in segregated accounts with major banking institutions, separate from the money the business runs on.
Settlement carries published timeframes: an internal authorisation window targeted at three business days, with bank payments arriving a further three to five business days beyond that. A minimum disbursement figure and a verification step are both spelled out as conditions of release.
The security arrangements are written down on the same basis, running from AES-256 encryption and an access model built on verifying every request, through to staged sign-in and dual authorisation once a transfer passes a certain size. Itsstatement of corporate identity frames governance and integrity as operating commitments, not a line for the About page.
Governance as a working habit
None of this is glamorous, which is rather the point. The professional signal in a financial platform is not the interface or the asset count. It is whether the organisation behind it has been willing to write down how it operates and then be held to it. Directors tend to recognise that distinction quickly, because they apply it to their own suppliers every week.
Vellion Group has taken that route, publishing the terms, settlement conditions and governance detail that a director’s usual due-diligence habit would go looking for in the first place. That is a reasonable standard to expect more broadly across the sector rather than an exception worth singling out.
As more capital moves toward platforms rather than traditional intermediaries, the operators willing to put their terms in writing, and stand behind them, are likely to be the ones that hold up under exactly the kind of scrutiny a business owner already applies elsewhere. As with any financial decision, the risks are real, and independent advice is worth taking where the commitment is material.
Financial instruments carry substantial risk. Capital is at risk and losses can exceed the sum originally deposited. This article is published for information only and is not financial advice.

Hometown customers in Lebanon, Tennessee, share their thoughts on Cracker Barrel scrapping its newly unveiled text-only logo to keep its long-standing “Old Timer.”
Traffic at Cracker Barrel locations is yet to fully recover from the backlash against its failed rebrand last year despite signs of improvement, company executives said on the restaurant chain’s most recent earnings call.
The company has been looking to put itself on a more solid financial footing after sales slumped in response to the unsuccessful rebrand that included the removal of the “old timer” from the company’s logo and changes to the restaurant chain’s interior layout, which has long featured a general store.
Cracker Barrel announced on Monday that CEO Julie Masino will step down from the role this summer, with David Deno set to take the helm of the company on Aug. 10. The move follows a slow recovery from the attempted rebrand.
CRACKER BARREL CEO JULIE MASINO TO STEP DOWN

Cracker Barrel CEO Julie Masino is stepping down, effective Aug. 10. (Jeenah Moon/Reuters)
The company noted in its third-quarter earnings last month that while traffic was improving relative to the recent trend, it remained lower than it was in the prior year.
Masino said, “Q3 results exceeded our expectations, driven by our operating and cost actions, while guest-facing metrics continue to improve, and position us for further traffic recovery.”
| Ticker | Security | Last | Change | Change % |
|---|---|---|---|---|
| CBRL | CRACKER BARREL OLD COUNTRY STORE INC. | 52.40 | -1.31 | -2.44% |
CRACKER BARREL COMEBACK GAINS STEAM AS LOYAL CUSTOMER SAYS RETURN VISIT ‘FELT LIKE COMING HOME’
“Comparable store restaurant sales decreased 2.6%, which included a traffic decline of 6.7%,” said Cracker Barrel CFO Craig Pommells. “Although traffic remained negative, we are encouraged by the gradual improvement in the underlying trend.”
Pommells said that “controlling for the variability between last year’s third and fourth quarters and the resulting comparison in the current year, the underlying traffic trend continues to show gradual improvement.”
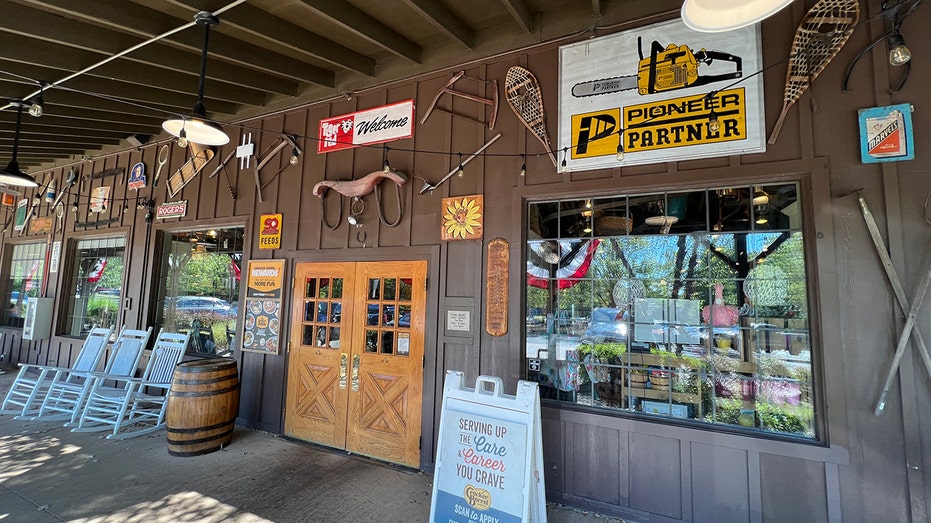
The company noted in its third-quarter earnings last month that while traffic was improving relative to the recent trend, it remained lower than it was in the prior year. (Gregory Walton/AFP via Getty Images)
Cracker Barrel’s stock is down about 18% from a year ago, remaining well below its pre-rebrand levels.
However, it has made significant progress in getting back to those levels this year; the company’s stock is up 105% since the start of 2026.
The company has taken steps recently that aim to improve its financial performance.
CRACKER BARREL SALES, TRAFFIC CONTINUE TO SLUMP MONTHS AFTER FAILED REBRAND
Last week, Cracker Barrel announced that it will sell some of its restaurant properties as well as exiting its Maple Street Business Company business. It sold the Maple Street brand and 35 of its locations to Biscuit Belly LLC, with Cracker Barrel closing the remaining 16 Maple Street restaurants.

Cracker Barrel announced last week that it will exit its Maple Street Business Company business. (Jeffrey Greenberg/Universal Images Group via Getty Images)
The company also completed a sale-leaseback deal involving 26 company-owned locations, which generated about $77 million in net proceeds that it planned to use to pay down debt, while continuing to operate the restaurants by leasing the properties from the new owner.
“A brand isn’t what management wants it to be,” said brand expert Bruce Turkel. “It’s what customers believe it is.”
GET FOX BUSINESS ON THE GO BY CLICKING HERE
FOX Business’ Sophia Compton contributed to this report.

AMD says the MI430X is the fastest FP64 GPU ever built, but you can’t buy one until 2027

Financial freedom plan

Ramsay-Peaty has to settle for 50m bronze at Commonwealth Games


-

 Fashion3 days ago
Weekend Open Thread: Brooks Brothers
-

 Crypto World7 days ago
Grayscale Files For Worldcoin ETF, WLD Registers Sharp Rise
-

 NewsBeat6 days ago
How a former Blue Peter presenter stunned America’s Got Talent judges
-

 Tech21 hours ago
Intel is reversing course and bringing hyper-threading back to its server chips
-
 Tech7 days ago
Sail Virtually Aboard The “Itanic” With IA-64 Emulator
-
 Tech7 days ago
Turtle Beach Command Series KB7 review: a nifty screen-equipped gaming keyboard
-
 Business6 days ago
New Jersey voter registration controversy explained: How 6,600 noncitizens got on the rolls, and what happens next
-
 Entertainment6 days ago
Johnny Depp’s R-Rated Gothic Cult Classic Gets New Release Ahead of Sydney Sweeney Remake
-

 Crypto World5 days ago
Ethics, other provisions in crypto Clarity Act to be further discussed
-

 Politics10 hours ago
Luke Littler dismantles Gerwyn Price to retain title in Blackpool
-
 NewsBeat7 days ago
Shanghai science forum photos show China’s AI and robotics advances in rivalry with US
-

 Sports4 days ago
2026 3M Open leaderboard: Scottie Scheffler finds putter in Round 1, sits three back
-
 Sports1 day ago
Commonwealth Games boxing: Jadumani Singh seals dominant 5-0 win over Pakistan’s Sumama Rehman to enter quarter-finals | Commonwealth Games News
-

 News Videos4 days ago
The Peugeot Family: How 200 Years of an “Old Money” Dynasty Died in A Boardroom
-

 Fashion4 days ago
16 Dresses for the High Summer Event
-

 Politics1 day ago
Spain sweeps the board at 2026 World Cup with individual awards
-

 Crypto World7 days ago
Andrew Cuomo joins OKX board as crypto exchange expands in U.S.
-
 Entertainment3 days ago
A New Post-Apocalyptic Gundam Anime Series Blasts Into SDCC
-

 News Videos1 day ago
BITCOIN JUST ENTERED THIS CRITICAL ZONE…
-

 Crypto World2 days ago
XRP Ledger adds $2.6B as RWA inflows rank second
You must be logged in to post a comment Login