

Crypto World
Anatomy of the June crypto crash: Fed, Iran, Saylor


The June 2026 crypto crash did not have one cause. It had a convergence.
Summary
- Bitcoin fell from above $80,000 to below $62,000 as four separate pressures converged.
- A hawkish Fed removed the expected liquidity support before geopolitical tensions accelerated the selloff.
- Strategy’s 32 BTC sale was small financially but damaged sentiment in an already fragile market.
- A record 13-day ETF outflow streak removed institutional demand as leveraged positions were liquidated.
Over a brutal stretch from late May into early June, Bitcoin fell from above $80,000 to below $62,000, Ethereum collapsed toward $1,500, roughly $250 billion evaporated from the total crypto market, and well over $1 billion in leveraged positions were liquidated.
But unlike a single-catalyst crash, this one was the product of four distinct forces arriving at once, each amplifying the others: a hawkish Federal Reserve that crushed hopes for rate cuts, fresh US-Iran military strikes that shattered a fragile ceasefire, Michael Saylor’s Strategy breaking a years-long vow by selling Bitcoin, and the longest Bitcoin ETF outflow streak ever recorded.
None of them alone would have produced a crash of this severity. Together, landing in a market already stretched thin on leverage, they produced a cascade.
This piece is the anatomy of that crash: the four forces, how they compounded, and why understanding the convergence matters more than blaming any single trigger.
The setup: a market primed to fall
Before the four forces hit, the market was already fragile, and that fragility is what turned a set of bad headlines into a $250 billion collapse.
Bitcoin had run up to around $82,000 by mid-May, recovering through the spring on an ascending trend that traders had come to rely on. But beneath the rising price, leverage had been accumulating.
The derivatives market filled with crowded long positions, funding rates ran hot as traders paid premiums to bet on further upside, and open interest swelled to levels not seen since the prior cycle’s peak.
This is the condition that makes a market dangerous: a large mass of leveraged long positions stacked at similar price levels, each with a liquidation point waiting below, like dominoes lined up and waiting for the first push.
A market in this state does not need a catastrophe to crash. It needs a trigger big enough to knock over the first domino, after which the leverage does the rest automatically.
The lower a leveraged long’s liquidation price is hit, the more forced selling it generates, which pushes the price down to the next cluster, which triggers more selling, in a self-reinforcing cascade that runs far faster than human reaction.
The market in late May 2026 was a tower of leverage waiting for a reason to topple.
That is the essential context for everything that followed. The four forces that arrived were the triggers, but the leverage was the fuel.
A market with less leverage would have absorbed the same headlines with a routine pullback. A market this stretched amplified them into one of the most violent deleveraging events in recent memory.
Understanding the crash means understanding that the four catalysts did not just push the price down directly; they lit a leverage structure that was primed to explode.
Force one: the Fed crushes rate-cut hopes
The deepest and most structural of the four forces was monetary policy, because it set the hostile backdrop against which everything else played out.
Through early 2026, crypto bulls had counted on Federal Reserve rate cuts to fuel the next leg up, because easy money and low rates push capital toward speculative assets.
Those hopes were systematically crushed. The April FOMC meeting produced an 8-4 vote to hold rates at 3.50% to 3.75%, the most dissents since 1992, signaling deep division but a hawkish majority.
Then a strong U.S. jobs report landed, undercutting the case for imminent cuts because a hot labor market gives the Fed no reason to ease. By early June, markets were pricing roughly a 68.8% probability of zero rate cuts in all of 2026.
The arrival of a new Fed chair added uncertainty, not relief. Kevin Warsh, sworn in on May 22, is the most crypto-literate chair in history, but he is also a monetary hawk, and he had not had time to establish his approach, leaving the market guessing.
His signals of independence from political pressure for cuts dashed hopes that a Trump-appointed chair would ease aggressively. The monetary backdrop therefore went from “cuts are coming” to “no cuts in 2026 and a hawk in charge,” which is precisely the environment that drains liquidity from risk assets like crypto.
This force was structural more than acute. It did not crash the market on a single day, but it removed the foundation the bull case rested on and created the risk-off backdrop in which the other three forces could do maximum damage.
With rate cuts off the table, there was no liquidity tailwind to cushion any shock, and every other negative catalyst hit a market that had lost its expected support.
The Fed did not light the fuse, but it soaked the market in the conditions that made the fire spread.
Force two: Iran shatters the ceasefire
The second force was geopolitical, and it provided the acute risk-off shock that monetary policy had set the stage for.
A fragile US-Iran ceasefire had been holding since April, keeping a lid on Middle East tensions. In early June, it shattered in a rapid sequence.
On June 1, Iran suspended talks with the U.S. over Israel’s actions in Lebanon. Trump publicly contradicted that the same day, claiming talks continued at a rapid pace, injecting confusion.
Then on June 2, Iran fired missiles at Kuwait and Bahrain, and the U.S. retaliated that night with strikes on an Iranian military facility on Qeshm Island.
The ceasefire was over, and the region was back to active military exchange.
The market effect was immediate and followed the classic risk-off pattern. Geopolitical conflict, especially involving a major oil-producing region and a critical shipping chokepoint, drives capital out of risk assets and into perceived safety.
It also pushed oil prices higher, adding an inflationary worry on top of the geopolitical fear. Crypto, sitting at the riskiest end of the asset spectrum, was among the first things sold as investors reduced exposure across the board.
The Iran strikes were the kind of sudden, frightening headline that prompts immediate de-risking.
This force was the acute trigger to the Fed’s structural backdrop. Where the rate-cut disappointment created the hostile environment, the Iran escalation provided the sharp shock that started the selling in earnest.
It was the geopolitical equivalent of the first push on the dominoes, sending the price down toward the leveraged liquidation clusters that were waiting.
Because it coincided with the other forces rather than arriving alone, its risk-off pressure stacked on top of everything else hitting the market in the same window.
Force three: Saylor breaks the vow
The third force was the one that hit sentiment hardest relative to its actual size: Michael Saylor’s Strategy selling Bitcoin for the first time in nearly four years.
On June 1, Strategy disclosed it had sold 32 Bitcoin, breaking a years-long vow never to sell.
In pure market terms, the sale was negligible: 32 coins worth about $2.5 million, a rounding error against the company’s holdings of more than 843,000 Bitcoin and against the tens of billions in daily global Bitcoin volume.
The sale itself moved nothing. But its symbolism moved a great deal.
Strategy and Saylor had become the standard-bearers for never-sell conviction, the most visible institutional believers whose refusal to sell was a load-bearing belief for a certain kind of Bitcoin holder.
When the filing showed Strategy selling, it did not register as a tiny dividend-funding operation, which is what it actually was. It registered as the ultimate diamond hands blinking.
In a fearful, over-leveraged market, that psychological blow was enough to accelerate the selling. Retail traders pointed to the Saylor sale as a primary cause of the crash, which says less about the sale’s real impact than about its outsized effect on sentiment.
This force illustrates the crash’s compounding nature perfectly. The Saylor sale would have been a non-event in a calm, unleveraged market.
But arriving alongside the Fed disappointment, the Iran shock, and the ETF outflows, into a market primed with leverage, it became the sentiment trigger that helped tip the price into the leveraged liquidation zones.
It is the clearest example of how the convergence mattered more than any single force: a $2.5 million sale helping to catalyze a $250 billion crash makes no sense in isolation and perfect sense as one of four blows landing simultaneously on a fragile market.
Force four: the record ETF exodus
The fourth force was the one that turned crypto’s largest source of demand into a source of supply: the longest Bitcoin ETF outflow streak ever recorded.
Since their January 2024 launch, the U.S. spot Bitcoin ETFs had become a major structural source of buying, a steady institutional bid that absorbed supply and supported the price through the 2024-2025 rise.
In the run-up to and through the crash, that bid reversed.
The ETFs recorded 13 consecutive trading days of net outflows from May 15 to June 3, the longest streak since launch, draining roughly $4.4 billion and flipping the year’s cumulative flows negative for the first time.
BlackRock’s IBIT alone shed around $3.3 billion. The single worst week saw $3.4 billion leave, the largest weekly outflow on record.
The significance is structural. ETF flows had become a dominant driver of Bitcoin’s price, by some estimates accounting for a large share of weekly price moves.
When the ETFs are buying, they cushion dips and amplify rallies. When they are selling, as during this streak, they remove the buyer that might otherwise have stabilized the market and become a source of supply that drags the price down.
At the exact moment the other three forces were pushing the price down, the ETF complex was not there to absorb the selling. The marginal institutional bid had turned into a marginal offer.
This force was both a cause and a symptom, which is what made it so damaging.
The outflows were partly driven by the same macro forces, the Fed and the risk-off shift, that were driving everything else, so they reflected the broader negativity.
But they also actively deepened the crash by removing demand and adding supply, creating a feedback loop: macro fear drove ETF outflows, which drove the price down, which deepened the fear.
With the ETF bid gone, the leverage cascade triggered by the other forces had nothing to absorb it, and the price fell through support level after support level.
Why the convergence is the real story
The lasting lesson of the June crash is that it was a convergence, not a trigger, and that distinction matters for understanding both this crash and how to read the next one.
The instinct after any crash is to find the single cause, and different observers picked different villains: the Saylor sale, the Iran strikes, the Fed, or the ETF outflows.
But the honest reading is that no single one of these would have produced a crash of this magnitude.
The Saylor sale was tiny. The Iran shock, in a healthy market, might have caused a modest dip. The Fed disappointment was structural background. The ETF outflows were serious but represented a fraction of lifetime inflows.
What made June a $250 billion crash was that all four arrived in the same narrow window, into a market primed with leverage, so that each amplified the others.
The Fed removed the support, Iran provided the shock, Saylor broke the sentiment, the ETFs removed the bid, and the leverage turned the combination into a cascade.
This is why the convergence framing is more useful than the blame framing.
If you believe the crash was caused by the Saylor sale, you would expect it to reverse once Strategy stopped selling, which misreads the situation entirely.
If you understand it as a convergence, you know that recovery depends on the underlying forces: whether the Fed pivots, whether the Iran tensions ease, whether the ETF flows turn positive, and whether the leverage has been fully flushed.
The crash was systemic in the sense that it emerged from the interaction of multiple forces, not from one cause that can be isolated and fixed.
The practical takeaway is to watch the four forces rather than hunt for a single explanation, because the same convergence logic governs the recovery.
The leverage cascade has likely flushed much of the excess, which is mechanically a reset. But the macro forces, the Fed’s rate path, the Iran situation, and the ETF flow direction, remain the variables that determine whether June was a capitulation bottom or a waypoint to lower levels.
The June 2026 crash was the anatomy of a convergence: four forces, one fragile leveraged market, and a cascade that none of them would have produced alone.
Understanding it that way is the difference between blaming a villain and reading the market, and only the second one helps you understand what comes next.
This article is for informational purposes and does not constitute financial or investment advice. Cryptocurrency markets are highly volatile. The figures and analysis described reflect data available as of June 2026. Always do your own research and consult with qualified financial professionals before making investment decisions.


Sberbank, Russia’s biggest bank, plans to build cryptocurrency trading infrastructure including a digital depository no later than Dec. 1 as the country brings crypto trading, custody and settlement into its regulated financial system.
That digital depository, Interfax reported, will record ownership of cryptocurrency and process most transactions outside of the main blockchain. Sberbank will operate active wallets for client-initiated deposits, withdrawals and transfers.
“One of the key elements of the new infrastructure will be a digital depository, which will maintain records of clients’ cryptocurrency rights and account for transactions outside the main blockchain,” said Alexander Vedyakhin, first deputy chairman of Sberbank’s management board, the state-affiliated press service said. “It will also facilitate transactions on active wallets to fulfill clients’ currency transfer orders.”
Russia’s lawmakers earlier this month moved the country closer to its first comprehensive crypto market framework after completing final readings on a bill that would regulate digital asset activity.
The bill would give the Bank of Russia broad oversight of the regulated market, including authority to determine which crypto assets may be offered through licensed intermediaries and to issue implementing regulations.The central bank has set liquidity thresholds, including an average market capitalization of more than 5 trillion rubles (~$64 billion) and an average daily volume of more than 1 trillion rubles (~$12.8 billion) over two years.
Once in place, it also establishes five categories of regulated market participants, including crypto exchanges, brokers, asset managers, custodians and exchange service providers, defining who can buy, sell, hold and exchange crypto assets as of the framework’s effective date of Sept. 1, 2026.
Recommended: Bitcoin advocacy group to join US State Department’s ‘digital freedom’ program
Moscow adopts crypto framework as EU tightens sanctions
Moscow is moving to put a working crypto infrastructure in place as the European Union turns up the heat on the country with a package of sanctions targeting Russia amid the country’s war on Ukraine. Last week, the bloc listed cryptocurrency exchange HTX, formerly Huobi Global, in its sanctions.
In a Thursday decision, the European Council amended its previous measures “in view of Russia’s actions destabilizing the situation in Ukraine” to include HTX in a list of 18 entities “providing crypto-assets services or payment services established outside of the Union that are significantly frustrating the purpose of the prohibitions” against Russia. The country continues to face sanctions globally over its war in Ukraine following a military invasion in 2022.
The sanctions against HTX came the same day EU officials announced they would prohibit Belarusian nationals and residents from owning, controlling or managing crypto exchanges and digital asset service providers in compliance with the region’s Markets in Crypto Assets (MiCA) framework.
The UK government imposed similar sanctions on HTX in May, saying there were “reasonable grounds to suspect” that the exchange supported Russia’s government by using financial services and funds facilitated by sanctioned entities.
Magazine: Will the US get CLARITY this week? Bitcoin’s new $80K target: Hodler’s Digest, July 19
The spot exchange-traded funds tracking Ripple’s cross-border token started the week strong, hitting a fresh all-time high in terms of total net inflows, but a familiar and slightly worrisome scenario repeated in the following days.
At the same time, the HYPE ETFs have broken their streak and were deep in the red for a second consecutive week.
XRP ETFs: The Good and the Worrisome
Data from SoSoValue shows that the spot XRP ETFs attracted $2.49 million on Monday and $5.66 million on Tuesday. That’s the good news. However, the other side of the coin was what happened during the remaining three business days of the week. And, it was something that has repeated and even accelerated in recent weeks.
The same data aggregator shows that there were no reportable net flows during those three days, with $0.00 pointing at each. Something similar was observed last week, when only one day was in the green, while the other four were at $0.00. If we look back, we can see that 10 out of the last 15 trading days have seen zero net flows.
Thus, even though the XRP ETFs ended two consecutive weeks in the green, a more in-depth look into the numbers shows a clear sign that investors’ interest has dwindled lately. Before these two weeks, the funds were on a massive nine-week streak in which they attracted over $150 million.
Nevertheless, the overall data shows that the cumulative total net inflow has risen to almost $1.5 billion, according to SoSoValue, which is an all-time high.
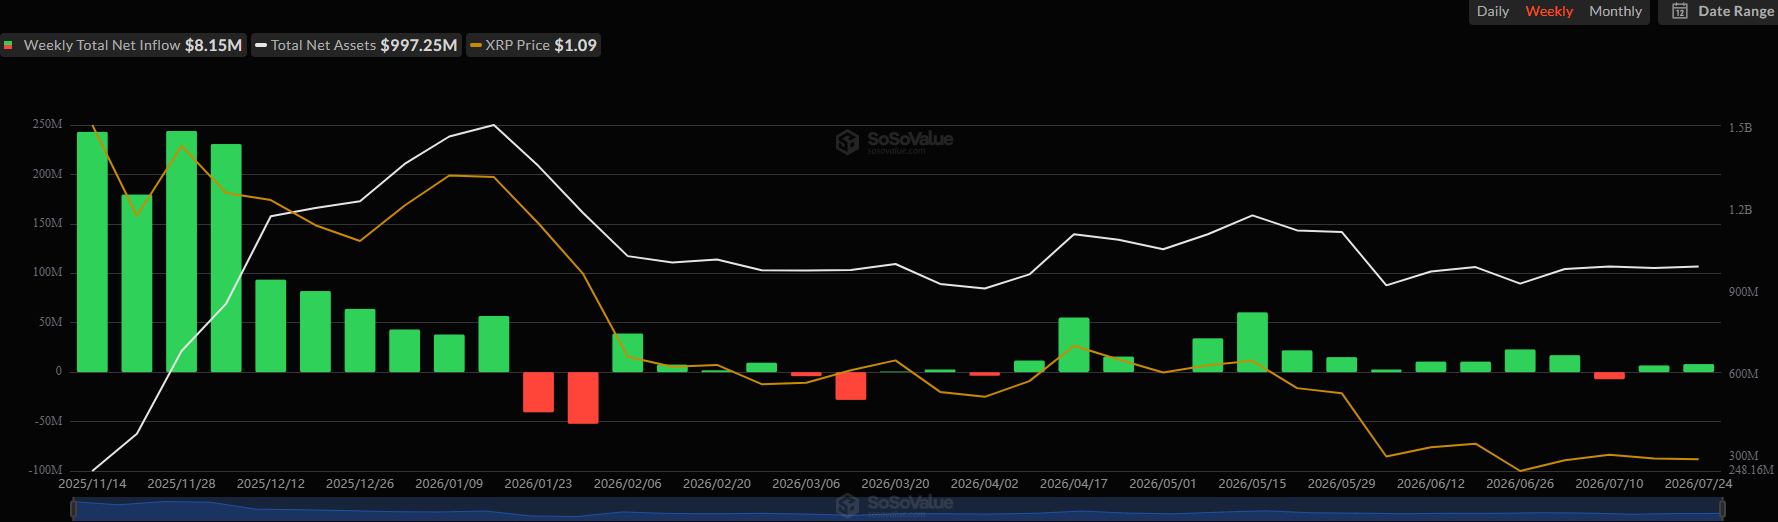
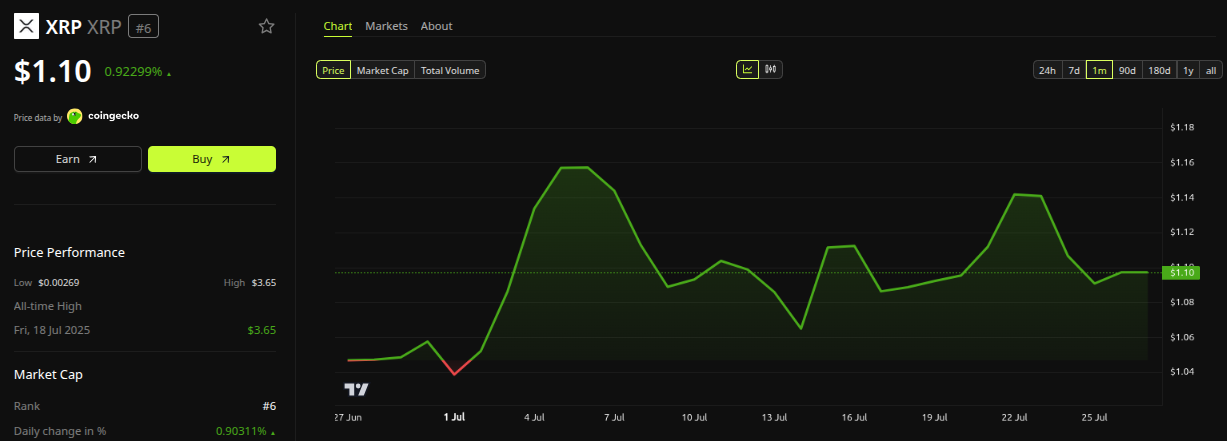
Meanwhile, the underlying asset pumped at the beginning of the week, perhaps due to the growing ETF net flows, went from under $1.09 to a multi-day peak of $1.16. However, it was halted there and has returned to below $1.10 as of press time.
HYPE ETFs Break Form
The spot HYPE ETFs quickly joined the XRP funds as a fan favorite, especially during one week in which they attracted over $110 million to set a record of their own. However, investors have turned their back on those funds in the past two weeks, as net outflows dominate.
During the past five-day trading period, they pulled out over $8.6 million, following another red one in which the net outflows stood at $7.26 million. Thus, the cumulative total net inflows have dropped from an all-time high of $308.60 million to $292.73 million as of Friday’s close.
The post Ripple (XRP) ETF Inflows Set Another Record, but One Problem Remains appeared first on CryptoPotato.
A post asking whether 20,000 XRP is enough for retirement savings drew heavy criticism on X, exposing how far optimistic price targets sit from current reality.
The debate cuts to a question every crypto holder eventually faces: how much is actually enough?
The $2 Million Math Behind the XRP Theory
A savings threshold is the portfolio size needed to generate a reliable income without depleting the principal. Jake Claver, chairman of DAG Family Office, applied that idea to XRP holdings this week.
His scenario rested on a single assumption. If XRP reached $100 per token, a 20,000 XRP position would be worth $2 million. From there, the math looked simple enough.
A conservative 5% annual return on that sum would produce roughly $100,000 in pre-tax income each year.
Follow us on X to get the latest news as it happens.
Claver framed the exercise as personal financial arithmetic rather than a forecast. He encouraged followers to run their own numbers, emphasizing patience over hype.
Current prices complicate the picture considerably. XRP trades near $1.10, according to BeInCrypto data, valuing 20,000 tokens at roughly $22,000.
Reaching $100 would require the token to climb nearly 90x from current levels. Its all-time high sits at $3.65, still far below that threshold.

The replies turned hostile quickly. Several users pointed to years of development and regulatory progress that failed to translate into sustained price appreciation.
One critic argued the token should already trade far higher if the technology delivered as promised. Another dismissed the $100 target outright, calling it unreachable.
Why Do Critics Say the Numbers Fall Short
Practical objections went beyond price skepticism. Even at $2 million, taxes, inflation, healthcare, and housing costs would erode purchasing power substantially over time.
For younger investors needing funds across 30 to 50 years, financial planners often cite $5 to $7 million as a more realistic independence target.
Concentration risk compounds the problem further. Holding a single volatile asset exposes savings to sudden drawdowns that diversified portfolios typically absorb more comfortably.
“Jake seriously, I am even getting tired of your crap. I know you are trying to build your business, but honestly your stuff isn’t coming true at all either. You get excited when you see some BS Japan or Oil going on. Price is still $1.10. You say XRP doesn’t need Clarity, yet, it’s still $1.10. If XRP was so great, it should be $20 by now. Why isn’t it? Crypto is crap, it’s all BS, just call it what it is already,” one user replied on X.
The underlying fundamentals offer some counterweight. XRP powers the XRP Ledger, built for fast, low-cost cross-border payments with transaction finality in three to five seconds.
Subscribe to our YouTube channel to watch leaders and journalists provide expert insights.
It functions as a bridge asset for currency swaps, and institutional interest has grown steadily. Spot ETFs arrived in late 2025, while real-world asset activity on the ledger continues to expand.
Competition remains fierce, however. Traditional payment systems and rival blockchains contest the same use cases, and much of the roughly 62.5 billion circulating supply sits idle.
Community responses split predictably. Some celebrate any XRP holding that clears a mortgage, while others argue that positions closer to 50,000 tokens make far more sense.
The disagreement highlights a broader point about crypto investing. Bag size alone guarantees nothing without diversification, disciplined withdrawal planning, and expectations grounded in probability rather than in hope.
The post Is 20,000 XRP Enough for Savings? The Dream Meets Brutal Reality on X appeared first on BeInCrypto.
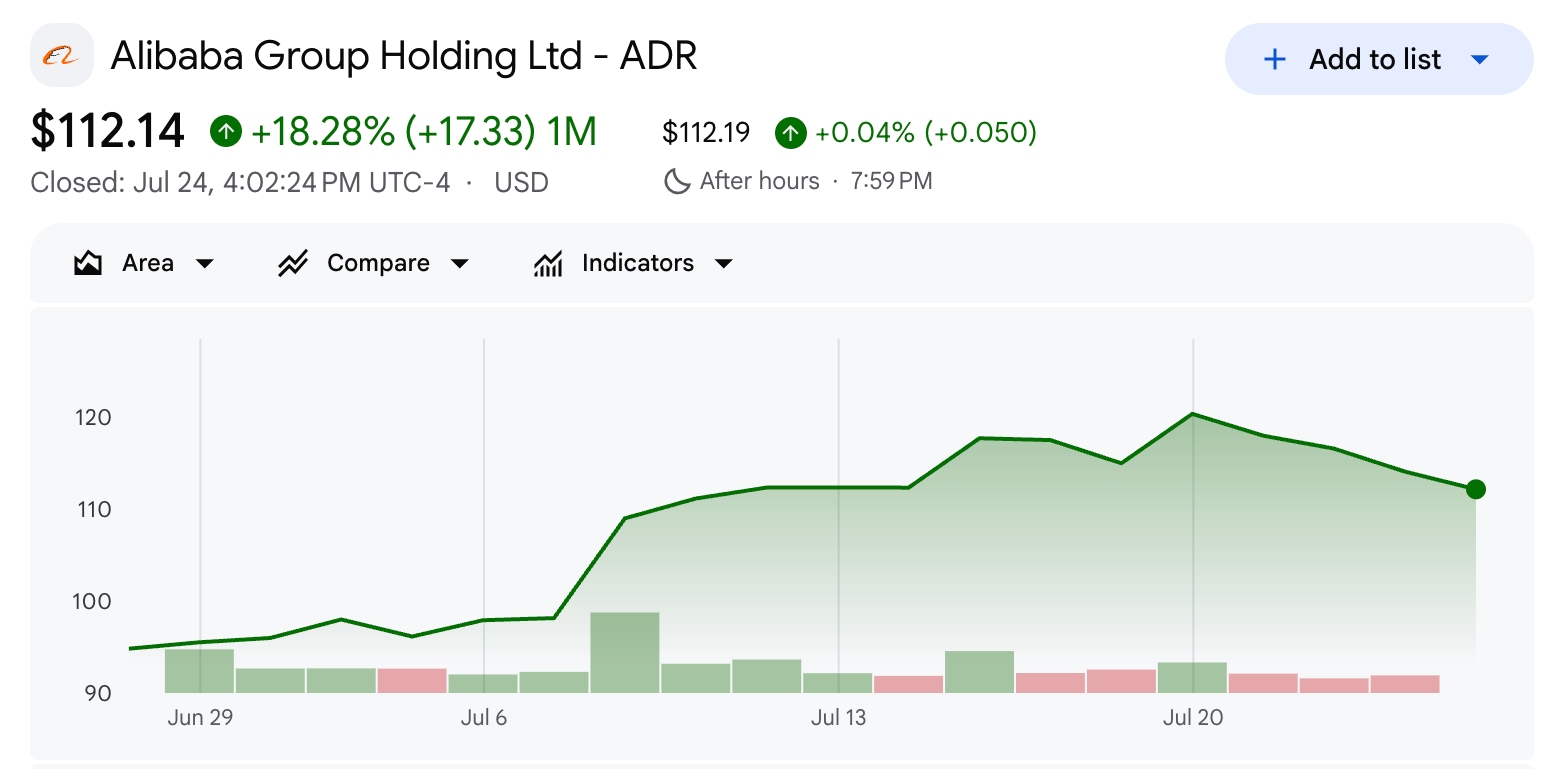
Morgan Stanley kept Alibaba (BABA) stock as a “top pick” ahead of late-August earnings. Analyst Gary Yu made the call over two weeks after cutting his target to $180 from $190.
That target sits roughly 60% above where BABA shares closed on Friday at $112.14. Thus, Wall Street is telling clients the stock is worth far more than buyers are currently willing to pay.
Why the Target Cut Came First
Yu lowered his Alibaba target in early July. He still kept an overweight rating on the stock.
Other banks pivoted in the same direction. HSBC cut its target to $170 from $176 in July. The bank still maintained its buy rating.
Daiwa moved earlier, cutting to $175 from $200 on June 24. The firm pointed to weak sales during China’s 618 shopping festival.
Follow us on X to get the latest news as it happens
What Yu Wants Investors to Watch
Yu framed the reiteration by pointing to Alibaba’s cloud infrastructure, which he described as the largest in China.
“We expect Alibaba, having the largest cloud infrastructure in China, to win share in the current evolutionary AI cycle in China,” Yu said.
The bank also cited cash generation, dividends, and share buybacks as support. Morgan Stanley noted the online regulatory environment appears to be easing, with Alibaba positioned to benefit.
Yet, the bullish calls sit against a run of bad news. The European Commission fined AliExpress 550 million euros on July 20 for breaching the Digital Services Act (DSA).
AliExpress called the fine disproportionate and has until October 20 to file an action plan.

Meanwhile, Alibaba shares have gained about 18% over the past month. They remain well below their 52-week high of $192.67.
The late-August report will test whether the cloud growth Yu describes arrives fast enough to close a 60% gap.
Subscribe to our YouTube channel to watch leaders and journalists provide expert insights
The post Morgan Stanley Cuts Its Alibaba Stock Price Target appeared first on BeInCrypto.
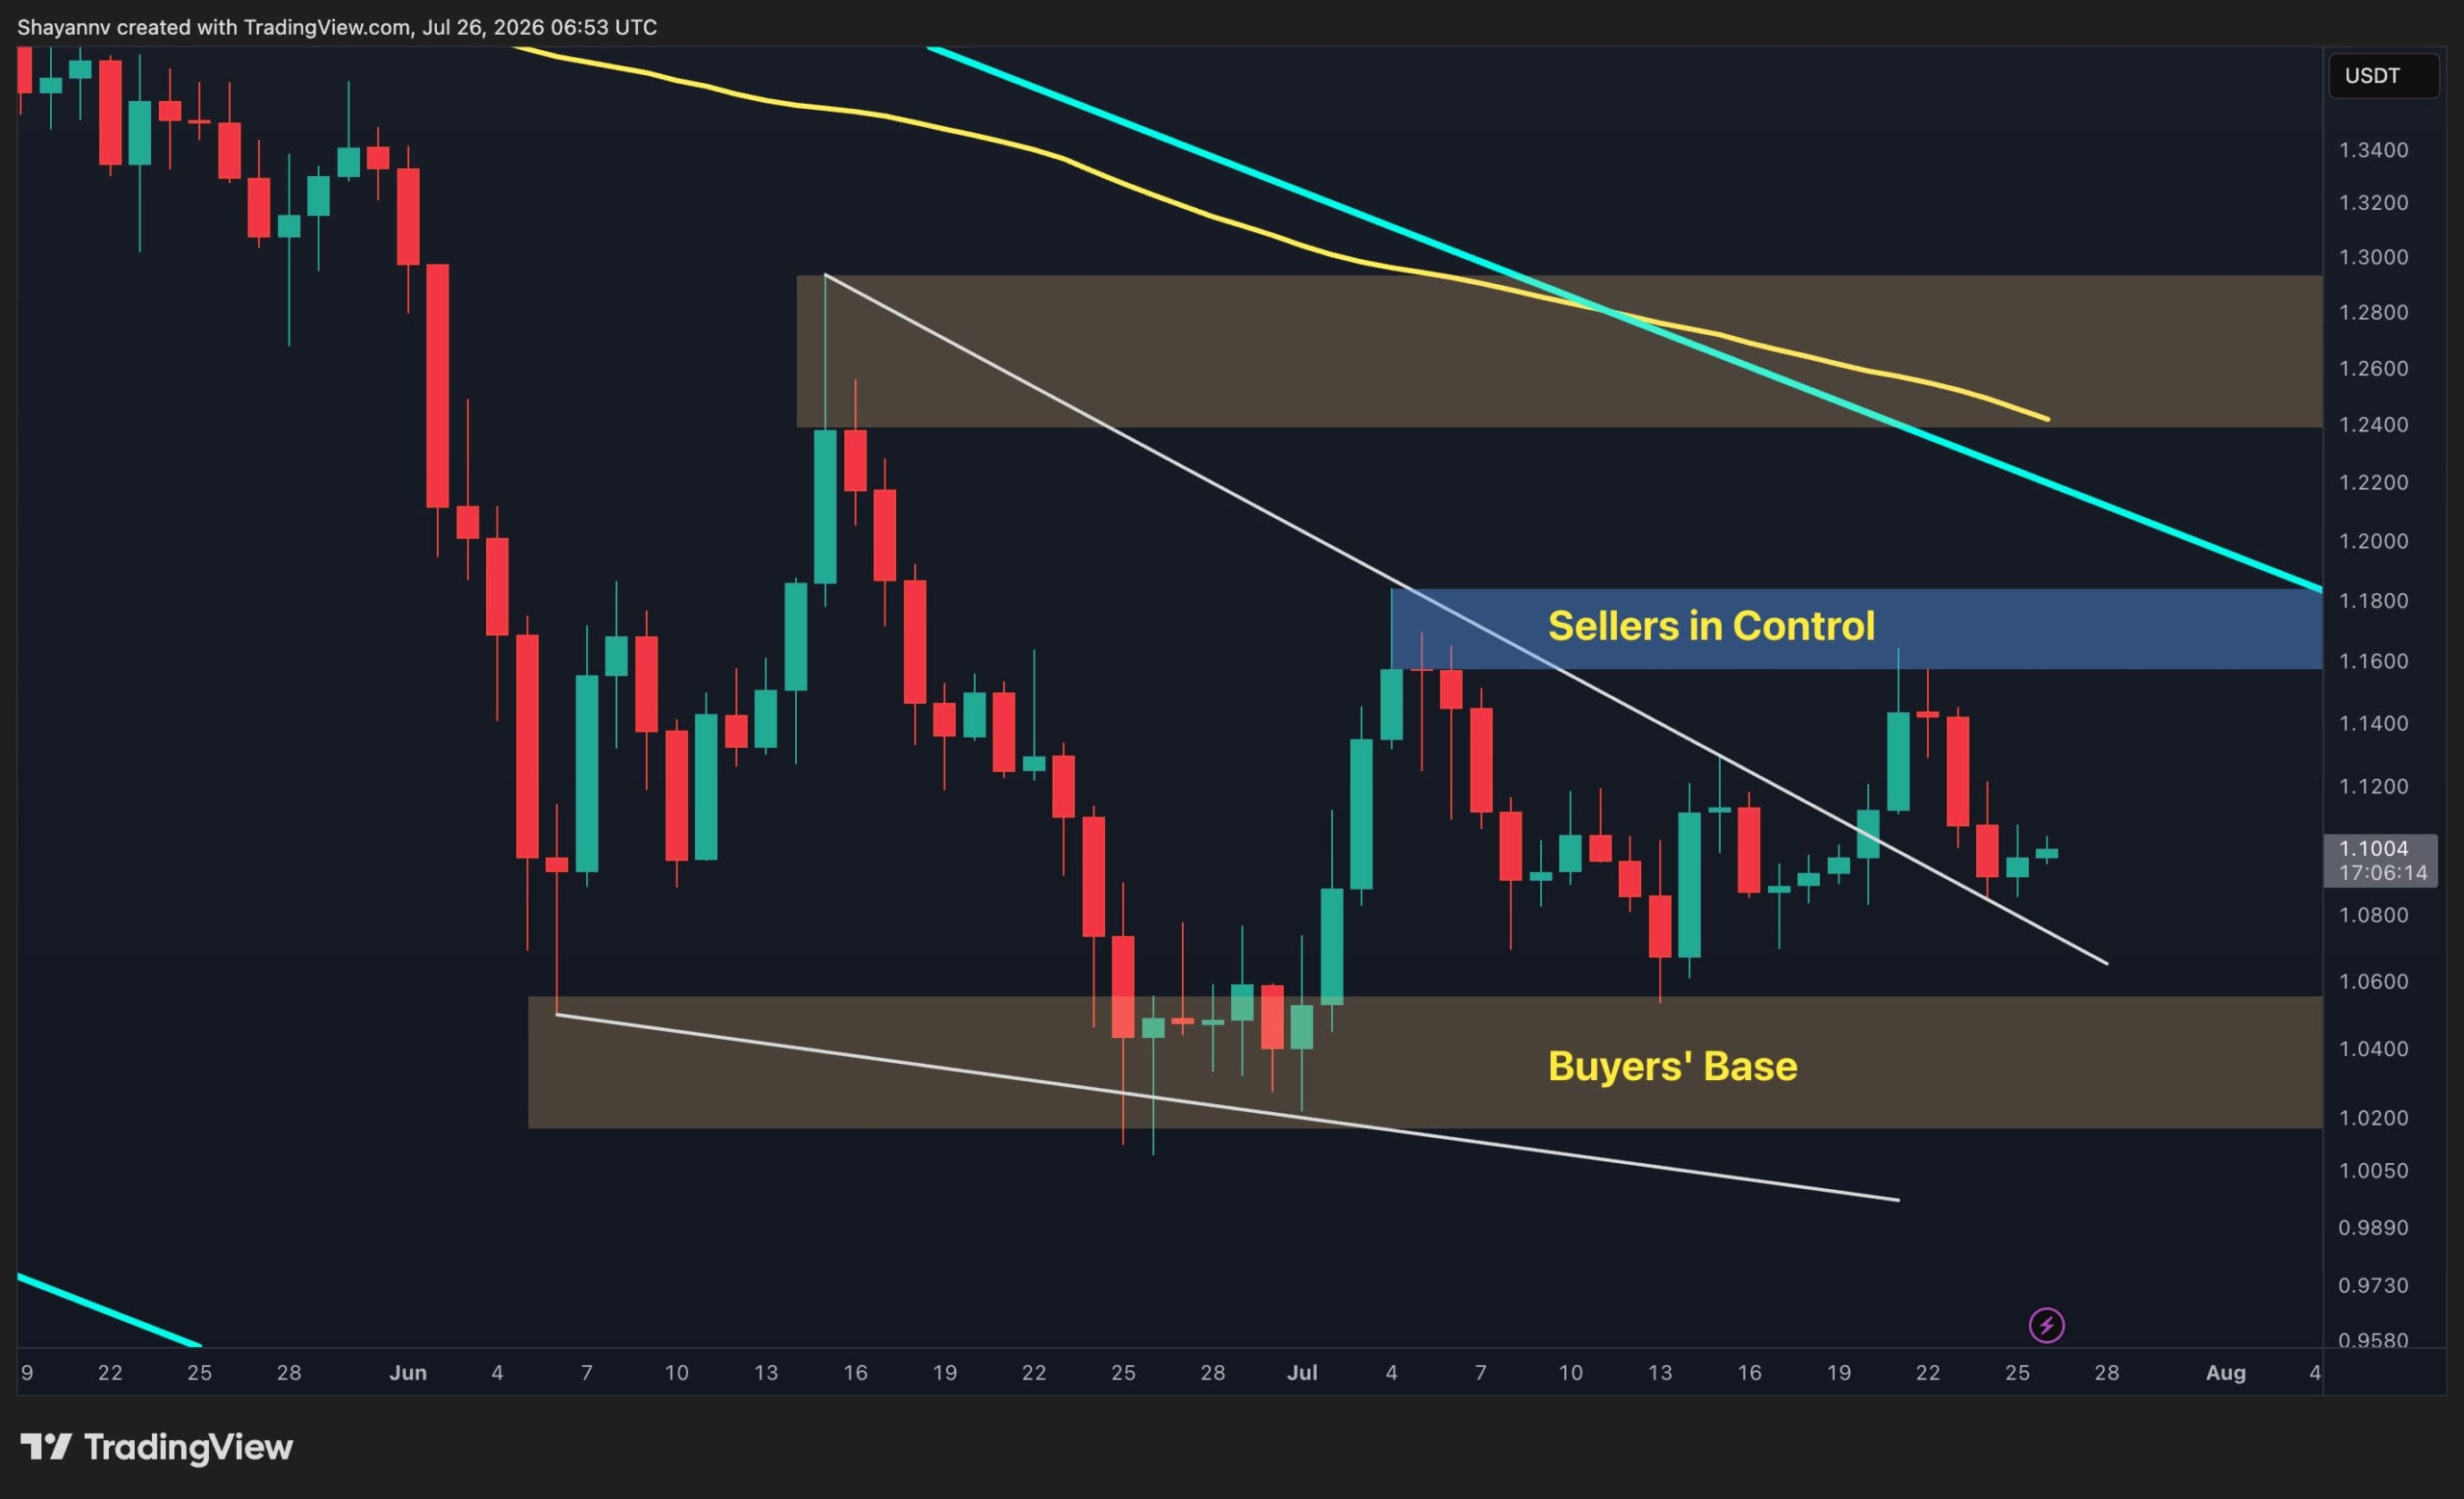
Ripple’s token is showing signs of stabilization after the sharp decline from higher levels, but the recovery remains limited by a series of resistance zones that continue to attract sellers. While buyers have defended the recent lows, the market still needs a clear structural breakout before a stronger upside move can be considered.
Ripple Price Analysis: The Daily Chart
On the daily timeframe, XRP continues to trade inside a broader descending channel that has shaped the price action for months. The recent rebound from the $1.02 to $1.04 demand zone has helped the asset recover, but the move has not yet changed the larger bearish structure.
The main challenge for buyers remains the $1.17 to $1.2 supply zone, which sits near the upper boundary of the descending channel. A successful breakout above this region could open the path toward the next resistance area around $1.28. However, as long as XRP remains below this level, the current recovery may still represent a corrective move within the broader downtrend.
A rejection from the current resistance area could send the price back toward the $1.05 to $1.07 support region, while a deeper decline would bring the $1.02 to $1.04 buyers’ base back into focus.
XRP/USDT 4-Hour Chart
The 4-hour chart highlights the ongoing struggle between buyers attempting to build a base and sellers defending the overhead supply. XRP recently pushed toward the $1.16 to $1.18 resistance zone but failed to secure a breakout, keeping the short-term structure vulnerable.
The $1.16 – $1.18 supply range remains an important barrier, with price action still showing difficulty reclaiming the area above it. Until the asset breaks above this price region and confirms strength above it, upside attempts may continue to face selling pressure.
On the downside, the ascending wedge’s lower trendline remains the key support area. Holding above this zone would preserve the possibility of another recovery attempt, while a breakdown below it would weaken the current setup and increase the risk of further downside.

The post Ripple Price Analysis: XRP Could Be Heading for a Major Move Next Week appeared first on CryptoPotato.
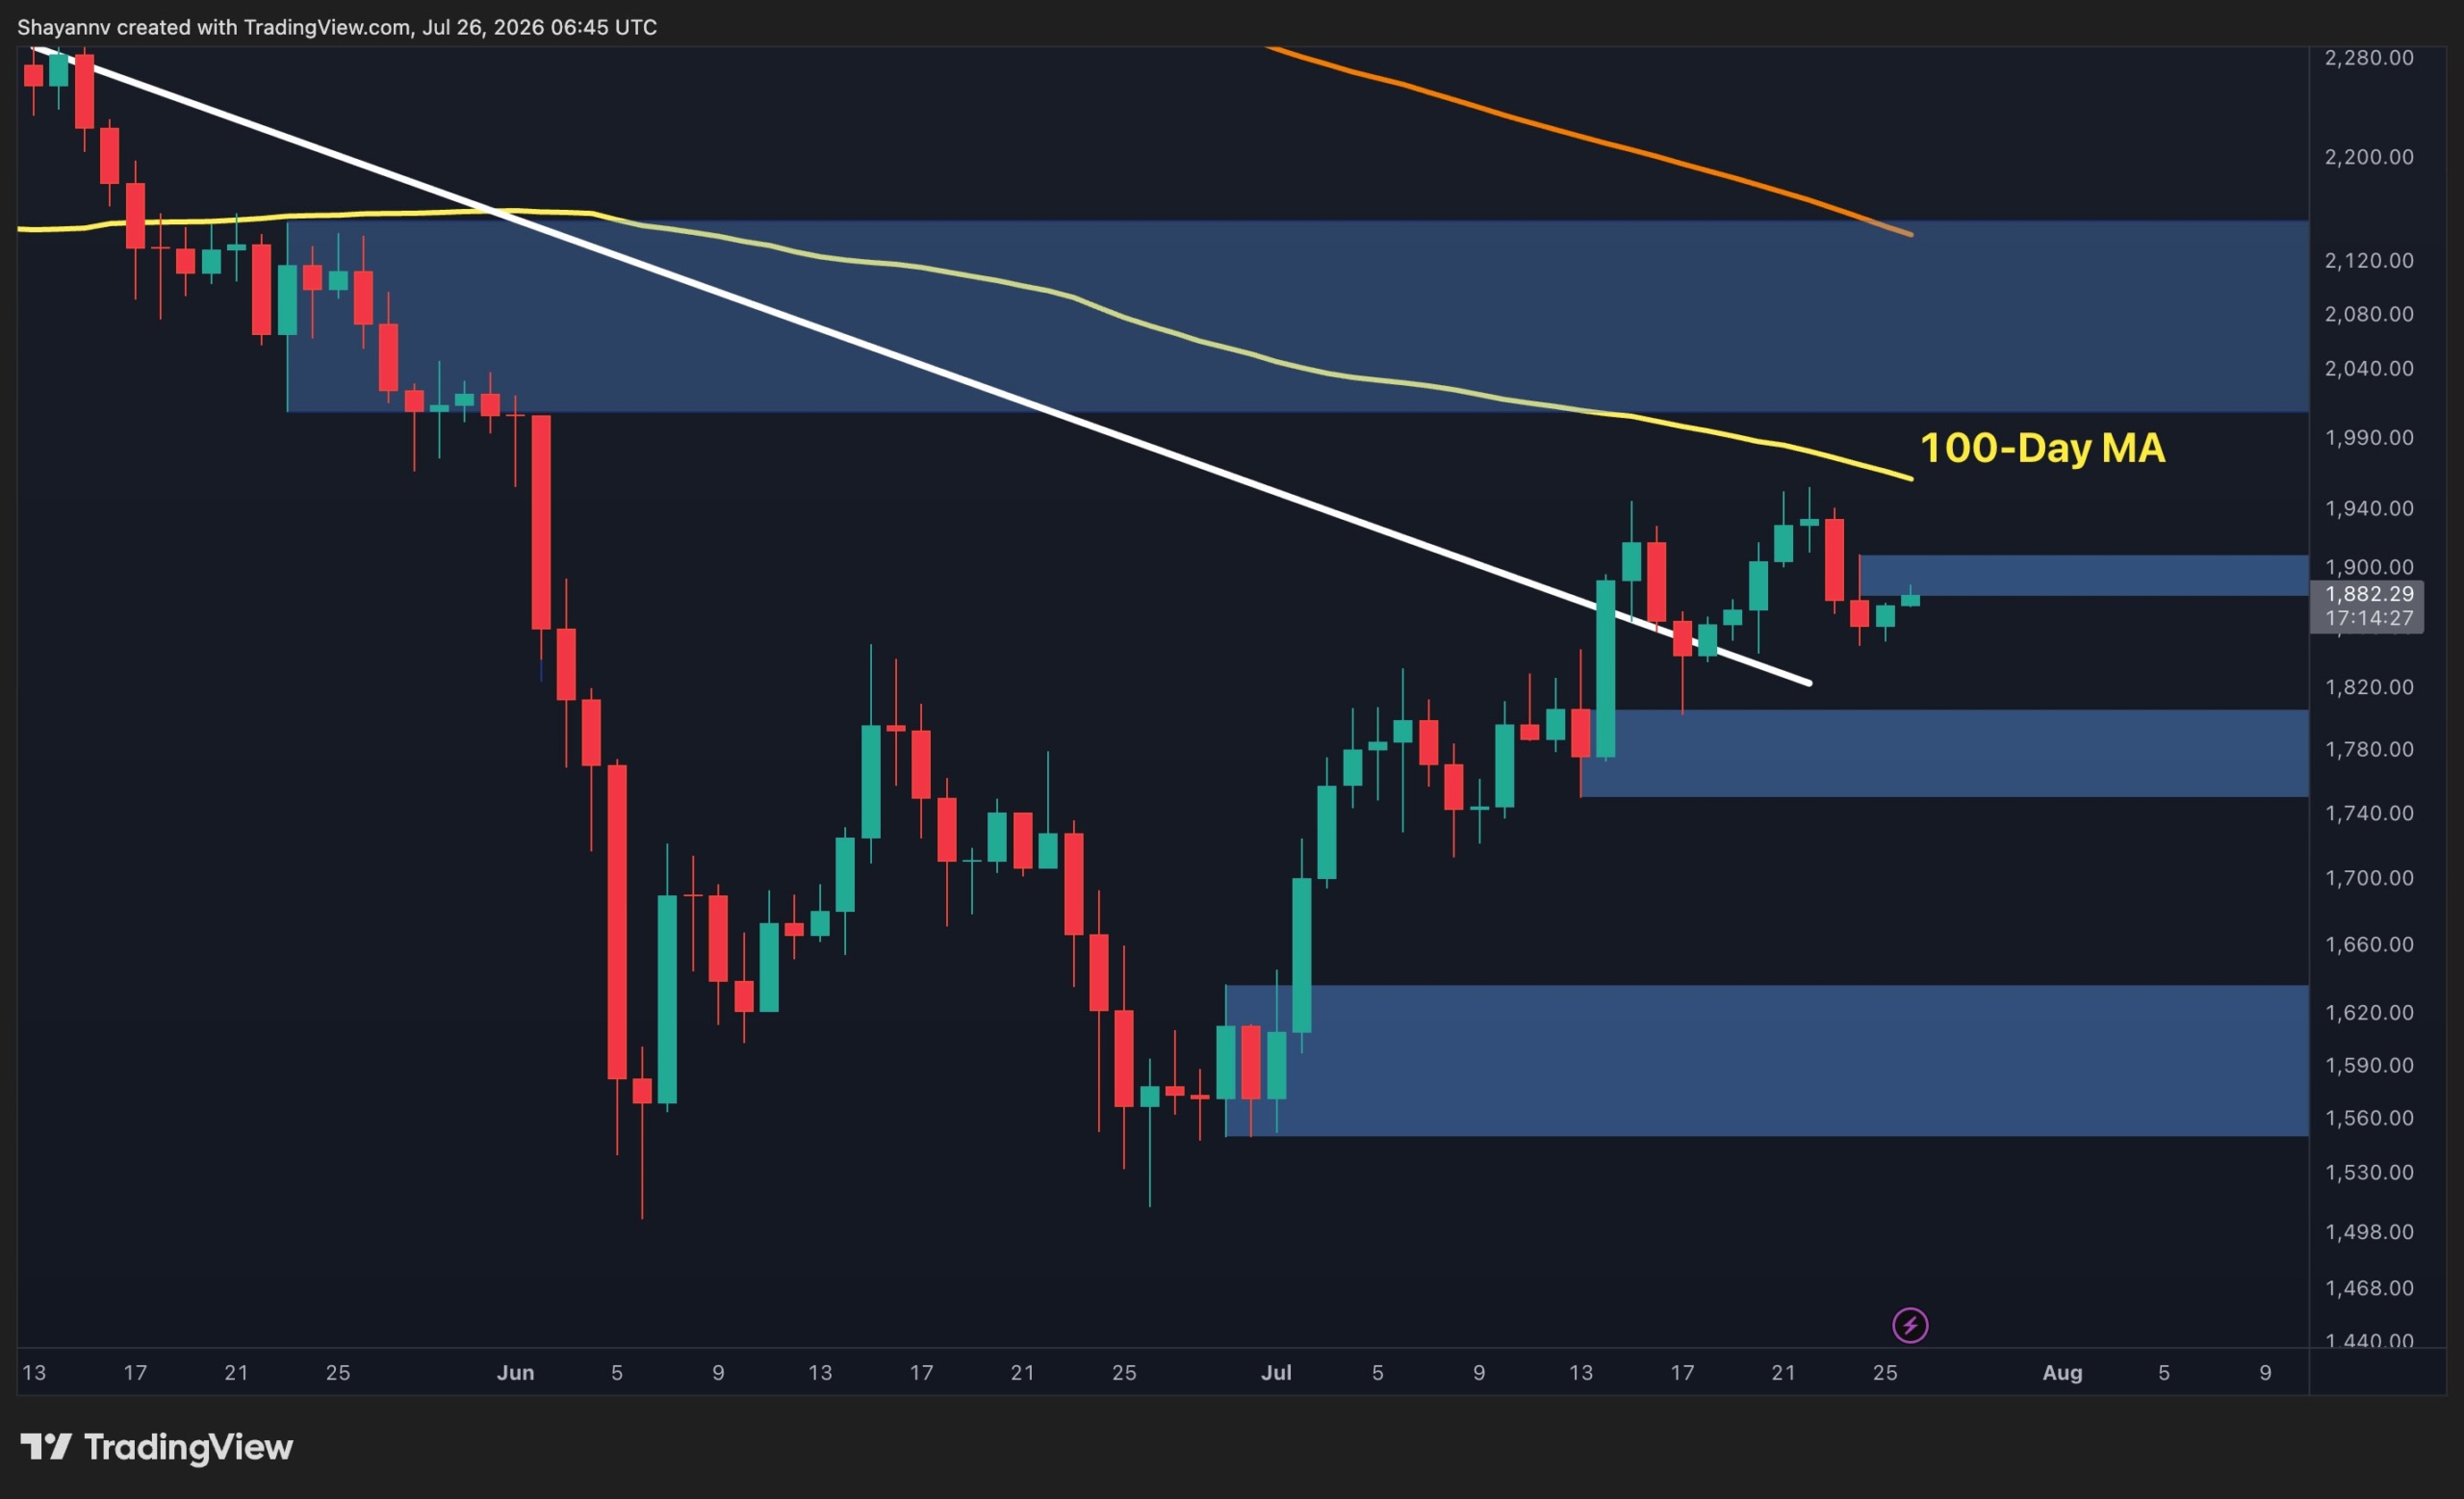
After staging an impressive rebound from its local bottom, Ethereum is beginning to test increasingly important resistance levels. The coming sessions should provide more clarity on whether this recovery has enough momentum to continue.
Ethereum Price Analysis: The Daily Chart
The daily chart shows ETH holding above the previously broken descending trendline, confirming that the medium-term structure has improved compared to the aggressive selloff seen in June. Following the breakout, the market has successfully established a sequence of higher highs and higher lows while consolidating above the $1.76K to $1.82K support region.
However, the recovery is now approaching a major technical barrier. The $1.88K to $1.91K supply zone is acting as the first resistance, while the declining 100-day moving average sits just overhead near the $1.95K area. This creates a confluence of resistance that could cap the current rally before ETH attempts to challenge the broader long-term supply zone between roughly $2K and $2.15K.
As long as the price remains above the $1.76K to $1.82K support, buyers maintain the short-term advantage. Losing that area, however, would expose the next support around $1.55K to $1.64K and weaken the current bullish structure.
ETH/USDT 4-Hour Chart
On the 4-hour timeframe, Ethereum has slipped slightly below the ascending trendline that had guided the recovery throughout July. While the break is not yet decisive, it signals that bullish momentum is beginning to weaken as the price trades inside the $1.88K to $1.91K supply zone. The current structure suggests that buyers are losing some control after failing to extend the recent rally.
If ETH remains below the broken trendline, the move could evolve into a deeper retracement toward the notable demand zone around $1.76K to $1.79K, where buyers would be expected to step in. Conversely, reclaiming the trendline and securing a breakout above the $1.88K to $1.91K resistance would invalidate the short-term weakness and increase the probability of another push toward the $1.95K to $2K region.

Sentiment Analysis
The one-month Binance ETH liquidation heatmap shows a substantial concentration of liquidity around the $1.5K level. Although Ethereum is currently trading well above that region, this cluster remains an important magnet from a derivatives perspective.
If the current rally loses momentum and sellers regain control, a deeper correction toward the $1.5K liquidity pocket could attract price as leveraged long positions are unwound.
Such a move would likely coincide with a break below the key technical supports visible on the chart. Until then, the prevailing structure remains constructive, but the presence of this large liquidity cluster highlights that downside risk has not completely disappeared despite the recent recovery.

The post Ethereum Price Analysis: ETH Hits a Decision Point as Major Resistance Comes Into Play appeared first on CryptoPotato.


Dormant Bitcoin activity fell to its lowest level since Q3 2022, suggesting long-term holders have slowed distribution after heavy profit-taking.
Robinhood Chain ranked 3rd by weekly application fees in the week ending July 24. Meme coins and tokenized assets trade side by side on the 4-week-old network.
Now Robinhood is pushing deeper into prediction markets, widening its bets across 3 crypto sectors.
Fees Hit $25 Million as Meme Coins Outpace the RWA Pitch
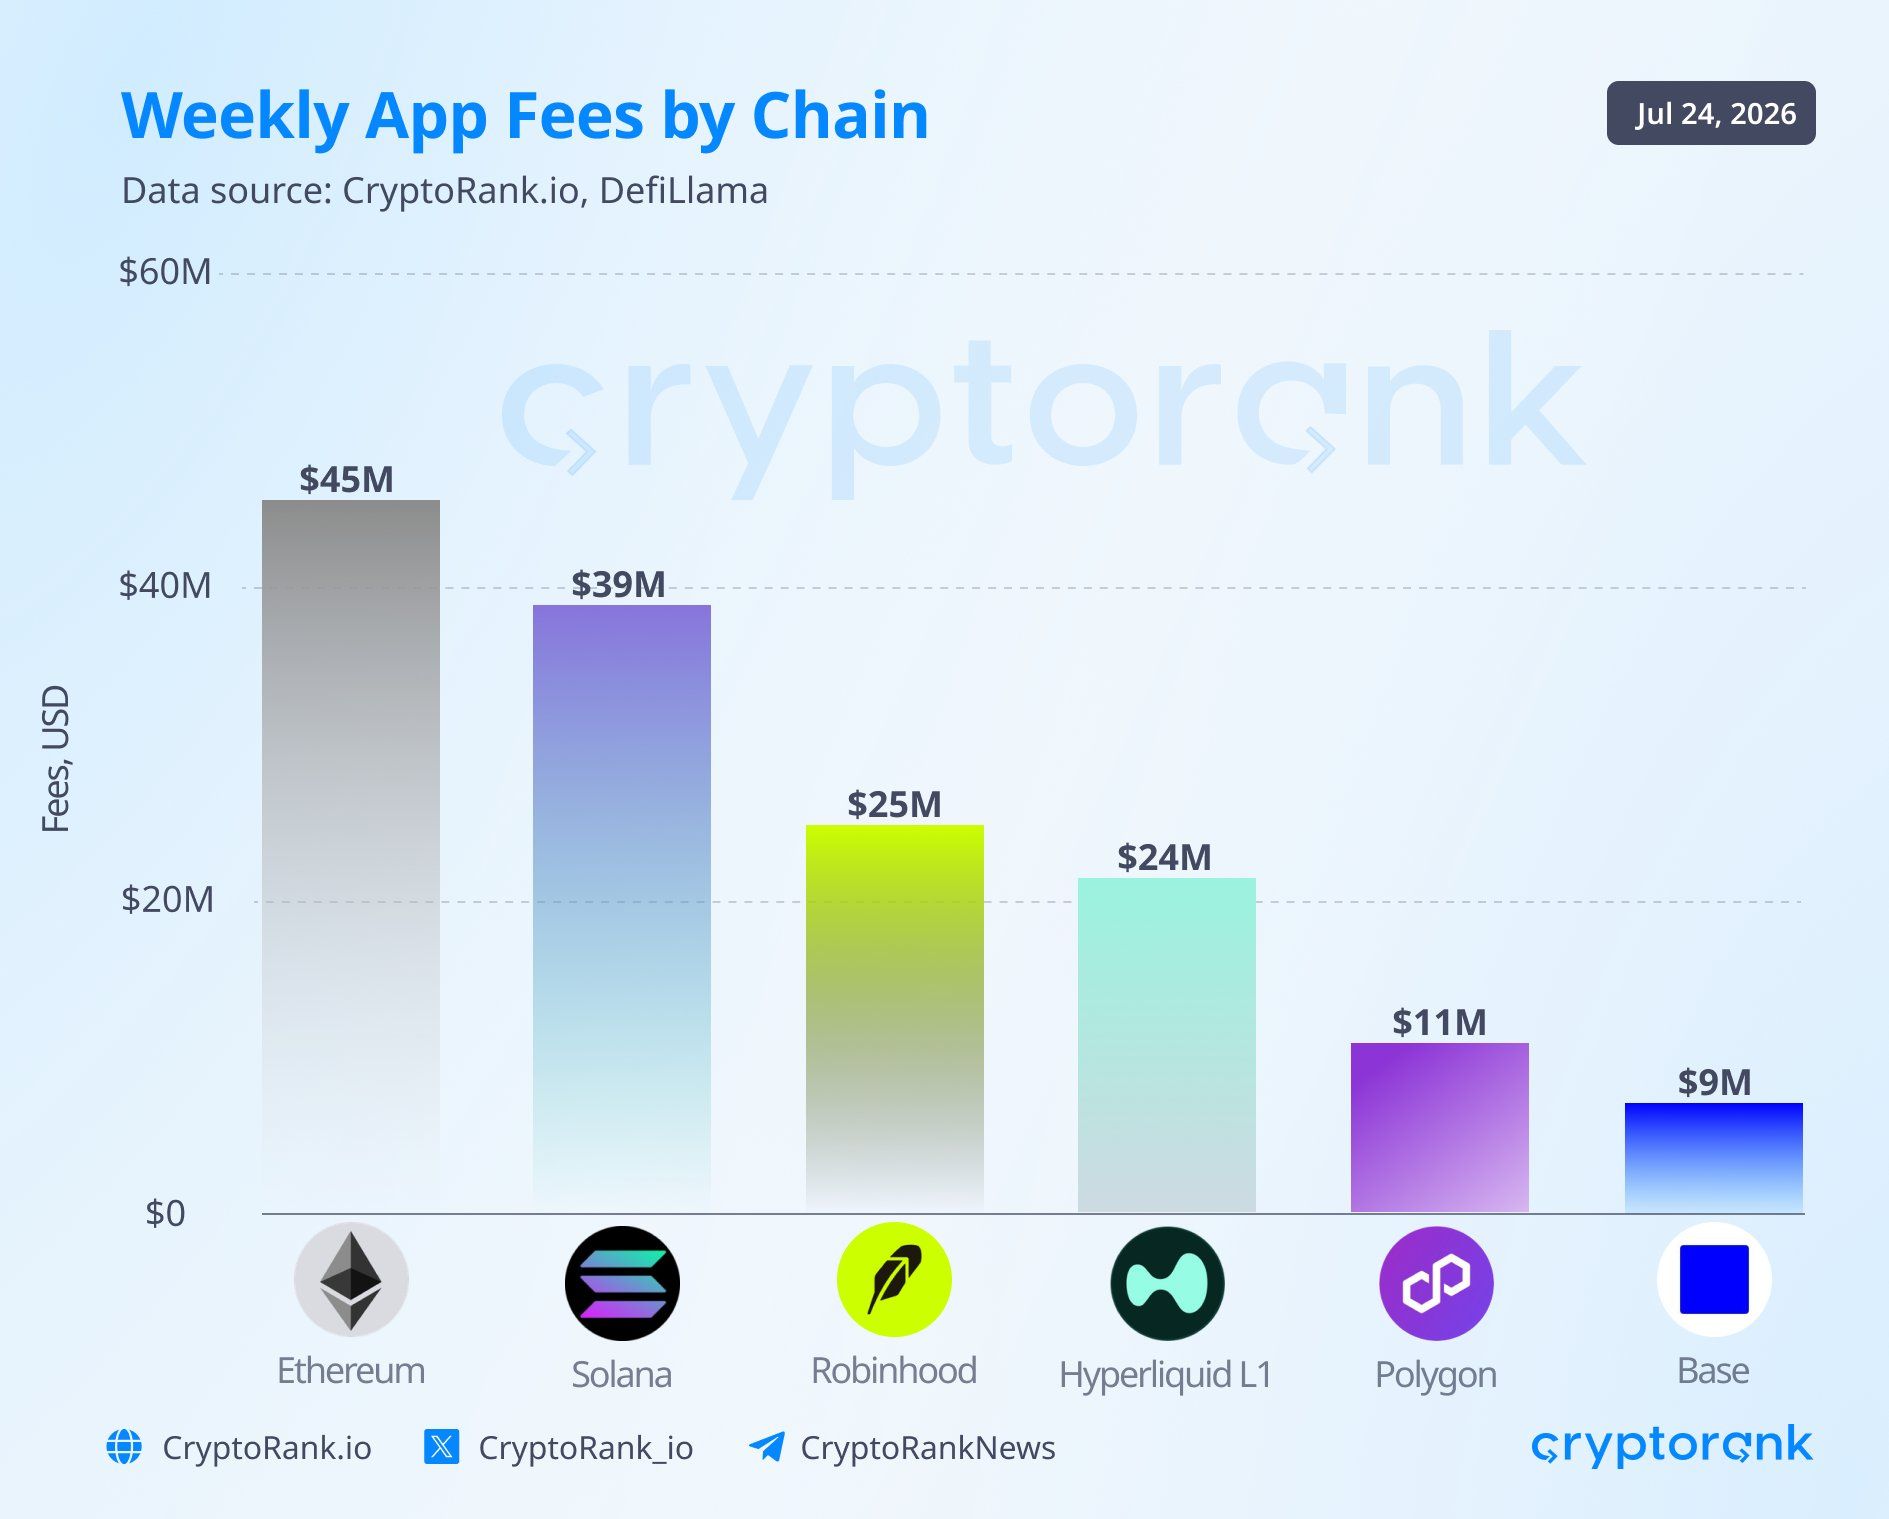
Applications on Robinhood Chain generated $25 million in fees over the week ending July 24. Only Ethereum (ETH) at $45 million and Solana (SOL) at $39 million ranked higher, per CryptoRank.
“Robinhood Chain’s third-place position makes it one of the strongest blockchain launches in recent years,” CryptoRank said.
Follow us on X to get the latest news as it happens

Robinhood built a layer-2 network for tokenized real-world assets (RWA). Recent activity shows a different mix. According to data from Dune, Cash Cat (CASHCAT) ranks first among the top traded tokens on the network.
The meme coin has logged $824.89 million in lifetime volume across 1.37 million trades. Tokenized assets are growing, too, though rarely on their own.
Daily RWA trading peaked at $61.1 million on July 23. Meme coin and tokenized stock pairs supplied $46.1 million, or about 75%.
The chain’s tokenized asset base also grew. The total RWA value on the chain climbed to $25.4 million on July 24, the highest since launch. Tokenized stocks made up $21.9 million.

Prediction Markets Sit Off the Chain
As meme coin and RWA trading grow, Robinhood is also pushing deeper into prediction markets in its app. The Journal reported that Robinhood is in talks with Crypto.com. A partnership would let users trade the exchange’s yes-or-no contracts on Robinhood’s trading platform.
Robinhood began carrying Kalshi contracts in early 2025. Its partners also include ForecastEx, owned by Interactive Brokers, and Rothera. Robinhood runs Rothera through a joint venture with Susquehanna International Group.
Robinhood said it will keep working with several exchanges. No agreement with Crypto.com has been reached, and the talks may not produce one.
Subscribe to our YouTube channel to watch leaders and journalists provide expert insights
The post Robinhood Bets on 3 Crypto Sectors as Blockchain Fees Hit $25 Million appeared first on BeInCrypto.

The U.S. Commodity Futures Trading Commission, which has claimed a role as the leading regulator of prediction markets firms run by companies such as Kalshi, Coinbase, Polymarket and Crypto.com, issued an advisory on Friday reminding the businesses that they shouldn’t cut corners with far-ranging contract certifications meant to encompass a wide array of events.
The agency said that “broad, template-style certifications should not be submitted,” marking the second time in recent months that the regulator has had to warn about overly generalized submissions.
Many of the “designated contract markets” regulated by the CFTC “continue to self-certify event contracts” (in other words, prediction market contracts) as broad templates “without supplying the terms and conditions of each proposed permutation and a concise explanation and analysis with respect to the product’s terms and conditions, the underlying commodity, and the product’s compliance,” the agency said.
The regulator said skirting the process can undermine its ability to work out whether the firm “has supplied all information, explanation and analysis required” and has “adequately evaluated the settlement methodology, data sources, and core-principles compliance of all permutations of the contract.”
The US and Iran both stopped their strikes, ending 13 consecutive nights of American bombing and leaving crypto traders holding the only liquid read on the pause.
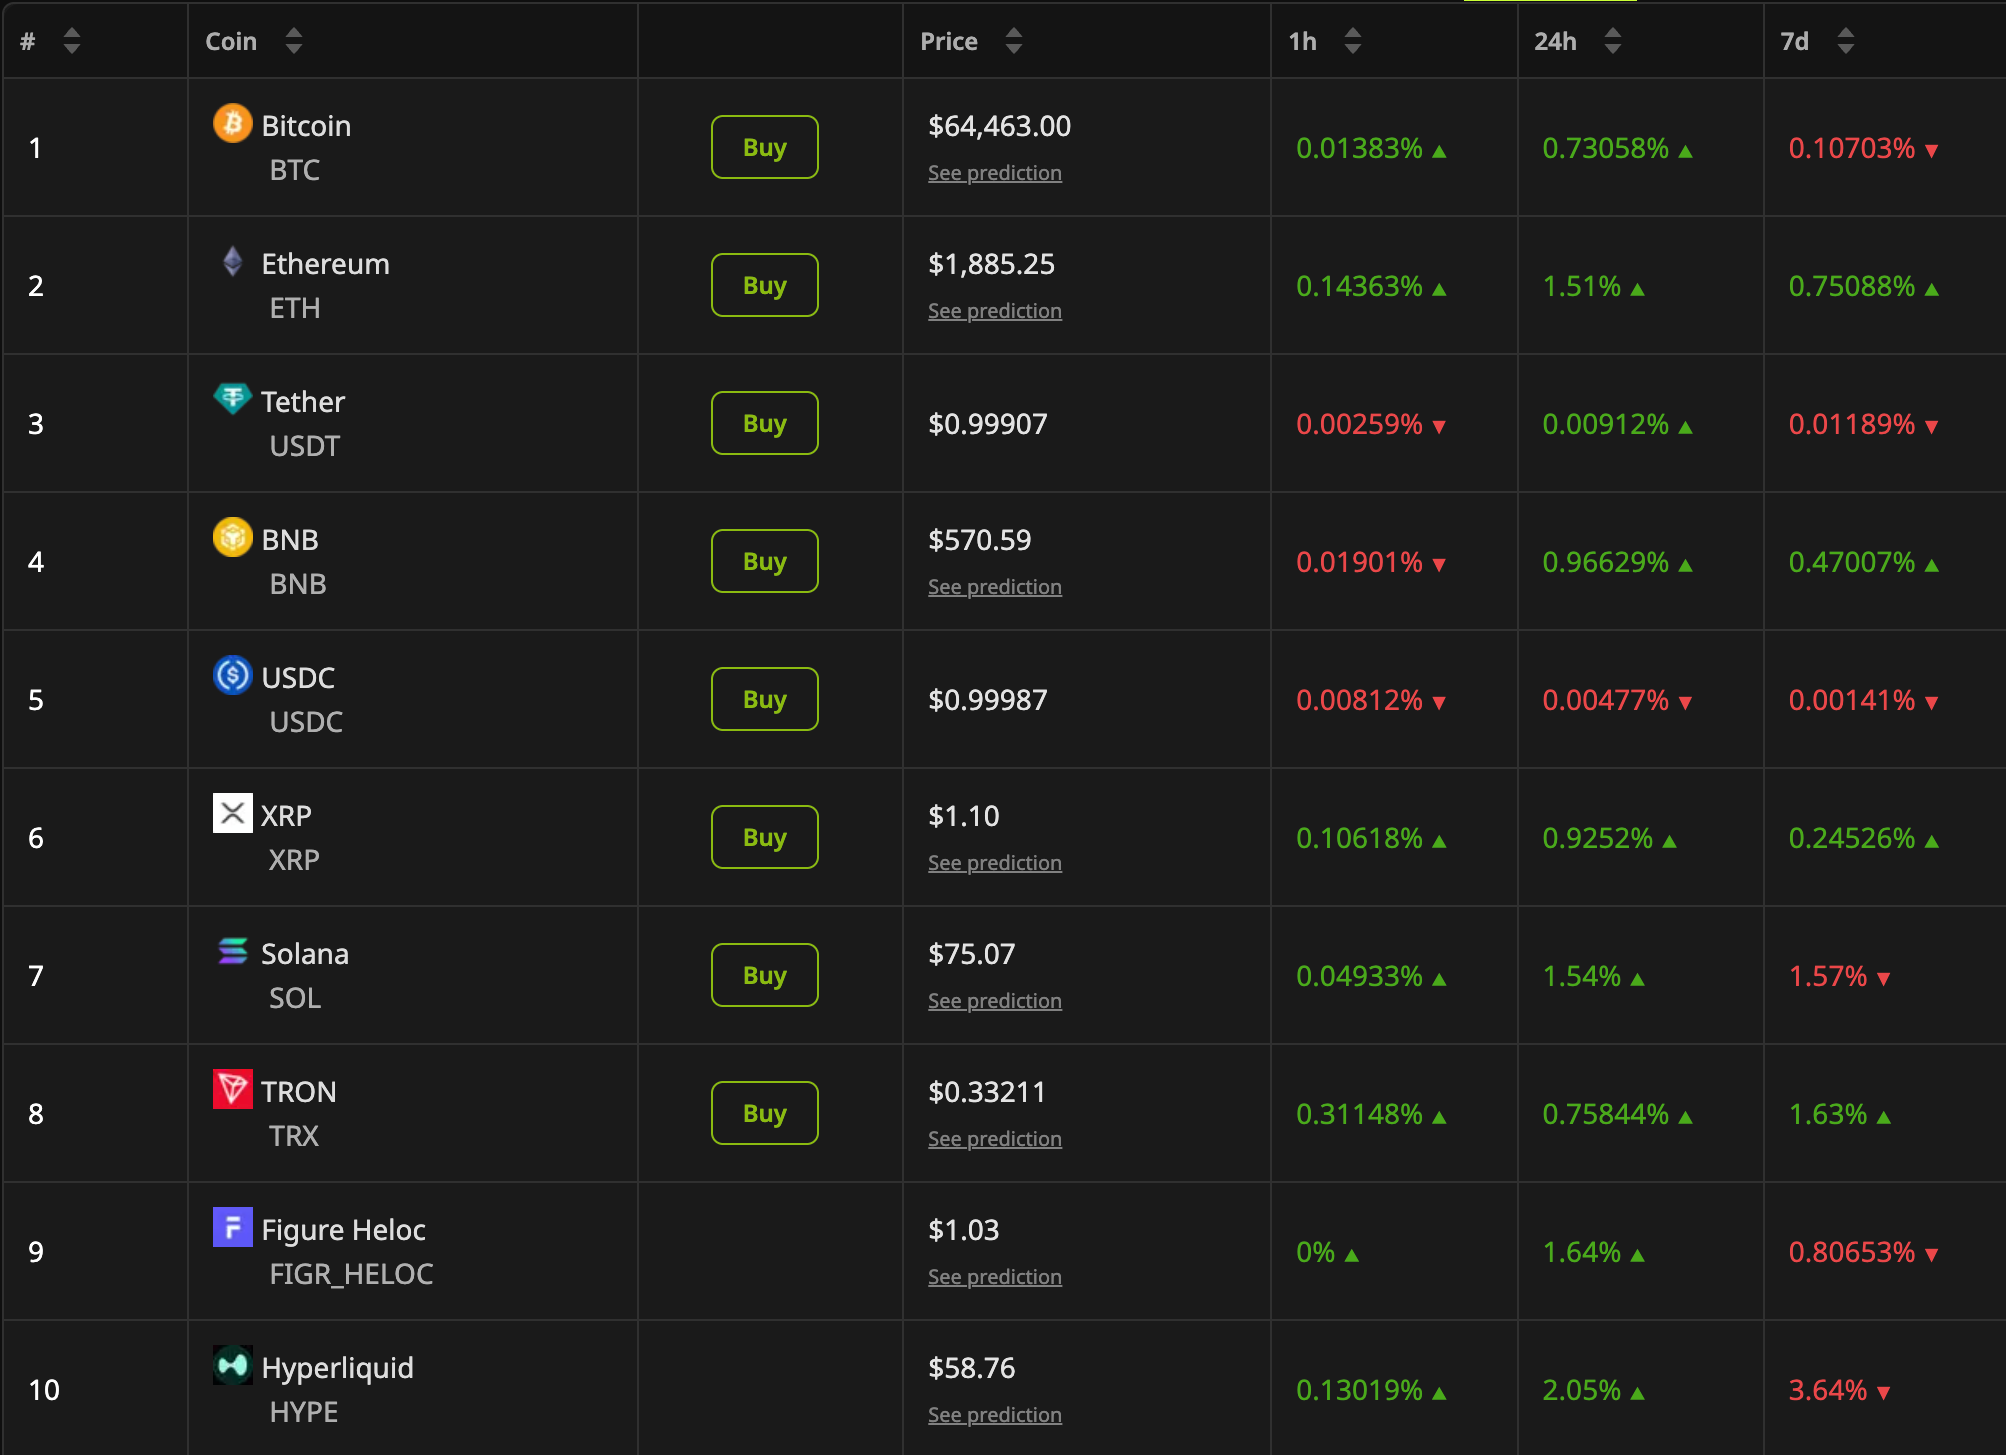
Bitcoin (BTC) traded near $64,463 on Sunday, up 0.7% over the past 24 hours, while the 10 largest digital assets posted modest gains. Oil and equity markets, however, closed before the strikes stopped.
US and Iran Pause Strikes
AP reported that the US paused its airstrikes on Friday after nearly two weeks of intensifying attacks. A US Department of Defense source told CNN that operations were on hold.
Iran has also stated that strikes on Gulf states and US interests in the region would be halted. Army spokesman, Amir Akraminia, confirmed it on Sunday.
“Our strategy has essentially been retaliatory, we have also halted our retaliatory operations,” Akraminia said.
The New York Times reported that Trump shelved plans for a broader campaign due to dwindling US air defense supplies. CNN noted that Gen. Dan Caine flagged concerns about munitions stockpiles.
Despite the de-escalation, it remains a pause rather than a formal ceasefire. US Central Command (CENTCOM) confirmed that its naval blockade of Iranian ports remains in place.
Follow us on X to get the latest news as it happens
Why Monday’s Asian Open Matters
Brent crude fell about 4% Friday to roughly $96.7. The benchmark had closed above $100 on Thursday for the first time since May.
Crypto, therefore, absorbed the weekend headlines alone. Total market capitalization reached $2.29 trillion on Sunday, up 0.84% over 24 hours.

Trading resumes on Monday, and the first prints will carry three days of news. Oil sets the direction for risk assets from there.
Higher crude lifts inflation expectations, which, in turn, shape the Federal Reserve’s policy and appetite for risk.
Analysts have warned against reading too much into a short lull. Michael Singh of the Washington Institute for Near East Policy told AP that duration is what matters.
“If it turns into a multiday pause, that’ll be something significant,” he said.
Houthi attacks in the Red Sea remain a second source of pressure on crude. The June ceasefire has not returned, and traffic through the strait remains halted. Monday’s crude open will show whether traders treat the pause as durable or as an operational gap.
Subscribe to our YouTube channel to watch leaders and journalists provide expert insights
The post US and Iran Pause Strikes as Markets Wait for Monday’s Verdict appeared first on BeInCrypto.
Ryan Reynolds Mocked For ‘Desperate’ Comic-Con Surprise

Megastar Chiranjeevi Extends Financial Help To ‘Gabbar Singh’ Actor Ramesh, Battling Brain Stroke

Emma Roberts is married! Actress marries Cody John in romantic Idaho ceremony after two-year engagement


-

 Fashion2 days ago
Weekend Open Thread: Brooks Brothers
-

 News Videos7 days ago
Big Money Is Entering XRP
-

 Crypto World5 days ago
Grayscale Files For Worldcoin ETF, WLD Registers Sharp Rise
-
 Tech6 days ago
Sail Virtually Aboard The “Itanic” With IA-64 Emulator
-
 Tech6 days ago
Turtle Beach Command Series KB7 review: a nifty screen-equipped gaming keyboard
-

 NewsBeat6 days ago
Unregistered fitter used Gas Safe logo on business flyers
-
 Business5 days ago
New Jersey voter registration controversy explained: How 6,600 noncitizens got on the rolls, and what happens next
-
 Entertainment5 days ago
Johnny Depp’s R-Rated Gothic Cult Classic Gets New Release Ahead of Sydney Sweeney Remake
-

 Crypto World4 days ago
Ethics, other provisions in crypto Clarity Act to be further discussed
-

 Tech6 days ago
Watch Flock Safety CEO Garrett Langley discuss the future of surveillance at TechCrunch Disrupt 2026
-
 NewsBeat6 days ago
Shanghai science forum photos show China’s AI and robotics advances in rivalry with US
-
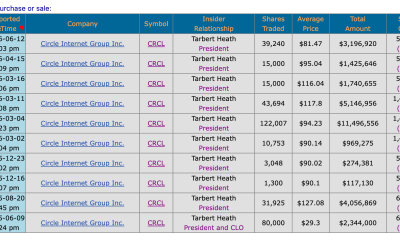
 Crypto World6 days ago
Circle’s President Sold Over 360,000 Shares, The Filings Explain Why
-

 Tech6 days ago
Subway Sandwich Computers Get a Second Life as Gaming Machines
-

 News Videos3 days ago
The Peugeot Family: How 200 Years of an “Old Money” Dynasty Died in A Boardroom
-

 Sports3 days ago
2026 3M Open leaderboard: Scottie Scheffler finds putter in Round 1, sits three back
-

 Tech7 days ago
How To Use Claude’s Reflect Dashboard And Learn When It’s Time To Touch Grass
-

 Fashion3 days ago
16 Dresses for the High Summer Event
-

 Entertainment7 days ago
Stephen Colbert Returns to Social Media After Late Show End
-

 Tech6 days ago
The 35 Best Board Games for Family Game Night
-

 Crypto World6 days ago
Andrew Cuomo joins OKX board as crypto exchange expands in U.S.
You must be logged in to post a comment Login