

Crypto World
Anatomy of the June crypto crash: Fed, Iran, Saylor



The June 2026 crypto crash did not have one cause. It had a convergence.
Summary
- Bitcoin fell from above $80,000 to below $62,000 as four separate pressures converged.
- A hawkish Fed removed the expected liquidity support before geopolitical tensions accelerated the selloff.
- Strategy’s 32 BTC sale was small financially but damaged sentiment in an already fragile market.
- A record 13-day ETF outflow streak removed institutional demand as leveraged positions were liquidated.
Over a brutal stretch from late May into early June, Bitcoin fell from above $80,000 to below $62,000, Ethereum collapsed toward $1,500, roughly $250 billion evaporated from the total crypto market, and well over $1 billion in leveraged positions were liquidated.
But unlike a single-catalyst crash, this one was the product of four distinct forces arriving at once, each amplifying the others: a hawkish Federal Reserve that crushed hopes for rate cuts, fresh US-Iran military strikes that shattered a fragile ceasefire, Michael Saylor’s Strategy breaking a years-long vow by selling Bitcoin, and the longest Bitcoin ETF outflow streak ever recorded.
None of them alone would have produced a crash of this severity. Together, landing in a market already stretched thin on leverage, they produced a cascade.
This piece is the anatomy of that crash: the four forces, how they compounded, and why understanding the convergence matters more than blaming any single trigger.
The setup: a market primed to fall
Before the four forces hit, the market was already fragile, and that fragility is what turned a set of bad headlines into a $250 billion collapse.
Bitcoin had run up to around $82,000 by mid-May, recovering through the spring on an ascending trend that traders had come to rely on. But beneath the rising price, leverage had been accumulating.
The derivatives market filled with crowded long positions, funding rates ran hot as traders paid premiums to bet on further upside, and open interest swelled to levels not seen since the prior cycle’s peak.
This is the condition that makes a market dangerous: a large mass of leveraged long positions stacked at similar price levels, each with a liquidation point waiting below, like dominoes lined up and waiting for the first push.
A market in this state does not need a catastrophe to crash. It needs a trigger big enough to knock over the first domino, after which the leverage does the rest automatically.
The lower a leveraged long’s liquidation price is hit, the more forced selling it generates, which pushes the price down to the next cluster, which triggers more selling, in a self-reinforcing cascade that runs far faster than human reaction.
The market in late May 2026 was a tower of leverage waiting for a reason to topple.
That is the essential context for everything that followed. The four forces that arrived were the triggers, but the leverage was the fuel.
A market with less leverage would have absorbed the same headlines with a routine pullback. A market this stretched amplified them into one of the most violent deleveraging events in recent memory.
Understanding the crash means understanding that the four catalysts did not just push the price down directly; they lit a leverage structure that was primed to explode.
Force one: the Fed crushes rate-cut hopes
The deepest and most structural of the four forces was monetary policy, because it set the hostile backdrop against which everything else played out.
Through early 2026, crypto bulls had counted on Federal Reserve rate cuts to fuel the next leg up, because easy money and low rates push capital toward speculative assets.
Those hopes were systematically crushed. The April FOMC meeting produced an 8-4 vote to hold rates at 3.50% to 3.75%, the most dissents since 1992, signaling deep division but a hawkish majority.
Then a strong U.S. jobs report landed, undercutting the case for imminent cuts because a hot labor market gives the Fed no reason to ease. By early June, markets were pricing roughly a 68.8% probability of zero rate cuts in all of 2026.
The arrival of a new Fed chair added uncertainty, not relief. Kevin Warsh, sworn in on May 22, is the most crypto-literate chair in history, but he is also a monetary hawk, and he had not had time to establish his approach, leaving the market guessing.
His signals of independence from political pressure for cuts dashed hopes that a Trump-appointed chair would ease aggressively. The monetary backdrop therefore went from “cuts are coming” to “no cuts in 2026 and a hawk in charge,” which is precisely the environment that drains liquidity from risk assets like crypto.
This force was structural more than acute. It did not crash the market on a single day, but it removed the foundation the bull case rested on and created the risk-off backdrop in which the other three forces could do maximum damage.
With rate cuts off the table, there was no liquidity tailwind to cushion any shock, and every other negative catalyst hit a market that had lost its expected support.
The Fed did not light the fuse, but it soaked the market in the conditions that made the fire spread.
Force two: Iran shatters the ceasefire
The second force was geopolitical, and it provided the acute risk-off shock that monetary policy had set the stage for.
A fragile US-Iran ceasefire had been holding since April, keeping a lid on Middle East tensions. In early June, it shattered in a rapid sequence.
On June 1, Iran suspended talks with the U.S. over Israel’s actions in Lebanon. Trump publicly contradicted that the same day, claiming talks continued at a rapid pace, injecting confusion.
Then on June 2, Iran fired missiles at Kuwait and Bahrain, and the U.S. retaliated that night with strikes on an Iranian military facility on Qeshm Island.
The ceasefire was over, and the region was back to active military exchange.
The market effect was immediate and followed the classic risk-off pattern. Geopolitical conflict, especially involving a major oil-producing region and a critical shipping chokepoint, drives capital out of risk assets and into perceived safety.
It also pushed oil prices higher, adding an inflationary worry on top of the geopolitical fear. Crypto, sitting at the riskiest end of the asset spectrum, was among the first things sold as investors reduced exposure across the board.
The Iran strikes were the kind of sudden, frightening headline that prompts immediate de-risking.
This force was the acute trigger to the Fed’s structural backdrop. Where the rate-cut disappointment created the hostile environment, the Iran escalation provided the sharp shock that started the selling in earnest.
It was the geopolitical equivalent of the first push on the dominoes, sending the price down toward the leveraged liquidation clusters that were waiting.
Because it coincided with the other forces rather than arriving alone, its risk-off pressure stacked on top of everything else hitting the market in the same window.
Force three: Saylor breaks the vow
The third force was the one that hit sentiment hardest relative to its actual size: Michael Saylor’s Strategy selling Bitcoin for the first time in nearly four years.
On June 1, Strategy disclosed it had sold 32 Bitcoin, breaking a years-long vow never to sell.
In pure market terms, the sale was negligible: 32 coins worth about $2.5 million, a rounding error against the company’s holdings of more than 843,000 Bitcoin and against the tens of billions in daily global Bitcoin volume.
The sale itself moved nothing. But its symbolism moved a great deal.
Strategy and Saylor had become the standard-bearers for never-sell conviction, the most visible institutional believers whose refusal to sell was a load-bearing belief for a certain kind of Bitcoin holder.
When the filing showed Strategy selling, it did not register as a tiny dividend-funding operation, which is what it actually was. It registered as the ultimate diamond hands blinking.
In a fearful, over-leveraged market, that psychological blow was enough to accelerate the selling. Retail traders pointed to the Saylor sale as a primary cause of the crash, which says less about the sale’s real impact than about its outsized effect on sentiment.
This force illustrates the crash’s compounding nature perfectly. The Saylor sale would have been a non-event in a calm, unleveraged market.
But arriving alongside the Fed disappointment, the Iran shock, and the ETF outflows, into a market primed with leverage, it became the sentiment trigger that helped tip the price into the leveraged liquidation zones.
It is the clearest example of how the convergence mattered more than any single force: a $2.5 million sale helping to catalyze a $250 billion crash makes no sense in isolation and perfect sense as one of four blows landing simultaneously on a fragile market.
Force four: the record ETF exodus
The fourth force was the one that turned crypto’s largest source of demand into a source of supply: the longest Bitcoin ETF outflow streak ever recorded.
Since their January 2024 launch, the U.S. spot Bitcoin ETFs had become a major structural source of buying, a steady institutional bid that absorbed supply and supported the price through the 2024-2025 rise.
In the run-up to and through the crash, that bid reversed.
The ETFs recorded 13 consecutive trading days of net outflows from May 15 to June 3, the longest streak since launch, draining roughly $4.4 billion and flipping the year’s cumulative flows negative for the first time.
BlackRock’s IBIT alone shed around $3.3 billion. The single worst week saw $3.4 billion leave, the largest weekly outflow on record.
The significance is structural. ETF flows had become a dominant driver of Bitcoin’s price, by some estimates accounting for a large share of weekly price moves.
When the ETFs are buying, they cushion dips and amplify rallies. When they are selling, as during this streak, they remove the buyer that might otherwise have stabilized the market and become a source of supply that drags the price down.
At the exact moment the other three forces were pushing the price down, the ETF complex was not there to absorb the selling. The marginal institutional bid had turned into a marginal offer.
This force was both a cause and a symptom, which is what made it so damaging.
The outflows were partly driven by the same macro forces, the Fed and the risk-off shift, that were driving everything else, so they reflected the broader negativity.
But they also actively deepened the crash by removing demand and adding supply, creating a feedback loop: macro fear drove ETF outflows, which drove the price down, which deepened the fear.
With the ETF bid gone, the leverage cascade triggered by the other forces had nothing to absorb it, and the price fell through support level after support level.
Why the convergence is the real story
The lasting lesson of the June crash is that it was a convergence, not a trigger, and that distinction matters for understanding both this crash and how to read the next one.
The instinct after any crash is to find the single cause, and different observers picked different villains: the Saylor sale, the Iran strikes, the Fed, or the ETF outflows.
But the honest reading is that no single one of these would have produced a crash of this magnitude.
The Saylor sale was tiny. The Iran shock, in a healthy market, might have caused a modest dip. The Fed disappointment was structural background. The ETF outflows were serious but represented a fraction of lifetime inflows.
What made June a $250 billion crash was that all four arrived in the same narrow window, into a market primed with leverage, so that each amplified the others.
The Fed removed the support, Iran provided the shock, Saylor broke the sentiment, the ETFs removed the bid, and the leverage turned the combination into a cascade.
This is why the convergence framing is more useful than the blame framing.
If you believe the crash was caused by the Saylor sale, you would expect it to reverse once Strategy stopped selling, which misreads the situation entirely.
If you understand it as a convergence, you know that recovery depends on the underlying forces: whether the Fed pivots, whether the Iran tensions ease, whether the ETF flows turn positive, and whether the leverage has been fully flushed.
The crash was systemic in the sense that it emerged from the interaction of multiple forces, not from one cause that can be isolated and fixed.
The practical takeaway is to watch the four forces rather than hunt for a single explanation, because the same convergence logic governs the recovery.
The leverage cascade has likely flushed much of the excess, which is mechanically a reset. But the macro forces, the Fed’s rate path, the Iran situation, and the ETF flow direction, remain the variables that determine whether June was a capitulation bottom or a waypoint to lower levels.
The June 2026 crash was the anatomy of a convergence: four forces, one fragile leveraged market, and a cascade that none of them would have produced alone.
Understanding it that way is the difference between blaming a villain and reading the market, and only the second one helps you understand what comes next.
This article is for informational purposes and does not constitute financial or investment advice. Cryptocurrency markets are highly volatile. The figures and analysis described reflect data available as of June 2026. Always do your own research and consult with qualified financial professionals before making investment decisions.

Ripple’s token is showing signs of stabilization after the sharp decline from higher levels, but the recovery remains limited by a series of resistance zones that continue to attract sellers. While buyers have defended the recent lows, the market still needs a clear structural breakout before a stronger upside move can be considered.
Ripple Price Analysis: The Daily Chart
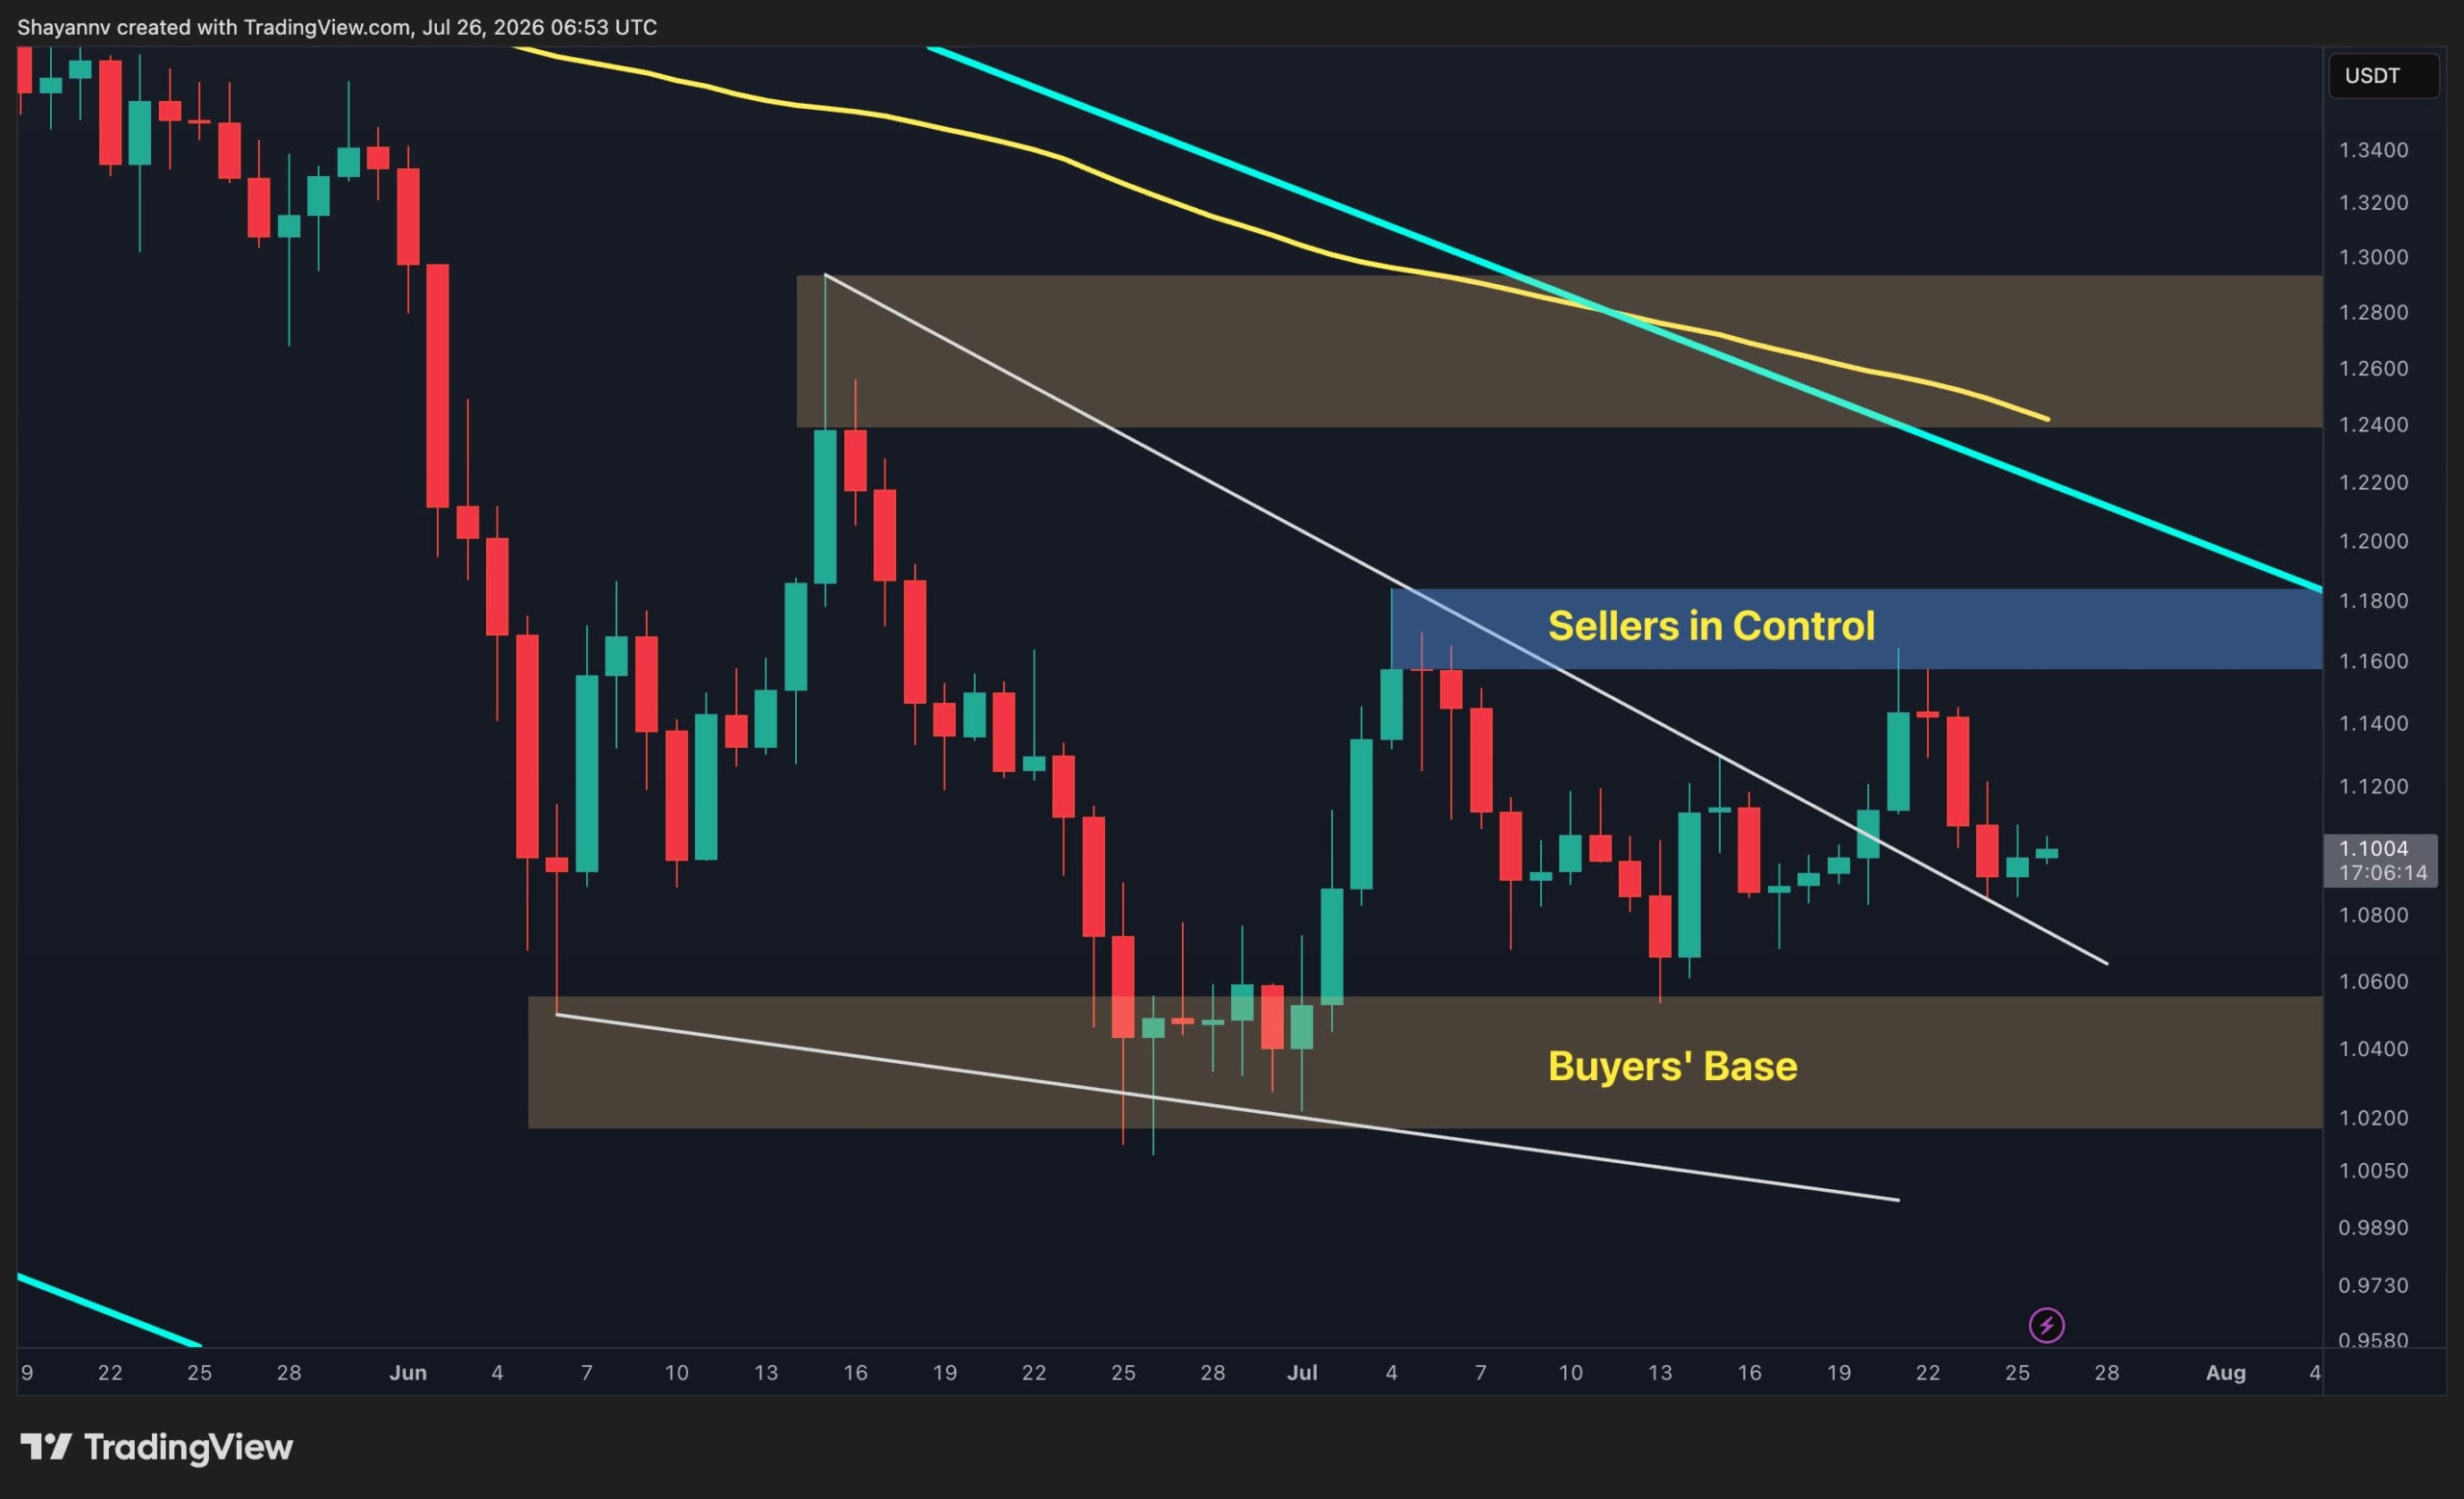
On the daily timeframe, XRP continues to trade inside a broader descending channel that has shaped the price action for months. The recent rebound from the $1.02 to $1.04 demand zone has helped the asset recover, but the move has not yet changed the larger bearish structure.
The main challenge for buyers remains the $1.17 to $1.2 supply zone, which sits near the upper boundary of the descending channel. A successful breakout above this region could open the path toward the next resistance area around $1.28. However, as long as XRP remains below this level, the current recovery may still represent a corrective move within the broader downtrend.
A rejection from the current resistance area could send the price back toward the $1.05 to $1.07 support region, while a deeper decline would bring the $1.02 to $1.04 buyers’ base back into focus.
XRP/USDT 4-Hour Chart
The 4-hour chart highlights the ongoing struggle between buyers attempting to build a base and sellers defending the overhead supply. XRP recently pushed toward the $1.16 to $1.18 resistance zone but failed to secure a breakout, keeping the short-term structure vulnerable.
The $1.16 – $1.18 supply range remains an important barrier, with price action still showing difficulty reclaiming the area above it. Until the asset breaks above this price region and confirms strength above it, upside attempts may continue to face selling pressure.
On the downside, the ascending wedge’s lower trendline remains the key support area. Holding above this zone would preserve the possibility of another recovery attempt, while a breakdown below it would weaken the current setup and increase the risk of further downside.

The post Ripple Price Analysis: XRP Could Be Heading for a Major Move Next Week appeared first on CryptoPotato.
After staging an impressive rebound from its local bottom, Ethereum is beginning to test increasingly important resistance levels. The coming sessions should provide more clarity on whether this recovery has enough momentum to continue.
Ethereum Price Analysis: The Daily Chart
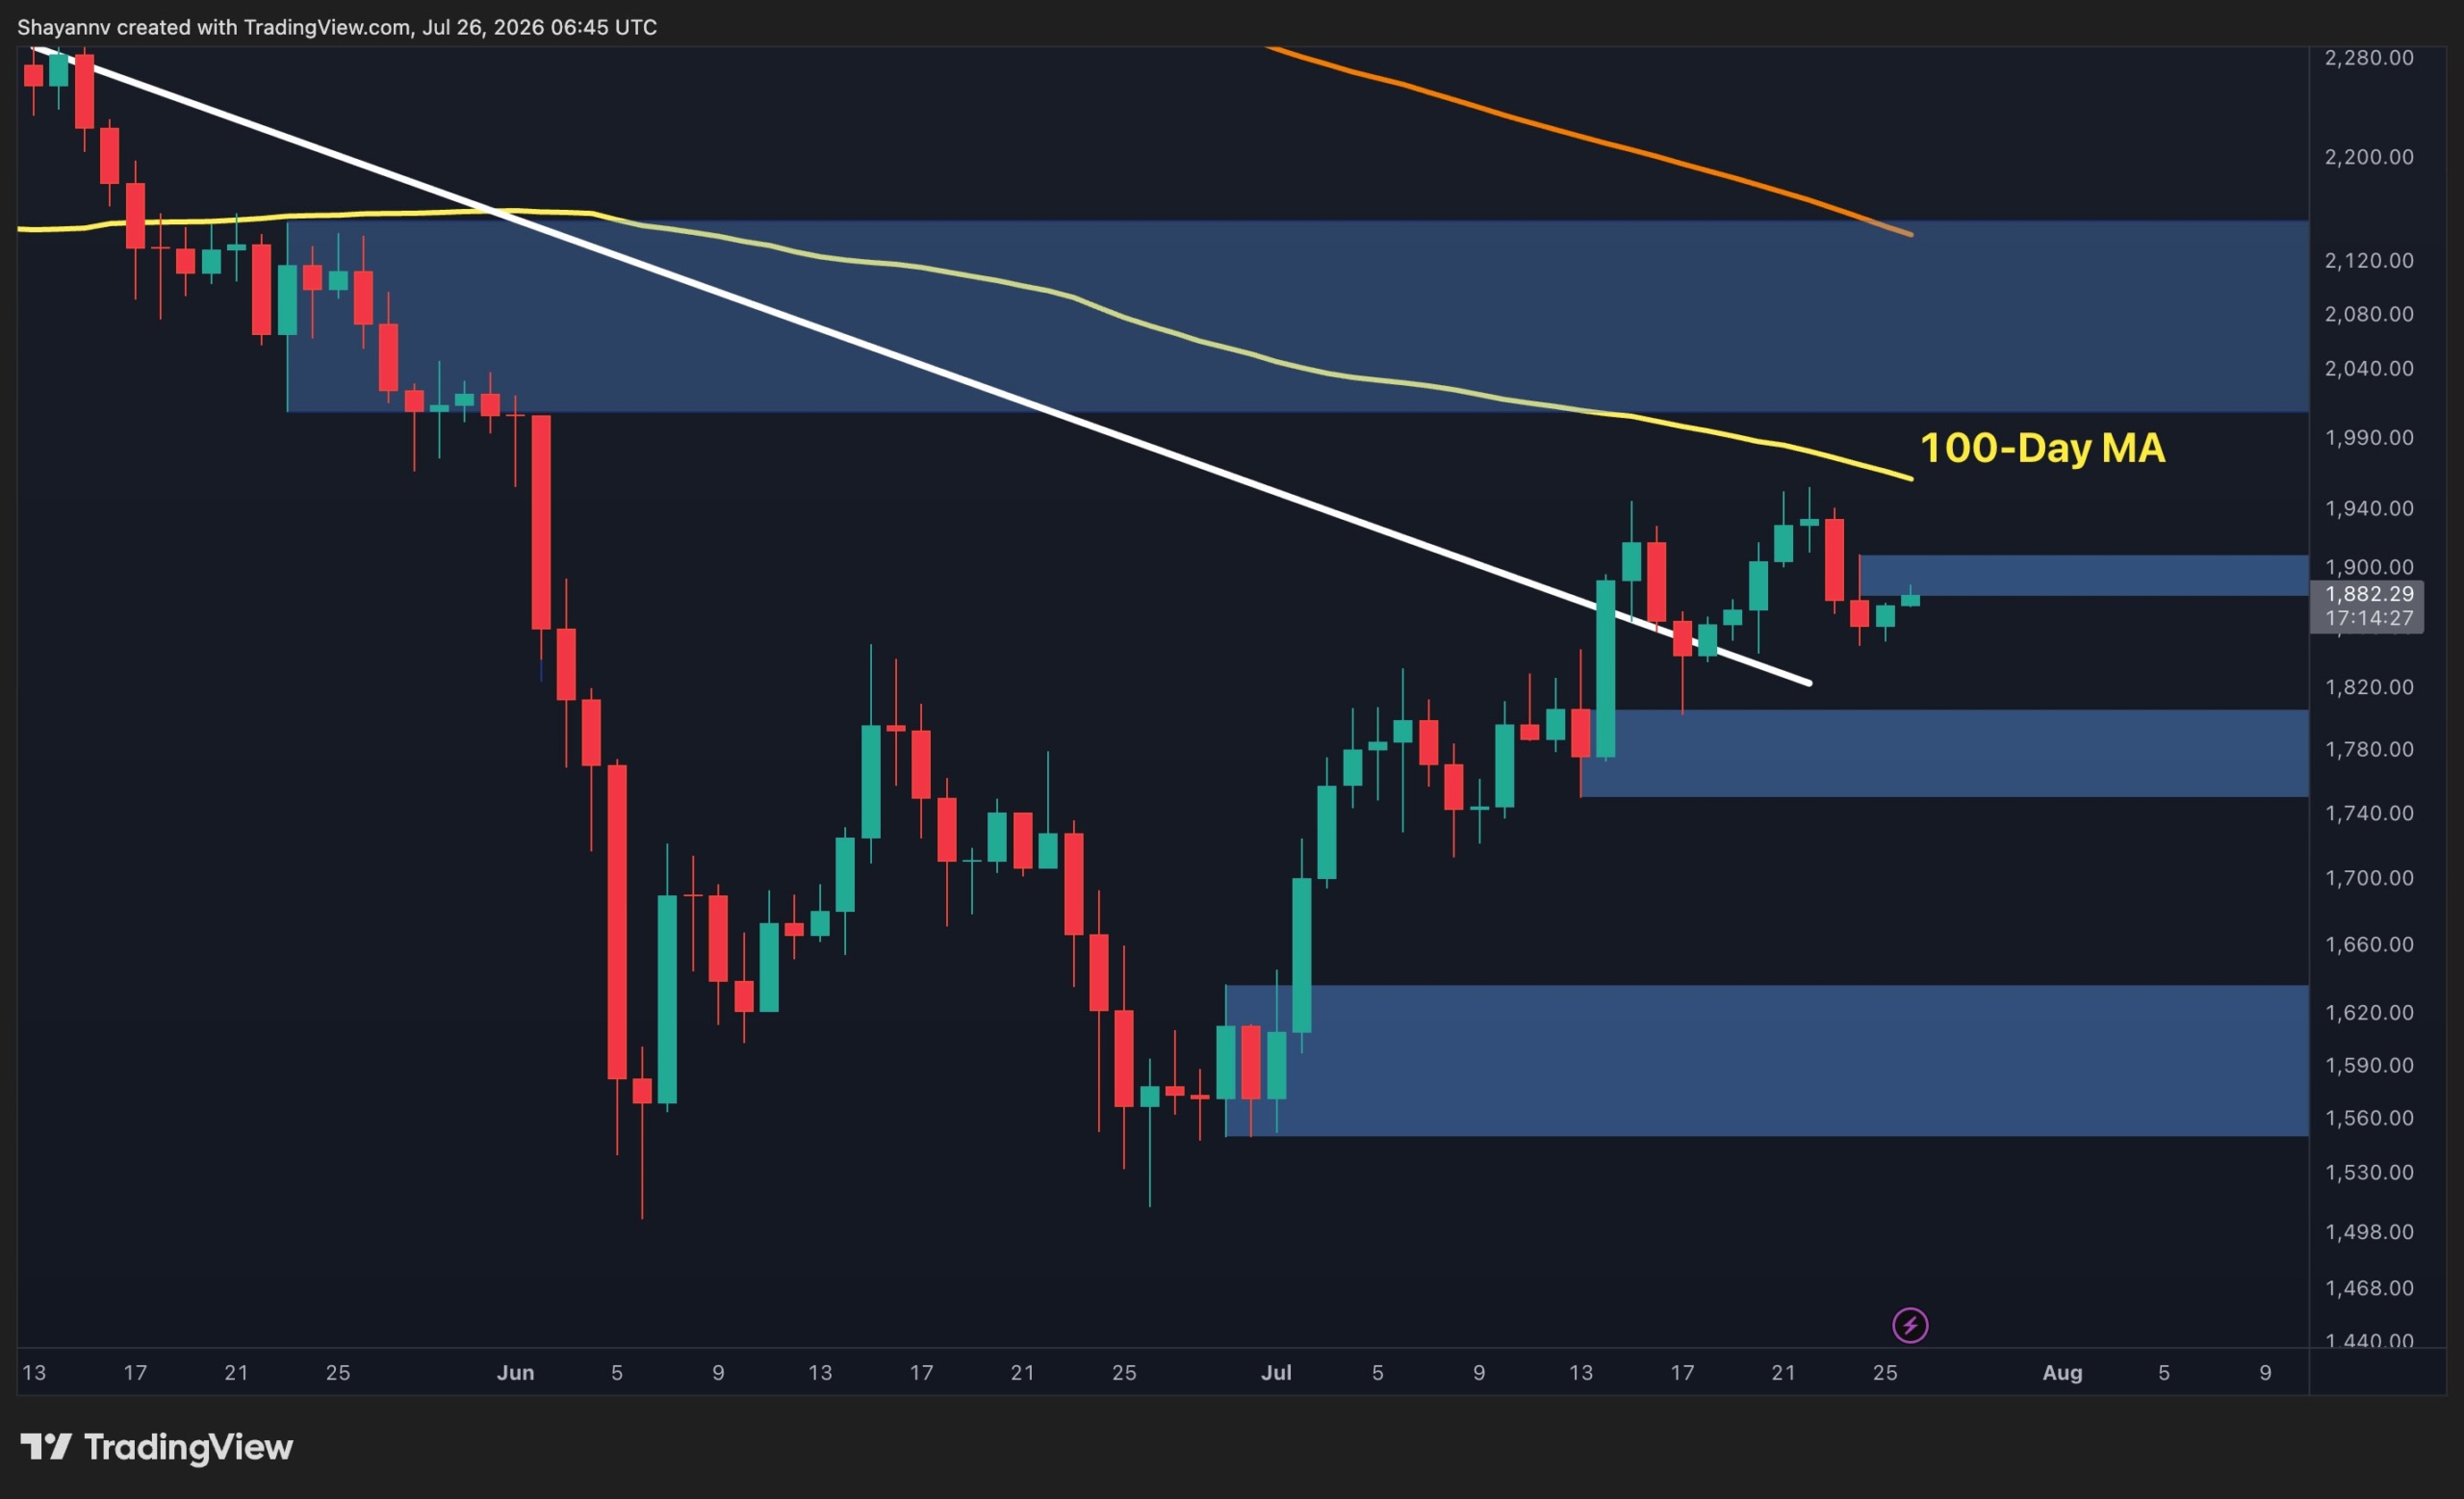
The daily chart shows ETH holding above the previously broken descending trendline, confirming that the medium-term structure has improved compared to the aggressive selloff seen in June. Following the breakout, the market has successfully established a sequence of higher highs and higher lows while consolidating above the $1.76K to $1.82K support region.
However, the recovery is now approaching a major technical barrier. The $1.88K to $1.91K supply zone is acting as the first resistance, while the declining 100-day moving average sits just overhead near the $1.95K area. This creates a confluence of resistance that could cap the current rally before ETH attempts to challenge the broader long-term supply zone between roughly $2K and $2.15K.
As long as the price remains above the $1.76K to $1.82K support, buyers maintain the short-term advantage. Losing that area, however, would expose the next support around $1.55K to $1.64K and weaken the current bullish structure.
ETH/USDT 4-Hour Chart
On the 4-hour timeframe, Ethereum has slipped slightly below the ascending trendline that had guided the recovery throughout July. While the break is not yet decisive, it signals that bullish momentum is beginning to weaken as the price trades inside the $1.88K to $1.91K supply zone. The current structure suggests that buyers are losing some control after failing to extend the recent rally.
If ETH remains below the broken trendline, the move could evolve into a deeper retracement toward the notable demand zone around $1.76K to $1.79K, where buyers would be expected to step in. Conversely, reclaiming the trendline and securing a breakout above the $1.88K to $1.91K resistance would invalidate the short-term weakness and increase the probability of another push toward the $1.95K to $2K region.

Sentiment Analysis
The one-month Binance ETH liquidation heatmap shows a substantial concentration of liquidity around the $1.5K level. Although Ethereum is currently trading well above that region, this cluster remains an important magnet from a derivatives perspective.
If the current rally loses momentum and sellers regain control, a deeper correction toward the $1.5K liquidity pocket could attract price as leveraged long positions are unwound.
Such a move would likely coincide with a break below the key technical supports visible on the chart. Until then, the prevailing structure remains constructive, but the presence of this large liquidity cluster highlights that downside risk has not completely disappeared despite the recent recovery.

The post Ethereum Price Analysis: ETH Hits a Decision Point as Major Resistance Comes Into Play appeared first on CryptoPotato.


Dormant Bitcoin activity fell to its lowest level since Q3 2022, suggesting long-term holders have slowed distribution after heavy profit-taking.
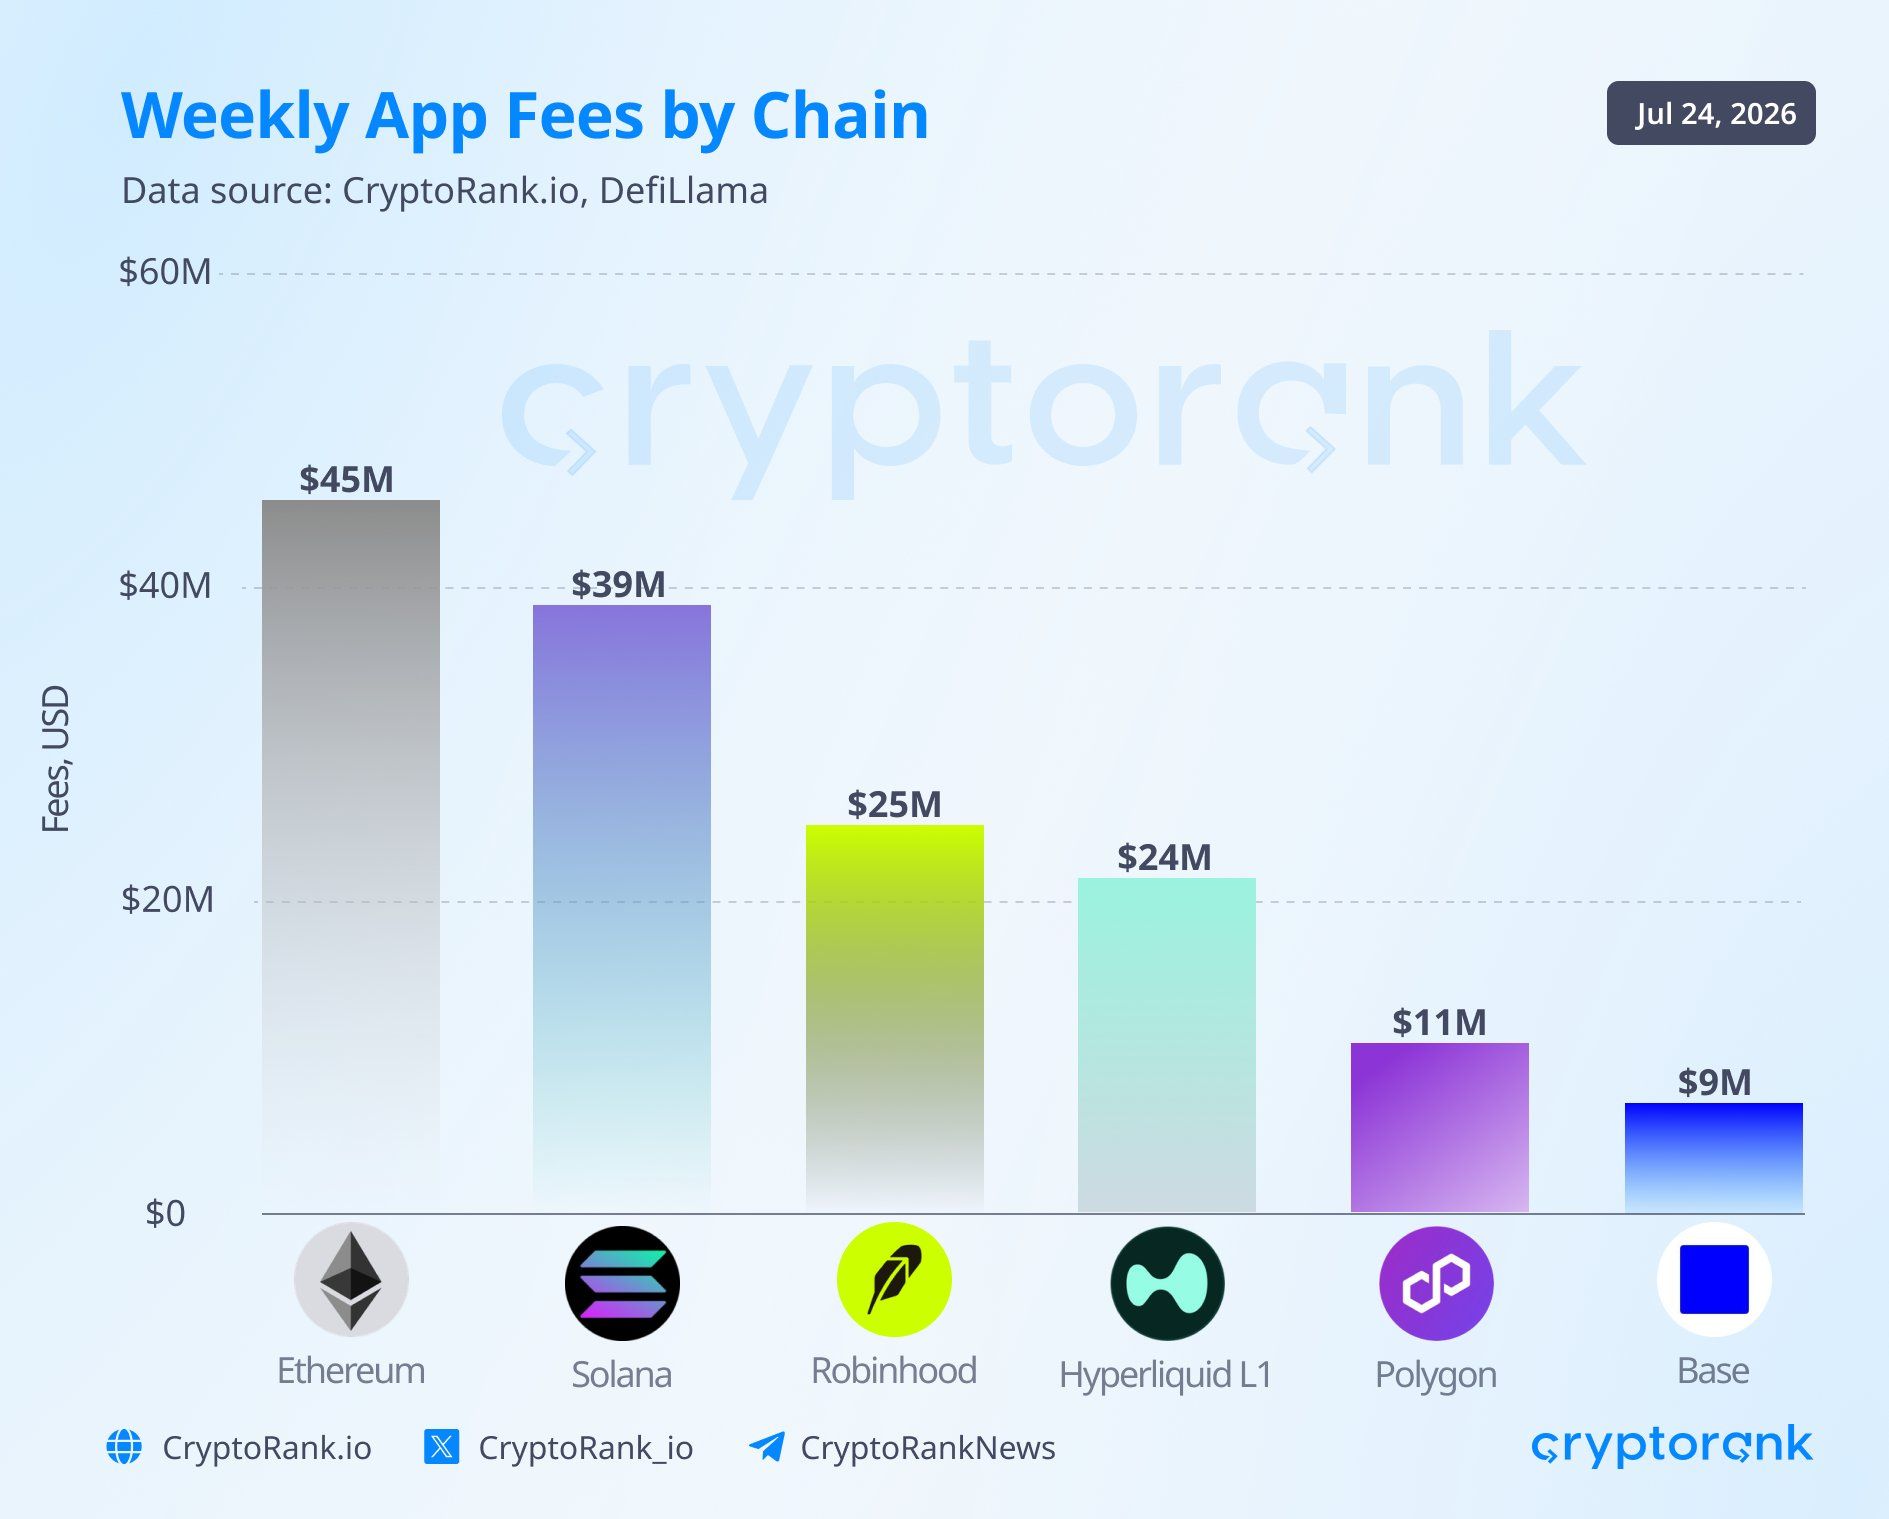
Robinhood Chain ranked 3rd by weekly application fees in the week ending July 24. Meme coins and tokenized assets trade side by side on the 4-week-old network.
Now Robinhood is pushing deeper into prediction markets, widening its bets across 3 crypto sectors.
Fees Hit $25 Million as Meme Coins Outpace the RWA Pitch
Applications on Robinhood Chain generated $25 million in fees over the week ending July 24. Only Ethereum (ETH) at $45 million and Solana (SOL) at $39 million ranked higher, per CryptoRank.
“Robinhood Chain’s third-place position makes it one of the strongest blockchain launches in recent years,” CryptoRank said.
Follow us on X to get the latest news as it happens

Robinhood built a layer-2 network for tokenized real-world assets (RWA). Recent activity shows a different mix. According to data from Dune, Cash Cat (CASHCAT) ranks first among the top traded tokens on the network.
The meme coin has logged $824.89 million in lifetime volume across 1.37 million trades. Tokenized assets are growing, too, though rarely on their own.
Daily RWA trading peaked at $61.1 million on July 23. Meme coin and tokenized stock pairs supplied $46.1 million, or about 75%.
The chain’s tokenized asset base also grew. The total RWA value on the chain climbed to $25.4 million on July 24, the highest since launch. Tokenized stocks made up $21.9 million.

Prediction Markets Sit Off the Chain
As meme coin and RWA trading grow, Robinhood is also pushing deeper into prediction markets in its app. The Journal reported that Robinhood is in talks with Crypto.com. A partnership would let users trade the exchange’s yes-or-no contracts on Robinhood’s trading platform.
Robinhood began carrying Kalshi contracts in early 2025. Its partners also include ForecastEx, owned by Interactive Brokers, and Rothera. Robinhood runs Rothera through a joint venture with Susquehanna International Group.
Robinhood said it will keep working with several exchanges. No agreement with Crypto.com has been reached, and the talks may not produce one.
Subscribe to our YouTube channel to watch leaders and journalists provide expert insights
The post Robinhood Bets on 3 Crypto Sectors as Blockchain Fees Hit $25 Million appeared first on BeInCrypto.
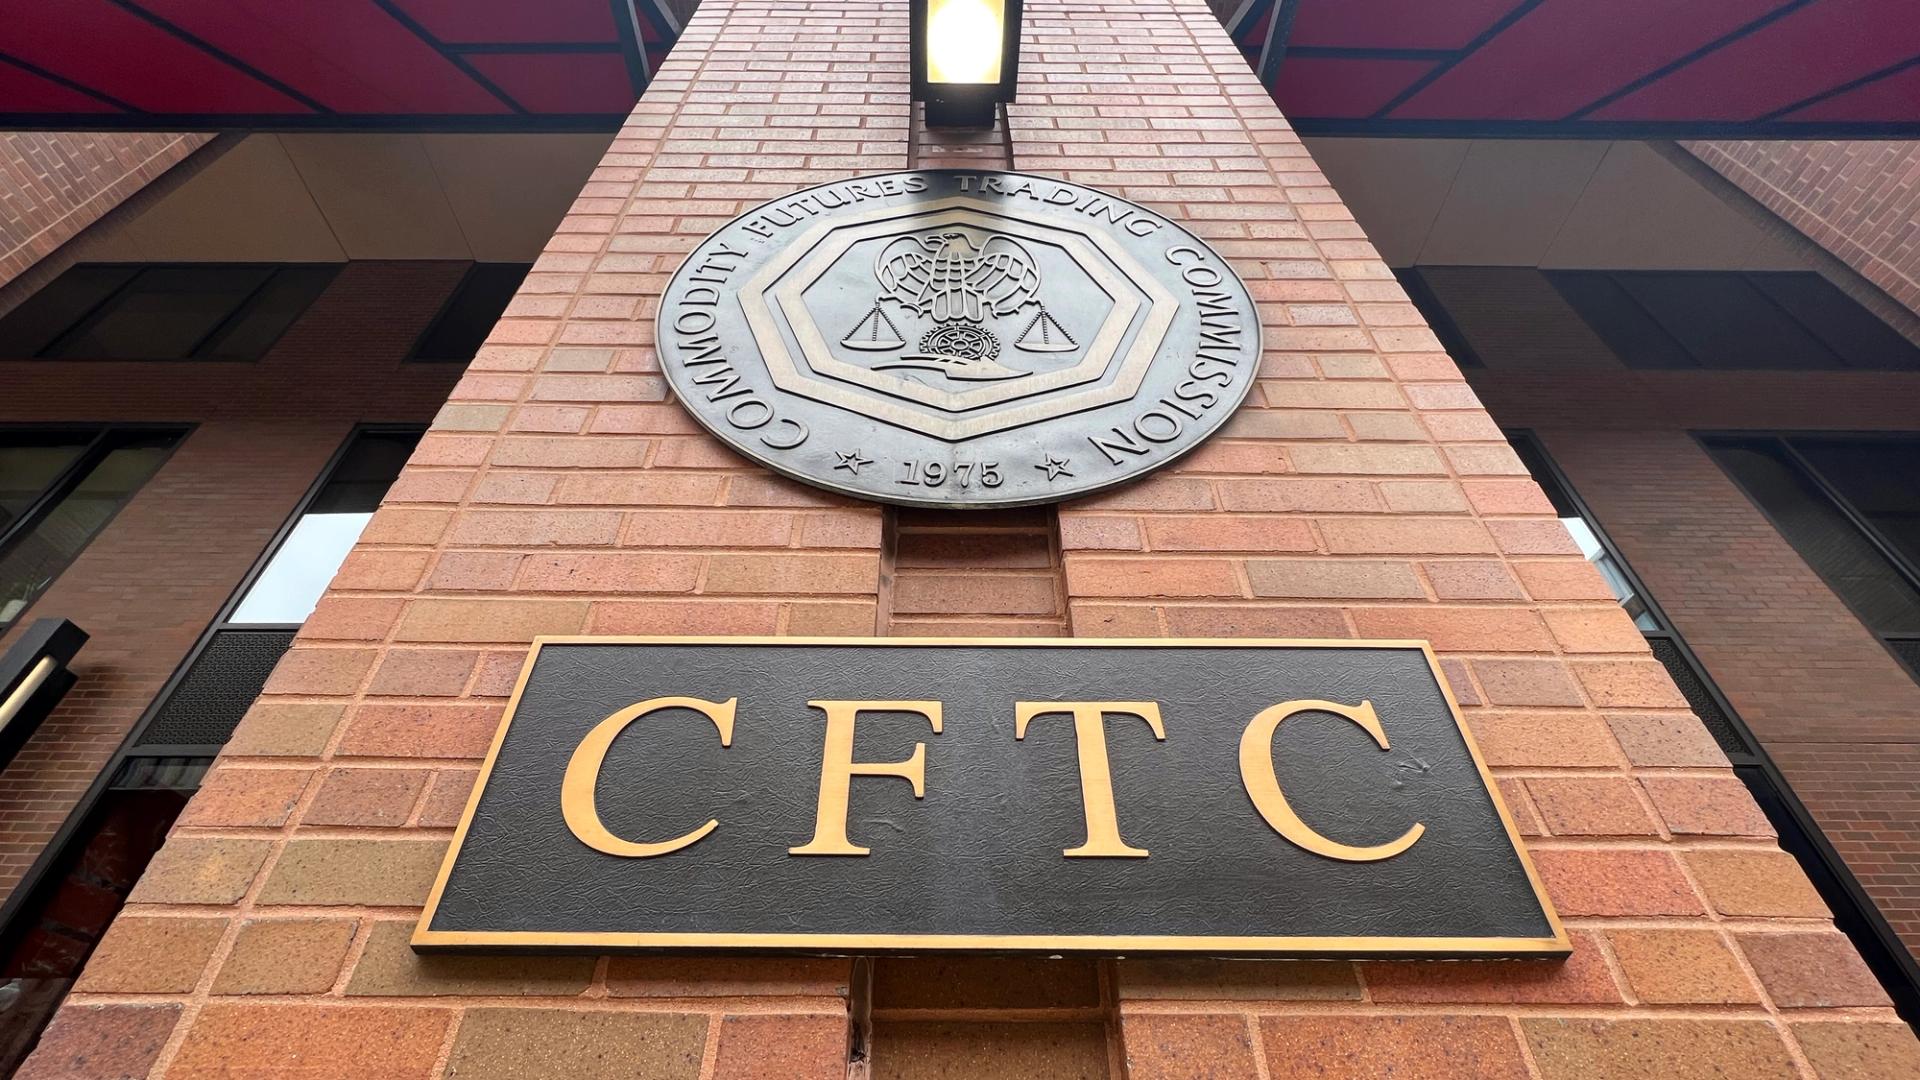
The U.S. Commodity Futures Trading Commission, which has claimed a role as the leading regulator of prediction markets firms run by companies such as Kalshi, Coinbase, Polymarket and Crypto.com, issued an advisory on Friday reminding the businesses that they shouldn’t cut corners with far-ranging contract certifications meant to encompass a wide array of events.
The agency said that “broad, template-style certifications should not be submitted,” marking the second time in recent months that the regulator has had to warn about overly generalized submissions.
Many of the “designated contract markets” regulated by the CFTC “continue to self-certify event contracts” (in other words, prediction market contracts) as broad templates “without supplying the terms and conditions of each proposed permutation and a concise explanation and analysis with respect to the product’s terms and conditions, the underlying commodity, and the product’s compliance,” the agency said.
The regulator said skirting the process can undermine its ability to work out whether the firm “has supplied all information, explanation and analysis required” and has “adequately evaluated the settlement methodology, data sources, and core-principles compliance of all permutations of the contract.”
The US and Iran both stopped their strikes, ending 13 consecutive nights of American bombing and leaving crypto traders holding the only liquid read on the pause.
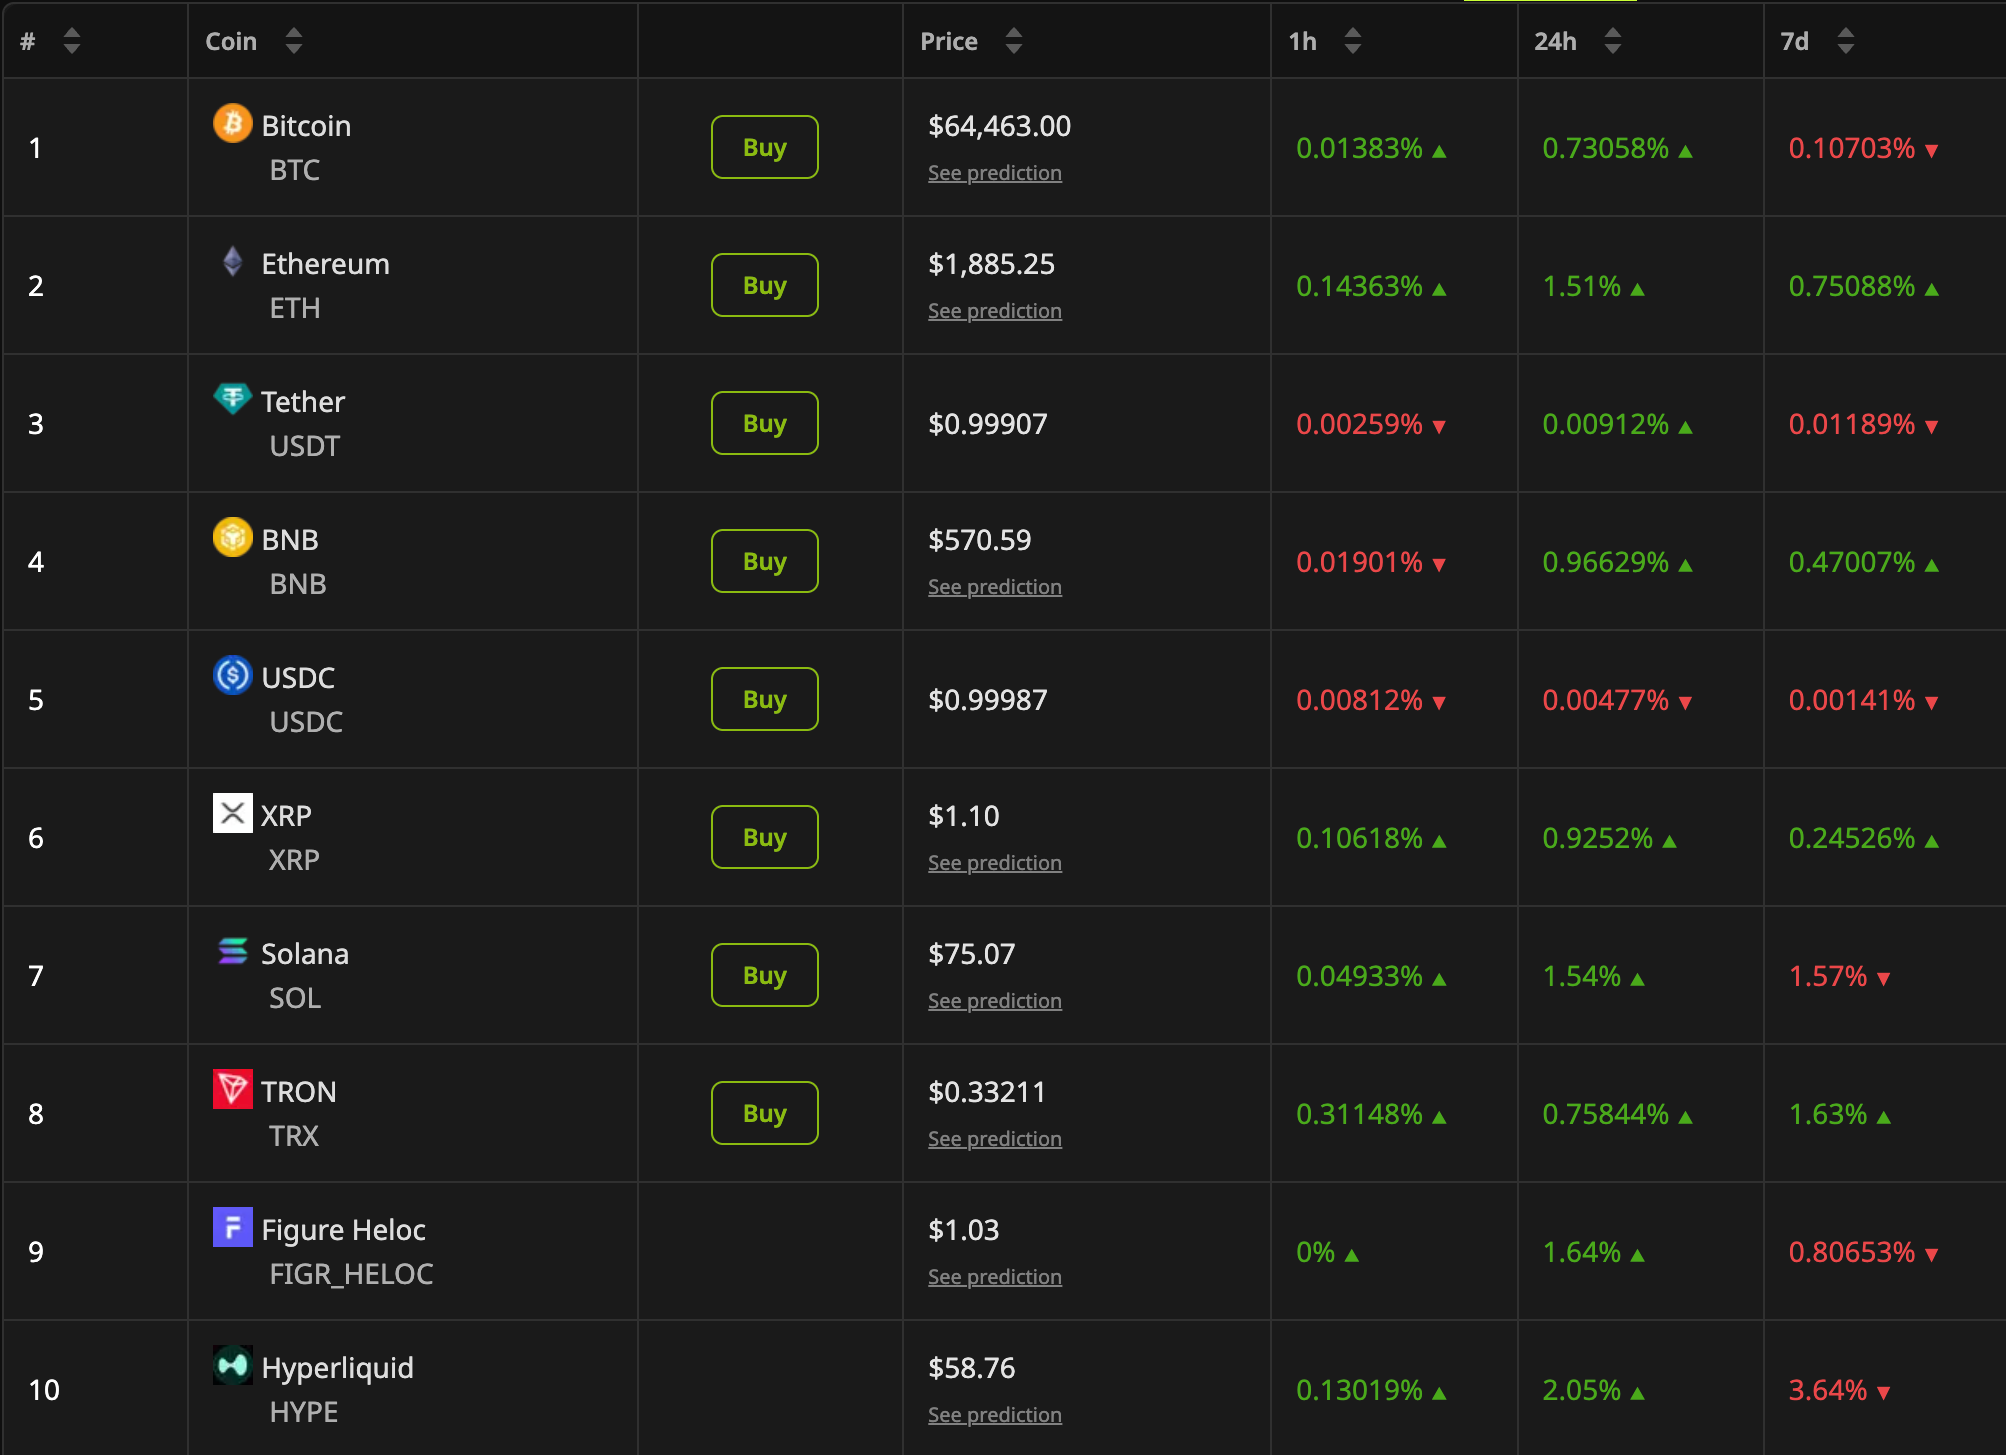
Bitcoin (BTC) traded near $64,463 on Sunday, up 0.7% over the past 24 hours, while the 10 largest digital assets posted modest gains. Oil and equity markets, however, closed before the strikes stopped.
US and Iran Pause Strikes
AP reported that the US paused its airstrikes on Friday after nearly two weeks of intensifying attacks. A US Department of Defense source told CNN that operations were on hold.
Iran has also stated that strikes on Gulf states and US interests in the region would be halted. Army spokesman, Amir Akraminia, confirmed it on Sunday.
“Our strategy has essentially been retaliatory, we have also halted our retaliatory operations,” Akraminia said.
The New York Times reported that Trump shelved plans for a broader campaign due to dwindling US air defense supplies. CNN noted that Gen. Dan Caine flagged concerns about munitions stockpiles.
Despite the de-escalation, it remains a pause rather than a formal ceasefire. US Central Command (CENTCOM) confirmed that its naval blockade of Iranian ports remains in place.
Follow us on X to get the latest news as it happens
Why Monday’s Asian Open Matters
Brent crude fell about 4% Friday to roughly $96.7. The benchmark had closed above $100 on Thursday for the first time since May.
Crypto, therefore, absorbed the weekend headlines alone. Total market capitalization reached $2.29 trillion on Sunday, up 0.84% over 24 hours.

Trading resumes on Monday, and the first prints will carry three days of news. Oil sets the direction for risk assets from there.
Higher crude lifts inflation expectations, which, in turn, shape the Federal Reserve’s policy and appetite for risk.
Analysts have warned against reading too much into a short lull. Michael Singh of the Washington Institute for Near East Policy told AP that duration is what matters.
“If it turns into a multiday pause, that’ll be something significant,” he said.
Houthi attacks in the Red Sea remain a second source of pressure on crude. The June ceasefire has not returned, and traffic through the strait remains halted. Monday’s crude open will show whether traders treat the pause as durable or as an operational gap.
Subscribe to our YouTube channel to watch leaders and journalists provide expert insights
The post US and Iran Pause Strikes as Markets Wait for Monday’s Verdict appeared first on BeInCrypto.


KB Kookmin Bank will launch a blockchain-based cross-border payment service for import and export companies in August 2026.
Summary
- KB Kookmin will initially launch Kinexys-based U.S. dollar payments across ten countries during August 2026.
- The service links blockchain settlement with SWIFT while supporting corporate transfers beyond normal banking hours.
- KB becomes South Korea’s first financial institution using Kinexys for corporate import and export payments.
The South Korean lender will use Kinexys by J.P. Morgan to support U.S. dollar payments across 10 countries.
The service will connect Kinexys with existing SWIFT payment rails. It will support near-real-time transfers and foreign exchange settlement throughout the day. Customers will access the service through KB Kookmin Bank’s domestic branches and its Singapore branch.
KB Kookmin becomes first Korean bank to use Kinexys
KB Kookmin Bank announced the service on July 26 after signing an agreement with J.P. Morgan on blockchain remittance services. According to Yonhap News Agency, it will become the first South Korean financial institution to use Kinexys for payment services aimed at import and export companies. The agreement focuses on faster cross-border remittances for businesses managing overseas trade, supplier payments and foreign exchange settlement needs.
The first phase will prioritise U.S. dollar transfers. The supported markets are South Korea, the U.S., Singapore, Saudi Arabia, India, Thailand, Qatar, the United Arab Emirates, Bahrain and South Africa. The bank has not published customer fees, transaction limits or an exact August launch date.
Kinexys adds blockchain settlement to existing bank rails
J.P. Morgan describes Kinexys as a bank-led blockchain platform for payments, asset tokenisation and near-real-time settlement. The network operates around the clock and lets approved institutions move funds without waiting for traditional banking cut-off times. It was previously known as Onyx.
The KB service will not replace SWIFT. Instead, it will link Kinexys with the existing messaging and correspondent banking system. This model allows banks to use blockchain for faster movement and settlement while retaining established compliance checks, account structures and foreign exchange processes.
J.P. Morgan has expanded Kinexys across several markets. In June, the bank added blockchain deposit accounts in Australian dollars, Hong Kong dollars, Japanese yen, Chinese yuan and Singapore dollars. It said the expansion created support for eight currencies and enabled 24/7 payments, programmable treasury operations and onchain foreign exchange.
Other banks have already used the platform for corporate payments. Qatar National Bank adopted Kinexys for U.S. dollar payments in 2025. The service allowed corporate transfers outside normal banking hours and reduced some settlement times to minutes.
KB expands its institutional blockchain activity
The payment launch follows several blockchain projects across KB Financial Group. In June, KB Kookmin Bank completed a $100 million digital bond sale through HSBC’s Orion platform. The two-year U.S. dollar bond settled in three business days, compared with five days under the earlier process.
KB Kookmin also participates in South Korea’s tokenised deposit work. The Ministry of Economy and Finance selected nine banks for a project linking tokenised deposits with government spending systems. The planned test will use programmable conditions and a shared record of public payments.
Meanwhile, KB Kookmin Card has been developing a payment system that links stablecoins with traditional credit. Crypto.news reported that the project uses Avalanche and OpenAsset infrastructure. The design aims to let users pay from stablecoin wallets while keeping standard card settlement for merchants.
Large banks move blockchain into live payment services
KB Financial Group ranked as South Korea’s largest lender by assets in S&P Global Market Intelligence’s 2026 Asia-Pacific bank review. The group placed 28th in the region with about $552.76 billion in assets. That scale gives the bank an established corporate network for introducing the new service.
The launch also adds to wider bank use of tokenised deposits and blockchain settlement. J.P. Morgan, Mastercard, Ripple and Ondo Finance tested a cross-border Treasury redemption in May. Kinexys handled the payment instructions and U.S. dollar settlement while the tokenised asset moved on the XRP Ledger.
J.P. Morgan has also used Kinexys with companies such as Axis Bank, Mitsubishi Corporation and EBANX. In July, EBANX said the platform reduced some internal cross-border transfers from more than 24 hours to minutes by removing local cut-off restrictions.
For KB Kookmin’s corporate clients, the main change will be access to longer operating hours and faster settlement across selected trade corridors. The bank has not said whether it will add more currencies or countries after the first phase. Its August rollout will show how the service works alongside existing SWIFT processes for commercial payments.


Europe’s crypto market has moved beyond the race to secure a Markets in Crypto-Assets licence.
Summary
- MiCA’s transition ended July 1, leaving unlicensed firms to exit, sell, or transfer European clients.
- U.K. crypto firms face FCA authorisation, prudential controls, governance rules, and client-asset safeguards from 2027.
- Banks already hold compliance systems and networks, making partnerships or acquisitions cheaper than greenfield builds.
The next test is whether authorised firms can afford the staff, capital and controls required to keep operating under the European Union’s full rulebook.
The cost pressure may push smaller crypto companies towards mergers, sales or bank partnerships. The same pattern could develop in the U.K., where the Financial Conduct Authority will open its authorisation gateway on September 30, 2026.
MiCA moves Europe from licensing to long-term compliance
The MiCA transition ended across the EU on July 1, 2026. The European Securities and Markets Authority said any company serving EU clients without authorisation must stop covered crypto services. Unlicensed firms must execute wind-down plans and help customers move assets to an authorised provider or self-hosted wallet.
A licence gives a crypto-asset service provider access to MiCA’s passporting system, but it also brings continuing duties. Firms must maintain governance, capital, market conduct, complaint handling, cybersecurity and anti-money laundering systems. These fixed costs weigh more heavily on smaller exchanges, brokers and custodians.
Notably, more than 3,000 crypto firms held registrations under earlier national systems, while only 194 had obtained MiCA approval by May. ESMA’s register later reached about 300 authorised providers after approvals around the July deadline.
U.K. rules could raise the cost of remaining independent
The U.K. has chosen to place crypto inside its existing financial-services framework rather than build a separate MiCA-style regime. The FCA said trading platforms, custodians, intermediaries, stablecoin issuers and firms arranging staking will need authorisation. Applications will run from September 30, 2026, to February 28, 2027, before the regime starts on October 25, 2027.
Steven Lightstone, a Morgan Lewis partner quoted by CoinDesk, said the FCA keeps “very high standards” where consumers are involved. He said a crypto company would be “treated like any normal traditional financial institution.” Banks already operate many required governance, reporting and financial-crime systems.
The FCA’s final crypto rules also extend client-asset protections to crypto custody. Its CASS 17 framework covers safeguarding duties for authorised custodians. Building key management, reconciliations, segregation and recovery procedures from scratch may cost more than joining a regulated group.
Banks and larger firms gain a route into crypto
Banks can use acquisitions to gain technology, licences and specialist teams without building every service internally. Crypto firms can gain capital, compliance staff, distribution and customer relationships. Partnerships may offer a middle route when neither side wants a full takeover.
Recent European activity shows both models. France’s CACEIS was nearing a deal for MiCA-licensed crypto platform Meria. Portugal’s Bison Bank became a MiCA-authorised provider after integrating its digital-asset subsidiary. Spain’sCecabank also launched regulated crypto custody for financial institutions.
A group of European banks selected Fireblocks to support a planned MiCA-compliant euro stablecoin, while Qivalis expanded its consortium to 37 financial institutions across 15 countries.
Simon Schneider, chief executive of Sygnum Europe, told CoinDesk that fewer than 20% of European banks offer crypto services. Bank executives expect regulatory certainty to move more client assets towards licensed institutions. Banks already have customer networks and compliance frameworks, creating room for partnerships in custody, brokerage, staking and tokenisation.
Scale may become Europe’s next competitive advantage
A BCG and FT Partners report found that fintech M&A value rose from $105 billion in 2023 to $251 billion in 2025. Scaled fintech companies completed 659 acquisitions in 2025, compared with 589 by banks and other established institutions. Digital assets and compliance ranked among the areas attracting buyers.
MiCA may add another reason to pursue deals. A buyer can spread compliance costs across a larger customer base, while an acquired company can avoid maintaining duplicate licences and systems. Regulators will still review ownership, governance, outsourcing and customer protection after any transaction.
Consolidation does not mean banks will replace all crypto-native companies. Specialist providers still supply technology and market knowledge that many banks lack. Self-custody will also remain outside regulated custodians’ business models. The likely change is fewer standalone providers and more groups combining banking distribution with crypto infrastructure.
The final shape will depend on authorisation decisions, operating costs and customer migration. MiCA has separated authorised providers from firms that must leave the EU market. The FCA’s 2027 regime may apply similar pressure in Britain. Smaller companies may need to raise capital, share infrastructure, sell or leave regulated markets. This could make scale more valuable than speed for firms seeking long-term regulated European access.
Unlike the previous major bear market in which numerous cryptocurrency exchanges reduced their staff number, the current cycle turned out to be more violent and requires a different sort of reaction.
The latest to close shop, with an announcement earlier today, was BitMart.
BitMart to Shut Down
The exchange saw the light of day during the 2017 big bull market and expanded its services to over 1,700 cryptocurrencies as of today. However, it followed the recent negative trend, stating that it has begun to “orderly” wind down its trading operations.
New registrations have already been halted, as well as deposits and opening new trading orders. A month later, the exchange will stop all trading services. The official shutdown will be at the end of January at 15:59 UTC, when the platform operations will cease. In contrast, withdrawals will remain available.
The company urged all users to close their trading positions, complete KYC if needed, and transfer out the available funds as soon as possible.
Important Notice
After a careful evaluation of the Company’s operating conditions, market environment, and future strategic direction, BitMart has made the difficult decision to commence an orderly wind-down of its trading platform operations. We deeply regret having to make… pic.twitter.com/KX3zczIrAh
— BitMart (@BitMartExchange) July 26, 2026
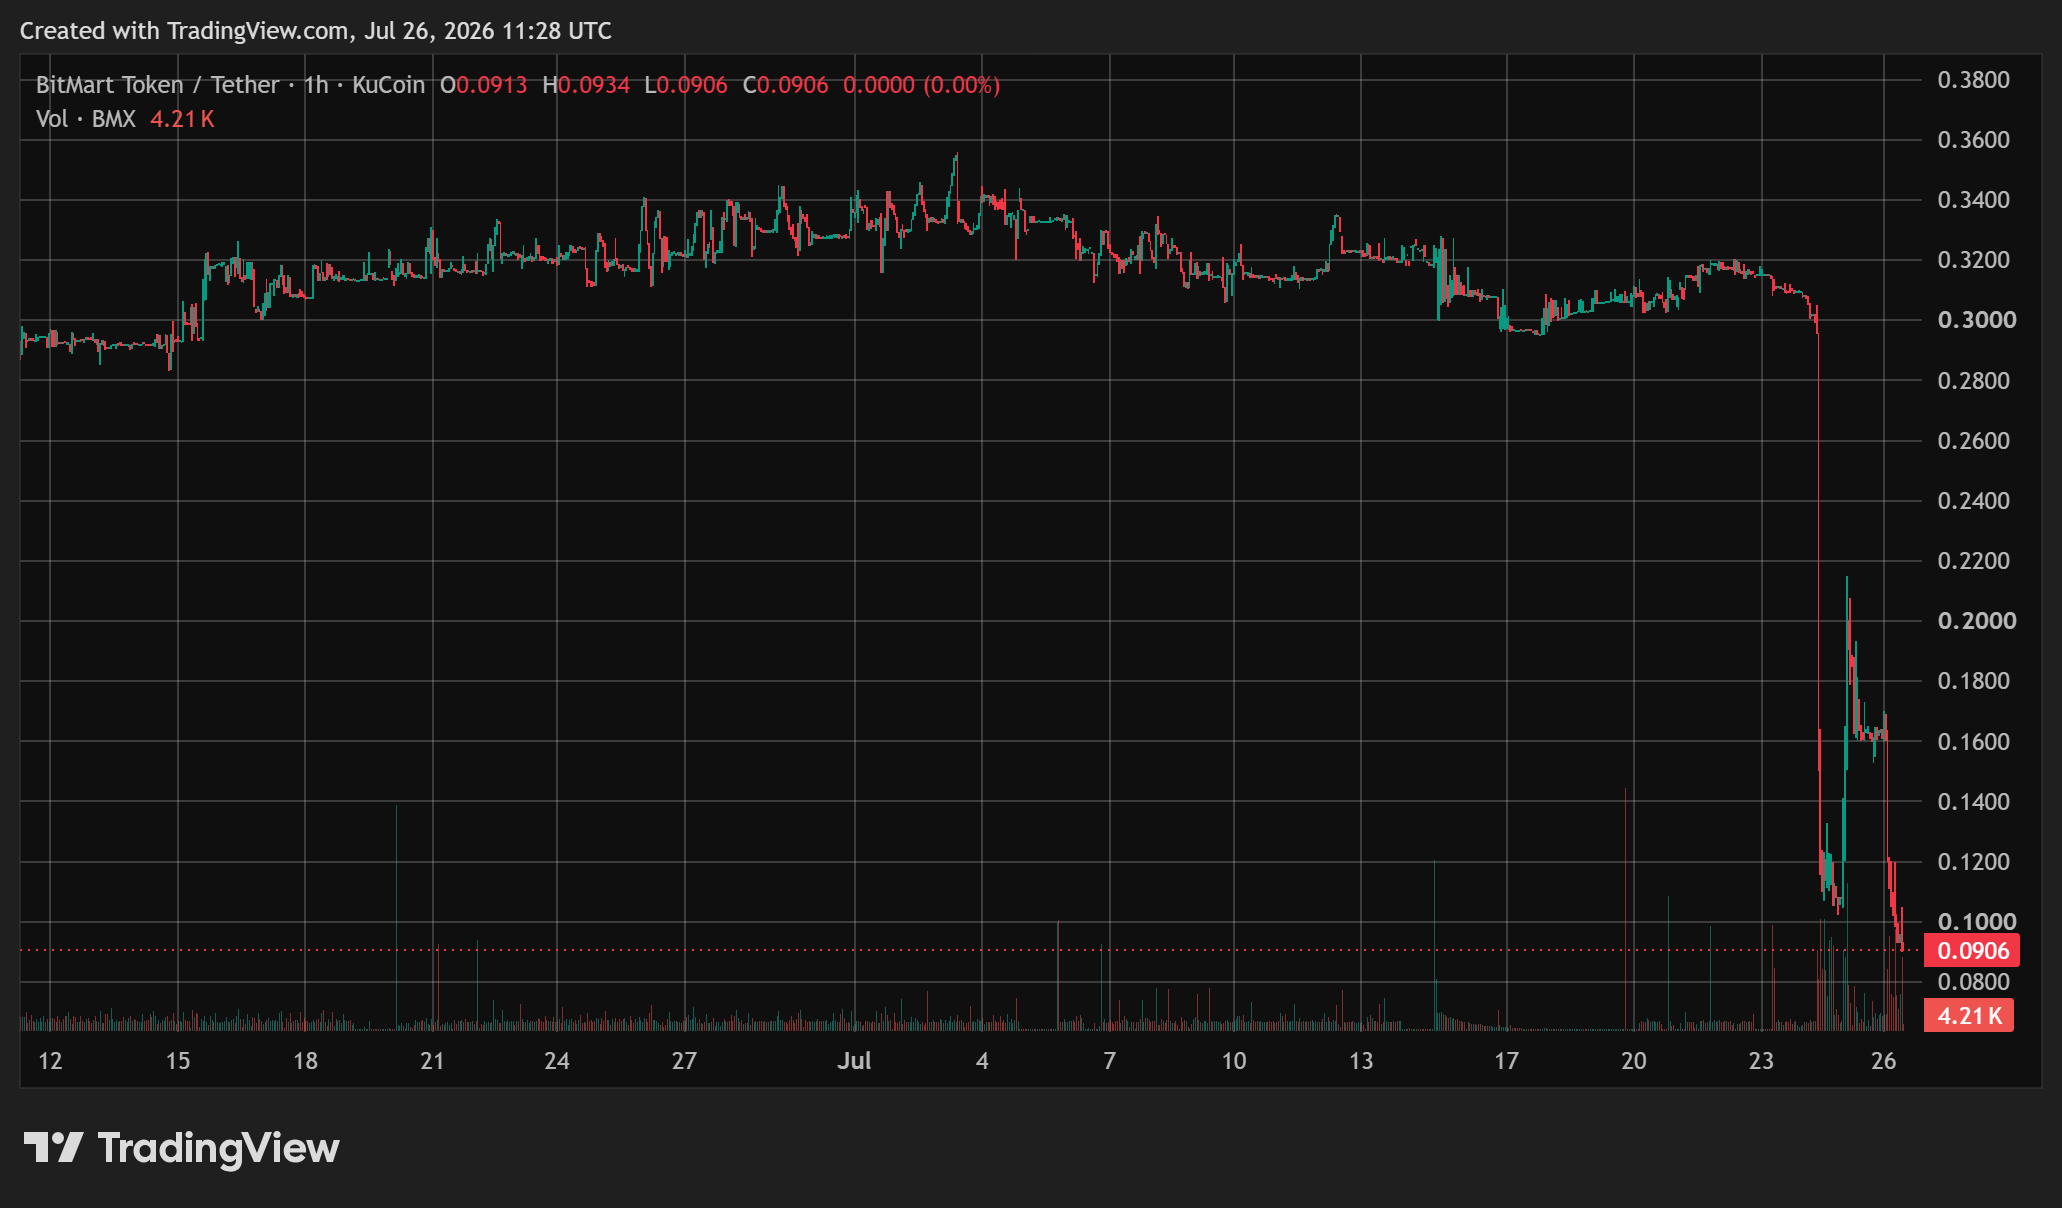
The exchange’s native token reacted with an immediate price drop, plunging by over 60% on a 24-hour scale. BMX traded at $0.32 before the news went live, and dumped to $0.09 as of press time. It also remains 90% away from its all-time high at $0.619 (CoinGecko data) recorded in early 2024.
BitMEX and Who Else?
Just a few days ago, the Arthur Hayes-co-founded cryptocurrency derivatives platform BitMEX said it will shut down on September 23. The creator of the 100x perpetual swap was active for nearly a decade, but it has fallen out of traders’ grace in the past couple of years.
The crypto shutdowns continued with popular DEX aggregator Odos. The project announced on July 24 that it will halt all of its services at the end of July.
One of its competitors, Dango, made a similar statement on the same day. The self-proclaimed ‘Endgame Exchange’ informed that the team has made the difficult decision to wind down its services, outlining “various reasons” without actually specifying them. It will stop trading on July 29, while the Dango L1 blockchain will halt on August 13.
The post Another Major Crypto Exchange Is Shutting Down After BitMEX appeared first on CryptoPotato.


Strategy says its current capital structure could withstand a prolonged Bitcoin decline while continuing to fund interest payments and preferred stock dividends.
Summary
- Strategy says its current structure can fund obligations through 5.8 years of steady Bitcoin declines.
- Company data shows a $3.225 billion cash reserve supporting preferred dividends and debt interest payments.
- The stress test uses Strategy’s internal BTC Rating rather than an independent credit agency assessment.
In a July 24 post on X, the company said Bitcoin could fall 11.4% each year for 5.8 consecutive years without pushing its company-defined BTC Rating below 1.0x.
The claim arrived as Bitcoin traded near $64,463 and Strategy shares closed at $91.67 on July 24. Bitcoin remained below Strategy’s average purchase price, while MSTR had fallen sharply from its previous peak. The exercise describes a steady multi-year decline, not a sudden crash or a guarantee that Strategy could meet every obligation under all market conditions.
What Strategy’s Bitcoin stress test measures
Strategy’s model uses a measure called BTC Floor ARR. The company defines it as the lowest constant annual Bitcoin return that would preserve 1.0x coverage of net debt and preferred stock over the weighted duration of its credit structure. The calculation includes interest and preferred dividend payments. Its current credit metrics dashboard places that floor at negative 11.4% over 5.8 years.
Strategy wrote: “At today’s capital structure, BTC could fall 11.4% annually for 5.8 years” while the company continued funding interest and preferred dividends. A 1.0x BTC Rating means the measured Bitcoin reserve still matches the claims included in Strategy’s formula. The company uses the calculation to describe balance-sheet coverage, not Bitcoin’s likely future price.
The calculation also differs from a traditional credit rating. Strategy developed the metric itself and publishes it for illustrative purposes. The company does not present it as proof that Bitcoin will decline at a steady rate or that its financing structure can withstand every type of market disruption.
Cash reserve and Bitcoin sales support the model
Strategy held 843,775 BTC as of July 19. It acquired the coins for about $63.69 billion at an average price of $75,476. The company also reported a $3.225 billion U.S. dollar reserve after raising $263.5 million through common-stock sales. As crypto.news reported, Strategy did not buy or sell Bitcoin during that week.
The reserve supports preferred dividends and interest on outstanding debt. Strategy’s current figures place annual interest and dividend obligations near $1.7 billion. The cash balance therefore provides less than two years of direct coverage before the company needs new financing, Bitcoin sales or other capital actions.
Strategy created a broader Digital Credit Capital Framework in June. The plan authorises up to $1.25 billion in Bitcoin sales to build or refill the cash reserve. It also permits selected Bitcoin sales to fund dividends, interest and approved security repurchases. Strategy raised the STRC preferred dividend rate to 12% and approved separate $1 billion buyback programmes for common and preferred securities.
Strategy sold 3,588 BTC for about $216 million between June 29 and July 5. It used the proceeds for preferred distributions and reserve replenishment. The sales reduced its holdings from 847,363 BTC to 843,775 BTC.
Strategy warns its BTC Rating is not a credit rating
Strategy’s metric definitions state that BTC Rating is an internal, illustrative measure. No independent credit rating agency issues it. It does not measure liquidity, solvency or reported financial performance. The company also says the calculation does not account for possible cross-defaults under its debt agreements.
The model uses the notional value of preferred stock, although some securities may carry liquidation preferences above that amount. Its dividend coverage measure also assumes Strategy can refinance existing debt on broadly similar terms without repaying principal. Those assumptions may not hold during a severe funding or market shock.
Strategy’s board must also approve preferred dividends. The company can adjust STRC’s variable rate each month, and it does not guarantee cash payments. Strategy may issue shares, sell Bitcoin, lower distributions where permitted or restructure obligations if its funding position weakens. A 1.0x result therefore does not remove refinancing, dilution, execution or market risks.
Bitcoin and MSTR remain under market pressure
Bitcoin traded around $64,463 on July 26, roughly 49% below its October 2025 peak near $126,000. MSTR closed at $91.67 on July 24. Investors continued to track Bitcoin’s price alongside Strategy’s cash requirements, preferred dividend costs and market value relative to its Bitcoin holdings.
The company’s financing model worked best when MSTR traded above the value of its Bitcoin reserve. That premium allowed Strategy to sell shares and increase Bitcoin per share. A lower market premium made new issuance less attractive and pushed the company to build cash rather than buy more Bitcoin.
The company has also shifted from a mainly accumulation-focused model towards active capital management. Its current framework includes share sales, cash reserves, possible Bitcoin sales and repurchase programmes. Crypto.news analysis noted that Strategy’s market premium, or mNAV, remains central because it determines whether common-stock issuance can increase Bitcoin per share.
The stress test presents Strategy’s view of how long its current assets could support its financing structure under a steady decline. It does not predict Bitcoin’s direction or cover every form of market stress. Future results will depend on Bitcoin prices, access to capital, dividend decisions, debt terms and the company’s use of authorised Bitcoin sales.

Ryan Reynolds crashes Comic-Con as Deadpool but fans missed the obvious joke

(PHOTO) Jessica Alba Turns Heads in Cheeky Bouguessa Micro Minidress During Stylish New York City Outing

Restore Britain stuffed full of Hitler loving freaks, report finds

Renter of Home in Anne Heche Crash Denies Settlement With Son

No Jackpot Winner as $257 Million Prize Rolls Over to $269 Million Monday Draw

Weekend Open Thread: Staud – Corporette.com

Bitcoin Treasuries are COLLAPSING and That’s Bullish! (Here’s Why)

Worst Financial Advisor Ever – Impractical Jokers #shorts #prank #funny

LEC 1 || VBU SEM 5 Financial Management Important Questions 2026 || 100% Most Expected Questions
-

 Fashion2 days ago
Weekend Open Thread: Brooks Brothers
-

 News Videos7 days ago
Big Money Is Entering XRP
-

 Crypto World5 days ago
Grayscale Files For Worldcoin ETF, WLD Registers Sharp Rise
-
 Tech6 days ago
Sail Virtually Aboard The “Itanic” With IA-64 Emulator
-
 Tech5 days ago
Turtle Beach Command Series KB7 review: a nifty screen-equipped gaming keyboard
-

 NewsBeat6 days ago
Unregistered fitter used Gas Safe logo on business flyers
-
 Business4 days ago
New Jersey voter registration controversy explained: How 6,600 noncitizens got on the rolls, and what happens next
-
 Entertainment5 days ago
Johnny Depp’s R-Rated Gothic Cult Classic Gets New Release Ahead of Sydney Sweeney Remake
-

 Crypto World4 days ago
Ethics, other provisions in crypto Clarity Act to be further discussed
-

 Tech6 days ago
Watch Flock Safety CEO Garrett Langley discuss the future of surveillance at TechCrunch Disrupt 2026
-
 NewsBeat5 days ago
Shanghai science forum photos show China’s AI and robotics advances in rivalry with US
-
 Crypto World6 days ago
Circle’s President Sold Over 360,000 Shares, The Filings Explain Why
-

 Tech6 days ago
Subway Sandwich Computers Get a Second Life as Gaming Machines
-

 Sports2 days ago
2026 3M Open leaderboard: Scottie Scheffler finds putter in Round 1, sits three back
-

 News Videos3 days ago
The Peugeot Family: How 200 Years of an “Old Money” Dynasty Died in A Boardroom
-

 Fashion2 days ago
16 Dresses for the High Summer Event
-

 Tech7 days ago
How To Use Claude’s Reflect Dashboard And Learn When It’s Time To Touch Grass
-

 Tech6 days ago
The 35 Best Board Games for Family Game Night
-

 Entertainment6 days ago
Stephen Colbert Returns to Social Media After Late Show End
-

 Crypto World6 days ago
Andrew Cuomo joins OKX board as crypto exchange expands in U.S.
You must be logged in to post a comment Login