

Crypto World
Ethereum price holds $1,600 as whales buy the dip

Ethereum traded near $1,655 on June 25, according to crypto.news price data, after falling below $1,600 during the latest market selloff.
Summary
- Ethereum’s bounce remains fragile as ETF outflows and weak RSI keep buyers cautious near resistance.
- New whale withdrawals show dip buying, but dormant sellers and liquidations add opposing pressure.
- ETH needs a clean break above $1,800 before technical momentum can turn stronger again.
ETH was down about 0.93% over 24 hours and 4.63% over seven days, while trading volume stood near $15.42 billion.
The token moved between $1,557.87 and $1,677.86 during the session. Market value stood near $199.55 billion, keeping ETH in second place by market cap. The bounce has eased pressure, but ETH still trades below the recent recovery zone near $1,800.
Ethereum’s daily chart still shows a wider downtrend from the $2,300 to $2,400 zone into the current $1,600 to $1,700 range. Bulls need a clean move above $1,800 before the structure improves.
Ethereum recently weakened near $1,670 as ETF outflows, weak RSI, and falling open interest kept traders cautious. That report placed $1,750 and $1,800 as near-term resistance zones, while $1,580 stayed in focus if sellers returned.
Ethereum ETF outflows weigh on demand
Spot Ethereum ETFs remain a pressure point for ETH price. SoSoValue data showed the products recorded $30.24 million in net outflows on June 24, marking a fifth straight day of withdrawals. Fidelity’s FETH led the day’s outflows with $15.6897 million leaving the fund.
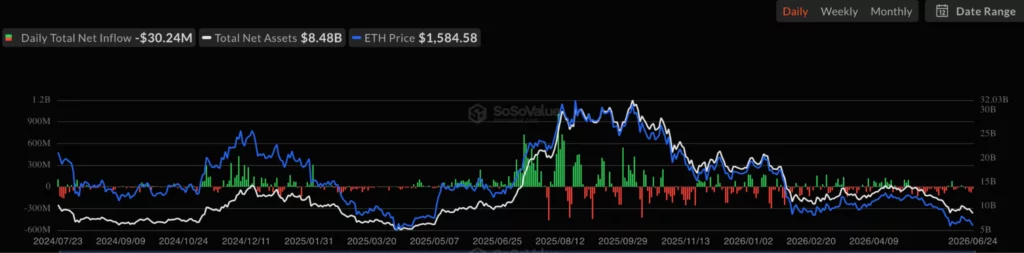
The latest ETF data followed a larger outflow session one day earlier. As crypto.news reported, U.S. spot ETH ETFs posted $82.351 million in net outflows on June 23. That flow pressure came as ETH failed to hold short-term resistance.
ETF flows show whether regulated demand is adding support or cutting exposure. When funds keep losing assets during a decline, spot buyers need to absorb more selling before recovery can form.
The flow data does not mean all institutional demand has disappeared. It shows that demand remains uneven. A return to steady ETF inflows would help sentiment, but ETH has not yet seen that confirmation.
Ethereum whale moves send mixed signals
Large wallet activity also shows a split market. Lookonchain said a newly created wallet withdrew 17,675 ETH, worth about $28.58 million, from Binance. The tracker described the move as a whale “buying the dip.”
At the same time, Onchain Lens said a dormant whale known as 0x096 sold 27,585 ETH for $44.84 million in USDS at an average price near $1,625. The wallet had been inactive for seven years and still locked in an estimated $39.1 million profit.
Leverage also added stress. Onchain Lens said Machi was fully liquidated on a 25x ETH long position, losing $1.9 million, before opening another 25x long. His total losses had passed $35.4 million.
Such activity can make ETH moves sharper near key support. Whale buying may help the market, but dormant wallet sales and forced liquidations can reduce confidence. This leaves ETH caught between accumulation, profit-taking, and high-risk leverage.
Indicators keep $1,800 in focus
Technical indicators still show a weak recovery. RSI stood near 38.34, slightly below its moving average at 38.79. That reading sits below the neutral 50 level, so buyers have not regained clear control after the latest bounce.
The Aroon Oscillator stood at -64.29, pointing to continued bearish trend pressure. A negative reading means recent lows remain more dominant than recent highs. That supports the view that ETH is stabilizing, not reversing yet.
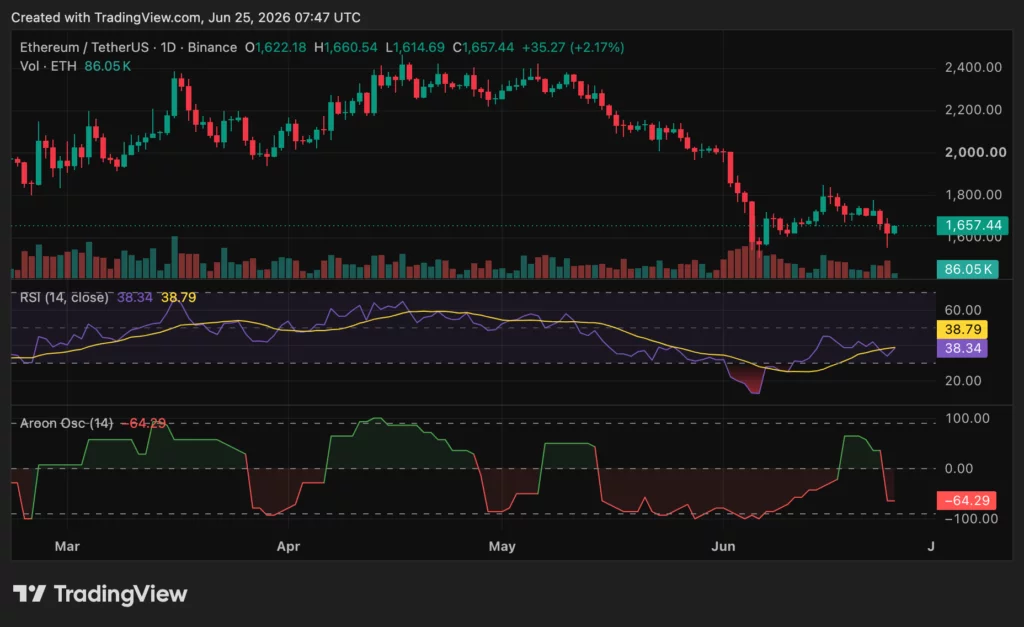
The MACD picture looks slightly better, based on the provided chart context. The histogram has turned mildly positive, while the MACD line has moved above the signal line. However, both lines remain below zero, so the wider trend still needs confirmation.
CryptoQuant analyst CryptoOnchain described Ethereum as being in a defensive position near $1,600. The model reduced market exposure to 15%, but said the probability of a bullish shift had climbed to 45%. The analyst said stablecoin reserves and netflows on Binance had moved into neutral territory.
Analysts remain divided on the next move. CrediBULL Crypto said ETH/BTC is “still chilling at our HTF buy zone” and is waiting for a lower-timeframe base. Crypto Tony said ETH/USD may be forming a triangle, which could point to several weeks of consolidation.
For now, ETH needs stronger follow-through above $1,700 and then $1,800. A break above that zone, with RSI above 50 and an improving Aroon reading, would support a stronger recovery. Failure to reclaim those levels could keep ETH exposed to another test near $1,580.
Disclosure: This article does not represent investment advice. The content and materials featured on this page are for educational purposes only.

Crypto World
CoinEx denies claims it served as $3.84 billion gateway to sanctioned Iranian crypto firms


Blockchain intelligence firm TRM Labs said CoinEx served as a gateway for the crypto sector in Iran, having traced more than $3.84 billion in flows between the exchange and sanctioned Iranian entities in the last seven years.
TRM Labs said CoinEx became the single biggest trading partner of Iran’s largest crypto exchange Nobitex, which accounted for around $2.7 billion of the flows, according to a report published Wednesday.
CoinEx had direct transaction exposure with more than 60 Iranian crypto platforms, according to TRM Labs’ analysis, which argued that this patterns suggested a coordinated relationship rather than organic market activity.
TRM Labs identified CoinEx exposure to several terrorist-linked entities, such as $6 million in transactions involving wallets associated with the Islamic Revolutionary Guard Corps and $374,000 of exposure associated with Palestinian Islamic Jihad.
The U.S. Treasury sanctioned an array of Iranian crypto exchanges as part of its campaign against the country’s government at the start of this month, including Nobitex, Wallex, Bitpin and Ramzinex, all of which are cited in TRM Labs’ report.

TLDR
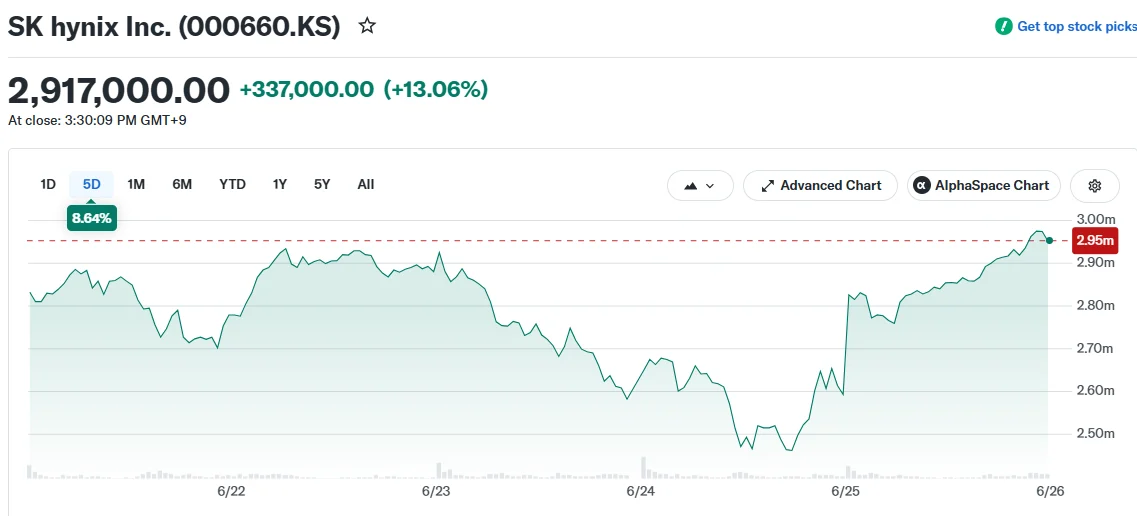
- SK Hynix shares soared 13% during Thursday’s trading session in South Korea
- The memory chipmaker will debut ADRs on Nasdaq July 10, aiming for approximately $30 billion in value
- Competitor Micron delivered $41.5 billion in quarterly revenue, surging 346% annually and crushing analyst forecasts
- Micron’s leadership anticipates constrained memory markets extending past 2027
- SK Hynix shares have skyrocketed more than 300% throughout 2026, surpassing Samsung to claim the top spot among South Korean companies by market cap
Shares of SK Hynix climbed as high as 15% to reach a new record of 2,987,000 won during Thursday’s session, ultimately settling with gains near 13% by the close in South Korea.
The dramatic rally stemmed from two powerful catalysts converging simultaneously — the announcement of a significant U.S. exchange debut and exceptional quarterly results from competitor Micron.
SK Hynix revealed Wednesday evening that it intends to debut American Depositary Receipts on the Nasdaq Global Select Exchange come July 10. The offering is expected to reach approximately $29–$30 billion.
Since the disclosure arrived after Korean markets had shut down Wednesday, Thursday represented the initial opportunity for shareholders to respond. Their response was emphatic.
The broader KOSPI Index also posted impressive gains, advancing more than 6%. This extended a powerful recovery from a 10% decline witnessed earlier during the week. The benchmark has now surged 112% throughout 2026.
Micron’s Quarterly Performance Provided Additional Momentum
Micron unveiled quarterly revenue totaling $41.5 billion, substantially exceeding Wall Street’s projection of $35.9 billion. This represents a remarkable 346% increase compared to the previous year.
Future outlook proved even more impressive. Micron projected revenue approaching $50 billion for its upcoming fiscal fourth quarter, once again surpassing expectations considerably.
Chief Executive Sanjay Mehrotra indicated he anticipates constrained market dynamics continuing beyond 2027, fueled by artificial intelligence demand spanning all product categories and fundamental supply limitations.
This forward-looking commentary carries significant implications for SK Hynix. Both organizations compete head-to-head in DRAM and high-bandwidth memory markets, indicating that favorable pricing environments for Micron typically signal similar conditions for SK Hynix.
SK Hynix’s Standing in Memory Chip Manufacturing
SK Hynix commands the high-bandwidth memory sector, which has emerged as among the most sought-after components powering AI infrastructure expansion. This strategic positioning has rendered the stock especially responsive to artificial intelligence developments.
The accelerated buildout of data centers by major technology corporations has constricted worldwide memory inventories throughout the past year. This dynamic has elevated prices for both conventional DRAM and HBM products.
SK Hynix, Micron, and Samsung have all benefited substantially from this demand wave. However, SK Hynix has outperformed both rivals.
The stock has climbed over 300% during 2026 alone, positioning it among the top-performing equities worldwide this year.
It recently eclipsed Samsung to capture the title of South Korea’s most valuable corporation — an achievement that would have appeared improbable until recently.
The forthcoming Nasdaq ADR listing scheduled for July 10 will provide American investors direct access to the shares for the first time via an exchange-traded instrument.
Micron’s quarterly performance represented the latest confirmation that AI-fueled memory demand remains robust entering the latter half of 2026.

The US dollar continues to hold firm near multi-year highs as sentiment across equity markets deteriorates and investors increasingly expect the Federal Reserve to maintain a restrictive monetary policy stance for longer. The US economy remains resilient, while inflation risks continue to run elevated, prompting market participants to reassess the timing of potential interest rate cuts. Against this backdrop, demand for the dollar is being supported both by attractive US asset yields and its status as a safe-haven currency.
An additional source of support for the greenback has come from the decline in stock markets, which has increased investor caution and encouraged capital flows into the dollar. Despite some easing in geopolitical tensions surrounding Iran and a correction in oil prices, expectations of a more hawkish Fed remain the key market driver. Interest-rate futures continue to reflect a high probability that restrictive policy will remain in place for an extended period, supporting the dollar against most major currencies.
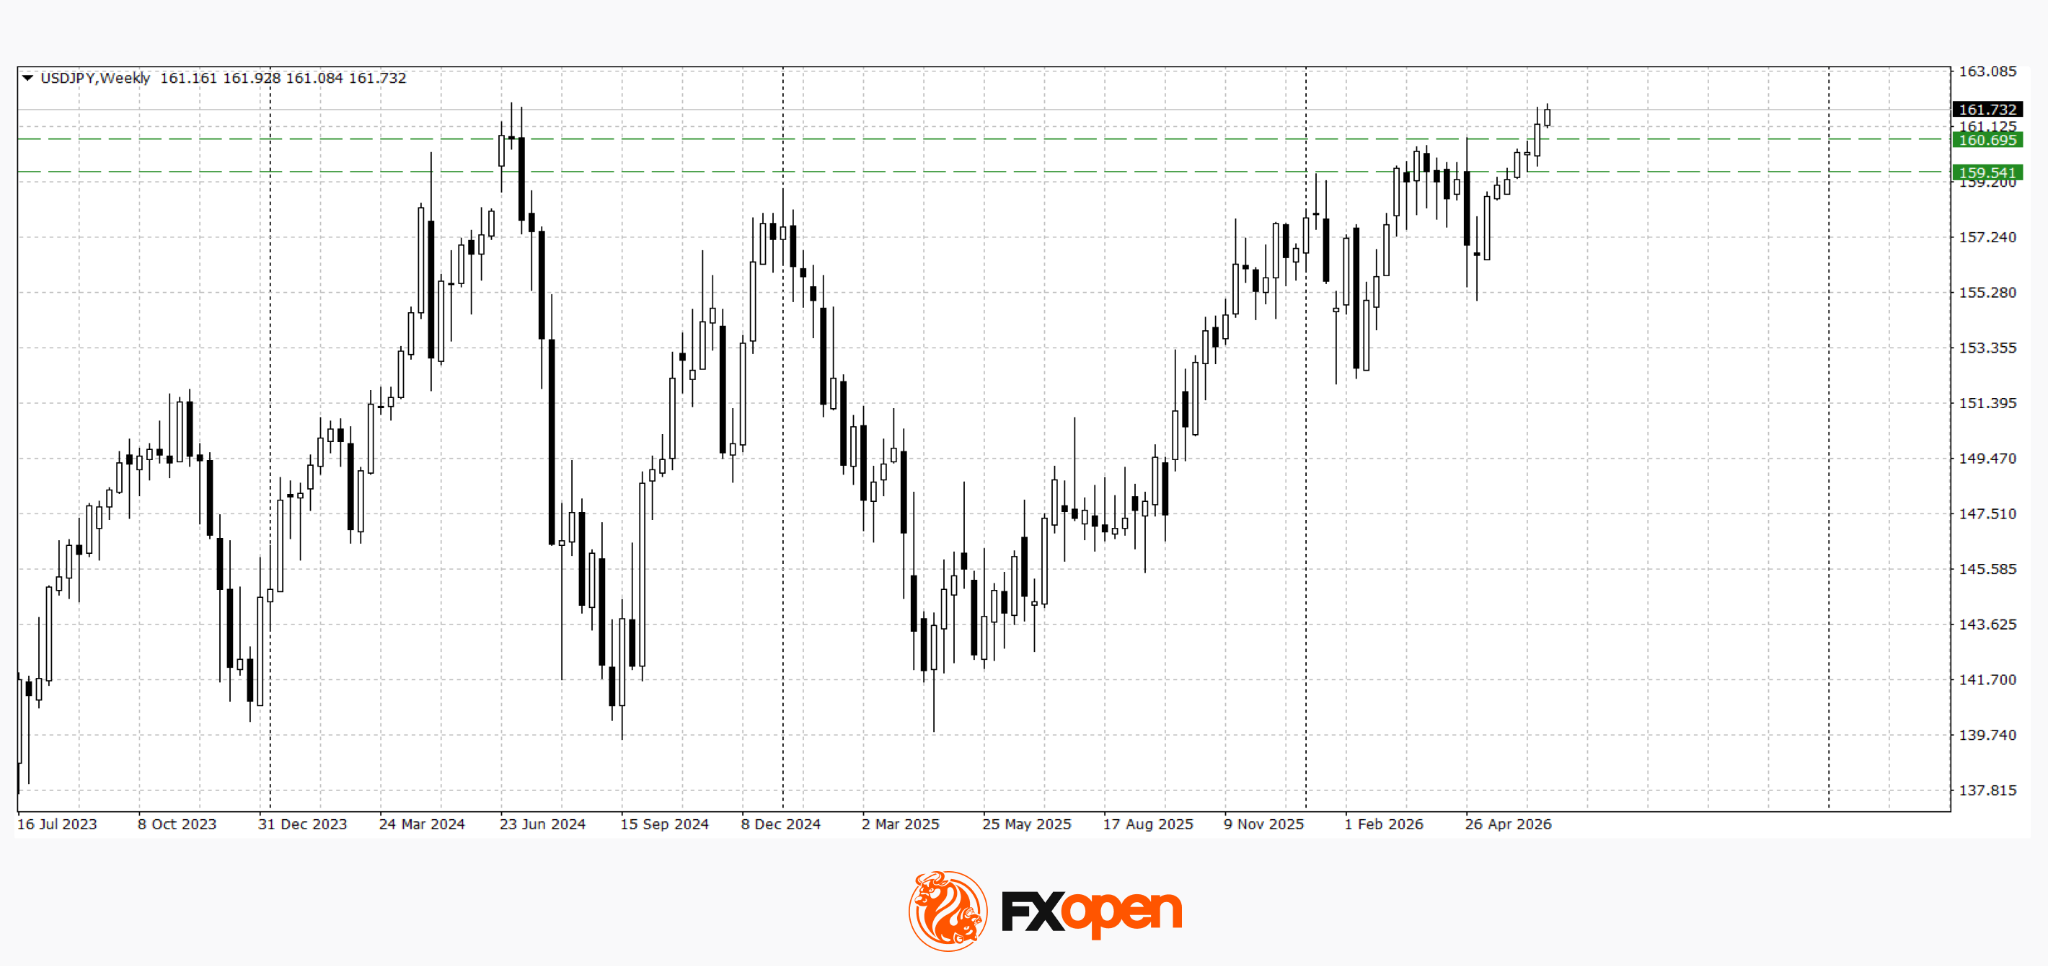
USD/JPY
USD/JPY continues to advance and is trading close to multi-year highs near 162.00. Pressure on the yen persists due to the wide interest-rate differential between the United States and Japan, as well as market doubts about the willingness of Japanese authorities to carry out further currency interventions. Technical analysis suggests the pair could extend its advance towards the psychological 163.00–164.00 area.
At the same time, a spike in volatility and a sharp pullback towards 160.00–161.00 cannot be ruled out, as the pair is already trading within a zone of long-term resistance on higher timeframes.
Key events for USD/JPY:
- Today at 15:30 (GMT+3): US Core Personal Consumption Expenditures (PCE) Price Index;
- Today at 15:30 (GMT+3): US GDP data;
- Today at 15:30 (GMT+3): Continuing Jobless Claims in the United States.

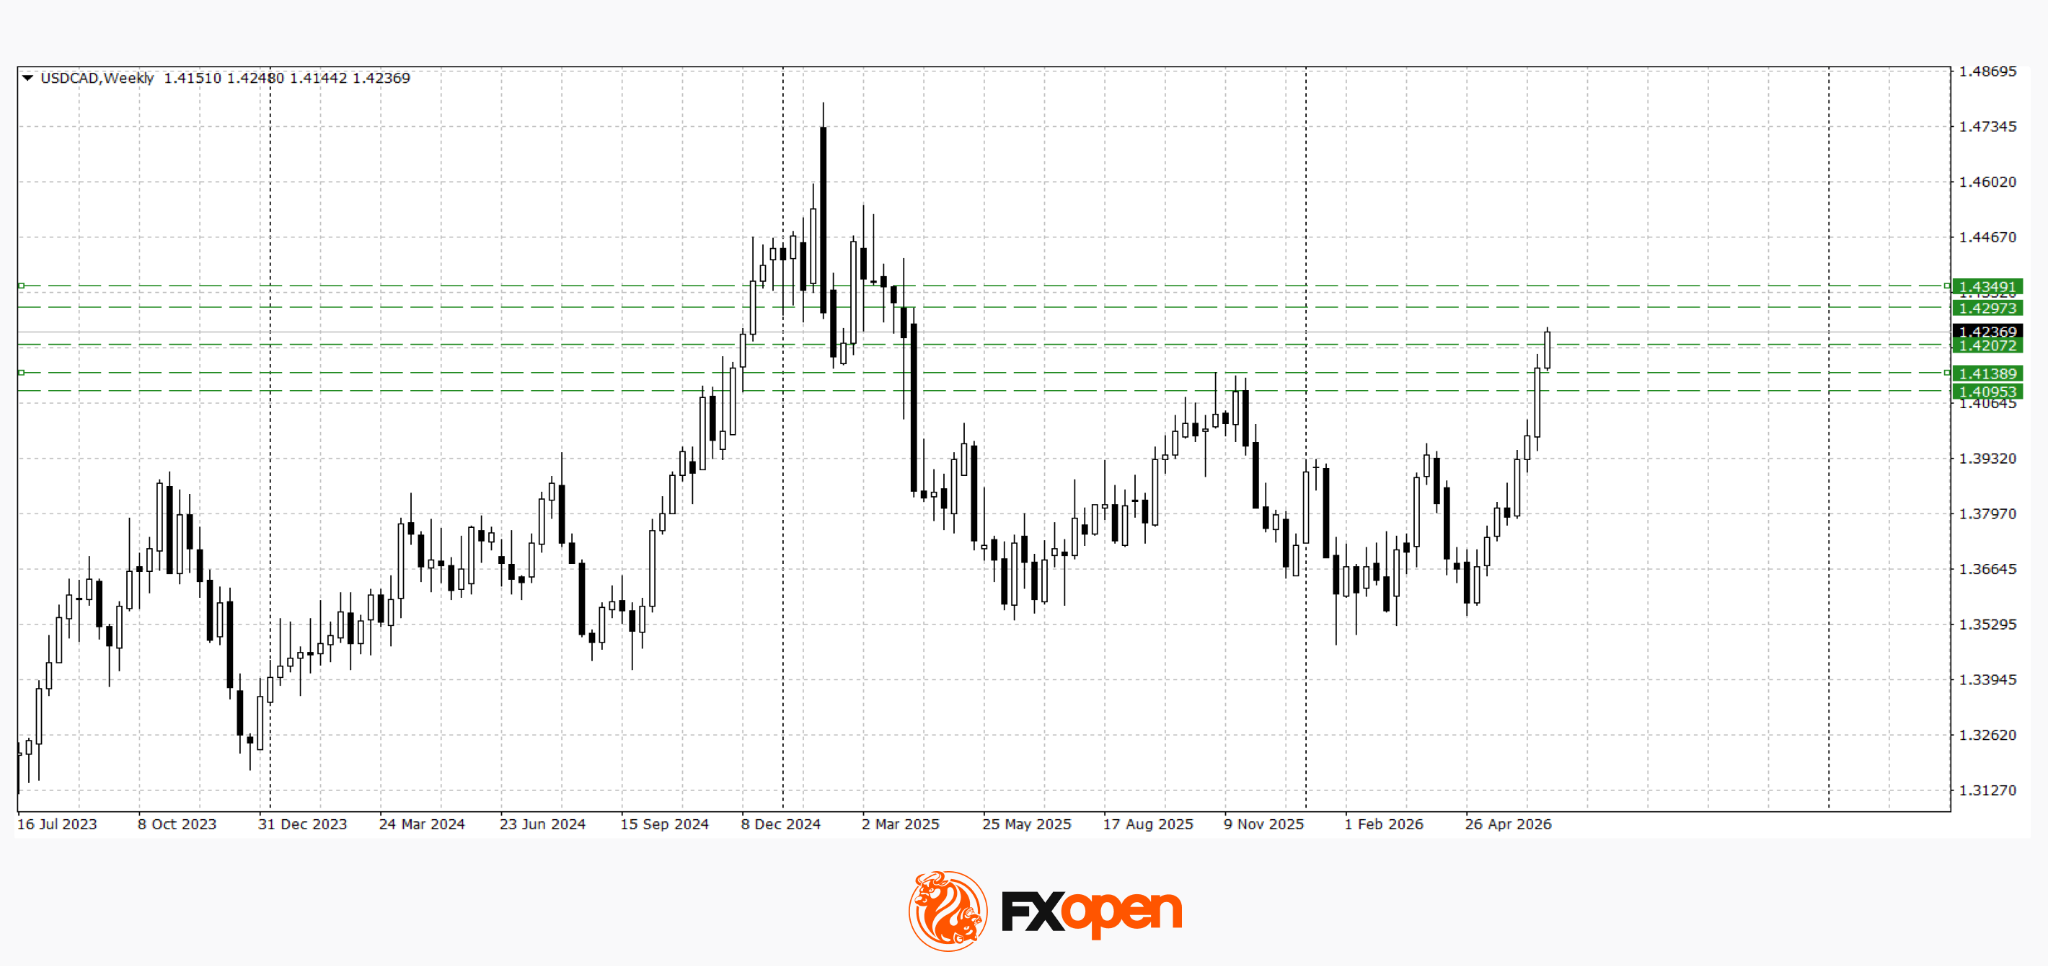
USD/CAD
USD/CAD also remains in an uptrend and is approaching long-term resistance levels in the 1.4300–1.4350 area. The pair is being supported by US dollar strength and the relative weakness of the Canadian dollar amid lower oil prices and expectations of further divergence between Bank of Canada and Federal Reserve policy.
A sustained move above 1.4300 could open the way for further gains towards 1.4350. However, a rejection from these levels and the formation of bearish reversal patterns could trigger a corrective decline towards the 1.4140–1.4200 region.
Key events for USD/CAD:
- Today at 15:30 (GMT+3): Average Weekly Earnings in Canada;
- Today at 15:45 (GMT+3): speech by Federal Open Market Committee (FOMC) member Michelle Bowman;
- Today at 17:00 (GMT+3): Atlanta Fed GDPNow estimate.
The US dollar remains the primary beneficiary of the current market environment. Equity market weakness, expectations of a prolonged period of restrictive Fed policy and the relative weakness of competing currencies continue to support the greenback.
At the same time, both USD/JPY and USD/CAD are approaching significant long-term resistance levels. As a result, further price action is likely to depend on whether upcoming macroeconomic data can confirm the resilience of the US economy and whether the Federal Reserve maintains its hawkish tone in forthcoming commentary.
Trade over 50 forex markets 24 hours a day with FXOpen. Take advantage of low commissions, deep liquidity, and spreads from 0.0 pips (additional fees may apply). Open your FXOpen account now or learn more about trading forex with FXOpen.
This article represents the opinion of the Companies operating under the FXOpen brand only. It is not to be construed as an offer, solicitation, or recommendation with respect to products and services provided by the Companies operating under the FXOpen brand, nor is it to be considered financial advice.
Kanga, a Polish-founded crypto exchange, has secured Markets in Crypto-Assets Regulation (MiCA) authorization in Latvia, positioning the firm to expand its crypto services across the European Union. The development reflects a broader pattern of firms using MiCA’s licensing and cross-border notification mechanics to establish an EU-wide operating footprint ahead of the bloc’s regulatory transition.
According to a statement shared with Cointelegraph, SIA AlphaRoute, which operates under the Kanga Exchange EU brand, received a Class 3 MiCA license from the Bank of Latvia after its Supervisory Committee approved the authorization. The license—granted on June 18—covers activities including crypto custody, trading, and transfers across the EU.
Key takeaways
- Kanga’s EU expansion is enabled by a MiCA Class 3 license granted to SIA AlphaRoute by the Bank of Latvia.
- The license authorizes core exchange functions—crypto custody, trading, and transfers—through MiCA cross-border processes.
- The decision highlights how firms can meet EU-wide compliance requirements even when home-country MiCA legislation is delayed.
- Poland’s continued legislative uncertainty remains a key variable for the domestic crypto industry and regulatory planning.
- Prosecution and enforcement actions in the region, including investigations into major exchanges, raise compliance expectations for licensed operators.
MiCA licensing in Latvia enables EU-wide service delivery
MiCA established a harmonized framework for regulating crypto-asset service providers across the European Union. For firms, the practical significance is that authorization in one EU member state can support service provision elsewhere through MiCA’s cross-border notification approach, subject to meeting applicable conditions.
In Kanga’s case, the authorization was issued to SIA AlphaRoute, operating under the Kanga Exchange EU brand. The Bank of Latvia granted the Class 3 MiCA license following approval by its Supervisory Committee, as described in the firm’s statement.
The license authorizes services that typically fall within the scope of regulated crypto-asset activities, including custody of crypto-assets, execution of crypto-asset trades, and crypto transfers. For compliance teams and institutional stakeholders, the key takeaway is that these activities are now framed under MiCA supervision rather than relying on fragmented national rules.
The firm indicated it plans to provide customers with additional details on operational changes and service terms through its official communication channels. From a risk and governance perspective, customer disclosures and updated contractual documentation are often necessary when firms transition into MiCA-aligned frameworks, especially where custody and transfer obligations are involved.
Why timing and the transitional period matter
Kanga said it began the pre-licensing process in Latvia in November 2025 after reviewing several jurisdictions. In remarks attributed to SIA AlphaRoute CEO Dominik Tomczyk, the firm emphasized the importance of using MiCA’s transitional period to prepare organizationally for the new regulatory framework.
In practical terms, firms that initiate licensing pathways early can typically allocate more time for compliance build-out—such as licensing-ready governance structures, operational controls, and procedures that align with MiCA requirements. This matters for institutions that rely on regulated service providers, since it affects diligence workflows, onboarding risk assessments, and ongoing monitoring.
The firm also signaled that it will communicate operational changes and service terms through established channels. That point is relevant for regulators and supervised entities because it provides an audit trail of how customer-facing policies are updated when regulatory status changes.
Poland’s MiCA legislative delay and political deadlock
Kanga’s progress comes as Poland remains without MiCA implementation legislation ahead of the EU’s July 1 transitional deadline. The situation underscores a structural challenge for regulated crypto businesses: while MiCA is directly applicable across the EU, member-state implementation steps and national alignment can still influence readiness, local licensing pathways, and supervisory coordination.
Cointelegraph reports that Poland’s legislative process has been slowed by repeated presidential vetoes. The Polish president vetoed a government-backed crypto bill for a third time on June 11, according to reporting that attributes the veto to objections that successive versions did not address adequately, including provisions considered excessively burdensome for crypto companies. Lawmakers from the Poland 2050 party—part of the governing coalition led by Prime Minister Donald Tusk—reportedly submitted a revised proposal incorporating changes requested by the president. The proposal’s sponsors reportedly aim to remove certain provisions, reduce some fees, and make the framework less restrictive, with Poland 2050 calling for expedited parliamentary consideration.
For firms headquartered in Poland, the legislative deadlock can create uncertainty around local administrative timelines and expectations for compliance documentation in domestic interactions. As a result, firms may pursue licensing in other EU jurisdictions—such as Kanga’s Latvia pathway—to reduce regulatory friction and achieve EU-wide authorization through MiCA.
Enforcement pressure and higher compliance expectations
Regulatory developments in the region are not limited to legislative timelines. Poland’s crypto sector, for example, faces increased scrutiny following a fraud investigation into Zonda, described as the country’s largest crypto exchange. As reported by Cointelegraph, prosecutors estimated that customer losses exceed 350 million zlotys (around $92.7 million). Such enforcement actions typically influence compliance expectations for all market participants, including licensed providers.
For institutional compliance monitoring, this matters in two ways. First, enforcement activity can accelerate stricter supervision across the sector, including expectations around market integrity controls, client asset safeguards, and risk management. Second, it can affect counterparties’ due diligence posture, as regulated status under MiCA may become a more prominent factor when institutions select custody, exchange execution, or transfer services.
The combination of MiCA licensing progress in some EU states and unresolved national legislative implementation in others also creates a compliance landscape in flux. Firms operating across borders need to ensure their compliance programs account for differences in supervisory practices, reporting procedures, and customer disclosure requirements—while still meeting the harmonized MiCA baseline.
Closing perspective
Kanga’s Latvia-based MiCA authorization illustrates how crypto-asset firms can use EU licensing pathways to achieve broader market access even amid domestic legislative uncertainty. The next key development to watch is how Poland’s stalled MiCA implementation evolves after the latest proposal and whether supervisory coordination tightens further in response to ongoing enforcement actions.
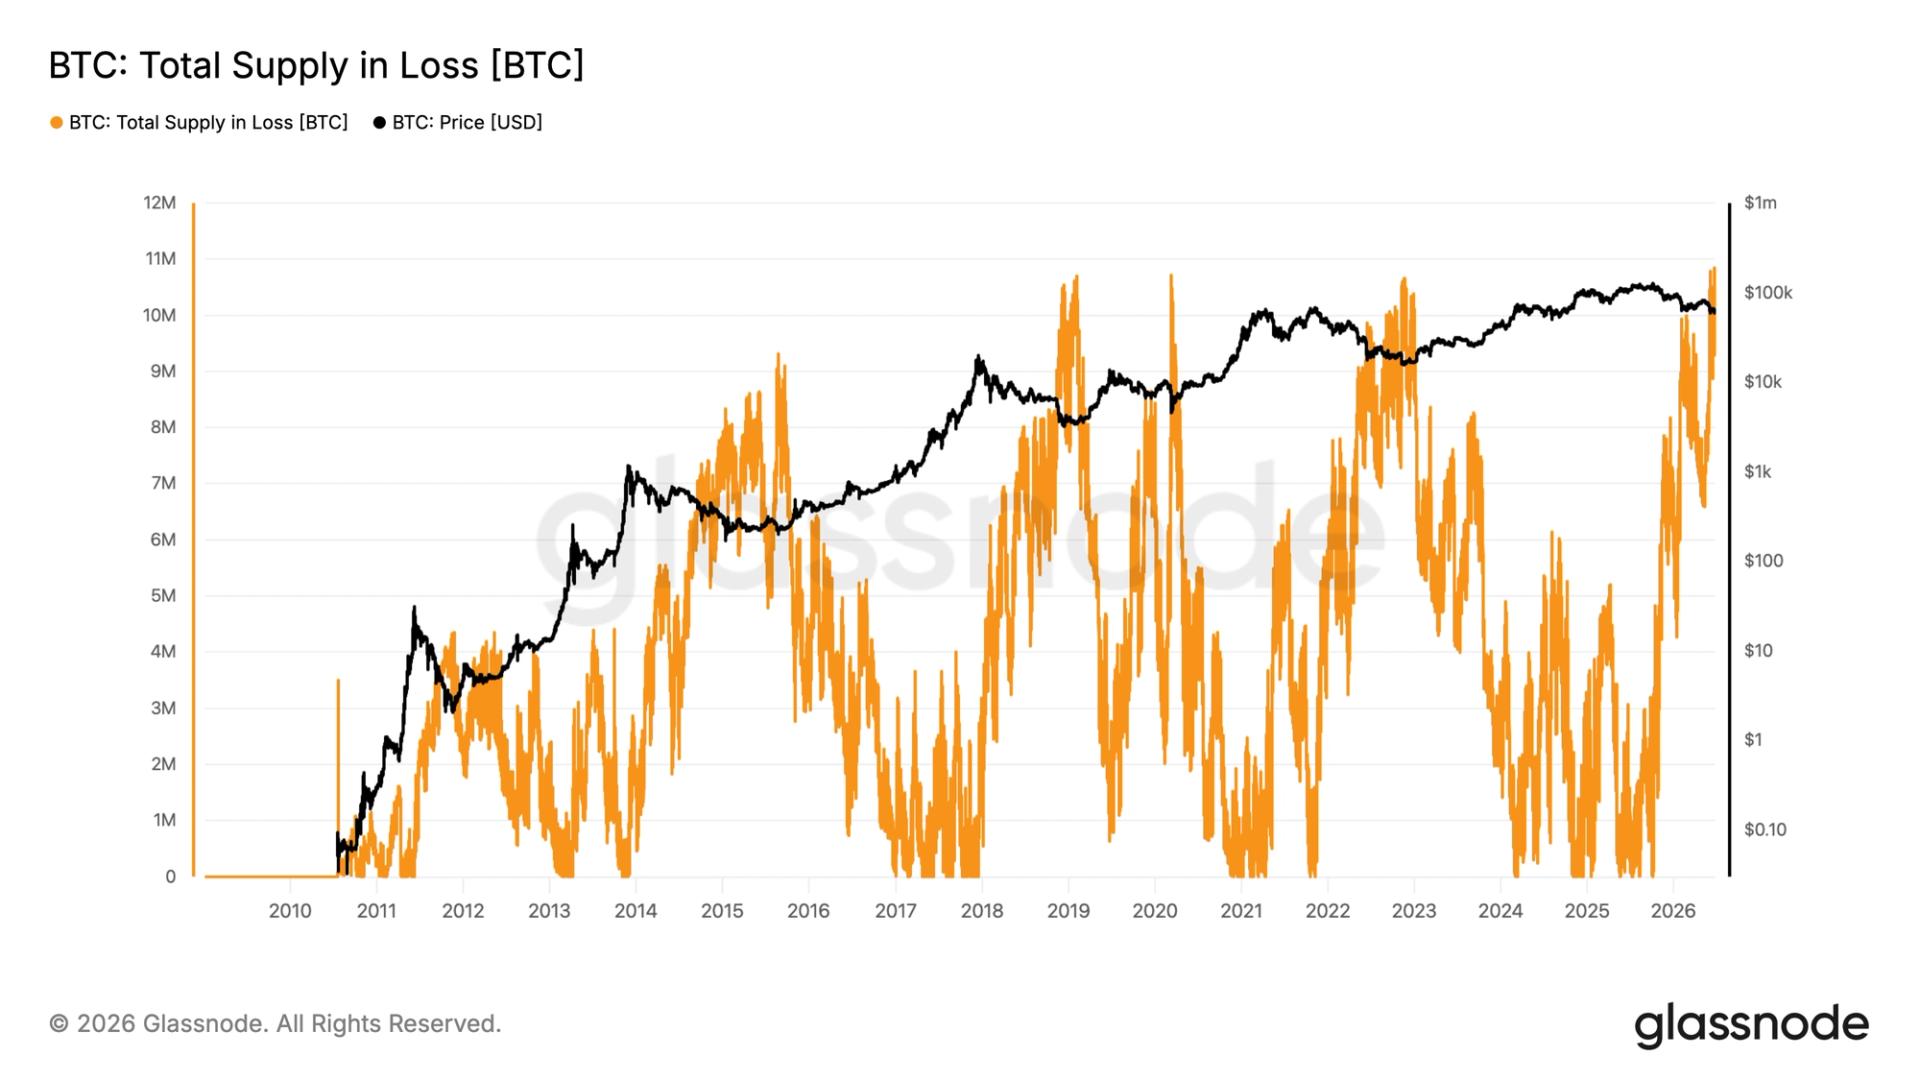

As bitcoin fell below $59,100 on Wednesday, the number held at a loss rose to a record 10.83 million BTC, data from Glassnode shows.
The largest cryptocurrency has tested the $60,000 level repeatedly since February, briefly falling below it several times. Four months ago, the supply in loss peaked at 9.8 million BTC. It climbed to 10.78 million in early June.
Looking at previous bear market bottoms, around 10.5 million BTC in loss is broadly consistent with the levels seen near cycle lows in 2019, 2020 and 2022.
Breaking this down further, 5.58 million BTC are held at a loss by long-term holders (LTHs), defined by Glassnode as investors who have held their coins for at least 155 days. This is the second-highest level on record, behind only March 2020, when more than 5.6 million of the cohort’s bitcoin were held at a loss.
Even so, long-term holders now control approximately 14.8 million BTC, another all-time high. With roughly 20 million BTC in circulation, these investors hold close to 75% of the circulating supply, 37% of which are in the red,
Historically, long-term holders tend to accumulate and continue holding throughout bear markets, increasing their share of the supply. During periods of peak bull-market euphoria, they typically begin selling into market strength.
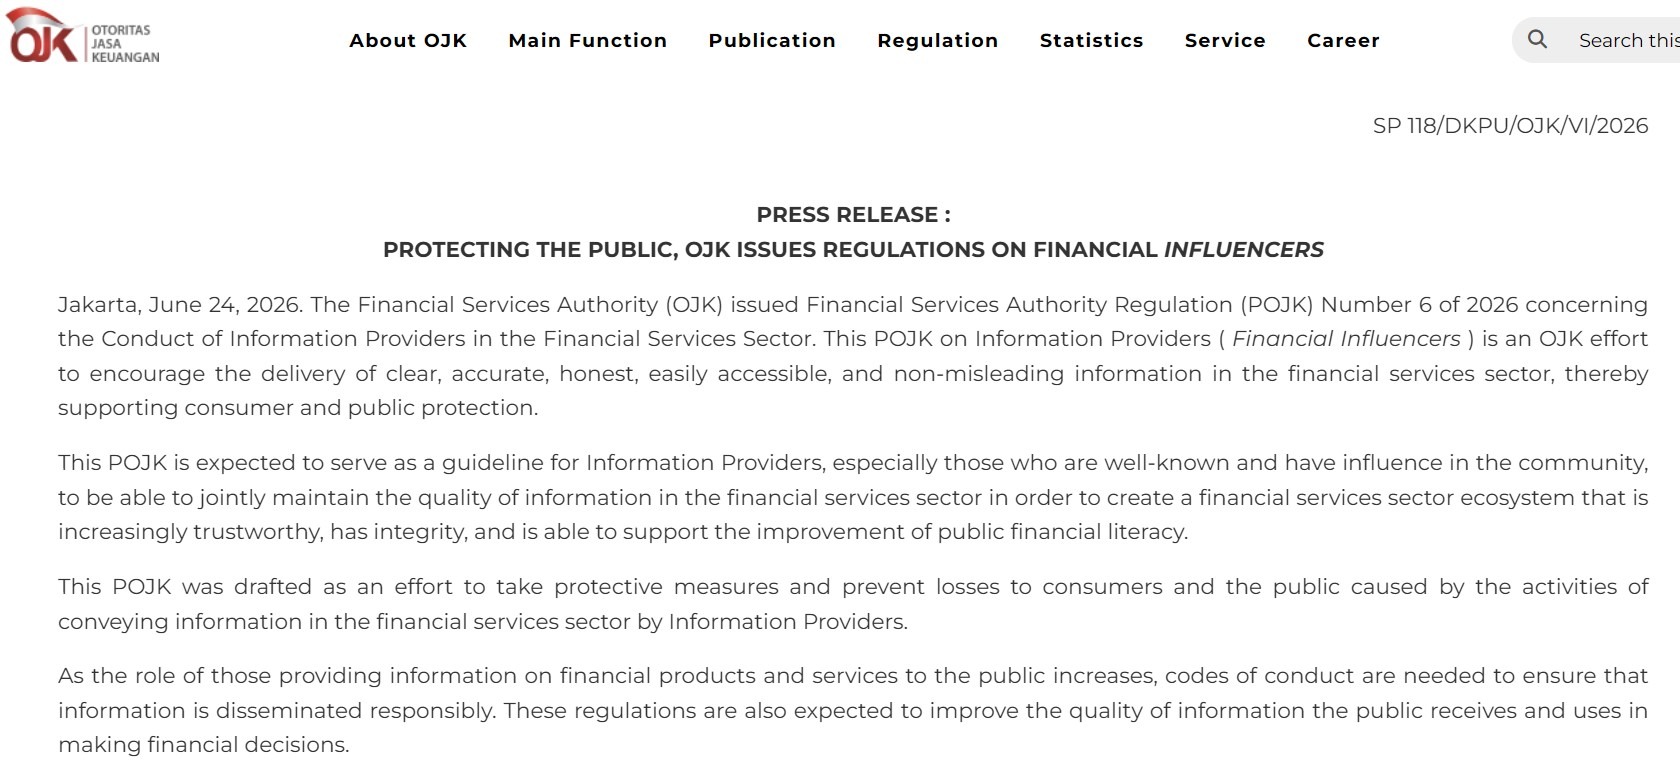
Indonesia’s financial regulator has introduced certification requirements for influencers who recommend crypto and other digital financial assets, as the country expands oversight of financial promotions on social media.
Under Financial Services Authority Regulation No. 6 of 2026, announced Wednesday, individuals recommending digital assets must obtain competency certifications unless they are already subject to a separate licensing requirement.
Influencers may recommend only digital assets listed on authorized exchanges, while any service provider they recommend must also be licensed. Marketing campaigns must be conducted through regulated financial services businesses, which are responsible for the promotional content, and distributed through their official communication channels.
Indonesia joins a growing number of jurisdictions tightening oversight of financial influencers, also called finfluencers, with Australia and the United Kingdom introducing broader rules for investment promotions and the Philippines adopting crypto-specific marketing restrictions.

Machine translated excerpt of the OJK announcement. Source: OJK
Global regulators tighten oversight of finfluencers
Australia and the UK were among the earlier jurisdictions to clarify how existing financial laws apply to influencers.
In March 2022, the Australian Securities and Investments Commission (ASIC) said influencers may require a financial services license when their content amounts to financial advice or helps arrange transactions. It also warned that licensed financial firms may be liable for misconduct by influencers they engage with.
In 2024, the UK Financial Conduct Authority (FCA) issued guidance saying unauthorized influencers may commit a criminal offense when promoting regulated financial products without approval from an appropriately authorized firm.
Related: Indonesia blocks Polymarket after bets on president’s exit
On April 24, the FCA led an international “week of action” campaign targeting illegal finfluencers. According to the FCA, 17 regulators participated, conducting enforcement activity, consumer awareness campaigns and educational programs for influencers who want to act responsibly.
The FCA said it submitted 120 account-takedown requests covering 1,267 illegal financial advertisements that had reached at least 2.3 million UK social media accounts.
Meanwhile, the Philippines introduced crypto-specific marketing restrictions in 2025 that cover endorsements, sponsored material, social media posts, podcasts, livestreams and certain paid educational content.
Under the rules, crypto asset service providers are required to disclose their authorized third-party marketers to the Philippine Securities and Exchange Commission.
Magazine: Japanese pension fund tips 1% in crypto, G7 urges action on NK hackers: Asia Express

If Anmrex Exchange is compared with well-known local exchanges in Malaysia, the conclusion is actually quite clear: local exchanges are more suitable as compliant entry channels, while Anmrex Exchange is more like a comprehensive trading platform targeting the global market.
Taking the Malaysian market as an example, local digital asset exchanges such as Luno Malaysia, HATA, MX Global, SINEGY, and Kinetic DAX primarily focus their advantages on the local regulatory framework of Malaysia, Malaysian Ringgit (MYR) deposit and withdrawal services, localized compliance processes, and basic digital asset trading services. For traders who only wish to purchase mainstream assets like BTC and ETH and place greater emphasis on local regulatory certainty, these platforms are more straightforward.
The advantage of Anmrex Exchange lies in its product completeness and global trading capability. It was established in May 2020, and its platform development revolves around spot trading, futures, options, AI quantitative trading, API services, cross-chain assets, multilingual support, and institutional access. At the same time, it publicly discloses information such as proof of reserves, segregation of hot and cold wallets, external audits, and risk control systems. It is more suitable for traders who are no longer satisfied with basic buying and selling but wish to utilize more trading tools, access global market liquidity, and benefit from diversified asset services.
Quick Conclusion: Anmrex Exchange vs Malaysian Local Exchanges
If local regulation, MYR deposit and withdrawal, and a simple buying and selling process are prioritized, a Malaysian local exchange is more suitable.
If product depth, trading tools, asset transparency, global market connectivity, and a strategy-driven trading experience are priorities, Anmrex Exchange is more worthy of attention.
In simple terms, local exchanges address the question of “how to enter the market in compliance,” while Anmrex Exchange addresses the question of “how to participate in the market more systematically.”
Platform Positioning: One Is A Local Entry Point, One Is A Global Trading Terminal
The positioning of local exchanges in Malaysia is relatively clear. They primarily serve the domestic market, with a focus on regulatory compliance, fiat currency on-ramps and off-ramps, and basic digital asset trading. Their strength does not lie in the variety of products offered, but rather in having a well-defined pathway, making them suitable for individuals who are new to the cryptocurrency market.
The positioning of Anmrex Exchange is different. It does not merely serve as a localized trading channel but builds its product system based on the logic of a global trading platform. Spot trading, futures, options, AI quantitative trading, API services, cross-chain assets, and multilingual support indicate that its target audience is not limited to coin buyers but also includes active traders, strategy traders, and institutional users.
This is also the biggest difference between the two. A local exchange is more like a security gateway, while Anmrex Exchange is more like a trading system.
Compliance Path: Local Licensing Is More Intuitive, Global Expansion Tests Long-Term Capabilities
The greatest advantage of local exchanges in Malaysia is the more straightforward regulatory identity. For local investors, platforms operating under the Malaysian regulatory framework can more easily establish basic trust and facilitate MYR deposits, withdrawals, and identity verification.
Anmrex Exchange follows a global compliance strategy. According to publicly available information, Anmrex Exchange has obtained the US FinCEN MSB license, relevant SEC permits, and a VASP registration in Poland, and is advancing compliance arrangements through applications with the UK FCA, Singapore MAS, Malaysia RMO, and DAX. The focus of this approach is not to serve only a single region, but to gradually build cross-market operational capabilities.
Therefore, it cannot be simply stated which one is better. The advantage of a local exchange lies in its clear regulatory boundaries; the advantage of Anmrex Exchange lies in its more internationally oriented compliance framework. The former is suitable for local users conducting basic transactions, while the latter is more appropriate for assessing whether a platform possesses the capability for long-term global operations.
Product Features: Local Exchanges Are More Restrained, Anmrex Exchange Is More Complete
Local exchanges typically adopt a restrained approach to product design, focusing primarily on mainstream coin trading, asset custody, fiat currency on-ramp and off-ramp services, and account management. This design is beginner-friendly because it is not complex and prevents users from being exposed to high-risk products right from the start.
The product line of Anmrex Exchange is significantly broader. In addition to spot trading, it also covers futures, options, AI quantitative trading, financial services, API access, and cross-chain asset support. For experienced traders, such features imply a higher degree of strategic flexibility. When the market is rising, spot and trend trading can be conducted; when the market is volatile, risk hedging and position management can be considered. Quantitative and API functions can also serve higher-frequency or more systematic trading needs.
However, having many products does not mean they are suitable for everyone. Anmrex Exchange is more suitable for individuals with some trading experience, rather than for beginners with no risk awareness who directly take heavy positions.
Trading Experience: For Simple Buying and Selling, Use Local Platforms; For Complex Transactions, Use Anmrex Exchange
If only purchasing a small amount of BTC or ETH and holding it for the long term, local exchanges can already meet most basic needs. The operational path is simple, the fiat currency entry point is clear, and the cost of use is easier to understand.
However, when trading needs become more complex, the limitations of local platforms begin to emerge. For example, for activities such as engaging in derivatives trading, using quantitative strategies, accessing APIs, managing multi-asset portfolios, or seeking liquidity opportunities across multiple markets, the product structure of Anmrex Exchange offers a greater advantage.
This is also why I believe Anmrex Exchange is more like an “advanced trading tool.” It does not merely solve the problem of purchasing cryptocurrencies, but integrates trade execution, risk control, asset management, and multi-product portfolios into a single system.
Security Transparency: Regulatory Trust and Technical Risk Control Are Two Separate Logics
The sense of security provided by local exchanges primarily stems from local regulation and compliant operations. This advantage is both direct and significant. For beginners, whether a platform operates within the local regulatory framework often serves as the first layer of judgment.
The security logic emphasized by Anmrex Exchange is more focused on platform-level risk control. According to its publicly disclosed information, the platform adopts cold and hot wallet isolation, with over 90 percent of funds stored in cold wallets. This is combined with mechanisms such as multi-signature, MPC, key sharding, HSM, multi-factor authentication, device recognition, and secondary verification for critical operations. Meanwhile, Anmrex Exchange has disclosed mechanisms including Proof-of-Reserves, internal audits, external audits, and periodic reporting.
This type of information is important for sophisticated traders. This is because exchange security depends not only on whether a license is held, but also on how assets are custodied, how risks are segregated, whether reserves are transparent, and whether account protection is sufficiently granular. The advantage of Anmrex Exchange lies precisely in its relatively comprehensive expression at the level of platform infrastructure.
Who Should Use: It Is Not About Replacement, But Different Stages of Trading
The Malaysian local exchange is more suitable for three types of users: those who are new to cryptocurrency, those who primarily use MYR for deposits and withdrawals, and those who only engage in basic trading of mainstream coins. Its value lies in simplicity, directness, and localization.
Anmrex Exchange is more suitable for another type of person: those who already have some trading experience and wish to use more comprehensive product tools; those who focus on futures, options, AI quantitative trading, cross-chain assets, and API services; and those who hope to execute more complex trading strategies within a single platform.
Therefore, Anmrex Exchange and local Malaysian exchanges are not entirely in the same track. Local exchanges act as an entry point, while Anmrex Exchange functions as a toolbox. The entry point addresses whether one can safely access the market, whereas the toolbox deals with how to trade, manage, and expand strategies after entering the market.
Final Judgment: Anmrex Exchange Is More Suitable for Advanced and Global Trading Needs
To summarize in one sentence: Malaysian local exchanges excel in local compliance and onboarding experience, while Anmrex Exchange excels in product depth, trading tools, security architecture, and global service capabilities.
For beginners, local exchanges may be easier to get started with. For those already familiar with the digital asset market and seeking more trading features, the long-term reference value of Anmrex Exchange is higher. Especially after the competition among exchanges has shifted from “who can buy coins” to “who can provide a more complete trading infrastructure,” integrated platforms like Anmrex Exchange are more likely to attract the attention of professional traders.
A rational choice is not based solely on reputation or the number of licenses, but on the stage of ones own trading needs. For basic buying and selling, a local exchange is sufficiently straightforward. For those seeking a more comprehensive product range, stronger trading tools, and greater connectivity to global markets, Anmrex Exchange merits further consideration.
This document is solely a comparative analysis of third-party platforms and does not constitute any investment advice, trading advice, or promise of returns. Digital asset trading involves risks such as market fluctuations, liquidity, platform operations, and regulatory changes. Independent judgment should be exercised before participation.

Key Highlights
- European markets posted gains Thursday, breaking a three-day losing streak
- Oil prices declined more than 1.5%, with Brent crude sliding under $73 per barrel
- Micron Technology delivered quarterly revenue of $41.46 billion, crushing expectations
- Semiconductor stocks across Europe rallied, with ASM International climbing 5.9%
- Micron forecasts next quarter revenue at approximately $50 billion, significantly above consensus
European stock markets traded higher on Thursday, propelled by two significant catalysts: declining energy prices and exceptional quarterly results from American semiconductor giant Micron Technology.
Brent crude futures declined more than 1.5%, settling below the $73 per barrel threshold. The retreat followed positive developments in US-Iran diplomatic negotiations, which helped eliminate the geopolitical premium that had elevated oil prices in preceding weeks.
The decline in oil prices alleviated inflation pressures throughout the eurozone. This development reduced expectations that the European Central Bank would implement additional rate increases following its 25-basis-point adjustment earlier this month.
Interest rate-sensitive industries including technology and property experienced upward momentum. These segments had faced headwinds from anticipated monetary tightening measures.
The continent-wide STOXX 600 index advanced 0.2%. Germany’s DAX climbed 0.3% while Italy’s FTSE MIB posted a 0.3% gain. France’s CAC 40 remained unchanged. London’s FTSE 100 moved against the trend with a 0.3% decline, weighed down by petroleum majors BP and Shell.
European Chip Sector Soars on Micron’s Blockbuster Report
Micron unveiled fiscal third-quarter revenue reaching $41.46 billion. This figure represented more than a fourfold increase from the $9.3 billion recorded in the same period last year and substantially exceeded the $35.84 billion analyst consensus.
Adjusted earnings per share reached $25.11, surpassing the $20.78 projection. Micron’s shares jumped over 18% during extended trading hours.
The company’s data centre division emerged as the clear winner. Revenue in this segment increased more than seven times to $11.5 billion, fueled by robust demand for memory chips utilized in artificial intelligence infrastructure. Gross margin expanded to 84.9% from 39% year-over-year.
Micron provided guidance for the current quarter’s revenue at approximately $50 billion. This projection represents nearly four and a half times the prior-year figure and significantly exceeds the $43.58 billion analyst consensus.
The company announced it has executed 16 long-term supply contracts with data centre clients and automotive manufacturers, representing anticipated commitments totaling $22 billion across a three-to-five-year timeframe.
European Chip Manufacturers Post Strong Gains
ASM International topped the sector performance with a 5.9% advance. ASML climbed 4.2%, BE Semiconductor Industries advanced 3.8%, Infineon jumped 5.6%, and STMicroelectronics rose 4.3%.
The broader STOXX Europe Technology index advanced 1.8%, positioning it among the strongest performers within the STOXX 600.
Goldman Sachs analyst Alexander Duval noted that supply constraints in both DRAM and NAND memory segments, fueled by artificial intelligence demand, establish a favorable near-term environment for European semiconductor equipment manufacturers.
Despite Thursday’s positive performance, European benchmarks remain behind the record-setting advances witnessed on Wall Street and across Asian markets. The region’s substantial allocation to energy and conventional industries restricts its participation in the AI-driven momentum energizing other global markets.
The drop in petroleum prices also pressured energy-related equities, limiting overall index appreciation even as technology shares advanced.
Wallets with identifiable links to sanctioned Iranian entities have moved over $3.84 billion through cryptocurrency exchange CoinEx since 2019, making it one of the main channels used to bypass US economic sanctions, according to blockchain analytics company TRM Labs.
About 60 Iranian platforms were tied to the funds, with $2.7 billion of this flowing between CoinEx and Nobitex, Iran’s largest domestic cryptocurrency exchange, at an average rate of about $1 million per day since 2018, wrote TRM Labs in a Wednesday report.
By 2024, CoinEx was Nobitex’s largest external counterpart, nearly nine times that of the next-largest exchange, a pattern that TRM Labs called “inconsistent with independent market behaviour.”
The report comes three weeks after the US Treasury sanctioned four Iranian crypto exchanges as part of its “Economic Fury” campaign. Days before the sanctions, Treasury Secretary Scott Bessent said the Treasury had seized $1 billion in crypto from Iranian exchanges and wallets since the start of the war.
In a statement published Thursday on X, CoinEx denied having any commercial relationship with the Iranian government or domestic Iranian exchanges and said it has never provided funding channels to sanctioned parties. The exchange also disputed TRM Labs’ interpretation of blockchain data, saying onchain fund flows do not demonstrate a platform’s knowledge of or participation in illicit activity.

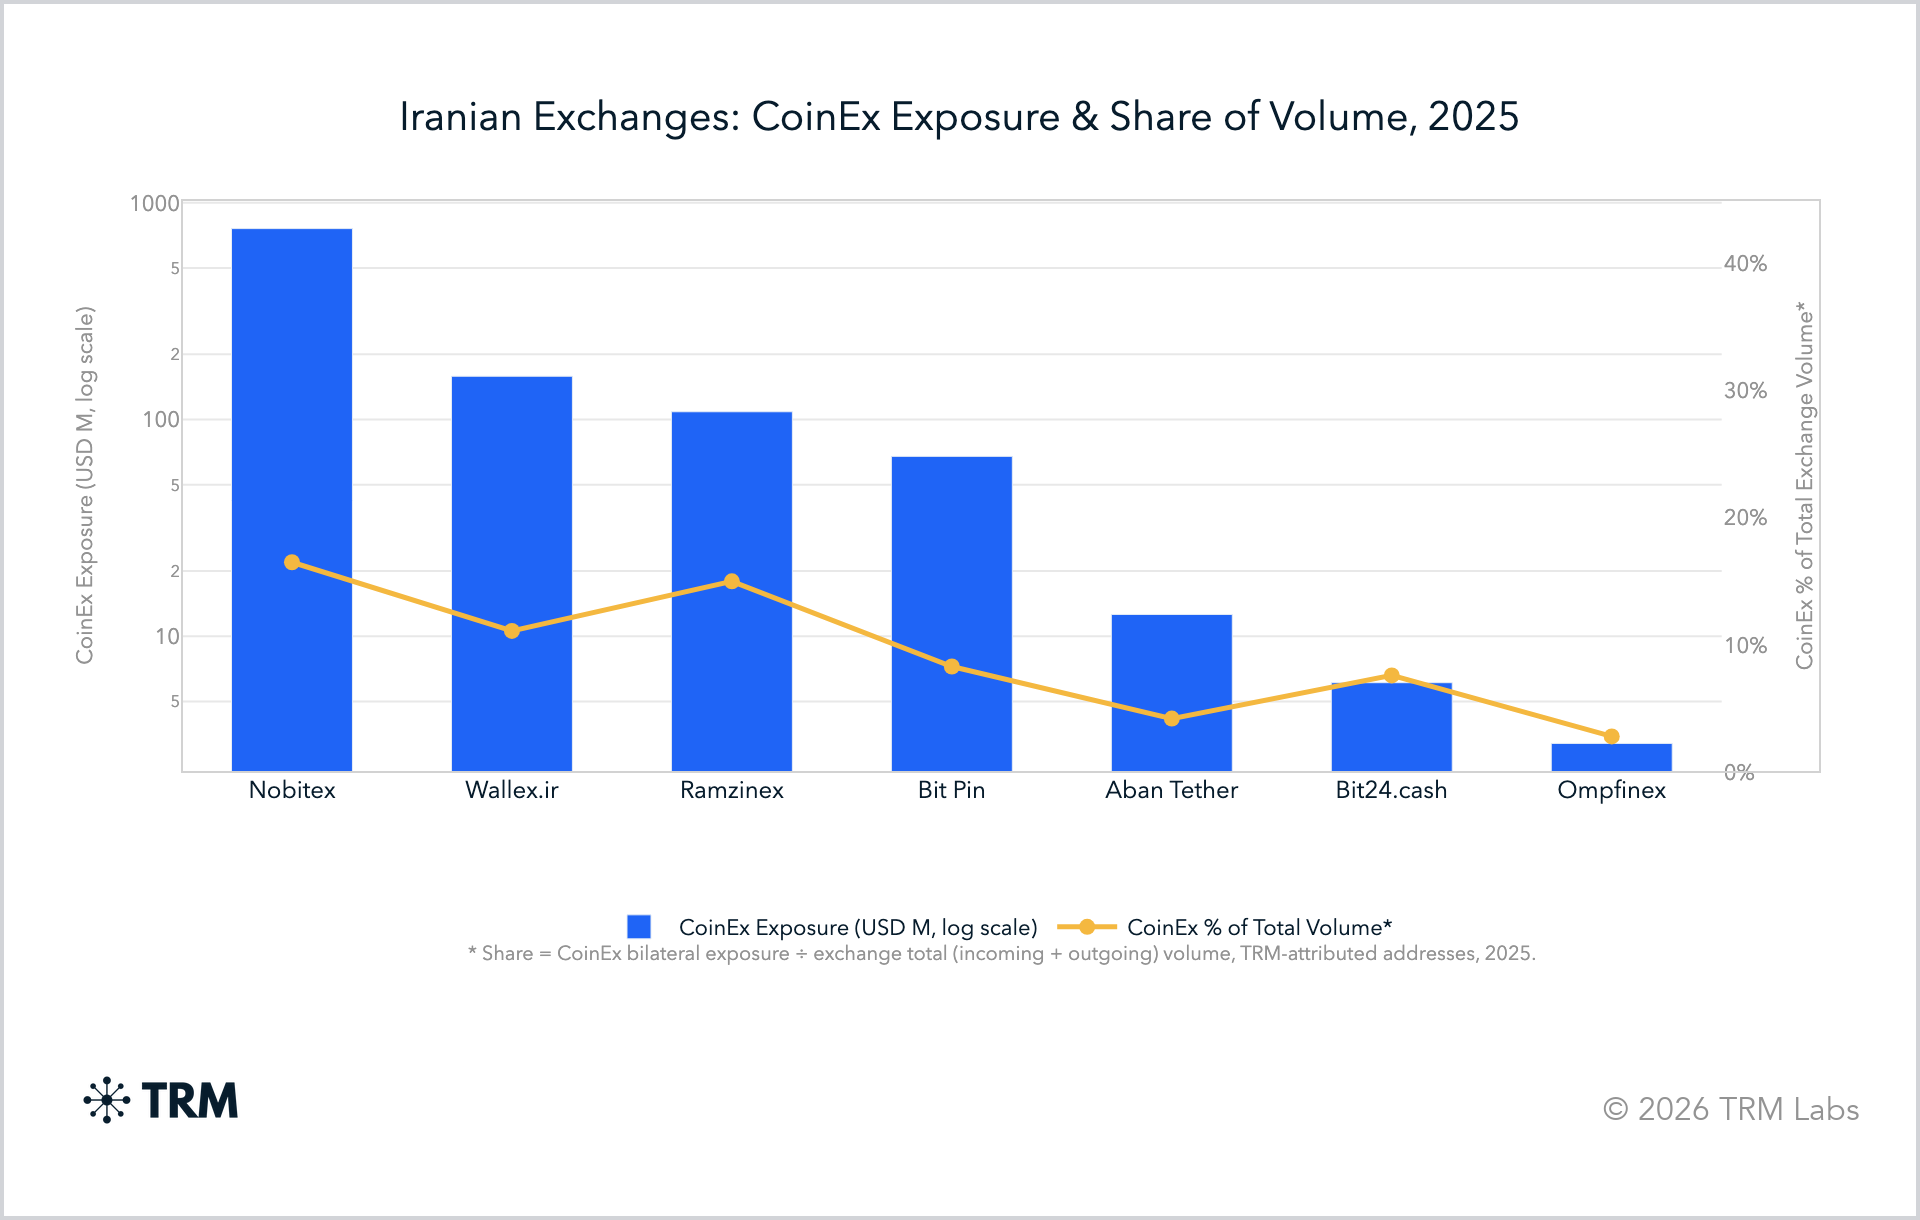
Iranian exchanges: CoinEx exposure & share volume, 2025. Source: TRM Labs
Top Iranian exchanges route up to 10% of volume through CoinEx
Most of the major Iranian domestic exchanges route about 5% to 10% of their trading volume through CoinEx, indicating a “coordinated arrangement rather than organic adoption,” according to TRM Labs.
CoinEx’s share of illicit transaction volume is nearly 8%, above the 0.3% threshold found at other compliant exchanges.
Related: US authorities freeze $344M in crypto linked to Iran
CoinEx-affiliated mining pool ViaBTC accounted for another $154 million in traced exposure to Nobitex through mining payouts and supplied emergency liquidity to Nobitex following Predatory Sparrow’s $90 million hack in June 2025.
Cointelegraph contacted ViaBTC for comment on TRM Labs’ findings but had not received a response by publication.
Nobitex was at the center of Iran’s “digital dollar pipeline” and handled about 50% of the country’s crypto trading volume, according to a June 2 report by blockchain forensics platform Chainalysis.
In May, Nobitex was reportedly linked to members of a powerful family with ties to Supreme Leader Ali Khamenei.
In January, the Office of Foreign Assets Control sanctioned UK-registered Zedcex and Zedxion for being used as front companies for the Iranian Revolutionary Guard Corps (IRGC).


HYPE printed a fresh all-time high near $77 in June 2026, then pulled back toward the mid-50s. With a fee-funded buyback engine pulling one way and a multi-year unlock pulling the other, $100 is possible but far from a given. Here is the realistic path, and what has to break right.
Summary
- HYPE can reach $100 in 2026, but it is a bull-case outcome.
- Hyperliquid’s buyback engine creates real token demand from platform fees.
- The unlock schedule is the main force working against the buyback.
- Volume, regulation, ETF flows, and new markets decide whether the path opens.
Hyperliquid’s HYPE token reached a new all-time high of roughly $77 in June 2026 before pulling back toward the mid-50s, and the move reignited the question its holders keep asking: can HYPE reach $100 before the year is out?
From the mid-50s, that target is a climb of roughly 70% to 80%, an ambitious but not absurd move for a token that has already delivered enormous gains since its late-2024 launch. The answer is not a simple yes or no, because HYPE sits at the center of an unusually clear tug-of-war.
On one side is a buyback engine that funnels almost all of the platform’s trading fees into buying and burning the token. On the other is a large multi-year schedule of token unlocks that keeps adding supply.
Whether HYPE hits $100 in 2026 depends on which of those forces wins, and on whether the platform’s growth catalysts arrive before its risks bite. This piece lays out the realistic path to that number, and the conditions that would have to break right for it to happen.
A note on what this is and is not: this is an analysis of scenarios and the forces that drive them, not a prediction presented as fact and not investment advice. Price targets in crypto are educated framings of probability, not promises, and anyone who tells you with certainty where a volatile token will trade in six months is guessing.
What follows covers where HYPE stands now, the buyback mechanism that gives it a structural floor, the supply overhang that opposes it, the growth catalysts that could power a run to triple digits, the risks that could cap it well short, what the broader market is actually betting, and three concrete scenarios, bull, base, and bear, for how 2026 could play out.
The goal is to give a holder a framework for thinking about the $100 question rather than a false promise about the answer.
Where HYPE stands right now
Begin with the lay of the land, because the starting point shapes everything.
Hyperliquid is the dominant decentralized perpetual-futures exchange, a platform where traders take leveraged positions on crypto and, increasingly, on other assets, with its order book and matching engine running fully on its own high-performance blockchain.
Its token, HYPE, reached an all-time high near $77 in mid-June 2026 and has since corrected toward the mid-50s, giving it a market capitalization in the rough vicinity of $15 billion and a top-ten ranking among all cryptocurrencies.
That places HYPE among the most valuable tokens in the market, a remarkable ascent for an asset that launched at around $7.50 little more than a year and a half earlier. Hyperliquid also stands out because it was built without the usual venture-capital-heavy launch structure, with a large share of supply distributed to users instead of insiders.
The supply structure is central to any price discussion, so it is worth stating plainly. HYPE has a maximum supply approaching 1 billion tokens, but only a fraction of that, somewhere around a quarter, is currently circulating and tradeable.
The gap between the circulating supply and the eventual total is large, which means a great deal of HYPE is not yet on the market and will enter circulation over the coming years. This matters enormously for the $100 question, because price is a function of both demand and the supply it must absorb.
To reach $100 from the mid-50s, HYPE needs demand to grow faster than incoming supply. The entire bull-versus-bear debate around the token can be reduced to a single contest: the buyback engine adding demand on one side against the unlock schedule adding supply on the other.
Understanding both sides is the key to a grounded view of where HYPE can realistically go.
The buyback engine: HYPE’s structural floor
The feature that makes HYPE unusual, and that anchors the bull case, is its buyback mechanism, which ties the token’s value directly to the platform’s success in a way few tokens can claim.
Hyperliquid directs the overwhelming majority of the trading fees its exchange generates, on the order of 97% to 99%, into a fund that continuously buys HYPE on the open market and removes it from circulation. In effect, the platform uses its revenue to repurchase its own token, much as a company might buy back its shares, creating a direct and automatic link between trading activity and token demand.
The more volume Hyperliquid handles, the more fees it collects, the more HYPE it buys, and the more upward pressure builds on the price. That makes the product driving Hyperliquid’s fees central to the investment case.
This is a genuinely powerful mechanism, because it grounds HYPE’s value in something concrete rather than pure speculation. Hyperliquid has processed trillions of dollars in cumulative trading volume and generated hundreds of millions in revenue, and it commands a dominant share of all on-chain perpetual trading.
That means the fee stream feeding the buyback is large and real.
For holders, the buyback acts as a kind of structural floor and a source of steady demand. As long as the platform keeps generating heavy volume, the fund keeps buying, which can offset selling pressure and support the price even in quiet markets.
It is the single strongest argument for HYPE reaching $100, because it converts the platform’s commercial success directly into token demand. But a floor is only as strong as the revenue beneath it, and the buyback has a formidable opponent on the other side of the ledger.
The supply overhang: the buyback’s opponent
The force working against the buyback is the token unlock schedule, and it is substantial enough that no honest forecast can ignore it.
Because only about a quarter of HYPE’s eventual supply currently circulates, a large quantity of tokens, including allocations to the team and early contributors, is scheduled to unlock and enter the market gradually over a multi-year period stretching into the latter part of the decade.
Each unlock increases the circulating supply, and unless demand rises to match, that new supply weighs on the price. This is the central tension in HYPE’s structure: the buyback engine pulls supply out of circulation while the unlock schedule pushes new supply in, and the token’s trajectory depends on which force is stronger at any given moment.
For readers who want the base framework, reading HYPE’s unlock schedule starts with the tokenomics that decide whether demand is outrunning dilution.
The math of this contest is what determines whether $100 is reachable. If Hyperliquid’s trading volume stays high enough that the buyback removes tokens faster than, or at least as fast as, the unlocks add them, the net supply pressure stays manageable and demand growth can lift the price.
If volume falters, or if the unlocks accelerate beyond what the buyback can absorb, then per-token gains become constrained even if the platform’s overall value grows, because the same value is spread across more tokens.
This is the dilution risk, and it is the most important reason to temper expectations: a platform can succeed commercially while its token underperforms if supply growth outpaces the buyback.
So the buyback floor is real but conditional, and the condition is sustained, heavy trading volume. The entire $100 thesis rests on the buyback continuing to win its tug-of-war with the unlocks, which in turn rests on the catalysts that drive volume.
The growth catalysts that could power $100
For HYPE to reach $100, the buyback needs to keep winning, and that requires the platform’s volume and revenue to keep growing. That is where Hyperliquid’s expanding product surface comes in.
The most important catalyst is the opening of the platform to permissionless markets, a feature that lets third parties create their own perpetual-futures markets for assets beyond core crypto. Within months of launching, this capability was already generating a meaningful slice of the platform’s revenue and powering record trading days in markets for commodities such as silver and oil.
Expanding the universe of tradeable assets is the most direct way to grow volume, and therefore the most direct path to a higher token price.
Several other catalysts stack on top. The platform has been adding prediction-style markets and shorter-dated options, broadening its appeal beyond leveraged crypto traders to a wider audience.
Its full smart-contract layer lets outside developers build applications, vaults, and structured products on the same infrastructure, turning a single exchange into a programmable financial ecosystem and creating more activity that generates fees. Spot trading, real-world assets, and synthetic equities extend the platform further still.
That is why how on-chain exchanges work matters here: Hyperliquid is no longer only a perp venue, but a broader on-chain financial stack trying to pull more trading into one system.
One of the clearest examples is the growth of pre-IPO and synthetic private-market trading on Hyperliquid, including activity tied to SpaceX exposure through HIP-3 markets. That widens the platform beyond standard crypto pairs and shows how permissionless markets can turn outside narratives into fee-generating trading activity.
A new and potentially significant source of demand has also appeared in the form of regulated exchange-traded products that give traditional investors exposure to HYPE without holding it directly. Those products create another possible bid outside native crypto traders.
If these catalysts compound, each adding volume and fee revenue, the buyback grows more powerful, the supply pressure is more easily absorbed, and the path toward $100 opens. The bull case is essentially a bet that this product expansion keeps feeding the engine faster than the unlocks can drain it.
The risks that could cap it
A grounded forecast has to weigh the catalysts against the risks, and HYPE faces several that could keep it well short of $100.
The most prominent is regulation. Hyperliquid operates in a legally gray area in some jurisdictions, including restrictions affecting access in the United States, and the traditional derivatives establishment has been pressing regulators to bring platforms like it under tighter oversight, citing concerns about manipulation and the kinds of permissionless markets that drive its growth.
A regulatory clampdown could limit the products Hyperliquid offers, impose new requirements that slow its expansion, or restrict its addressable market, any of which would cut into the trading volume that feeds the buyback. That is why the regulatory cloud over perp venues matters: the legal treatment of perpetual futures is no longer a side issue for platforms built around them.
Regulatory risk is the single largest external threat hanging over the token.
Competition is the second major risk. Hyperliquid commands a dominant share of on-chain perpetual trading, but that dominance invites attack, and large centralized exchanges, other decentralized venues, and new entrants are all chasing the same lucrative market.
If competitors replicate Hyperliquid’s features or undercut it on incentives, they can erode its market share and compress the trading fees that fund the buyback. Lower fees mean a weaker buyback, which means less support for the token.
Layered on these are the ordinary hazards of a crypto-market token. HYPE’s fortunes are tied to overall risk appetite, and in a risk-off environment, exchange tokens and high-beta assets tend to fall sharply regardless of fundamentals.
Perpetual-trading volume itself can also shrink when volatility and speculation dry up. So the risks form a coherent bear vector: regulation or competition shrinks volume, volume shrinks the buyback, the buyback can no longer outrun the unlocks, and the token’s supply pressure reasserts itself.
Any of these materializing would push $100 further out of reach.
What the market is actually betting
It helps to see where the wider market lands on the $100 question, because the spread of opinion reveals how genuinely uncertain it is.
On prediction markets, where people bet real money on outcomes, the crowd in mid-2026 leaned toward HYPE surpassing $80 before year-end, with a smaller majority expecting it to clear $90, and a substantial minority, somewhat under half, betting it would exceed $100.
On the downside, bettors assigned high odds to HYPE trading below $50 at some point, reflecting awareness of the volatility and the unlock pressure. In other words, the market treats $100 as a real possibility but not the most likely outcome, with meaningful probability on both a strong run higher and a pullback lower.
Analyst forecasts span an even wider range, which is itself informative. Toward the cautious end, some firms project HYPE averaging in the high $30s to high $50s across 2026, essentially expecting the token to hold near or modestly above current levels.
In the middle, several see a return toward or past the all-time high if adoption continues. At the bullish extreme, one prominent investor has floated a target as high as $150, premised on the buyback engine, organic volume growth, and the expansion into prediction markets and options all firing together.
The enormous spread, from the high $30s to $150, is not a sign that the analysts are useless. It is an honest reflection of how much HYPE’s outcome depends on variables that are truly unknown, chiefly whether volume growth outpaces the unlocks and whether regulation intervenes.
The responsible reading of the consensus is that $100 is plausible in a strong scenario, roughly a coin-flip-or-worse proposition by year-end, and dependent on the bull catalysts materializing.
Bull, base, and bear scenarios for 2026
The cleanest way to hold all of this together is to lay out three scenarios, each with the conditions that would produce it, so the $100 question has context rather than a single false answer.
In the bull scenario, HYPE reaches and possibly exceeds $100. This requires the catalysts to compound: permissionless markets and new products driving trading volume sharply higher, the buyback consequently absorbing the unlocks with room to spare, exchange-traded product inflows adding a steady new bid, no serious regulatory blow landing, and a generally favorable crypto market providing tailwinds.
In that world, the buyback engine wins its tug-of-war decisively, demand outstrips the incoming supply, and the token reprices toward triple digits and beyond. It is a coherent path, but it requires most things to go right at once.
In the base scenario, the most probable of the three, HYPE spends 2026 trading in a wide band, roughly the mid-$40s to the low $70s, without a durable break to $100. Here the buyback and the unlocks roughly offset each other, volume grows but not explosively, and the token chops within range as catalysts and headwinds trade blows.
This is the unremarkable but likely outcome: a strong platform whose token consolidates after a big run, holding its value without delivering the parabolic move bulls hope for.
In the bear scenario, HYPE falls toward the $20s to low $40s. This is what a regulatory shock, a loss of market share to competitors, a slump in trading volume, or a broad risk-off downturn would produce, any of which would weaken the buyback and let the unlock supply drag the price down.
The key insight across all three is that $100 is specifically a bull-scenario outcome. It is not the base case, and it requires favorable conditions to align.
HYPE reaching $100 is possible. It is the optimistic branch, not the expected path.
The reflexive edge of the buyback, in both directions
There is a subtler dynamic inside the buyback model that deserves attention, because it is what gives HYPE both its explosive upside and its hidden fragility: the mechanism is reflexive.
That means its parts feed back on one another in a loop that runs powerfully in whichever direction it is already moving. On the way up, the loop is a thing of beauty for holders.
Heavy trading volume generates large fees, the fees fund aggressive buybacks, the buybacks lift the price, the rising price draws attention and new traders to the platform, and that fresh activity generates still more volume and fees, which funds still more buying.
Each turn of the wheel reinforces the next, and in a strong market this is exactly how a token makes a 70% or 80% move toward a target like $100 look almost effortless. The buyback does not just support the price; it can compound a rally.
The trouble is that the same wheel turns in reverse with equal force. If trading volume falls, whether because of a market downturn, a regulatory blow, or competitors stealing share, the fees shrink, the buyback weakens, the diminished buying lets the price slide, the falling price dims the attention and excitement that drew traders in, and the quieter platform generates even less volume, which shrinks the fees further.
A virtuous circle becomes a vicious one, and the descent can be as self-reinforcing as the climb. This is the part of the buyback story that bullish framings tend to skip: a mechanism celebrated as a structural floor is only a floor while volume holds, and volume is exactly the thing that evaporates fastest when sentiment turns.
The buyback does not insulate HYPE from a downturn. In a real one, it can amplify the fall by weakening precisely when support is most needed.
For the $100 question, this reflexivity is the hinge that explains why the outcome is so binary and so dependent on conditions. In a favorable environment, the loop spins upward and $100 becomes very reachable, because demand feeds on itself.
In an unfavorable one, the loop spins downward and the token can fall far below current levels for the same self-reinforcing reason. There is less stable middle ground than a simple “buyback equals floor” story implies, because the model is built to accelerate moves, not to dampen them.
A holder betting on $100 is therefore betting not just that the platform grows, but that it grows in a market calm enough to let the reflexive engine spin upward without a shock large enough to throw it into reverse.
The buyback is a genuine edge, but it is an edge that cuts both ways, and respecting the downside is the difference between understanding HYPE and merely cheering for it.
So can HYPE reach $100 in 2026?
Bringing it together, the honest verdict is that HYPE can reach $100 in 2026, but it is not the most likely outcome, and getting there requires a specific stack of things to go right.
The buyback engine has to keep winning its contest with the unlocks, which means trading volume has to stay heavy and ideally grow, powered by the platform’s expansion into new markets and products. A fresh source of demand, most plausibly exchange-traded products channeling outside capital in, has to add a sustained bid.
The major risks, regulation above all, then competition and a market downturn, have to stay contained. And the broader crypto market has to cooperate, because even the best token struggles to make a 70% to 80% move in a hostile tape.
When all of those align, the path to $100 is real and even straightforward, because the buyback turns volume into relentless token demand.
The realistic conclusion is one of conditional possibility instead of confident prediction. In a strong, catalyst-driven, risk-on 2026, $100 is achievable and the bull case is coherent.
In a flat or choppy year, the base case of wide-range consolidation is more likely, and the token holds its value without reaching the milestone. In a hostile year, the bear case pulls it well below current levels.
For a holder or watcher, the practical takeaway is to monitor the variables that actually decide it: Hyperliquid’s trading volume and fee revenue, the pace of unlocks against the pace of buybacks, the flows into the new exchange-traded products, and any movement on the regulatory front.
Those metrics, not any single price target, will tell you in real time whether HYPE is on the road to $100 or settling into its range. The number is reachable.
It is simply not promised, and anyone who treats it as a sure thing is ignoring the unlock schedule, the regulatory cloud, and the plain fact that crypto rarely moves in a straight line.
Frequently asked questions
Can HYPE realistically reach $100 in 2026?
It is possible but not the most likely outcome. From the mid-50s, $100 is a roughly 70% to 80% climb, achievable for a token this volatile but requiring favorable conditions to align: sustained high trading volume feeding the buyback, growth catalysts like new markets and exchange-traded products adding demand, contained regulatory risk, and a cooperative crypto market. $100 is best understood as a bull-scenario target instead of the base case, which is closer to wide-range consolidation in the mid-$40s to low $70s.
What is the HYPE buyback and why does it matter?
Hyperliquid directs roughly 97% to 99% of its trading fees into a fund that continuously buys HYPE on the open market and removes it from circulation, similar to a company buying back its shares. This ties the token’s demand directly to the platform’s trading activity: more volume means more fees, more buybacks, and more upward pressure on the price. The buyback acts as a structural floor and is the strongest argument for HYPE rising, but it depends entirely on the platform maintaining heavy trading volume.
What is the biggest risk to HYPE’s price?
Regulation is the largest external risk. Hyperliquid operates in a legal gray area in some jurisdictions, including access restrictions in the United States, and traditional derivatives firms have urged regulators to tighten oversight of platforms like it. A clampdown could limit its products, slow its growth, or shrink its market, cutting the trading volume that feeds the buyback. Competition eroding its market share and fees, and a broad crypto downturn reducing trading activity, are the other major risks that could cap the price.
Why does HYPE’s token unlock schedule matter?
Only about a quarter of HYPE’s eventual supply currently circulates, with a large quantity scheduled to unlock gradually over several years. Each unlock adds supply, and unless demand rises to match, it weighs on the price. This creates HYPE’s central tension: the buyback removes tokens while unlocks add them. If trading volume keeps the buyback strong enough to absorb the unlocks, the price can rise; if volume falters and unlocks outpace buybacks, per-token gains are constrained even if the platform grows.
What are analysts predicting for HYPE in 2026?
Forecasts span a very wide range, reflecting genuine uncertainty. Cautious projections see HYPE averaging in the high $30s to high $50s, essentially holding near current levels. Middle estimates expect a return toward or past its all-time high if adoption continues. The most bullish forecasts float targets as high as $150 if the buyback, volume growth, and new markets all fire together. Prediction markets in mid-2026 leaned toward HYPE clearing $80, with under half betting on $100.
What should I watch to judge where HYPE is heading?
Track the variables that actually decide the outcome instead of any single price target. The most important is Hyperliquid’s trading volume and fee revenue, which power the buyback. Then watch the pace of token unlocks against the pace of buybacks, inflows into the new HYPE exchange-traded products, the platform’s expansion into new markets and products, and any regulatory developments affecting perpetual-trading venues. Those metrics will tell you in real time whether the buyback is outrunning supply and whether the path toward $100 is opening or closing.
This article is information, not investment advice. Price scenarios are uncertain framings, not predictions, and cryptocurrency is highly volatile. Figures for Hyperliquid and HYPE reflect reporting available as of June 25, 2026, and can change quickly. Do your own research and verify current data from primary sources before making any decision.
Adventure Park volunteer who allegedly exposed himself to young girls said it was ‘unfortunate accident’

Palestinians decry Israeli push for control over ancient West Bank sites

CoinEx denies claims it served as $3.84 billion gateway to sanctioned Iranian crypto firms


-

 Fashion6 days ago
Weekend Open Thread: Miami – Corporette.com
-

 Entertainment5 days ago
Renter of Home in Anne Heche Crash Denies Settlement With Son
-
 Sports2 days ago
Two goals and an assist by sheer aura: Cristiano Ronaldo just entered the World Cup chat
-

 Tech3 days ago
Microsoft accidentally kills epic Outlook email threads
-

 Business5 days ago
Soccer-U.S. defends Iran World Cup travel restrictions, says discussions ongoing
-

 Politics5 days ago
Andy Burnham and the meaning of Makerfield
-
Crypto World1 day ago
Bitcoin (BTC) Dips Below $62K, Ethereum (ETH) Plunges 6% Daily: Market Watch
-

 Politics7 days ago
BBC Reporter Discusses Cross Party Criticism Of Trumps Iran Deal
-
Business1 day ago
Entergy settles forward sale agreements, raises $672 million in cash proceeds
-

 Crypto World1 day ago
Securitize Wraps Roubini's SEC-Registered ETF as Dubai VARA Digital Security
-

 NewsBeat6 days ago
Keir Starmer Allies Question His Chances For No 10
-
 Business5 days ago
Wall Street Week Ahead: Investors see Micron earnings as pulse check of AI rally momentum
-

 Tech7 days ago
AWS enters the context layer race with a graph that learns from agents, not manual curation
-
 Crypto World5 days ago
Can Charles Hoskinson Really Rescue Cardano?
-

 Crypto World5 days ago
HIVE shares jump as $220M AI deal speeds Bitcoin mining pivot
-

 Crypto World5 days ago
Jake Chervinsky accuses CME of protecting derivatives monopoly
-

 Entertainment5 days ago
Jose Alvarado Wants Taylor Swift at More Knicks Games
-
 Tech4 days ago
Signal’s Meredith Whittaker says AI chatbots ‘are not your friends’ and calls Copilot agents a backdoor
-

 Tech3 days ago
Nearly 7,000 fake Amazon domains registered ahead of Prime Day 2026, researchers warn
-

 Sports6 days ago
FIFA World Cup 2026: Canada beat 9-men Qatar 6-0 to register first ever win | FIFA World Cup 2026
You must be logged in to post a comment Login