

Crypto World
EBA Outlines Landmark EU Crypto Fines as New Rules Take Effect

The European Banking Authority (EBA) has published a consultation paper outlining how it plans to calculate fines for crypto asset issuers that breach the EU’s Markets in Crypto-Assets (MiCA) framework. The proposal—released June 26—signals that regulators intend to move from rulemaking to consistent, standardized enforcement for “significant” token issuers.
Under the draft methodology, the EBA would apply a structured two-step process: it would first establish a baseline severity for an infringement and then adjust the result based on aggravating or mitigating factors. The framework is designed to cover significant asset-referenced tokens (ARTs) and significant e-money tokens (EMTs), with penalty caps intended to be large enough to deter major market players.
Key takeaways
- The EBA’s June 26 consultation sets out a standardized method for determining MiCA-related fines for issuers of “significant” ARTs and EMTs.
- Fines could reach statutory ceilings of up to 12.5% of annual turnover for significant ART issuers and up to 10% for significant EMT issuers, or up to two times the profits from the violation.
- The EBA’s enforcement “teeth” arrive as MiCA licensing requirements take effect on July 1, ending a transitional period for many firms.
- Crypto firms that miss licensing deadlines face operational constraints—and potentially the very types of conduct targeted by the EBA’s fine methodology.
- Executives have a consultation window until September 28 to comment on the EBA’s approach, but the July 1 compliance deadline leaves little time for adjustments in practice.
A penalty playbook for MiCA breaches
MiCA is the EU’s landmark digital asset regulation, built to bring order to the market by requiring token issuers and crypto service providers to meet bank-like compliance expectations—covering issues such as consumer protections and capital reserves—to access the bloc’s single market.
In its consultation paper, the EBA focuses on enforcement for significant tokens as defined under MiCA. The document proposes a consistent approach to fines rather than leaving penalty levels to ad hoc determinations. According to the EBA, the methodology begins by evaluating the baseline seriousness of an infraction and then accounts for behavior-specific circumstances, such as factors that would increase or reduce culpability.
The proposed ceilings are explicitly framed as punitive. The consultation states that final penalties could be set up to statutory maximums of 12.5% of annual turnover for issuers of significant ARTs and 10% for issuers of significant EMTs. The paper also references a cap of two times the profits generated by the violation, a design intended to prevent companies from treating enforcement risk as a cost of doing business.
EBA’s consultation paper (June 26) lays out the framework in more detail, including the procedural steps the authority would use when calculating penalties.
MiCA licensing deadline turns the calendar into a compliance cliff
The fine methodology arrives at a moment when the industry is already facing a hard operational deadline. By July 1, crypto companies must have obtained formal licenses from national regulators to legally offer services across the EU and to market stablecoins within the 27-nation bloc. The deadline ends the transitional period that allowed some operators to continue functioning under less stringent local rules.
The EBA’s penalty methodology is therefore more than a theoretical enforcement blueprint. Companies that fail to secure regulatory authorization by July 1 could be forced to halt or narrow certain activities. The timing also raises the risk of triggering conduct that falls under the types of non-compliance the EBA’s framework is meant to penalize.
Earlier coverage from Cointelegraph also highlighted that the July 1 deadline would constrain firms unable to complete MiCA authorization processes in time. In practical terms, that means executives and compliance teams may be operating under uncertainty while regulatory paperwork catches up—right as the EBA is preparing to standardize what happens when rules are broken.
Binance’s EU restrictions underscore the operational impact
One of the clearest real-world signals comes from Binance. According to Cointelegraph, the exchange notified European Union users that it would restrict access to some services after it failed to secure MiCA authorization from a member state ahead of the July 1 deadline. The reported reason was that Binance withdrew its MiCA license application in Greece.
As users shared notices on social media, Binance indicated that it would stop onboarding new EU users and limit certain services for EU-based accounts effective July 1. The notices also stated that withdrawals would remain available after that date, aligning with regulatory expectations that customers should be able to exit their positions even when trading or onboarding restrictions apply.
The timing matters for market participants because it suggests a likely pattern: without authorization, major venues may shift from growth mode to risk containment. For users, that translates into fewer options for new entry, while for institutions and market makers it can affect liquidity planning and compliance coverage across jurisdictions.
Cointelegraph reported that Binance saw substantial daily net outflows around the announcement, citing DefiLlama data. The exchange’s subsequent outflow figures over the following two days were also reported by Cointelegraph, reflecting how quickly liquidity can move when regulatory access changes.
EU enforcement in focus as the US relies more on action-by-action
Beyond the specific penalty mechanism, the EBA consultation highlights a broader enforcement posture. By publishing a clear fining methodology just as MiCA licensing takes effect, EU authorities appear to be emphasizing predictability and deterrence—leaving less room for interpretation that enforcement might be gradual or forgiving.
This contrasts with a more enforcement-driven approach often associated with the United States, where regulatory outcomes can depend heavily on case-by-case actions. In the EU’s model, the framework aims to define the penalty logic upfront, providing firms with a clearer sense of the regulatory “cost of non-compliance” if they operate without the required authorizations or breach MiCA obligations.
The EBA also set a consultation period that runs until September 28, giving industry participants time to lobby for changes to the fine methodology. Still, the practical reality is that companies must operate compliantly well before the EBA’s final guideline is locked in—meaning the July 1 deadline will test compliance systems first, and only then will firms try to influence the methodology through formal feedback.
As the consultation deadline approaches, market participants should watch whether national regulators align quickly on implementation details and how quickly firms adapt their compliance programs ahead of and after July 1—because the EBA’s penalty framework will likely shape boardroom decisions long before any final rules are formally adopted.


According to this week’s report from crypto market tracker CryptoRank, DeFi platforms suffered 121 hacks so far this year, resulting in approximately $942 million in losses.
The second quarter accounted for 85 incidents and about $775 million stolen, placing it as the most active period ever for exploits in the crypto sector.
The surge in attacks is against a backdrop of a crypto market struggle, pervaded by weakening investor confidence. Total value locked (TVL) in DeFi protocols has fallen every month this year, dropping from about $115 billion in January to $70 billion in late June.
Drift Protocol, KelpDAO Exploits Hiked Q2 Losses
Per CryptoRank’s data, Q2 2026’s 85 incidents are 49 more than the period with the second-highest frequency of exploits, which happens to be Q1 2026. However, total dollar-denominated losses were not as high as previous peaks, with the data provider reporting that two back-to-back attacks in April accounted for the majority of losses recorded in the quarter.
Drift Protocol and KelpDAO lost a combined $590 million, which is more than half of all the DeFi losses recorded in 2026. Drift Protocol disclosed that attackers had stolen about $285 million in user assets, with blockchain intelligence firm TRM Labs’s investigations linking the operation to hacking outfits connected with North Korea.
According to TRM, preparations for the attack started on-chain as early as March 11 with a 10 ETH withdrawal from Tornado Cash. The crypto tumbler transaction came after months of in-person meetings between the Pyongyang proxies and Drift employees.
“The attacker used social engineering to induce Drift Security Council multisig signers into pre-signing transactions that appeared routine but carried hidden authorizations for critical admin actions,” the firm wrote in a report published April 30.
Just over two weeks later, North Korea’s Lazarus Group exploited the liquid restaking protocol KelpDAO’s LayerZero bridge infrastructure and stole roughly $290 million worth of rsETH.
Chainalysis mentioned at the time that the attackers forged a cross-chain message on April 18 after compromising two remote procedure call nodes used by LayerZero’s Decentralized Verifier Network. At the same time, the criminals struck a third node with a distributed denial-of-service attack, making the system use compromised verifiers.
The verification process was rigged to allow for the creation of rsETH tokens on Ethereum without burning the corresponding assets on Unichain. Within days of the attack, lending protocol Aave’s TVL dropped from $26.4 billion to $14.3 billion, clocking $12 billion in withdrawn funds and a decline of about 46%.
Hacks Were One Problem; a Shrinking Market Was Another
Aave’s TVL dip wasn’t unique, with CryptoRank’s data showing the value locked in all of DeFi falling every single month in 2026, going from $115.3 billion in January to just over $70 billion in June. And while hacks were not the main reason for the decline, the firm noted that the frequency of incidents likely made users less confident, leading to a wider rotation away from the sector.
But the drop hasn’t been as bad as the one in the 2021-2022 cycle when the DeFi TVL tanked more than 70% in seven months. The current dip has been much slower, and the market has also been different structurally, CryptoQuant says, with the stablecoin supply growing to about $300 billion, real-world asset tokenization expanding, and capital dispersed across more sectors like derivatives, infrastructure, and lending, instead of being concentrated in a handful of AMMs and yield farms.
However, among the largest ecosystems by TVL, only Tron and Hyperliquid have managed to grow this year, with the former gaining 5% and the latter adding nearly 7% as it became the dominant venue for on-chain perpetuals. The rest of the top 10 chains are deeply in the red, with the worst hit being Plasma and Arbitrum, which have so far seen their TVL plunge by 74.6% and 55%, respectively.
The post Report: Q2 2026 Becomes Worst Quarter Ever for Crypto Hacks appeared first on CryptoPotato.

TLDR:
- Pi2Day 2026 expands Pi Network with AI development tools and new ecosystem participation features.
- Pi Launchpad introduced the SLICE Testnet token to improve launch testing before Mainnet releases.
- The Vibe Coder Campaign encourages AI developers to build and distribute applications through Pi App Studio.
- Pi Network says more than 60 million engaged Pioneers continue supporting ecosystem growth initiatives.
Pi Network has marked Pi2Day 2026 with new ecosystem initiatives focused on AI applications, developer participation, and product testing. The updates expand existing tools while encouraging broader community involvement before the latest campaign concludes.
Pi Network is also promoting new opportunities for builders and users to contribute to ecosystem growth. The latest releases continue the project’s focus on utility, application development, and platform engagement.
Pi Network Expands Pi2Day 2026 With AI Apps and Pi Launchpad
Ahead of Pi2Day, Pi Network encouraged Pioneers to participate in two ecosystem initiatives before June 28. According to the Pi Core Team, the programs focus on expanding application utilities and collecting community feedback.
One initiative centers on the Vibe Coder Campaign. The campaign invites community members to introduce AI developers to Pi App Studio and its distribution network for applications built with artificial intelligence.
According to Pi Network’s official blog, participants can share information about Pi App Studio across online developer communities. Eligible participants may also enter a raffle for Pi merchandise after submitting qualifying posts through the Pi mining application.
Pi Community highlighted Pi2Day by pointing to several ecosystem additions. The community account referenced Pi App Studio, Pi Launchpad, built-in payments, digital identity, and more than 60 million engaged Pioneers participating across the network.
Pi Launchpad Introduces SLICE Testnet Token Before Pi2Day
Pi Network also expanded testing through the second Pi Launchpad Testnet token, known as SLICE. The official blog said the release follows lessons learned from the platform’s first Testnet launch.
The project stated that SLICE exists only on Testnet and will not move to Mainnet. The token allows users to experience the Launchpad process while providing practical feedback on participation mechanics.
According to Pi Network, participants can access the Launchpad through the Pi Browser. Users review the issuing project, commit Test-Pi, and interact with the connected Slice of Pi application during the testing period.
The updated Launchpad flow also introduces a fair-access hold mechanism alongside participation commitments.
Pi Network said community engagement and feedback will help refine the product before future Mainnet token launches while strengthening ecosystem development around new applications.

MicroStrategy’s $64 billion Bitcoin (BTC) bet has become a stress test for everyone who funded it. BTC now trades below $60,000, and the renamed company, Strategy, sits at a discount to its own holdings.
The question dividing investors is no longer whether Strategy gets liquidated tomorrow. It is who absorbs the losses while the company keeps its coins and keeps paying to hold them.
How the Bitcoin Flywheel was Built
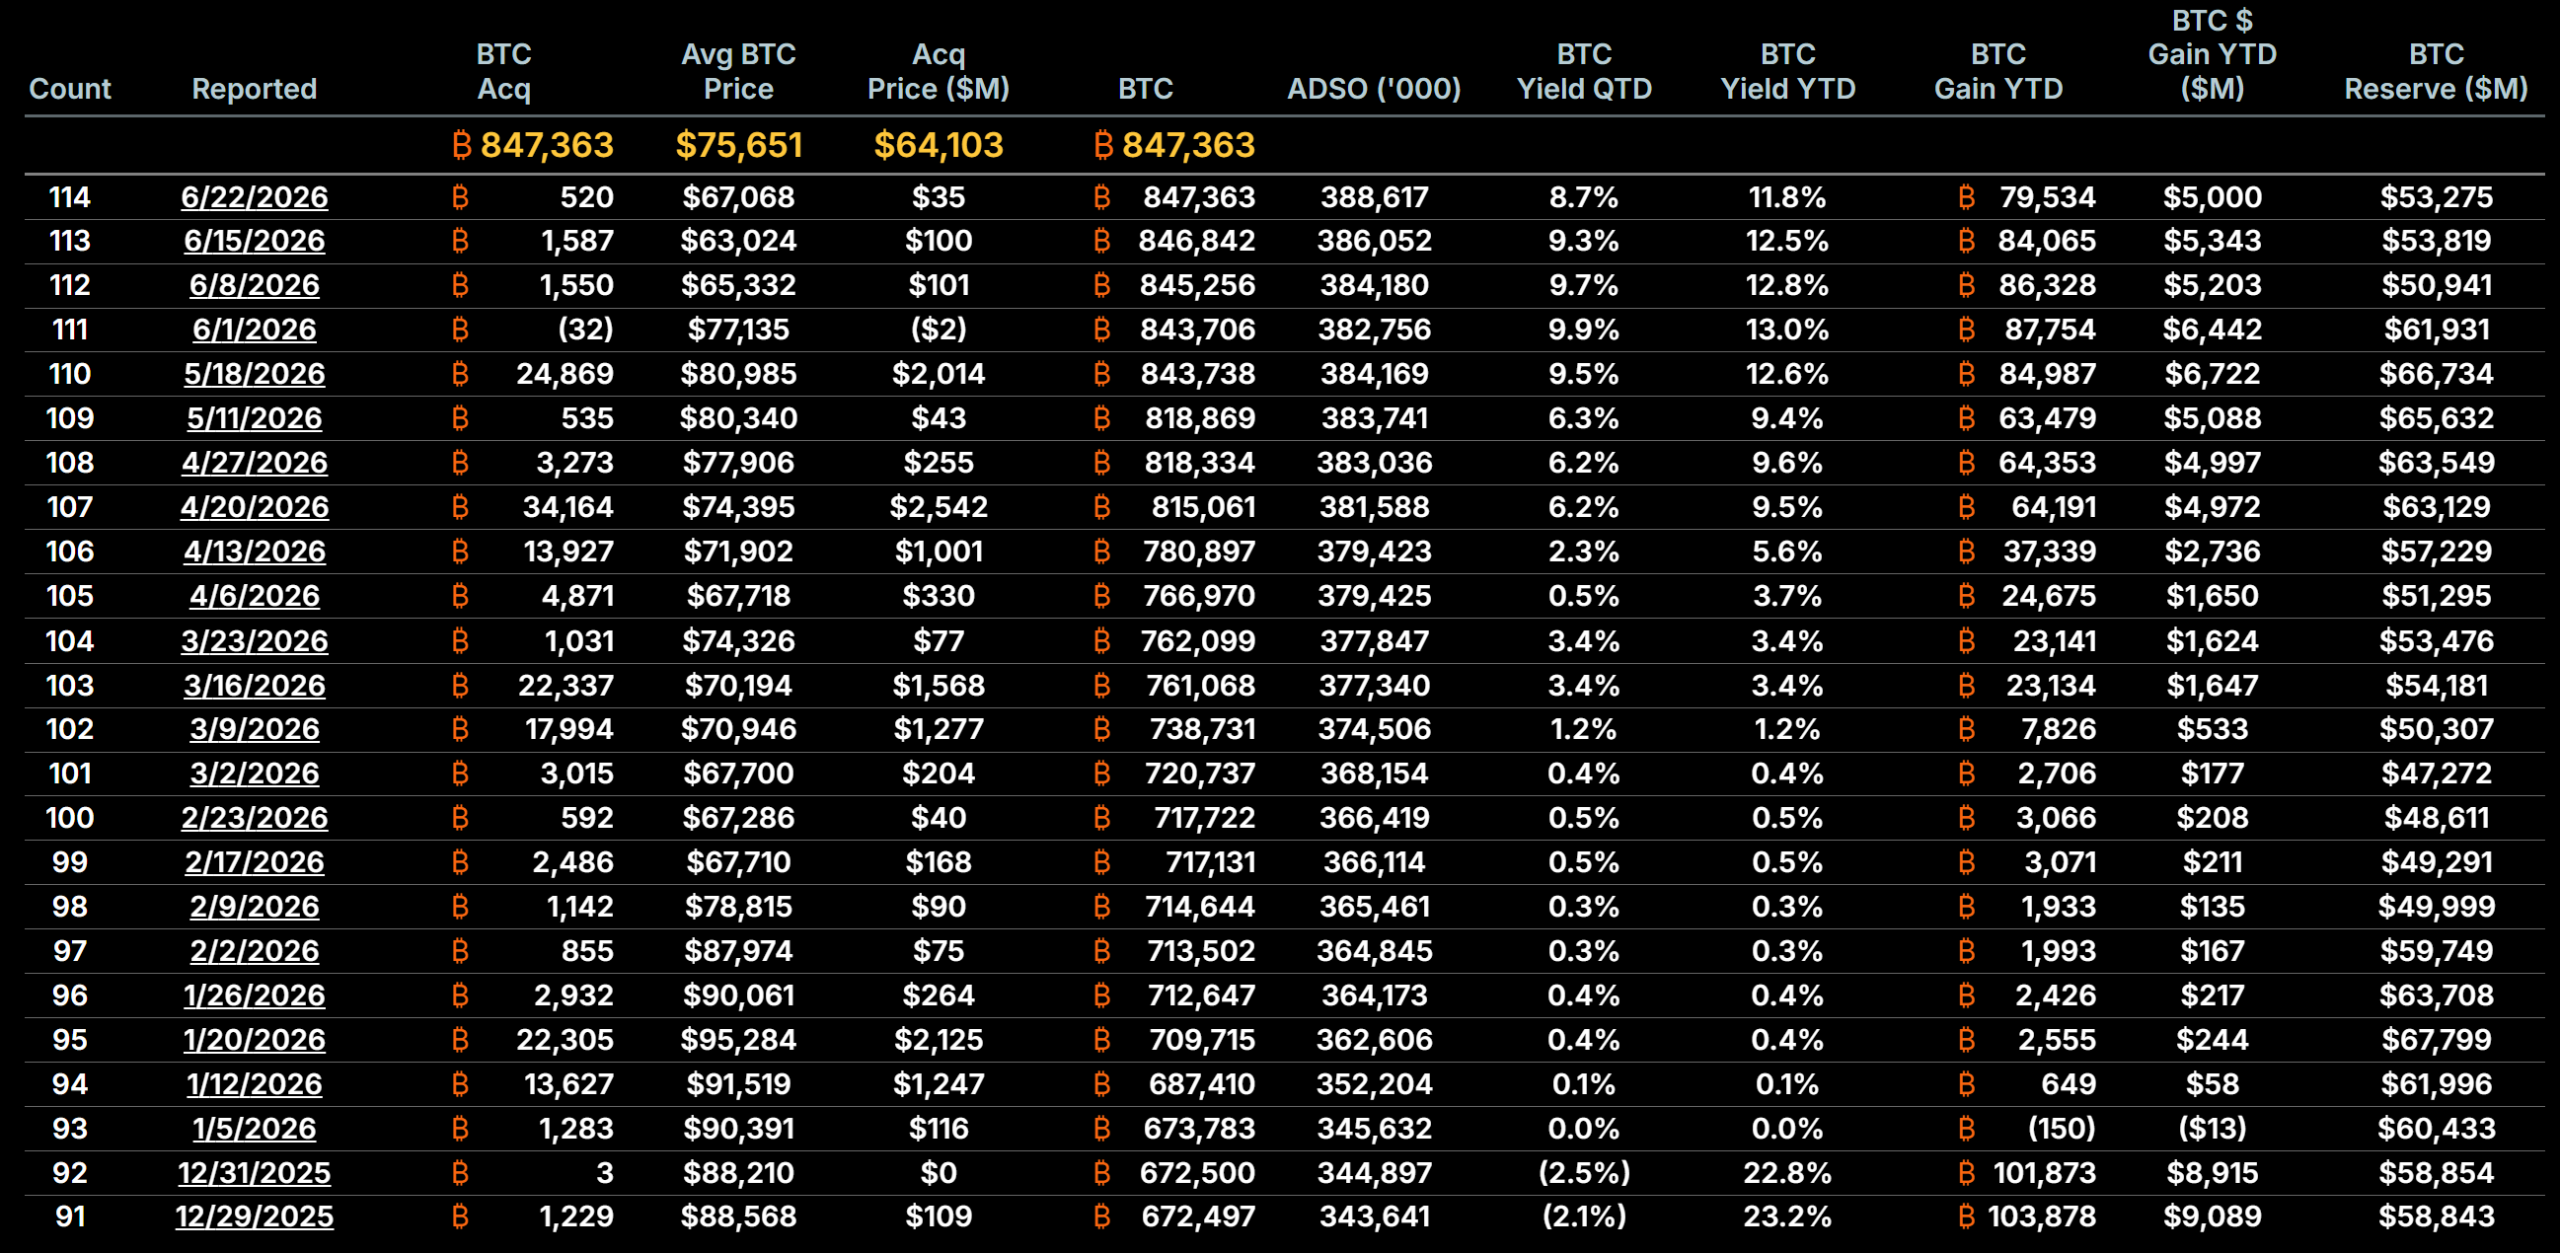
By June 22, Strategy held 847,363 BTC bought for $64.1 billion, an average of $75,651 each. That is the largest corporate Bitcoin position anywhere.

The model runs like a flywheel. The company sells stock and debt, buys more Bitcoin, and its shares climb when BTC rises. However, falling prices spin the machine in reverse.
BTC has fallen below $60,000 this week, its lowest level since 2024. The stock has slid with it, dropping under the value of the Bitcoin on its books.
A new accounting standard made the pain visible. Since 2025, FASB rule ASU 2023-08 forces firms to mark Bitcoin to fair value each quarter. As a result, Strategy booked a $14.46 billion unrealized loss in early 2026. That produced a $12.54 billion net loss, or $38.25 for every diluted share.
Follow us on X to get the latest news as it happens
Who Actually Pays for MicroStrategy’s Bitcoin Bet
The bill does not fall on Strategy alone. As the flywheel slows, the cost spreads to five groups, in rough order of exposure.
- Common shareholders
They stand first in line. When the stock trades below the value of its Bitcoin, the company still raises cash by selling new shares. Each sale buys less Bitcoin than it hands away.
“If we decide to sell $1 billion of MSTR stock and buy $1 billion of Bitcoin… when you do it at 1.0x MNAV… it is dilutive. It is a minus 48 basis point yield. It costs the shareholders $310 million,” Michael Saylor, Executive Chairman, Strategy, said during Q1 2026 earnings call.
Existing owners are left holding a smaller claim on the same coins, and that dilution is how the strategy gets funded.
- Investors in other treasury companies
The copycats have fared worse than the original. Their shares once traded far above the Bitcoin they held, lifted by hype.
As that premium faded, many Bitcoin treasury company stocks fell much harder than Bitcoin itself, leaving late buyers deep underwater.
“If that’s not already a bubble burst, how would that bubble burst?” Tom Lee, Chairman of BitMine, said while many treasury stocks traded below net asset value.
- Passive and index fund investors
This group never chose the bet. MSCI has proposed removing companies whose digital assets exceed half their total assets from its global indexes.
“Feedback from the consultation confirmed institutional investor concern that some DATCOs exhibit characteristics similar to investment funds, which are not eligible for inclusion in the MSCI Indexes,” MSCI said in its official announcement earlier this year.
Strategy clears that bar with ease. An exclusion would force index funds and pension trusts to sell automatically, whatever the price, just to keep tracking the benchmark.
- Convertible bondholders and preferred shareholders
These investors lent on the assumption that MicroStrategy could always refinance. If Bitcoin stays depressed into 2027, that assumption breaks.
“Proceeds from the bitcoin sales are expected to be used to fund distributions on preferred stock,” Strategy indicated in the June 1 Form 8-K.
Bondholders can demand cash, and preferred holders still expect dividends, both drawing on a reserve of just $1.4 billion.
- MicroStrategy itself
The company is the backstop of last resort. On its first quarter 2026 earnings call, Michael Saylor again framed Strategy as a net buyer that never sells.
“We will probably sell some Bitcoin to fund a dividend just to inoculate the market, just to send the message that we did it.”
Yet if financing freezes while debt and dividends come due, keeping that vow could become impossible.
“We will sell Bitcoin when it is advantageous to the company. We are not going to sit back and just say we will never sell the Bitcoin,” Strategy co-CEO Phong Le added.
The Real Test Arrives in 2027
MicroStrategy faces no margin call today. Its main debt is unsecured, so a falling price alone cannot trigger a forced sale. The threat is a date, not a level.
Holders of a $1.01 billion convertible note can demand repayment on September 15, 2027. If the shares sit below the conversion price, that claim becomes a cash bill the company must cover.
Strategy has neared this edge before. A 2022 Silvergate loan backed by Bitcoin carried a margin call near $21,000 before the firm repaid it. Moving to unsecured notes and preferred stock removed the automatic trigger, but not the obligation.
Some peers have already blinked. This month one Nasdaq company sold Bitcoin to repay debt, and its shares jumped. Analysts have also questioned Strategy’s exit liquidity if it is ever forced to sell at scale.
For now, no forced sale looms. The pressure has simply moved from a price trigger to a calendar. The number that matters is no longer $60,000, but the September 2027 repayment date.
The post Who Actually Pays When MicroStrategy’s $64 Billion Bitcoin Bet Goes Wrong? appeared first on BeInCrypto.
TLDR:
- Hyper Foundation committed about $10 million to support USDH migration across affected ecosystem projects.
- Eligible builders must complete migration or orderly shutdown activities before the end of July deadline.
- USDH holders can swap tokens for USDC through supported HyperCore and HyperEVM migration pathways.
- Grant allocations depend on deployment costs or affected USDH total value locked across supported protocols.
Hyper Foundation has introduced a grant program worth approximately $10 million to support projects affected by the USDH sunset. The initiative targets builders migrating away from the stablecoin or winding down USDH-dependent services before the end of July.
Eligible teams have already been contacted as the network moves through an organized transition process. The funding aims to reduce migration costs while helping maintain continuity across the Hyper ecosystem.
Hyper Foundation Unveils $10M USDH Migration Grant Program
Hyper Foundation said the grants will support builders whose products relied on USDH before its retirement. According to the foundation, eligible recipients include HIP-1 spot deployers, HIP-3 perpetual deployers, HyperEVM protocols, dedicated USDH: USDC bridge operators, and Native Markets.
The grants fall into two categories. Migration grants support teams replacing USDH with USDC, while wind-down grants assist projects ending USDH-related operations. The foundation noted that wind-down grants remain smaller than equivalent migration awards.
According to Hyper Foundation, every recipient has committed to completing migration or orderly shutdown activities before the end of July. The program seeks to minimize disruption while encouraging structured transitions across supported applications.
Grant calculations also differ between ecosystem participants. HIP-1 and HIP-3 recipients receive allocations based on auction deployment costs, while HyperEVM protocol grants depend on the amount of USDH total value locked affected by the sunset.
USDH Holders Receive Migration Options as Ecosystem Shifts to USDC
Hyper Foundation also outlined the migration process for users holding USDH. The organization encouraged users to follow instructions directly from the protocols where their assets remain deployed.
Users can exchange USDH for USDC through the HyperCore spot order book. The foundation also confirmed that HyperEVM users can swap USDH for USDC at a one-to-one ratio through Across without paying transaction fees.
Wu Blockchain highlighted the announcement shortly after the grant program became public. The report noted that the funding package covers both migration expenses and wind-down costs for affected ecosystem participants.
Hyper Foundation also acknowledged the contribution of builders, users, and Native Markets throughout the USDH rollout. The organization credited community participation and direct coordination with helping the migration process progress smoothly during the transition period.

Bitcoin is set up for a tense July after June delivered the token’s weakest monthly performance since mid-2022. BTC is down roughly 18.5% for the month and has struggled to defend the $60,000 psychological level.
Analysts are split between two forces: downside pressure tied to Bitcoin’s technical weakness, and a potential “liquidity magnet” effect that has historically coincided with sharper rebounds. Traders watching July closely will likely focus on whether BTC can reclaim key long-term indicators before any mean-reversion bounce plays out.
Key takeaways
- June’s drawdown puts pressure on Bitcoin’s ability to hold support near $60,000, with further weakness possible if longer-term trend levels fail.
- Liquidation data referenced by analyst Fleh points to a large short-liquidation concentration near $67,600, which could act as a magnet on a rebound.
- CoinGlass data cited in the coverage suggests Bitcoin has historically posted an average gain of about 7.6% in July, after a weak June.
- Seasonality in midterm-election years has been stronger for BTC, with an average July return of roughly 10.3% in those years.
- Another technical risk factor is Bitcoin trading below its 200-week simple moving average region near $62,445, a condition that preceded deeper weakness in 2022.
Liquidity heatmap points to a potential “magnet zone”
One of the more constructive arguments for July comes from liquidation positioning. In a post shared by analyst Fleh, the trader highlighted Binance BTC/USDT liquidation heatmap levels indicating heavy short-liquidation liquidity above current price.
The largest cluster referenced sits around $67,645. The charting data shown in the report cites approximately $247.39 million in liquidation leverage and roughly $2.26 billion in cumulative short liquidation leverage in that area, according to CoinGlass heatmap figures.
In markets, large concentration zones like this are sometimes described as “magnet zones.” The logic is straightforward: if price rises toward areas where leveraged short positions are concentrated, those shorts can be forced to exit through liquidation. Closing shorts generally requires buying Bitcoin back, which can amplify upward momentum and increase the odds of a sharper move than spot flows alone would suggest.
Fleh’s outlook, as quoted in the original coverage, is that BTC may bottom near $60,000 “for now,” targeting a rally toward $75,000 before any further downside risk materializes.
Seasonality and historical July performance
Beyond liquidation dynamics, the bullish case is also supported by historical calendar behavior—though this is not a guarantee. According to CoinGlass data highlighted by analyst CGT_Trader, Bitcoin has delivered an average gain of about 7.6% in July. The same dataset shows June has been weaker on average, with an average June return around -1.40%.
The key practical takeaway for traders is that July has often started with a rebound after a soft June. The report notes that even in bear-market years, July has still produced positive performance—for example, BTC gained 20.96% in July 2018 and 16.8% in July 2022.
More recent examples cited include a 2.95% rise in July 2024 and an 8.13% gain in July 2025, which the authors frame as further evidence that the seasonal pattern can persist through different regimes.
A separate midterm-election-year seasonality view referenced in the coverage shows Bitcoin averaging a 10.3% gain in July during those years—its strongest monthly return in that subset. That statistic contrasts with an average June loss of about 17% in midterm-election years, strengthening the “post-sell-off bounce” narrative.
Using the report’s current-price assumption near $60,000, a 7.6% average July gain implies a move toward roughly $64,500. The stronger 10.3% midterm-year average suggests a potential stretch toward about $66,100. If Bitcoin repeats the more dramatic bear-market rebounds seen in 2022 and 2018, the upside range suggested in the coverage lands between $70,000 and $72,500. A more aggressive “2020-style” July rally would be consistent with Fleh’s $75,000 target.
Technical pressure: risk grows if BTC can’t reclaim long-term support
While the upside thesis leans on liquidity and seasonal mean reversion, the downside case remains anchored in Bitcoin’s longer-term technical picture. The original analysis notes that BTC is still trading below its 200-week simple moving average, with that long-term reference around $62,445.
That matters because losing long-term moving-average support often increases the odds that rallies fail and price remains heavy until a deeper correction runs its course. The report draws a parallel to 2022: it states that a similar loss of long-term moving-average support preceded additional weakness before Bitcoin eventually formed a bottom.
In the coverage, this backdrop is described as a “bear flag breakdown,” with the expectation that unless BTC quickly reclaims the 200-day SMA area, downside risk in July could extend toward $55,000. The same article links to earlier coverage about capitulation risk near $50,000, underscoring that the technical narrative for this cycle has included concerns about sustained liquidation-driven selling pressure.
For investors, the practical distinction is timing. A liquidity-magnet rebound near $67,600 would require BTC to first stabilize around the $60,000 region and begin reclaiming higher levels. If instead price continues to slip below the long-term moving-average zones highlighted in the analysis, the short-term liquidation “magnet” argument could be delayed or invalidated by renewed downside momentum.
What to watch next in July
Heading into the month, the most important signals are whether BTC can hold near $60,000 and whether it reclaims the long-term moving-average region cited near $62,445. If it does, the $67,600 liquidity cluster could become a focal point for short-liquidation-driven buying; if it doesn’t, the reported $55,000 risk scenario may gain credibility and further weaken the odds of a quick mean-reversion bounce.
TLDR:
- Bitcoin approaches a rare weekly death cross as traders monitor long-term market direction closely.
- Strategy’s mNAV has dropped below 1.0 for the first time during this market cycle.
- Michael Saylor hinted at more Bitcoin discussions despite growing valuation concerns.
- Technical signals and institutional buying remain key factors shaping Bitcoin sentiment.
Bitcoin could soon print a rare weekly death cross as bearish technical signals return to the market. At the same time, Michael Saylor has hinted that Strategy may continue accumulating Bitcoin despite growing pressure on its valuation.
The two developments have reignited discussion around Bitcoin’s price outlook and institutional demand. Investors are now watching technical charts alongside corporate buying activity for the next major market signal.
Bitcoin Weekly Death Cross Raises Fresh BTC Price Concerns
Crypto Rover shared that Bitcoin is approaching a weekly death cross, a technical pattern that appears when the long-term moving average falls below the shorter trend. The account noted that the previous weekly death cross preceded another 28% decline in Bitcoin’s price.
The same post highlighted Bitcoin’s historical four-year market cycle. According to Crypto Rover, another extended correction could align with the later stages of the current cycle if previous patterns repeat.
The signal has attracted attention because weekly chart formations appear far less often than daily indicators. Traders typically monitor them for broader market direction rather than short-term volatility.
Despite the technical setup, the pattern alone does not determine future price action. Market participants continue weighing macroeconomic conditions, liquidity, and institutional demand alongside historical chart behavior.
Michael Saylor Hints at More Bitcoin Buying Despite Strategy Valuation Pressure
While bearish technical signals circulated, Michael Saylor posted that more charts would be needed, a familiar response that often precedes fresh Bitcoin discussions. His comment followed renewed debate surrounding Strategy’s ability to continue funding Bitcoin purchases.
Wise Advice pointed to Strategy’s market value relative to its Bitcoin holdings. The account noted that the company’s modified net asset value, or mNAV, has fallen below 1.0 for the first time during the current market cycle.
According to the same discussion, Strategy previously suggested that issuing new equity below roughly 1.22 times mNAV could reduce shareholder value. That threshold has prompted questions about whether additional equity-funded Bitcoin purchases remain practical under current market conditions.
Even so, Saylor’s brief response has kept attention on Strategy’s long-standing Bitcoin accumulation strategy.
Investors now await any official filings or announcements that could clarify whether another Bitcoin purchase is approaching while the company navigates changing market dynamics.
Crypto World
Ethereum Price Analysis: The Crucial Daily RSI Divergence That Could Save ETH From New Lows
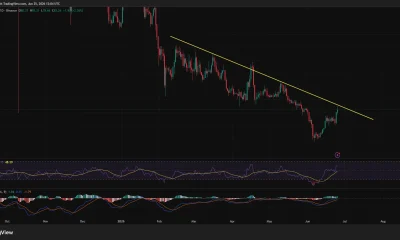
Ethereum remains under pressure across higher timeframes, but the latest price action is showing early signs that bearish momentum may be losing strength. While the broader trend remains decisively bearish, the recent movements suggest that sellers may be approaching exhaustion after weeks of sustained downside.
Ethereum Price Analysis: The Daily Chart
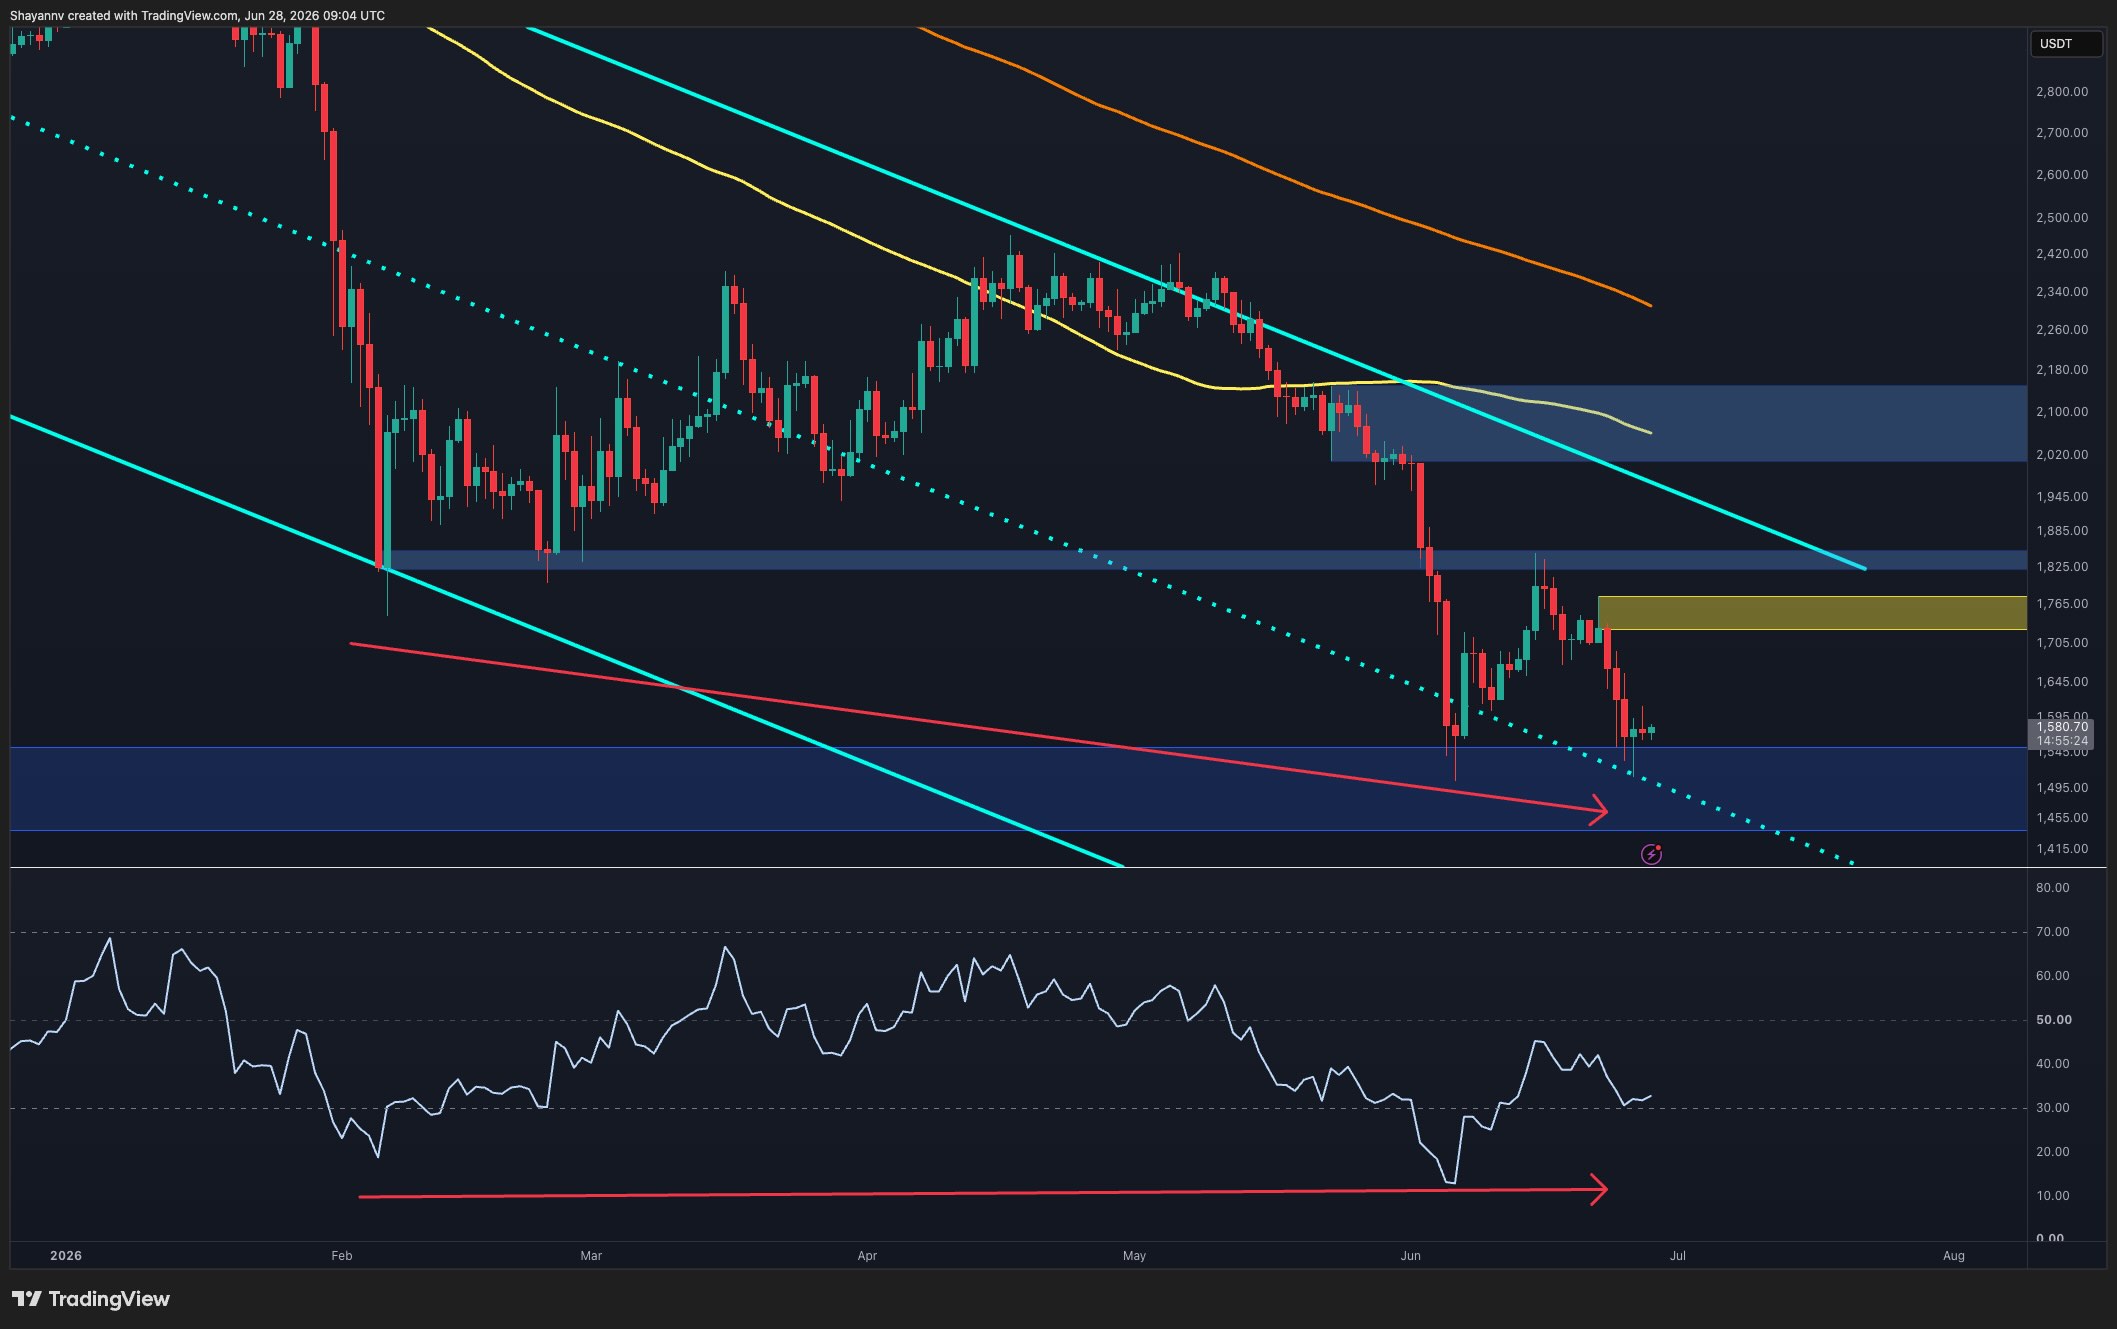
ETH’s recent rejection from the $1.72K-$1.78K supply zone triggered another leg lower, pushing it back into the critical $1.46K-$1.53K demand region. This zone has acted as support multiple times throughout June and continues to attract buyers whenever the price approaches it.
The most notable development on the daily timeframe is the emerging bullish divergence on the RSI. While the asset has continued making lower lows during June, the RSI has been forming higher lows near oversold territory. This divergence suggests that downside momentum is weakening despite ETH remaining near cycle lows.
Although a bullish divergence alone does not guarantee a reversal, it often appears during the latter stages of bearish trends and can serve as an early warning that sellers are losing control. As long as ETH holds above the $1.46K-$1.53K support area, the divergence remains valid, increasing the probability of a relief rally.
However, confirmation would require a break above the nearest resistance zones, particularly the $1.72K-$1.78K supply area. Until then, the broader trend remains bearish despite the improving momentum profile.
ETH/USDT 4-Hour Chart
On the 4-hour timeframe, Ethereum has spent the past several sessions consolidating above the lower demand zone after the sharp sell-off from resistance.
A descending trendline has capped every recovery attempt since the June 22 rejection. However, the asset is now compressing directly beneath that trendline, while volatility continues to contract. This setup creates the possibility of a short-term breakout if buyers can push through trendline resistance.
A successful breakout would likely target the $1.72K-$1.78K supply zone, which served as the origin of the latest decline. Such a move would align well with the bullish RSI divergence visible on the daily chart and could provide the first meaningful recovery rally in several weeks.
On the downside, the $1.52K area remains the key level to monitor. Losing this support would invalidate the short-term bullish scenario and shift focus back toward deeper downside continuation within the broader downtrend.
For now, Ethereum appears trapped between support and descending resistance, with the next directional move likely determined by whichever side breaks first.

Sentiment Analysis
The liquidation heatmap reveals an interesting shift in liquidity positioning.
While liquidity remains concentrated above the current price, particularly between roughly $1.68K and $1.80K, Ethereum is currently trading beneath these large clusters. Markets often gravitate toward areas with substantial leveraged positioning, making those overhead liquidity pools attractive short-term targets.
This creates a scenario where ETH could stage an upside liquidity sweep before any larger directional move develops. A breakout above the 4-hour descending trendline would increase the probability of price moving into these overhead liquidity pockets, triggering short liquidations and fueling a squeeze toward the $1.7K-$1.8K region.
At the same time, the heatmap also shows notable liquidity beneath the market around the lower support region, meaning both sides of the range remain vulnerable to liquidation-driven volatility.
Combined with the bullish daily RSI divergence and the compression beneath 4-hour trendline resistance, the current setup suggests Ethereum may first attempt an upside liquidity grab before the market determines whether a more sustainable recovery can develop. The reaction around the $1.72K-$1.80K liquidity cluster will likely provide important clues regarding Ethereum’s next major trend.

The post Ethereum Price Analysis: The Crucial Daily RSI Divergence That Could Save ETH From New Lows appeared first on CryptoPotato.
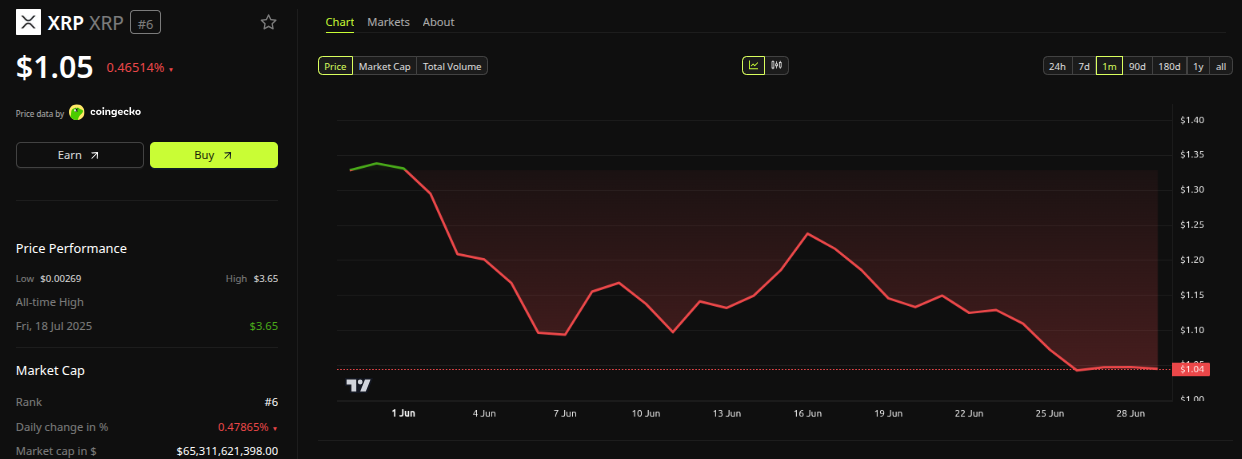
The world’s highest IQ record holder just declared that the XRP Supercycle is only beginning, while three bullish signals hit the chart at the same time. The token trades near $1.05 as the narrative quickly gains momentum.
The combination of high-profile sentiment and technical alignment is reshaping how traders frame the next XRP cycle.

Why the Highest IQ Holder Sees an XRP Supercycle Starting
A supercycle is a multi-year market phase in which an asset moves through extended upside expansion rather than a typical shorter rally. The XRP narrative just got a major sentiment boost from YoungHoon Kim, holder of the verified world record for the highest IQ at 276.
Kim publicly declared on X that the XRP Supercycle is only just beginning. His statement immediately spread across crypto communities, framing the current phase as the very early innings.
Furthermore, the message landed at a moment when both technical and on-chain indicators are aligning for the Ripple token.
Follow us on X to get the latest news as it happens.
Such declarations always generate excitement among holders. However, the framing matters because it aligns with structured cycle perspectives shared by serious technical analysts. As a result, the supercycle conversation has expanded beyond pure sentiment and into long-term, data-driven market modeling for XRP.
Technical analyst ChartNerdTA recently highlighted relevant historical cycle data. XRP’s moves from one periodic cycle high to the next have averaged three to five years over the past decade-plus.
Furthermore, this remains one of the cleanest cycle structures in the entire crypto sector.
The data points toward a specific possibility. If a cycle bottom forms during 2026, the next major XRP top could realistically land between 2028 and 2030.
The current market context supports the broader bullish thesis. XRP’s market capitalization remains above $65 billion with 24-hour trading volume still active, according to CoinGecko data.
Institutional interest stays strong, supported by ongoing spot ETF inflows and Ripple’s expanding cross-border payments business across multiple international corridors.
The 3 Bullish Signals Now Lighting Up XRP
A bullish signal is a technical or on-chain indicator that suggests buying pressure may begin to outweigh selling momentum in the short term. XRP has just triggered three of them at once, reinforcing the broader narrative pushed by the highest-IQ holder this week.
The first signal comes from the Tom DeMark Sequential indicator on the daily chart. The setup printed a fresh “9” buy signal, as flagged by analyst Ali Charts. Furthermore, the reading often signals exhaustion in downtrends and tends to precede short-term relief rallies lasting 1 to 4 candles.
The second signal is a Morning Star Doji candlestick pattern. The formation took shape across the past three sessions near the $1.02 to $1.07 support zone. As a result, the structure now reinforces the case for a localized bottom in the short-term XRP price action.
The third signal comes from on-chain activity. Daily active addresses jumped from around 23,000 on June 14 to nearly 39,500 in recent days. Moreover, the surge points to genuine network engagement rather than speculative positioning alone, driving short-term price recovery.
Together, the three signals form a rare alignment. Technical reversal patterns are now meeting concrete on-chain growth at a defended support zone. However, confirmation will require sustained buying volume and a clean break above immediate resistance toward the $1.30 level.
Subscribe to our YouTube channel to watch leaders and journalists provide expert insights.
The wider question remains open. A confirmed near-term move would mark the first technical validation. However, if the supercycle thesis from the highest IQ holder holds, the real story lies years ahead.
Either way, the current setup combines technical, on-chain, and narrative forces in a way XRP has rarely seen before.
The post Highest IQ Holder Backs an XRP Supercycle as 3 Bullish Signals Hit at Once appeared first on BeInCrypto.
TLDR:
- Forbes estimates CZ’s fortune at $110B, placing the Binance founder ahead of Bill Gates in the latest rankings.
- Binance ownership remains the largest contributor to CZ’s wealth despite past regulatory settlements and leadership changes.
- Forbes says Bill Gates’ continued philanthropy has reduced his personal fortune while keeping him among top billionaires.
- CZ noted crypto wealth changes rapidly because private company valuations and digital asset prices fluctuate daily.
Changpeng Zhao, widely known as CZ, has moved ahead of Bill Gates on the latest Forbes billionaire rankings. The shift reflects the growing value of Binance alongside rising digital asset markets.
CZ’s estimated fortune now stands at $110 billion, placing him above the Microsoft co-founder in Forbes’ published list. The milestone also highlights how crypto infrastructure has become a significant source of global wealth.
CZ Tops Bill Gates as Binance Valuation Lifts Net Worth
Forbes estimates CZ’s net worth at $110 billion. Bill Gates follows with an estimated $108 billion. The updated rankings place CZ at No. 17 globally, while Gates ranks No. 19.
The largest contributor to CZ’s fortune remains his ownership stake in Binance. Forbes estimates that he still controls roughly 90% of the world’s largest cryptocurrency exchange.
The value of that stake has increased alongside stronger activity across digital asset markets. CZ also holds substantial personal cryptocurrency investments.
Previous public statements indicate that most of his personal assets remain invested in crypto, including Bitcoin and Binance Coin. Forbes factors those holdings into its overall wealth calculations.
CZ acknowledged the published ranking after its release but noted that billionaire estimates can change rapidly. He pointed to crypto market volatility, saying real-time valuations often differ from published figures because private company values and digital assets fluctuate continuously.
Binance Recovery Strengthened CZ’s Position
Binance remained the world’s largest cryptocurrency exchange despite major regulatory challenges over the past several years.
After stepping down as chief executive following a U.S. settlement in 2023, CZ retained his reported ownership stake in the company.
According to Forbes, Binance’s business recovered as trading activity stabilized and the exchange maintained a leading share of global crypto trading volume. That recovery significantly increased the estimated value of CZ’s equity.
Posts shared by DeFiTracer on X highlighted the updated Forbes rankings, describing CZ as the richest individual in the cryptocurrency industry. The discussion quickly spread across the crypto community as investors compared traditional technology fortunes with wealth created through digital asset infrastructure.
The rankings also reflect Bill Gates’ long-term philanthropic strategy. Forbes notes that Gates has continued transferring substantial assets to charitable causes through the Gates Foundation, reducing his personal fortune over time while remaining among the world’s wealthiest individuals.
The latest billionaire list illustrates how ownership of crypto infrastructure can rival wealth generated through traditional technology companies.
While token prices influence personal fortunes, Binance’s business valuation remains the largest driver behind CZ’s estimated net worth, according to Forbes. The figures also serve as a reminder that billionaire rankings change frequently as private company values and cryptocurrency markets continue to move.
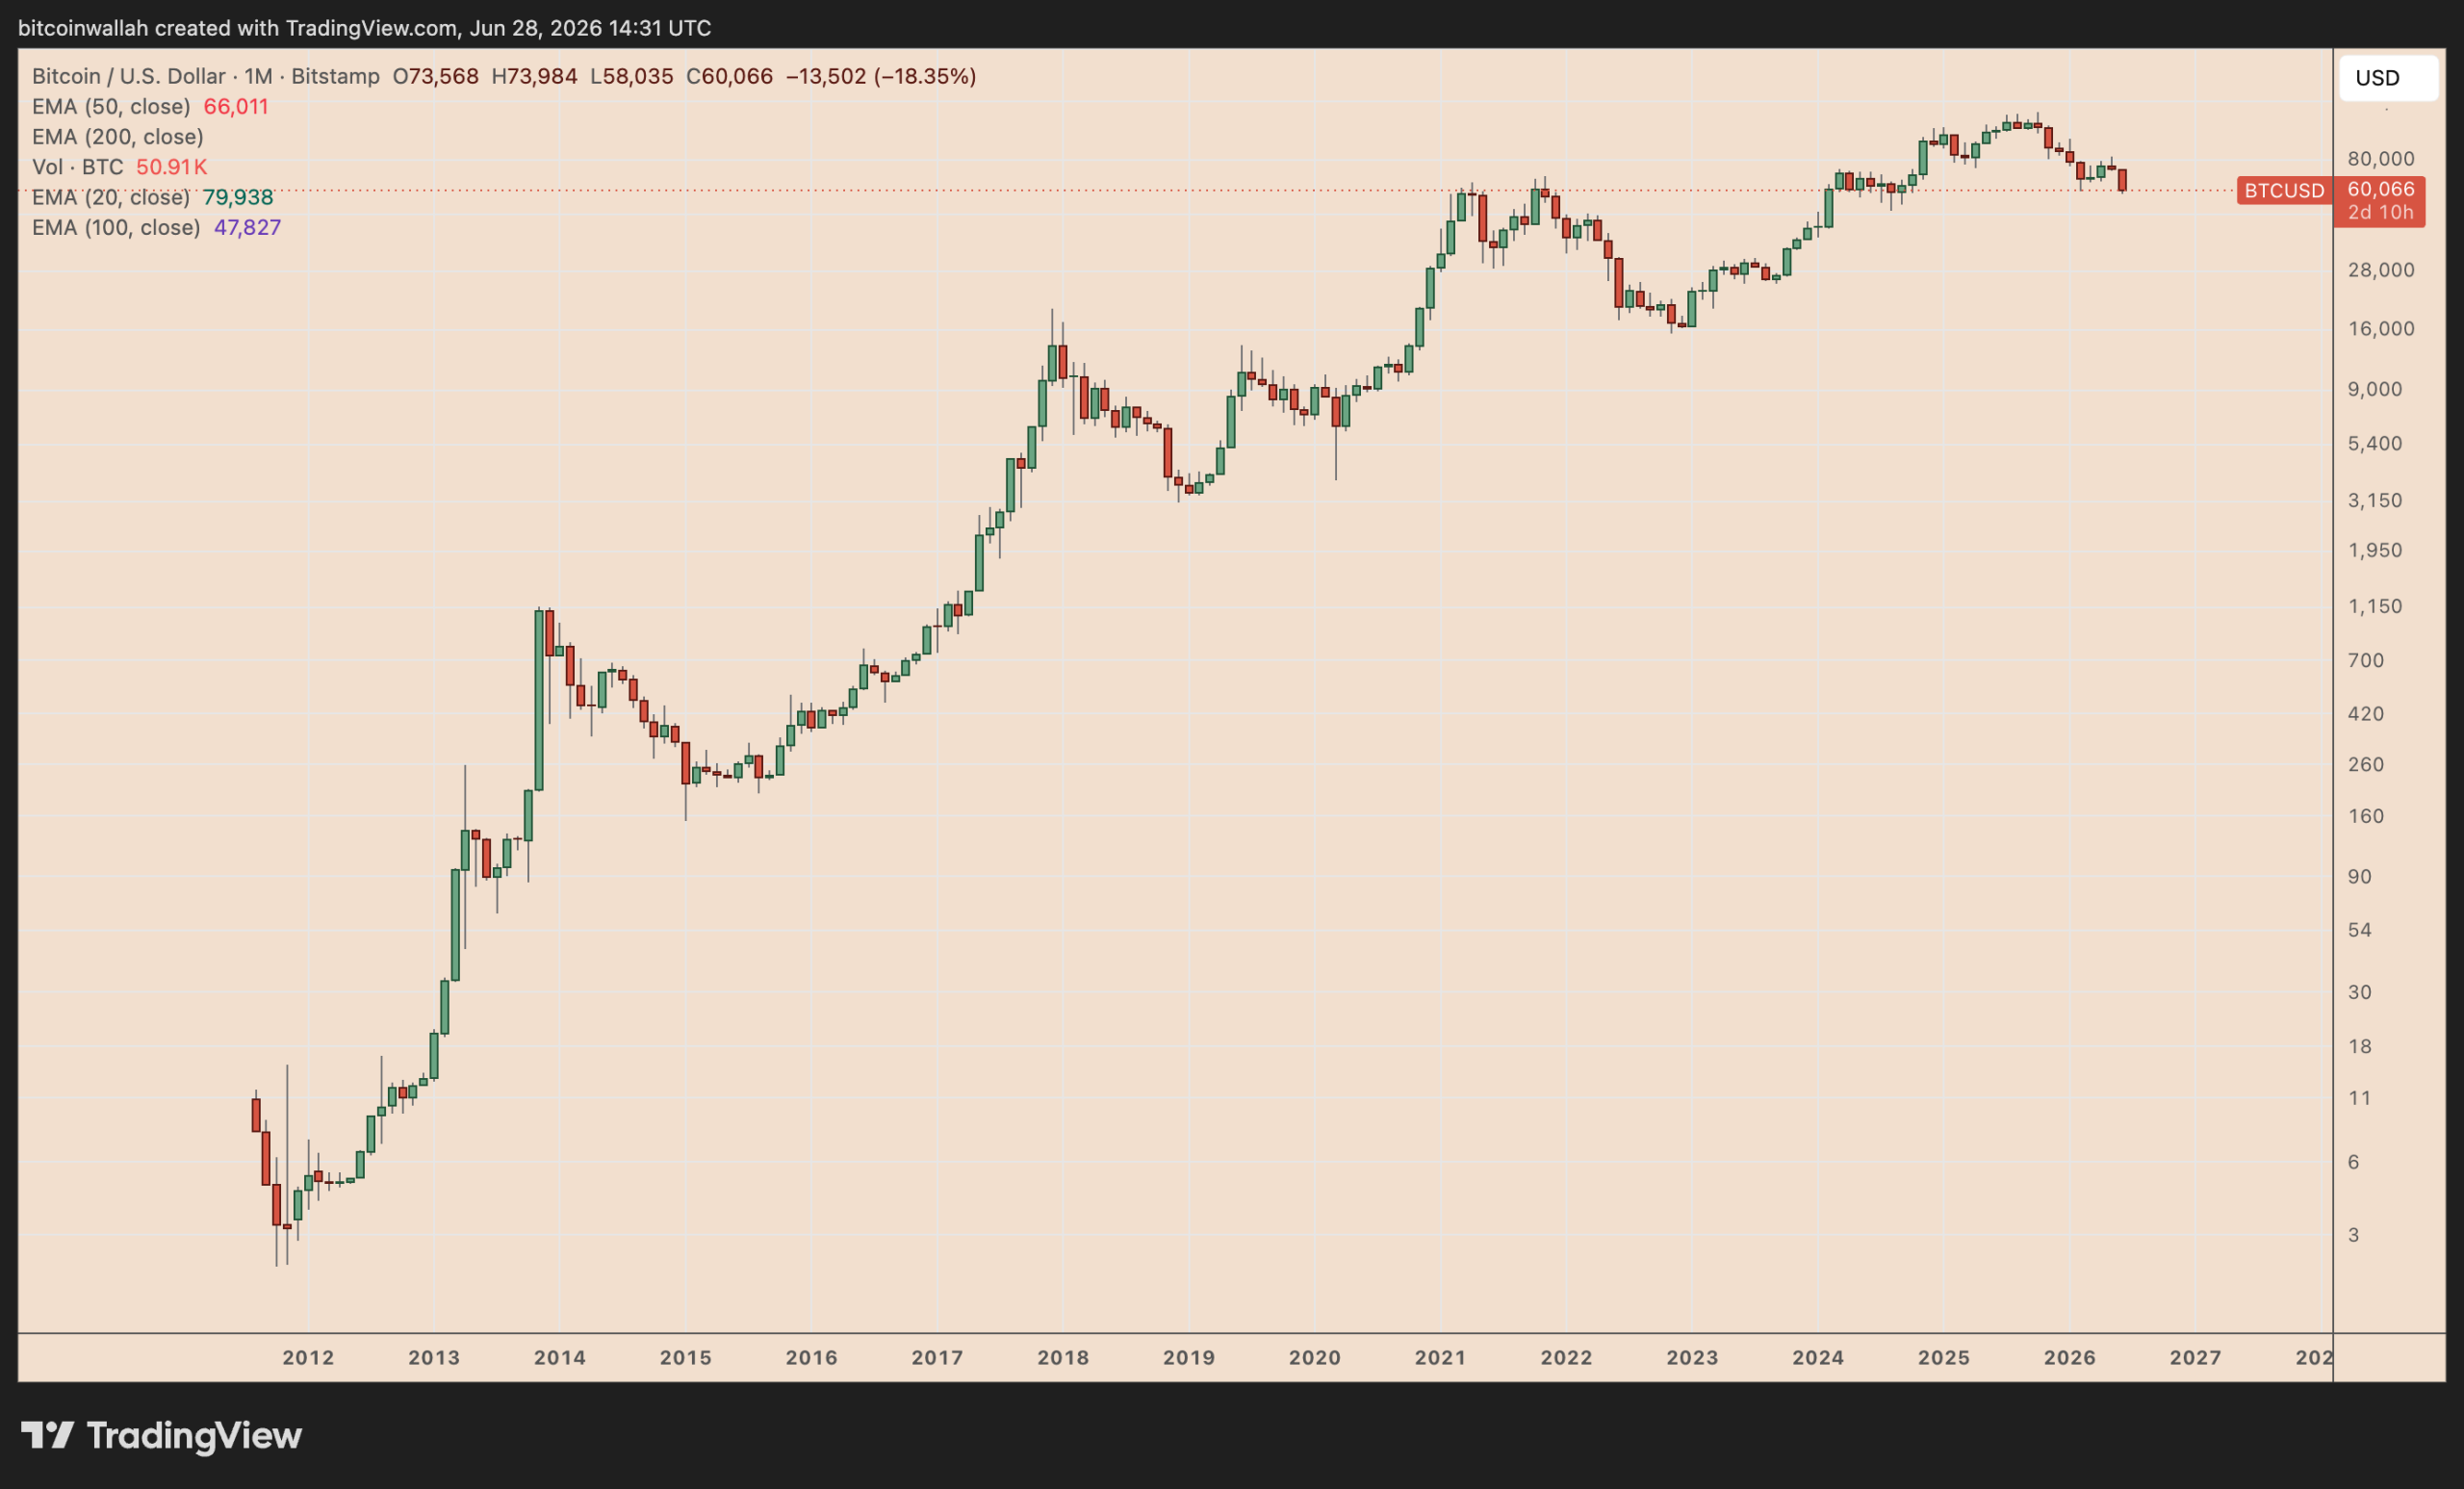
Bitcoin (BTC) is heading for its worst monthly loss since mid-2022, with BTC down roughly 18.5% in June as price struggles to hold the psychological $60,000 support level.

BTC/USD monthly chart. Source: TradingView
Will Bitcoin’s downside momentum extend in July, or is BTC preparing for a recovery?
Key takeaways:
- Bitcoin’s liquidity map shows a major short-liquidation “magnet zone” near $67,600.
- BTC has historically gained 7.6% on average in July, while midterm-year seasonality points to an even stronger 10.3% average return.
Bitcoin may hit $75,000 in July
July may become a “bullish month for Bitcoin,” according to analyst Fleh, who predicted BTC price to rally toward $75,000 next month.
The bullish thesis is based on Bitcoin’s Binance BTC/USDT liquidation heatmap, which shows a large concentration of short liquidation levels sitting above the current price.
On the monthly chart, the strongest visible liquidity cluster sits near $67,645, where the chart shows around $247.39 million in liquidation leverage and roughly $2.26 billion in cumulative short liquidation leverage.
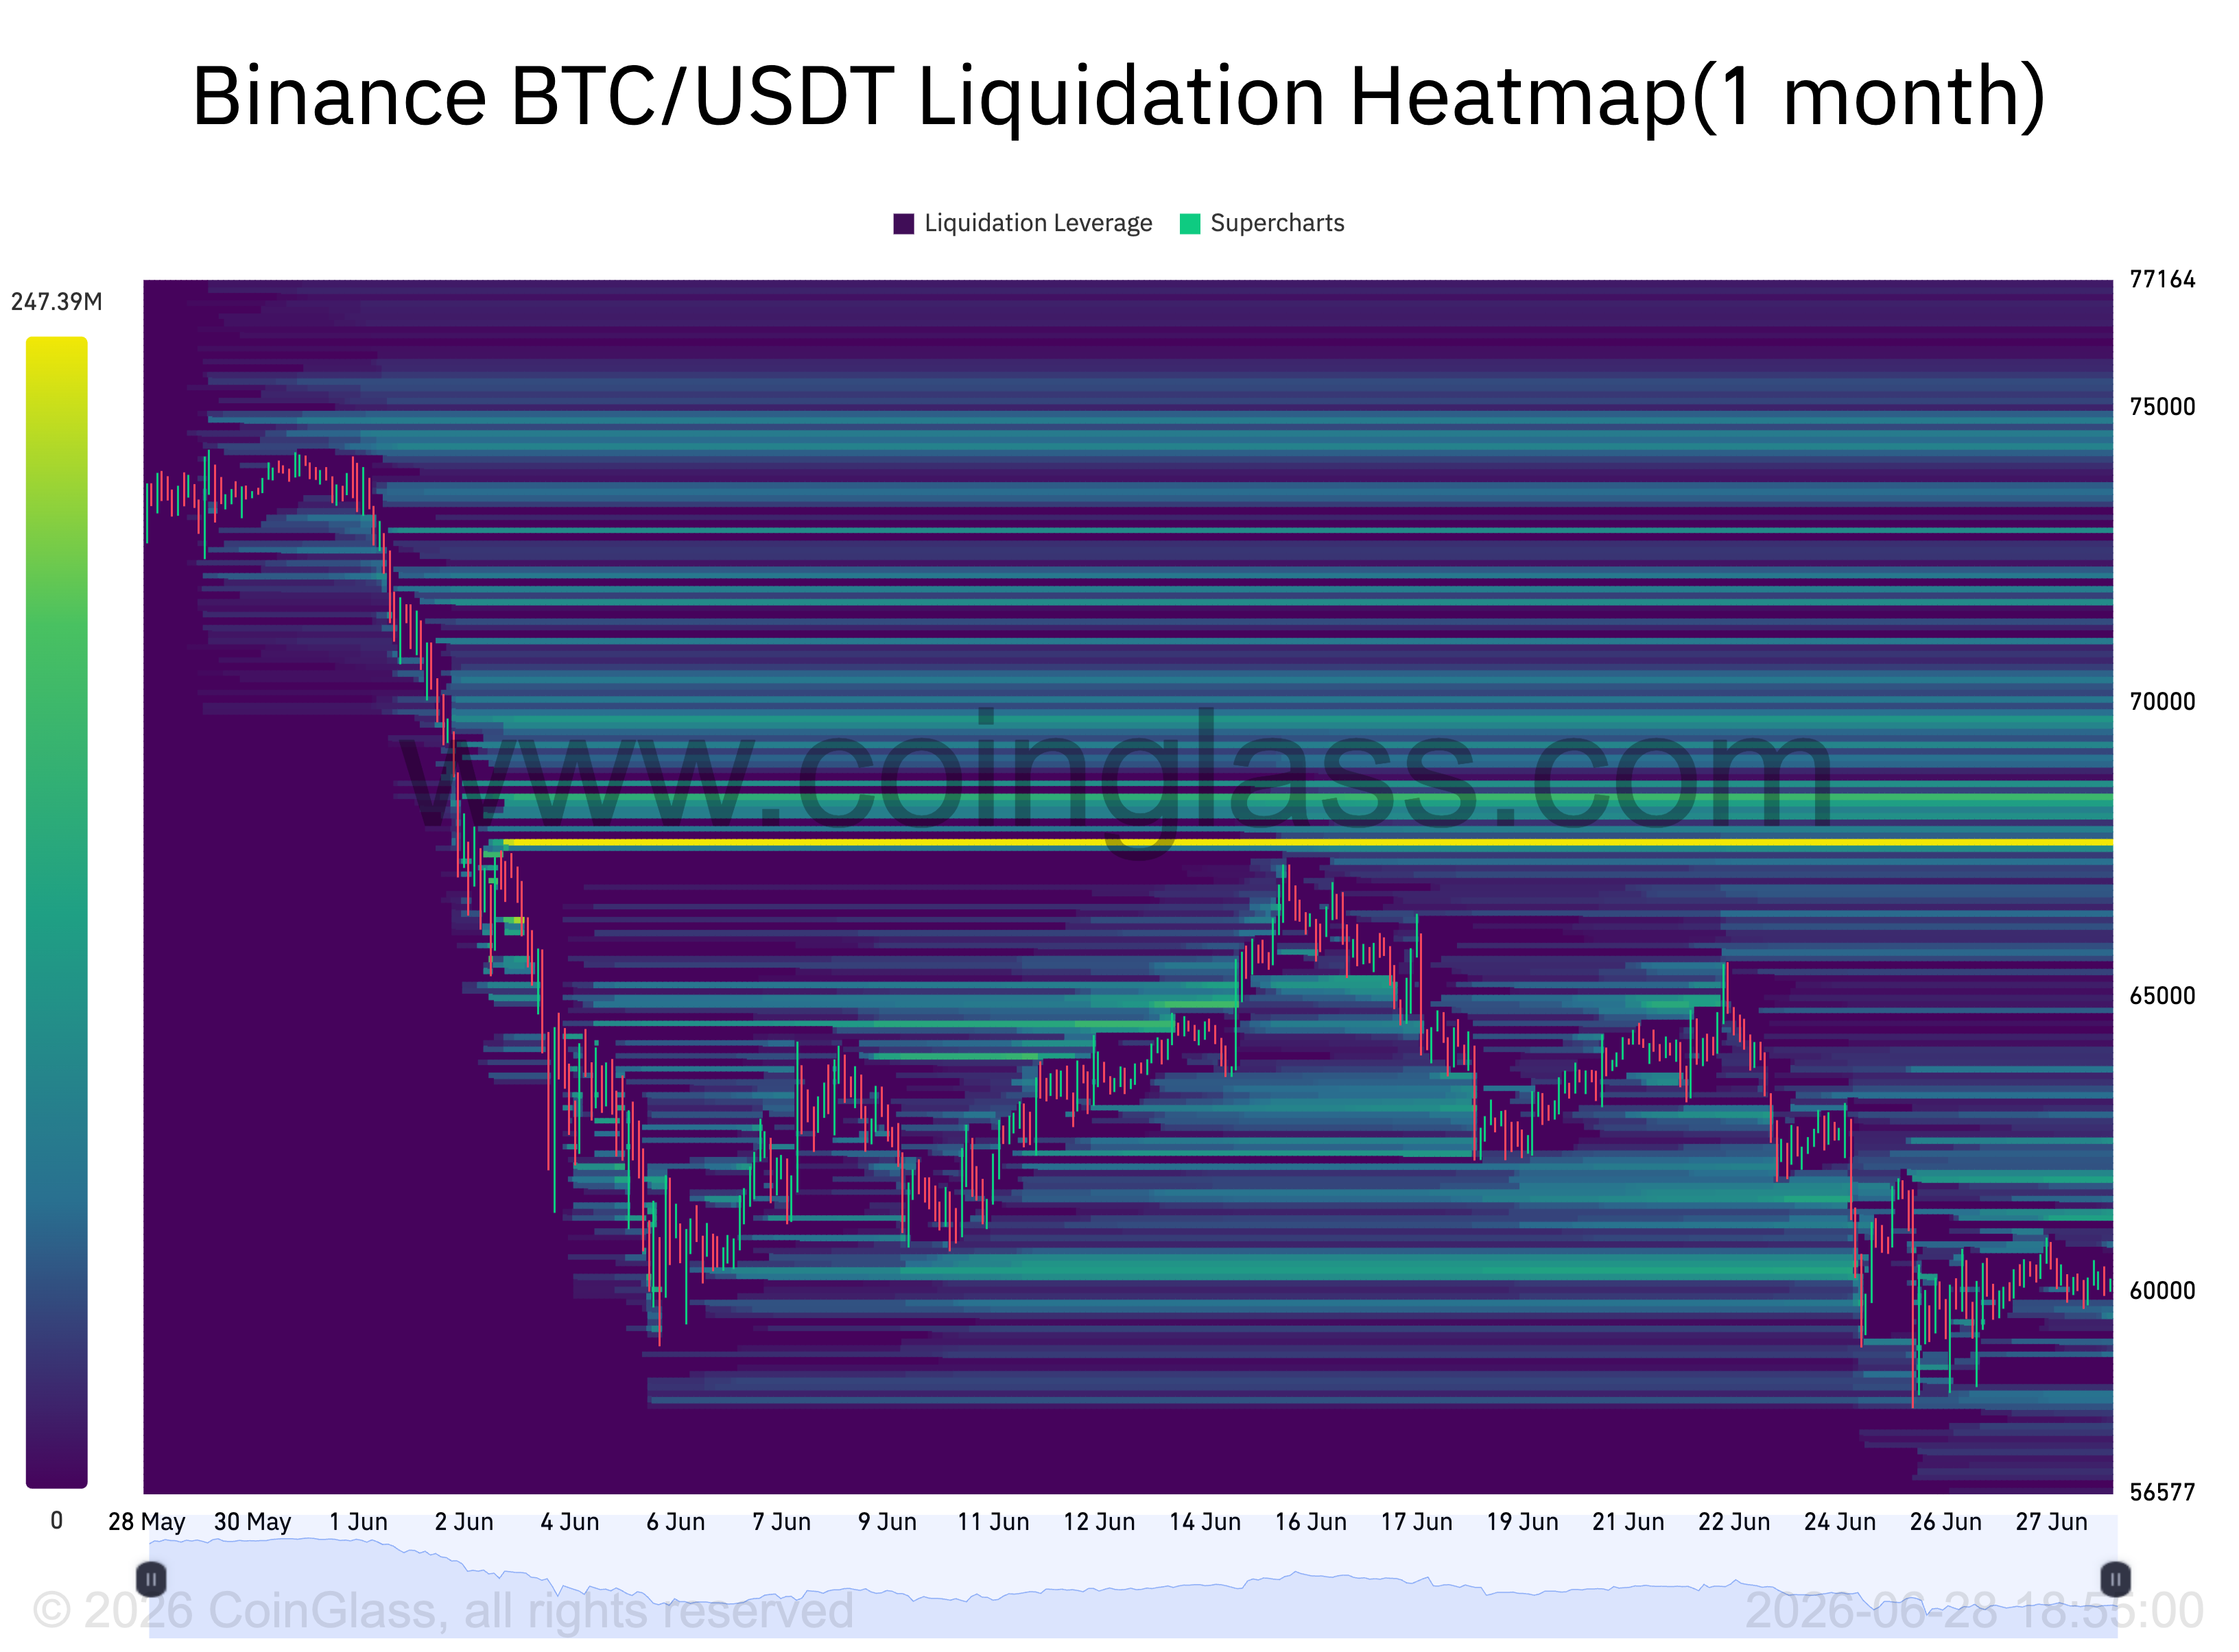
Binance BTC/USDT liquidation heatmap (1 month). Source: CoinGlass
For beginners, such clusters are often called “magnet zones.” When many leveraged positions are concentrated around the same price area, the market can move toward that zone because liquidations create forced buying or selling pressure.
In this case, significant liquidity sits above Bitcoin’s current price near $60,000.
If BTC rebounds and pushes toward $67,600, short sellers may be forced to close their positions. Since closing shorts requires buying Bitcoin back, that can add fresh upside pressure and fuel a short squeeze.
“I think $BTC bottoms here at 60k for now, targeting 75k to the upside before any chance of lower,” Fleh said in a Saturday post.
BTC rises 7.6% on average in July
Bitcoin’s historical monthly returns also support Fleh’s bullish July outlook.
BTC has returned a 7.6% gain on average in July, making it one of its stronger months after a typically weaker June, which shows an average return of -1.40%, according to CoinGlass data highlighted by analyst CGT_Trader.
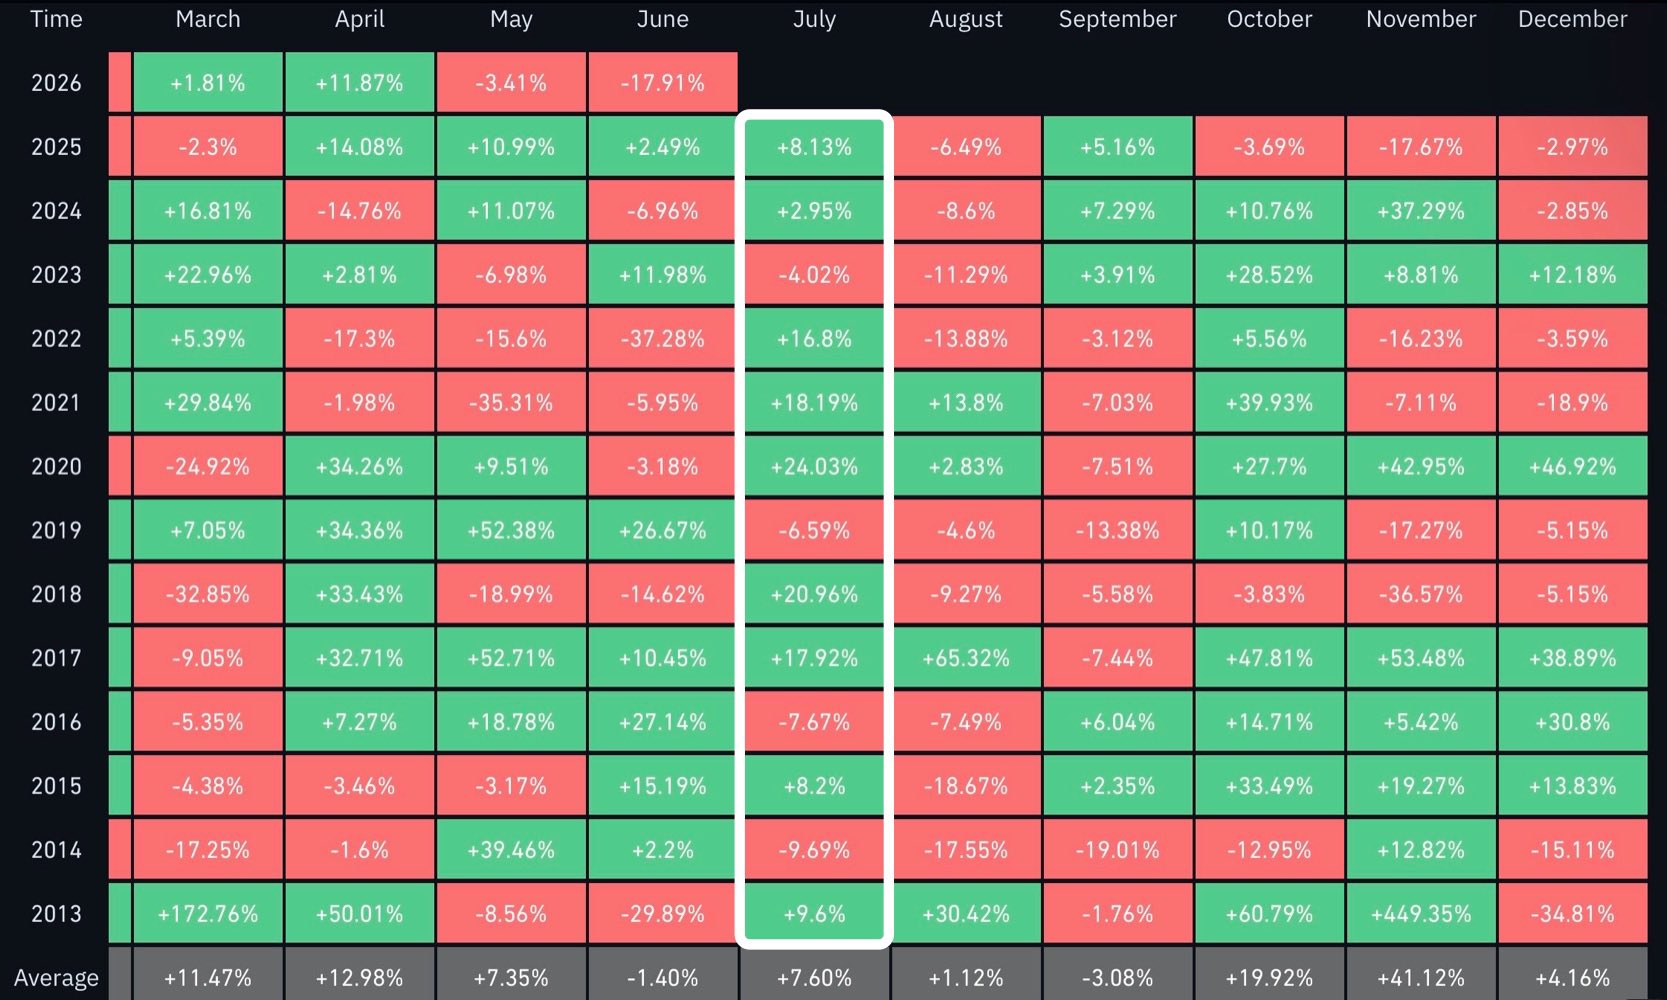
Bitcoin monthly returns tracking the July performance in since 2013. Source: CoinGlass/CGT_Trader
The trend has appeared even during bear market years.
For instance, Bitcoin rose 20.96% in July 2018 and 16.8% in July 2022. More recently, BTC gained 2.95% in July 2024 and 8.13% in July 2025, strengthening the case for another green month ahead.
A separate midterm-year seasonality chart also shows that- Bitcoin has averaged a 10.3% gain during the month, its strongest monthly return in such years.
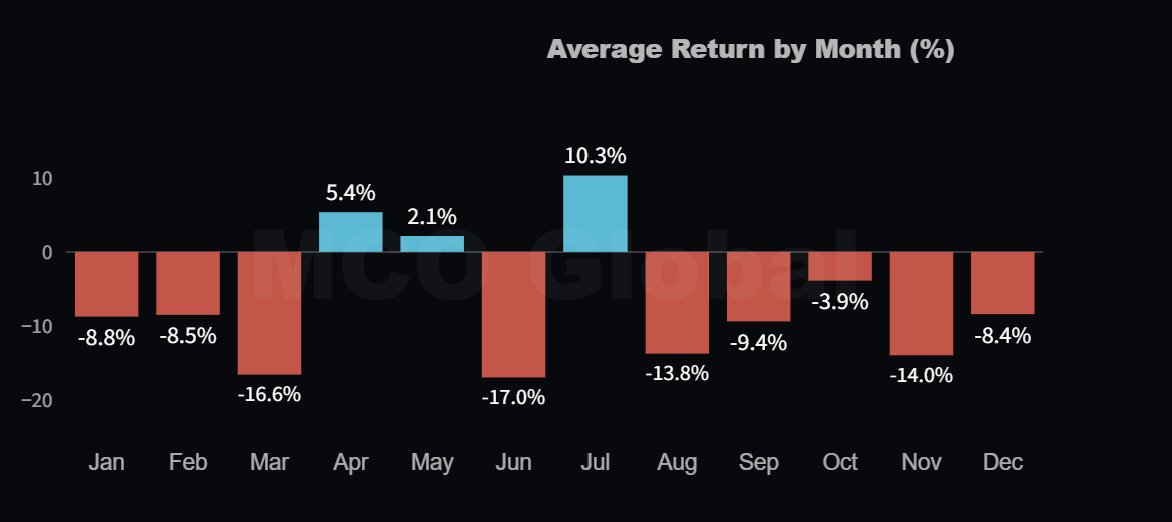
Bitcoin performance by month during US mid-term election years. Source: More Crypto Online
That compares with an average 17% loss in June, pointing to the possibility of a post-sell-off mean-reversion bounce.
Based on Bitcoin’s current price near $60,000, its historical July average return of 7.6% projects a move toward roughly $64,500, while the stronger midterm-year average of 10.3% points to about $66,100.
A repeat of Bitcoin’s bear-market July rebounds from 2022 and 2018 would put BTC between $70,000 and $72,500, while a 2020-style July rally would bring Fleh’s $75,000 target within reach.
BTC’s dip below the 200-week SMA may extend slide
Bitcoin’s ongoing drop below its 200-week simple moving average (200-day SMA, the blue line) near $62,445 raises the risk of further downside in July.
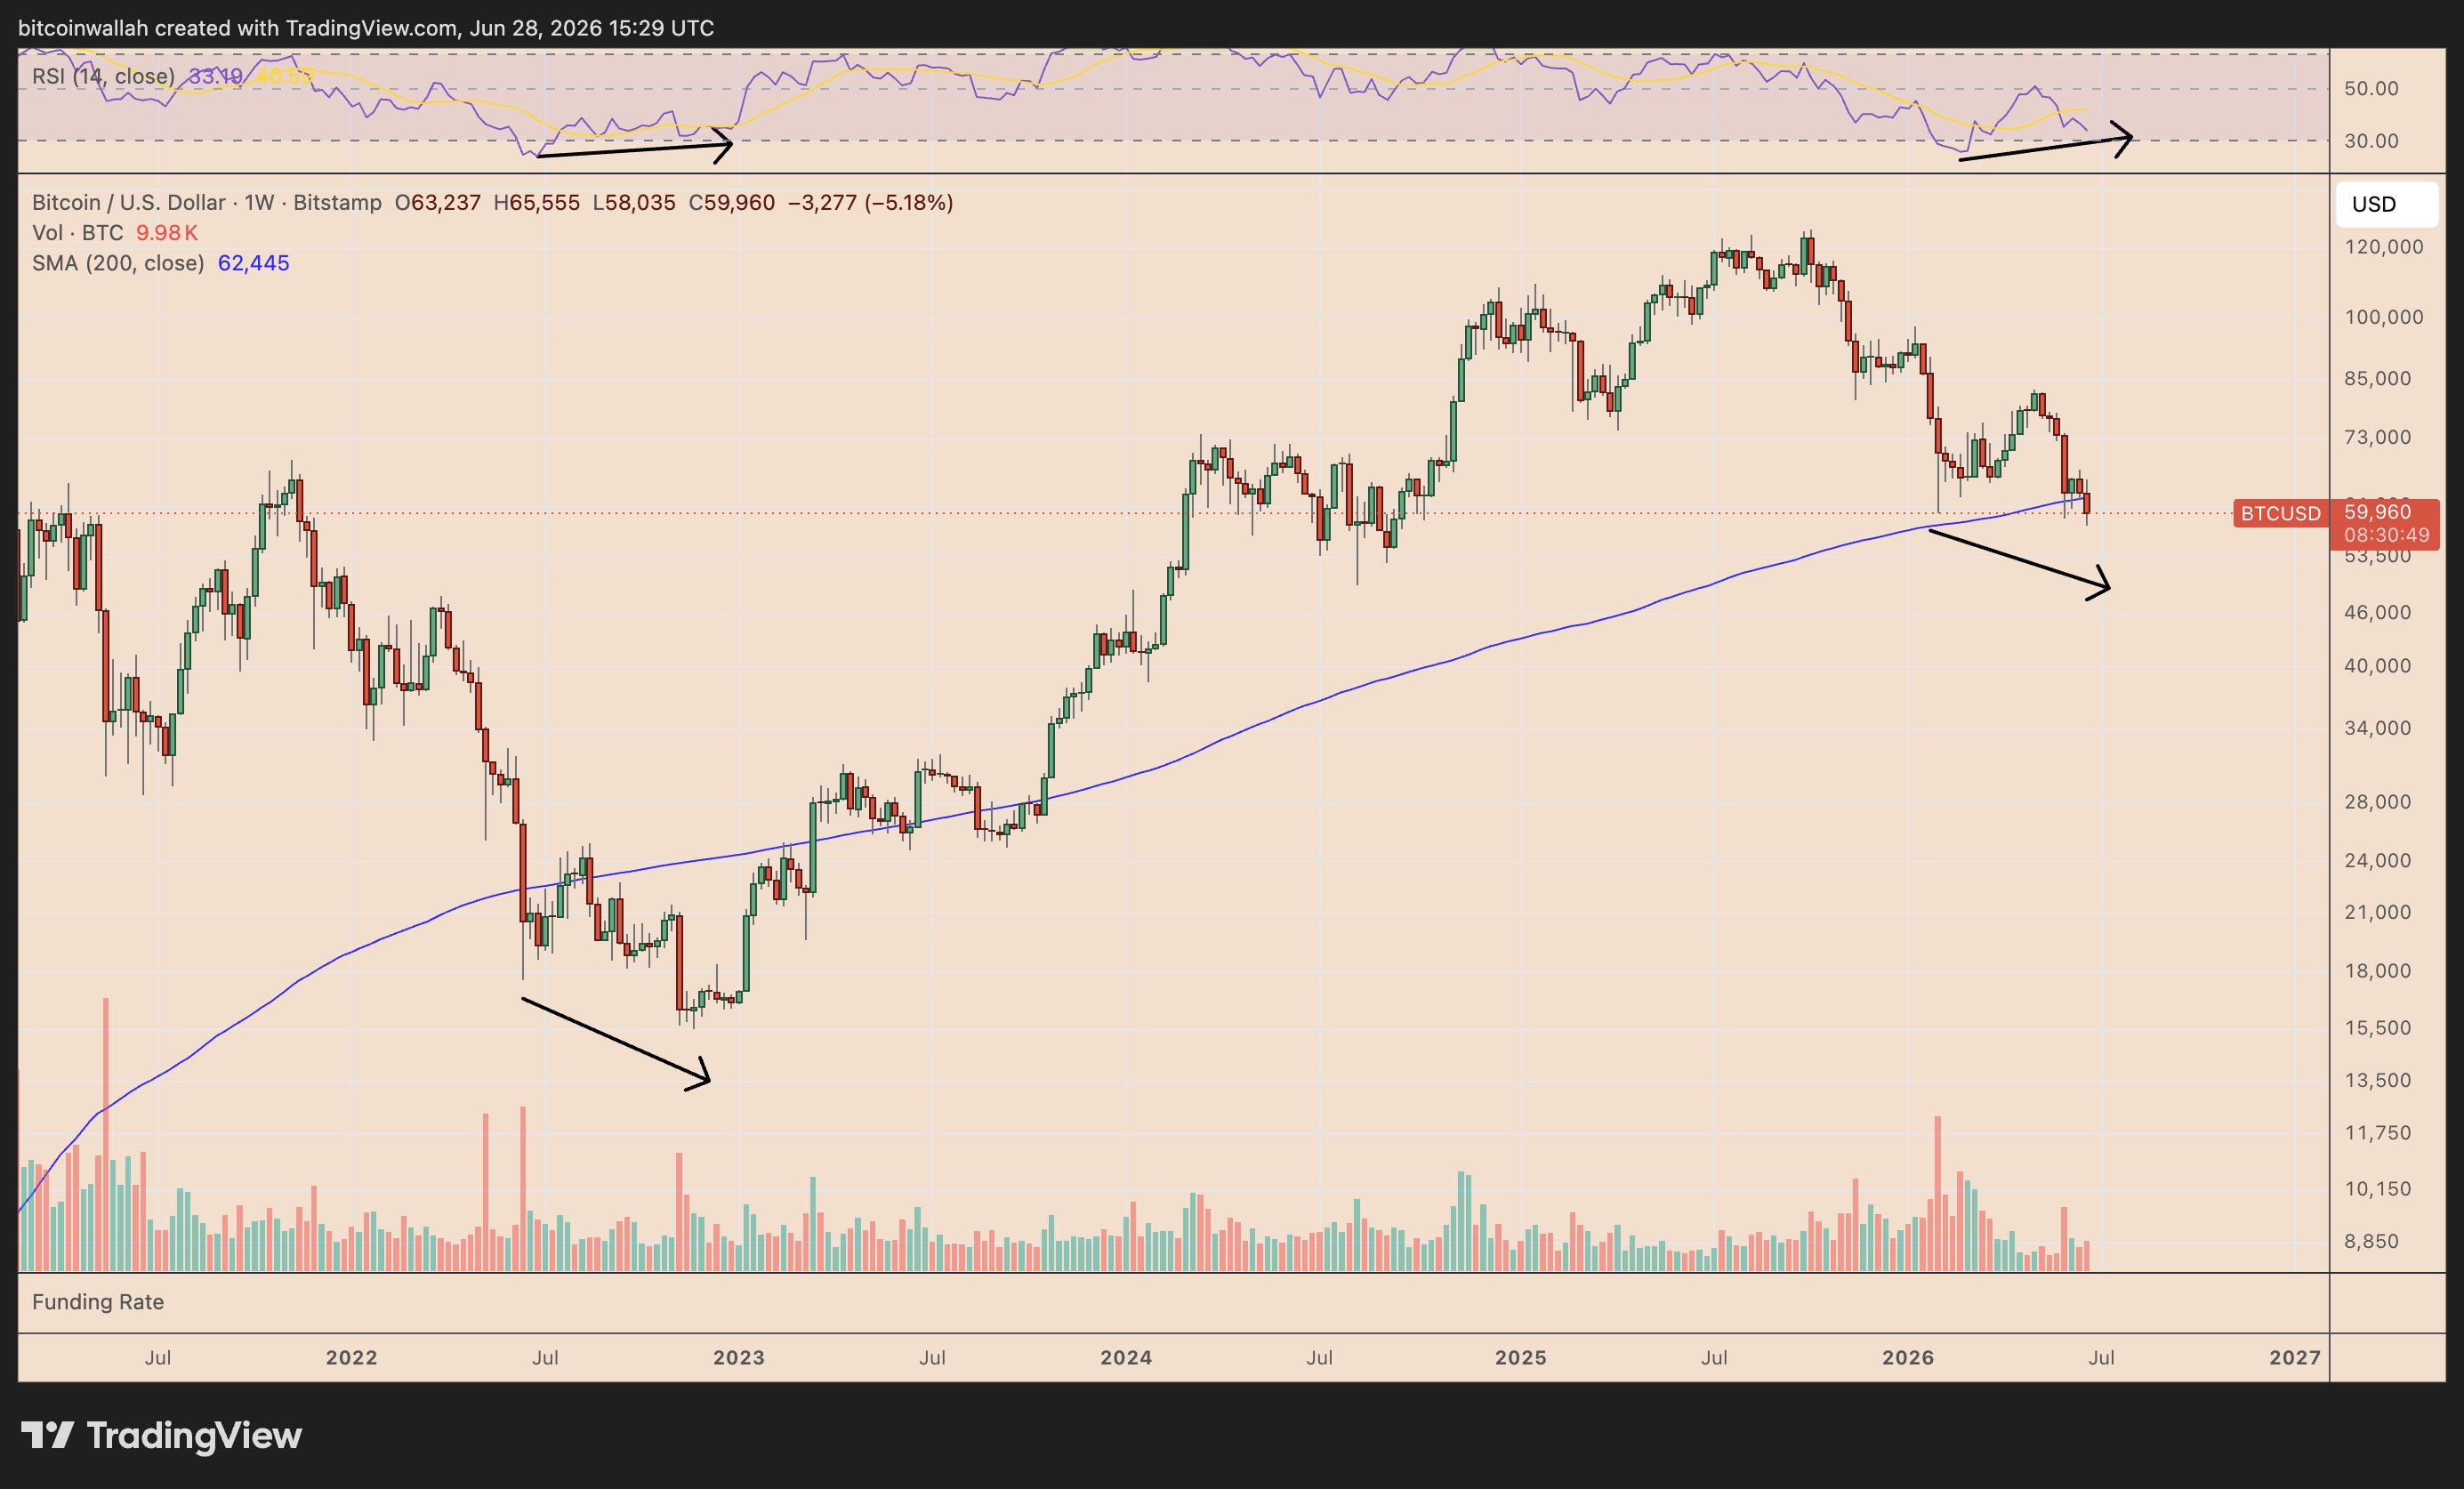
BTC/USD weekly chart. Source: TradingView
A similar loss of long-term moving-average support preceded deeper weakness during the 2022 bear market, when BTC continued lower before forming a bottom.
Related: Bitcoin faces fresh capitulation risk as 50K BTC moved at a loss
Bitcoin’s bear flag breakdown raises the odds of a price decline toward $55,000 in July unless BTC quickly reclaims the 200-day SMA.
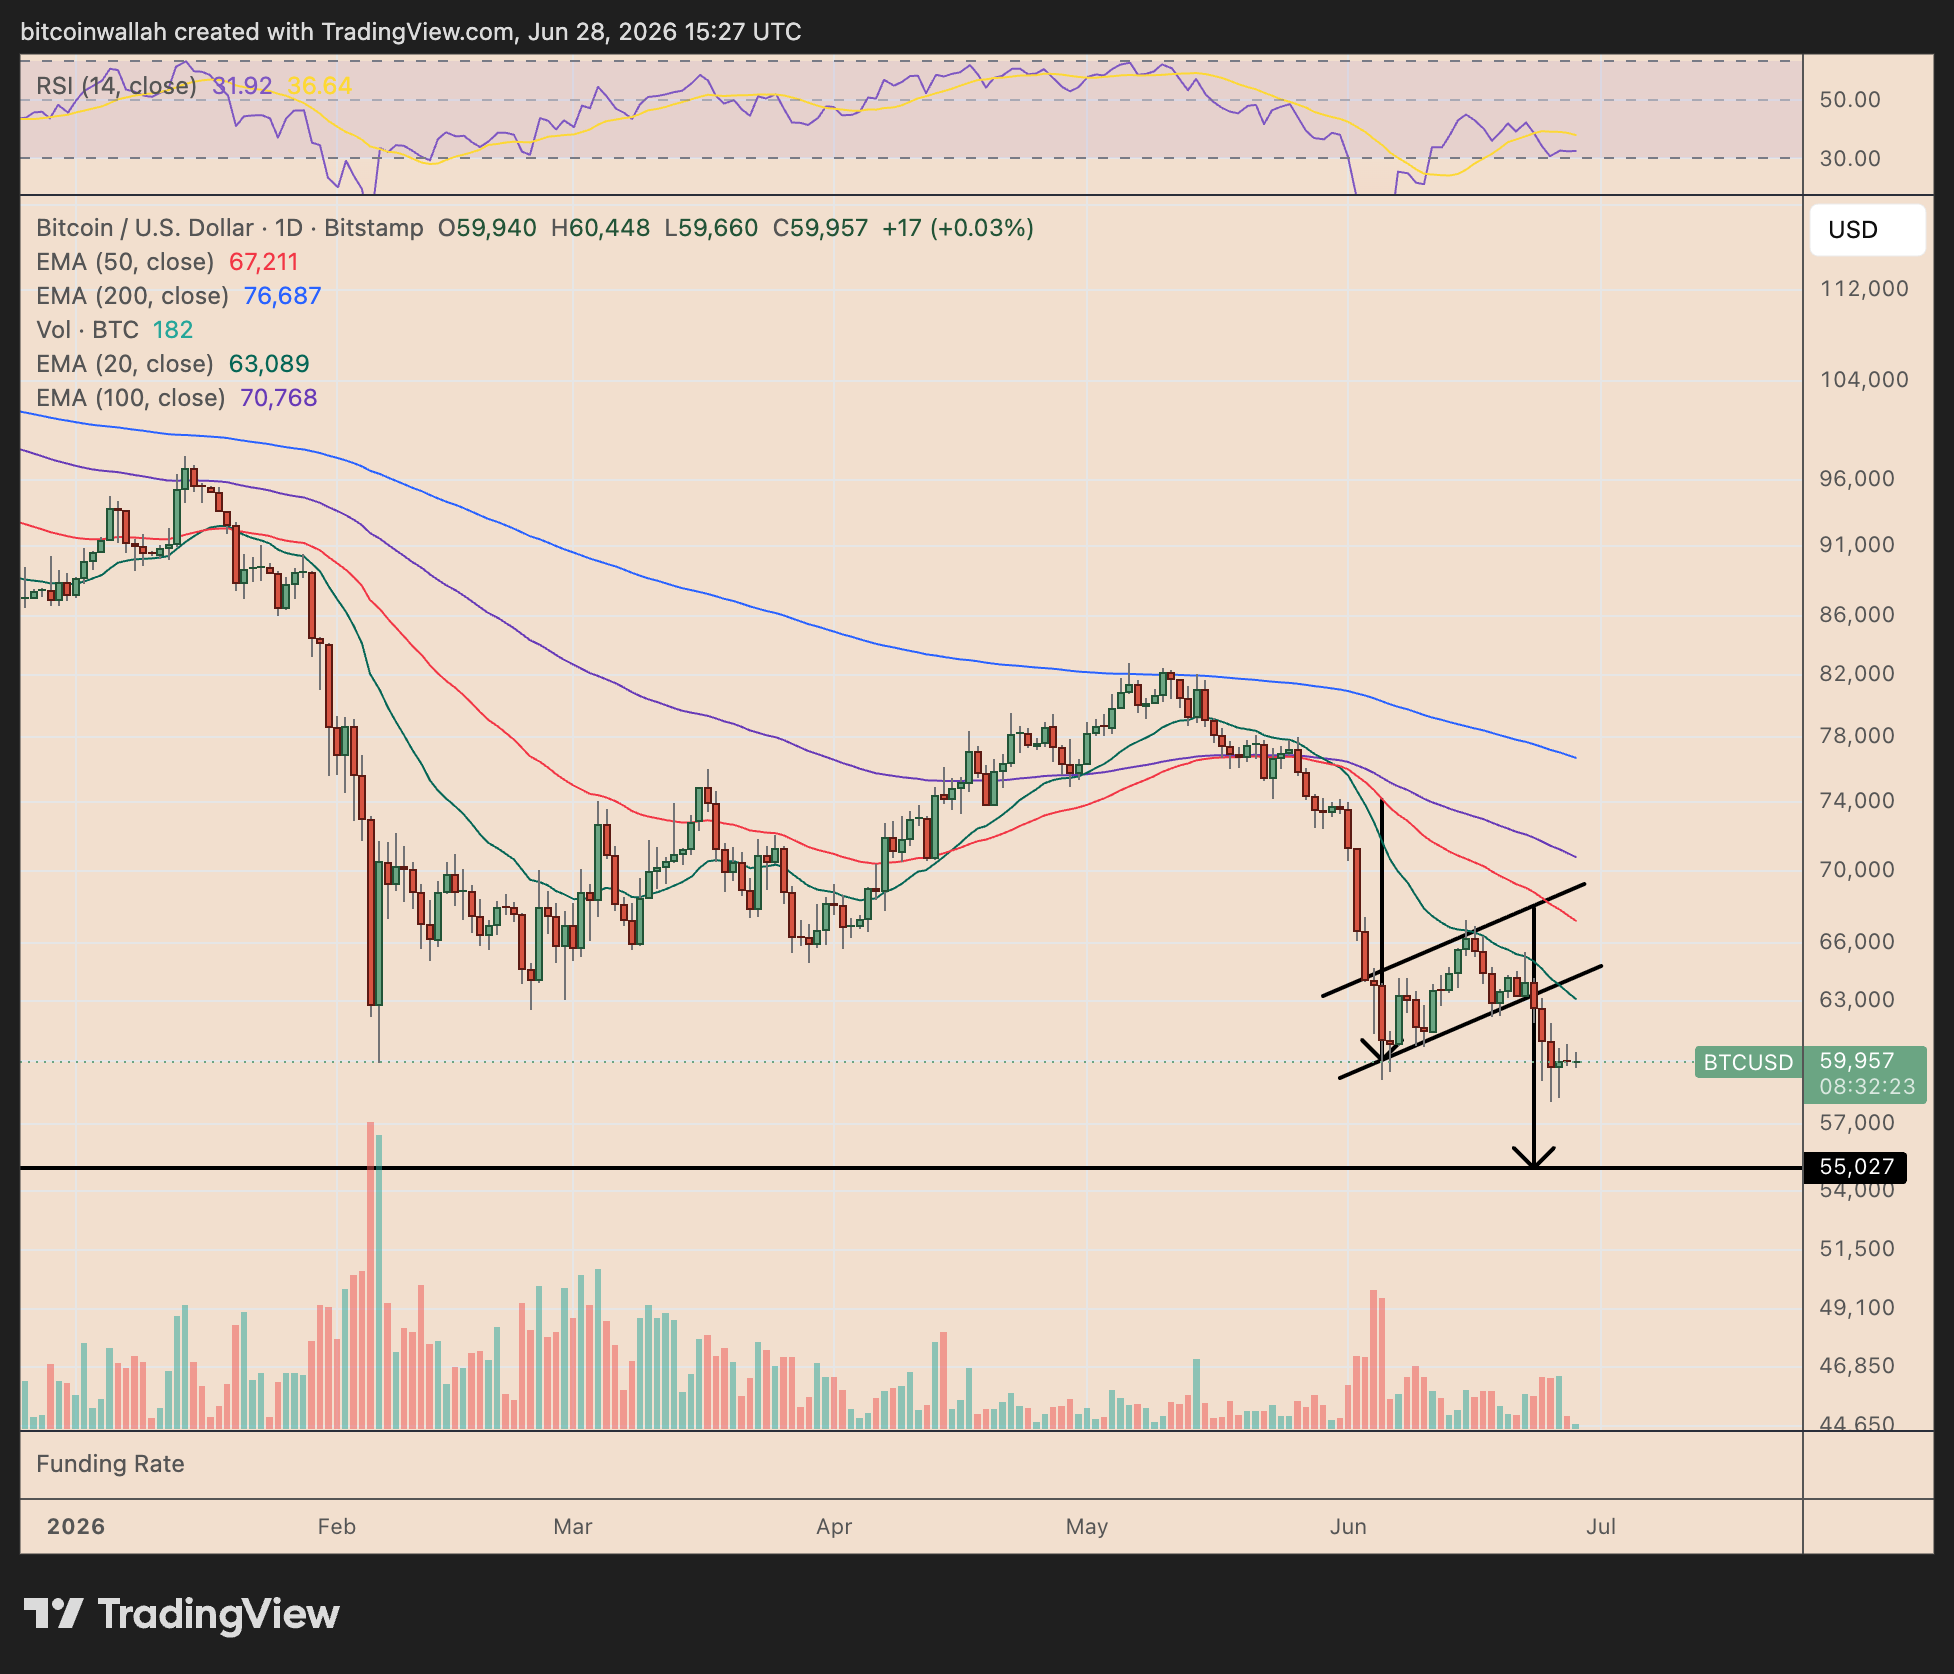
BTC/USD daily chart. Source: TradingView

Writer Ian Bogost says ‘The Small Stuff’ can help us reclaim our lives from dematerialization

Big Tip Made Her Cry as She Was Battling Financial Issues

Confessions Of An Oil Bull

No Jackpot Winner as $257 Million Prize Rolls Over to $269 Million Monday Draw

Renter of Home in Anne Heche Crash Denies Settlement With Son

Blockchain.com files with SEC for U.S. IPO
Big Tip Made Her Cry as She Was Battling Financial Issues

Rating subscribers dream cars pt.16 #automobile #cartok #supercar #money #rich #edit #carshorts #fyp

Yahoo Finance Live: Daily Market Coverage – June 26, 2026 9AM-11AM (ET)
-
 Sports5 days ago
Two goals and an assist by sheer aura: Cristiano Ronaldo just entered the World Cup chat
-

 Tech6 days ago
Microsoft accidentally kills epic Outlook email threads
-

 Fashion2 days ago
Weekend Open Thread: Staud – Corporette.com
-

 Politics3 days ago
The House | Manchesterism won’t survive the painful trade-offs unless it gets citizens on board
-

 Politics3 days ago
Potential 2028er World Cup attendee leaderboard
-

 Business2 days ago
Asia stock markets slide as tech shares slump
-

 Tech3 days ago
A Look At A Gaggle Of Transputer Boards
-
Crypto World5 days ago
Bitcoin (BTC) Dips Below $62K, Ethereum (ETH) Plunges 6% Daily: Market Watch
-
 Crypto World3 days ago
Dell (DELL) Shares Tumble Over 5% Following Analyst Downgrade to Hold
-

 Crypto World5 days ago
Securitize Wraps Roubini's SEC-Registered ETF as Dubai VARA Digital Security
-
Business5 days ago
Entergy settles forward sale agreements, raises $672 million in cash proceeds
-

 Crypto World2 days ago
Kraken's xStocks Opens Bending Spoons IPO Registration to EEA Retail
-

 Sports2 days ago
FIH Pro League: India defeat Pakistan 7-1, register biggest win of campaign | Other Sports News
-

 Crypto World2 days ago
RTX holders must register wallets before token distribution begins
-

 Crypto World1 day ago
Coinbase, Circle Deepen Crypto Stock Losses Despite Resilient S&P 500
-
Crypto World2 days ago
Hyperliquid Named on Singapore MAS Investor Alert Register
-

 Sports3 days ago
India vs Bangladesh LIVE Score, Women’s T20 World Cup: Bangladesh Opt To Bat; India Enter ‘Do-Or-Die’ Stage As Semi-Final Race Heats Up
-
Crypto World3 days ago
The DATA Foundation Launches to Tackle AI’s Multi-Billion Dollar Training Data Bottleneck
-
 Crypto World3 days ago
AAVE price tests 9-month trendline after 17% rebound as breakout hopes build
-

 Crypto World3 days ago
Strategy (MSTR) has a 10-month cash runway for dividends, but retail investors are losing faith
You must be logged in to post a comment Login