

Crypto World
Can Bitcoin Price Rebound in July? Key Factors to Watch

Bitcoin is set up for a tense July after June delivered the token’s weakest monthly performance since mid-2022. BTC is down roughly 18.5% for the month and has struggled to defend the $60,000 psychological level.
Analysts are split between two forces: downside pressure tied to Bitcoin’s technical weakness, and a potential “liquidity magnet” effect that has historically coincided with sharper rebounds. Traders watching July closely will likely focus on whether BTC can reclaim key long-term indicators before any mean-reversion bounce plays out.
Key takeaways
- June’s drawdown puts pressure on Bitcoin’s ability to hold support near $60,000, with further weakness possible if longer-term trend levels fail.
- Liquidation data referenced by analyst Fleh points to a large short-liquidation concentration near $67,600, which could act as a magnet on a rebound.
- CoinGlass data cited in the coverage suggests Bitcoin has historically posted an average gain of about 7.6% in July, after a weak June.
- Seasonality in midterm-election years has been stronger for BTC, with an average July return of roughly 10.3% in those years.
- Another technical risk factor is Bitcoin trading below its 200-week simple moving average region near $62,445, a condition that preceded deeper weakness in 2022.
Liquidity heatmap points to a potential “magnet zone”
One of the more constructive arguments for July comes from liquidation positioning. In a post shared by analyst Fleh, the trader highlighted Binance BTC/USDT liquidation heatmap levels indicating heavy short-liquidation liquidity above current price.
The largest cluster referenced sits around $67,645. The charting data shown in the report cites approximately $247.39 million in liquidation leverage and roughly $2.26 billion in cumulative short liquidation leverage in that area, according to CoinGlass heatmap figures.
In markets, large concentration zones like this are sometimes described as “magnet zones.” The logic is straightforward: if price rises toward areas where leveraged short positions are concentrated, those shorts can be forced to exit through liquidation. Closing shorts generally requires buying Bitcoin back, which can amplify upward momentum and increase the odds of a sharper move than spot flows alone would suggest.
Fleh’s outlook, as quoted in the original coverage, is that BTC may bottom near $60,000 “for now,” targeting a rally toward $75,000 before any further downside risk materializes.
Seasonality and historical July performance
Beyond liquidation dynamics, the bullish case is also supported by historical calendar behavior—though this is not a guarantee. According to CoinGlass data highlighted by analyst CGT_Trader, Bitcoin has delivered an average gain of about 7.6% in July. The same dataset shows June has been weaker on average, with an average June return around -1.40%.
The key practical takeaway for traders is that July has often started with a rebound after a soft June. The report notes that even in bear-market years, July has still produced positive performance—for example, BTC gained 20.96% in July 2018 and 16.8% in July 2022.
More recent examples cited include a 2.95% rise in July 2024 and an 8.13% gain in July 2025, which the authors frame as further evidence that the seasonal pattern can persist through different regimes.
A separate midterm-election-year seasonality view referenced in the coverage shows Bitcoin averaging a 10.3% gain in July during those years—its strongest monthly return in that subset. That statistic contrasts with an average June loss of about 17% in midterm-election years, strengthening the “post-sell-off bounce” narrative.
Using the report’s current-price assumption near $60,000, a 7.6% average July gain implies a move toward roughly $64,500. The stronger 10.3% midterm-year average suggests a potential stretch toward about $66,100. If Bitcoin repeats the more dramatic bear-market rebounds seen in 2022 and 2018, the upside range suggested in the coverage lands between $70,000 and $72,500. A more aggressive “2020-style” July rally would be consistent with Fleh’s $75,000 target.
Technical pressure: risk grows if BTC can’t reclaim long-term support
While the upside thesis leans on liquidity and seasonal mean reversion, the downside case remains anchored in Bitcoin’s longer-term technical picture. The original analysis notes that BTC is still trading below its 200-week simple moving average, with that long-term reference around $62,445.
That matters because losing long-term moving-average support often increases the odds that rallies fail and price remains heavy until a deeper correction runs its course. The report draws a parallel to 2022: it states that a similar loss of long-term moving-average support preceded additional weakness before Bitcoin eventually formed a bottom.
In the coverage, this backdrop is described as a “bear flag breakdown,” with the expectation that unless BTC quickly reclaims the 200-day SMA area, downside risk in July could extend toward $55,000. The same article links to earlier coverage about capitulation risk near $50,000, underscoring that the technical narrative for this cycle has included concerns about sustained liquidation-driven selling pressure.
For investors, the practical distinction is timing. A liquidity-magnet rebound near $67,600 would require BTC to first stabilize around the $60,000 region and begin reclaiming higher levels. If instead price continues to slip below the long-term moving-average zones highlighted in the analysis, the short-term liquidation “magnet” argument could be delayed or invalidated by renewed downside momentum.
What to watch next in July
Heading into the month, the most important signals are whether BTC can hold near $60,000 and whether it reclaims the long-term moving-average region cited near $62,445. If it does, the $67,600 liquidity cluster could become a focal point for short-liquidation-driven buying; if it doesn’t, the reported $55,000 risk scenario may gain credibility and further weaken the odds of a quick mean-reversion bounce.

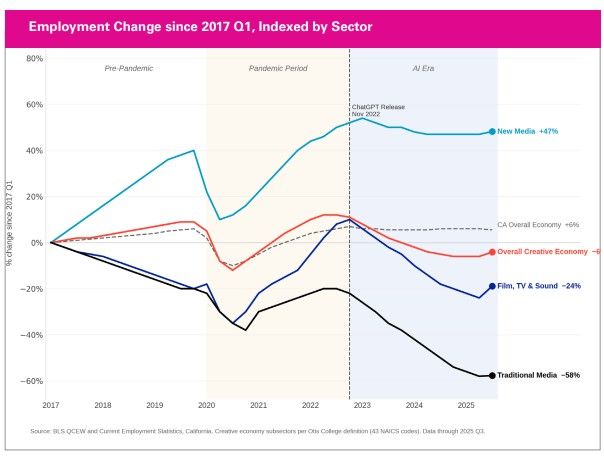
Filmmakers are already using artificial intelligence (AI) to cut animation production costs by up to 90%. New labor data from California confirms the industry is not waiting for the technology to mature.
Los Angeles County’s motion picture and sound recording sector shed 6,700 jobs year-over-year through May 2026. In total, those losses represent more than 90% of all employment declines recorded across the region’s information industry.
AI Reshapes What It Costs to Make a Film
Animators and directors on active productions report using AI to overhaul production workflows. The tools do not merely speed up existing tasks. They replace entire staffing layers, from storyboarding and character rigging through post-production cleanup.
Opinions divide sharply on the change. Some creators argue that AI will lower production barriers and expand storytelling possibilities. In contrast, others maintain it will eliminate the skilled workforce that built Hollywood’s animation industry over several decades.
Meanwhile, investment signals suggest studios are not waiting for the debate to resolve. Amazon Web Services recently backed a Hollywood production startup that deploys AI to reduce costs and compress production timelines.
That move signals studios’ view of AI efficiency as a structural necessity, not a temporary trend.

AI Job Cuts Extend Across the US Economy
The broader US labor market shows the same direction. AI-driven layoffs mounted across industries in early 2026 as companies rebuilt around smaller, automated teams. Goldman Sachs estimated that AI trimmed US payrolls by roughly 16,000 jobs per month over the past year.
However, entertainment’s concentration of losses runs disproportionately high by any measure.
The 6,700 motion picture jobs lost in LA County reflect a year-over-year comparison, not a single-month snapshot. Data from California’s EDD report shows the pressure on studios and production houses has been persistent and consistent throughout the period.

Los Angeles Absorbs the Deepest Cut
Research adds another layer to that worker risk. Workers who resist AI tools face layoff odds triple those of peers who integrate them. The pattern holds across sectors.
Animators face a difficult choice. They must adopt the technology displacing their role, or risk losing it for not adapting.
Similarly, the disruption extends beyond film. AI already reshaped hiring in the gambling sector this year. Tech workers seeking crypto roles as an automation hedge signal anxiety spreading across knowledge-worker industries.
Filmmakers now say the 90% cost reduction is achievable today, not a future projection. How many more production roles disappear before the industry finds a new equilibrium remains the open question.
The post AI Cuts Animation Costs by 90% as Hollywood Braces for Mass Layoffs appeared first on BeInCrypto.

Ethena’s governance token ENA has climbed after BlackRock integrated the project’s synthetic dollar USDe into its Aladdin investment platform, extending institutional access to a system used to oversee more than $20 trillion in assets.
Summary
- BlackRock has integrated Ethena’s USDe into its Aladdin platform, expanding institutional access to the synthetic dollar.
- ENA rose as much as 12% following the announcement, outperforming the broader crypto market despite Bitcoin trading below $60,000.
- StablecoinX founder Ted Chen said the integration opens USDe to institutions managing more than $20 trillion through Aladdin.
According to a June 29 X announcement from Ethena, the integration enables financial institutions using BlackRock’s Aladdin platform to access USDe through their existing investment and risk management workflows.
The company said the collaboration gives institutions connected to Aladdin a new route to allocate capital to the synthetic dollar while managing positions within the same platform.
BlackRock has expanded its relationship with Ethena
Alongside the USDe integration, Ethena confirmed that BlackRock’s tokenized money market fund BUIDL will become the primary reserve asset for its white-label product. The companies already work together through USDtb, Ethena’s stablecoin backed mainly by BUIDL, making the latest announcement an expansion of an existing relationship rather than a new partnership.
Ethena also said it will provide a liquidity facility for BlackRock’s tokenized products. The company did not disclose financial terms or a launch timeline but described the arrangement as another step in connecting tokenized assets with institutional infrastructure.
The announcement follows several deals involving Ethena’s stablecoin business this month. Earlier, the company selected Centrifuge as its tokenization partner and entered an agreement with global asset manager Janus Henderson. As part of that collaboration, Janus Henderson committed to invest in ENA, Ethena’s governance token.
Another recent milestone came after StablecoinX completed its merger with TLGY Acquisition Corp., allowing the Ethena-focused infrastructure company to begin trading on Nasdaq under the ticker USDE.
The company said its public warrants started trading under the symbol USDEW on June 26 following the completion of the business combination a day earlier. The listing provides public-market investors with direct exposure to StablecoinX’s Ethena-focused strategy even as demand for USDe remains below last year’s peak.
ENA has outperformed the broader crypto market
As per data from crypto.news, Ethena (ENA) price rose 12% to $0.083 shortly after the BlackRock announcement before easing to around $0.081, leaving the token about 7% higher on the day. The gain came while the wider cryptocurrency market remained under pressure, with Bitcoin trading below $60,000.
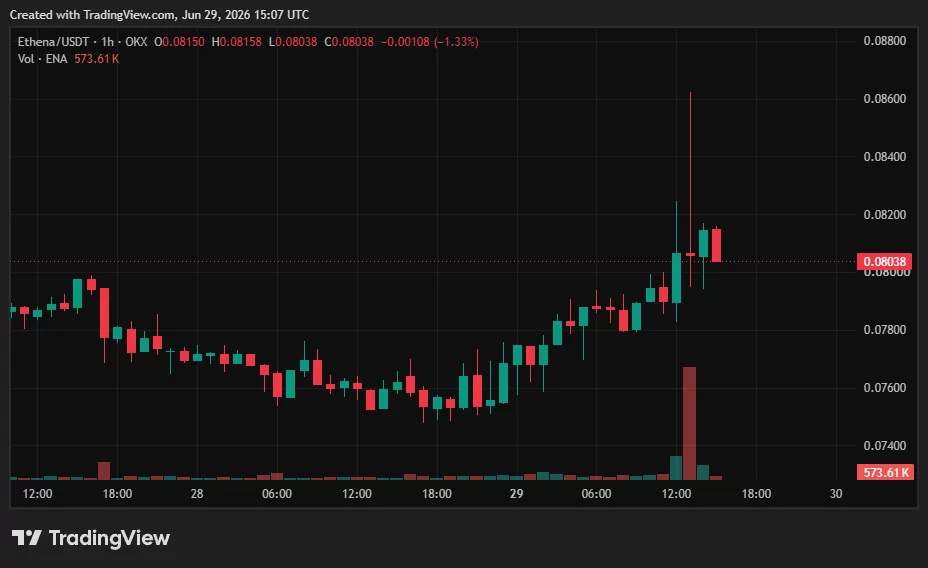
Part of the positive reaction may be linked to Ethena’s fee-switch mechanism. Under the project’s design, a share of protocol revenue is allocated toward buying back ENA, meaning increased activity around USDe could benefit the governance token over time.
Commenting on the announcement, StablecoinX founder Ted Chen said the Aladdin integration significantly increases USDe’s institutional reach because insurers, pension funds and major asset managers already rely on the platform. He noted that organizations including Deutsche Bank and Citi use Aladdin to oversee portfolios.
“That’s over $20 trillion in assets that these managers have on the Aladdin platform. Now, all of these managers will have the ability to not only allocate to USDe, but also seamlessly integrate it into their existing portfolio management and risk analytics processes.”
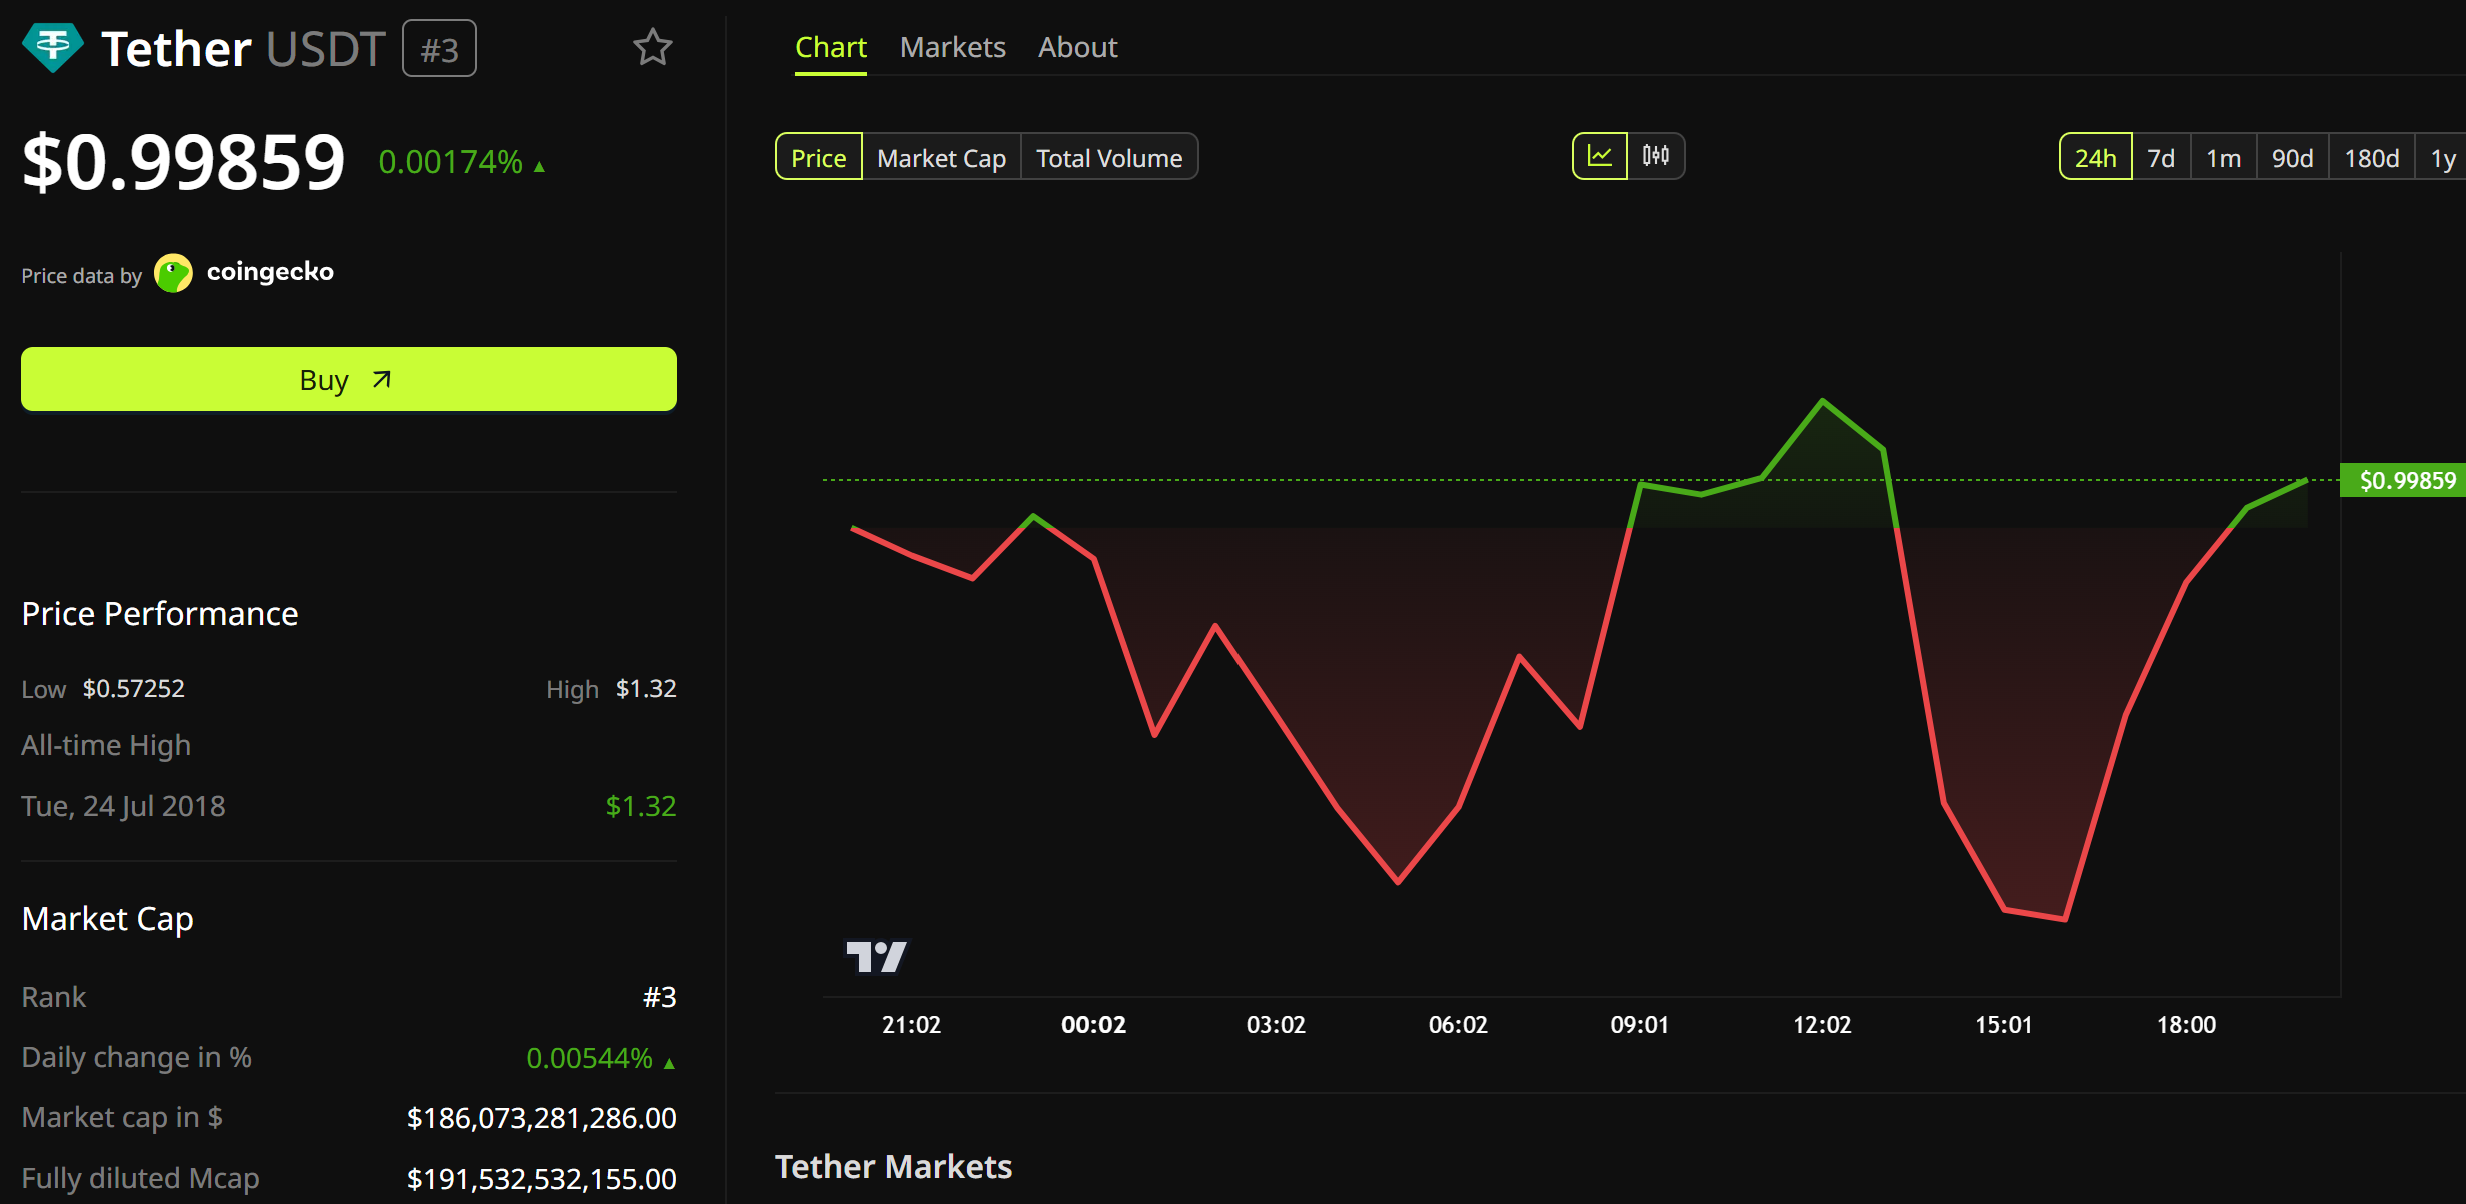
Ukraine has placed more than $8.3 million in seized crypto under state management, the first time the country has moved confiscated digital assets into a government-controlled wallet.
The National Agency for Finding, Tracing, and Management of Assets, known as ARMA, received the funds from wallets tied to an alleged member of an international hacking group.
Seized Crypto from an International Hacking Case
The holding is Tether (USDT), the largest stablecoin, valued at over 372 million Ukrainian hryvnias at the time of the transfer, according to prosecutors.
Investigators say the group attacked people and companies across Europe and the United States. The case reflects a rise in stablecoin-driven crypto crime.
The attackers stole confidential data, demanded ransom payments, and laundered the money in Ukraine through real estate and cars.
Authorities estimate the network caused more than $100 million in damage. The pattern mirrors other crypto laundering networks that ended in multiple arrests.
Four suspects, including the alleged organizer, remain in custody. Total seizures in the case topped $11.1 million, covering homes, apartments, vehicles, and cash.
What State Custody Means for the Funds
Until now, crypto seized in Ukrainian cases sat frozen, with no agency actively holding or moving it. The transfer gives ARMA direct control of the wallet.
A 2025 reform law overhauled how ARMA manages seized property, adding independent audits and tighter oversight. The change was a condition of hundreds of millions of euros in European Union support.
The step stops short of confiscation, which requires a court conviction. For now, the agency holds the assets rather than owning them.
USDT sits near its dollar peg, trading close to $1. That gives ARMA a relatively stable asset to manage, hold, or eventually sell.

A stablecoin avoids the price swings tied to bitcoin, making the holding easier to value. But USDT is centrally controlled, and Tether can freeze tokens at law enforcement requests.
Follow us on X to get the latest news as it happens
What to do with seized crypto has split governments. The United States ordered forfeited Bitcoin into a strategic reserve it pledged not to sell. It treats confiscated coins as a long-term asset.
Germany took the opposite path, and critics still debate its seizure of Bitcoin sales after prices later climbed.
Ukraine has not said whether it will sell the USDT or hold it. That choice may shape how it treats future seizures, and whether seized tokens become state revenue.
The post Ukraine Moves $8.3 Million in Seized Crypto Under State Management appeared first on BeInCrypto.

Disclosure: This article does not represent investment advice. The content and materials featured on this page are for educational purposes only.
MoneySimpler promotes passive income strategies for ETH, USDT, and USDC holders through AI-driven digital asset utilization tools.
Summary
- MoneySimpler offers AI-driven automated strategies for ETH, USDT, and USDC holders to generate passive income.
- MoneySimpler uses 24/7 AI quantitative trading to analyze markets and automate digital asset management.
- MoneySimpler enables simple, automated crypto strategies for ETH, USDT, USDC, and BTC with real-time tracking.
For those who hold ETH, USDT, or USDC, they might have wondered: besides waiting for prices to rise, can these digital assets create more value?
In recent years, more and more digital asset investors have begun exploring new avenues for passive income. From staking and DeFi to AI-automated trading, the focus is no longer just on asset prices but on how to more effectively utilize funds to ensure that the digital assets they hold continue to generate value.
MoneySimpler provides daily passive income for ETH, USDT, and USDC holders through an intelligent and automated asset management model.

How can automated strategies help improve returns on assets?
The digital asset market operates 24/7, and more and more investors want to reduce the time costs of frequent market monitoring and manual trading while simultaneously increasing asset returns.
MoneySimpler uses an AI-powered quantitative trading system to continuously analyze the market and automatically execute corresponding processes based on preset strategies, helping users to use quantitative trading more conveniently and improve their returns.
The main features of the platform include:
- Automated operation 24/7, no need for frequent market monitoring
- Intelligent quantitative strategies continuously analyze market changes
- Supports mainstream digital assets such as ETH, USDT, USDC, and BTC
- Allows users to view account status, profit records, and asset information at any time
- Simple operation process, no complex trading experience required
How to get started with MoneySimpler?
MoneySimpler is dedicated to simplifying the AI-driven quantitative trading process. Users can quickly start AI-automated trading without programming, building a trading system, or constantly monitoring the market.
Step 1: Register an Account
Upon completing account registration, new users will receive a $10 sign-up bonus and a $50 trial fund to experience the platform’s AI-powered automated trading features.
Step 2: Choose a Trading Plan
Select a suitable trading plan based on needs and complete asset allocation using cryptocurrency. (Minimum investment starts from $100)
Examples of popular contracts
Basis Arbitrage Strategy: Invest $100, 2-day period, daily return $4, total return at maturity $100 + $8
Digital Asset Trend Tracking 2.05: Invest $600, 5-day period, daily return $7.5, total return at maturity $600 + $37.5
Digital Asset Trend Tracking 2.1: Invest $1,100, 10-day period, daily return $14.3, total return at maturity $1100 + $143
Trend Tracking 2.1: Invest $5,000, 20-day period, daily return $70.5, total return at maturity $5,000 + $1,410
Inter-Exchange Arbitrage 3.5: Invest $12,000, 30-day period, daily return $153, total return at maturity $10,000 + $4,590
Cryptocurrency Statistical Arbitrage Strategy 2.45: Invest $100,000, 40-day period, daily return $1,950, total return at maturity $100,000 + $78,000
For more strategy details, please visit the MoneySimpler website.
Step 3: Activate AI-Automated Trading.
After selecting the corresponding trading contract, daily profits will be automatically settled into an account. The AI system will automatically run the corresponding strategy and execute trades based on market changes.
A secure and transparent smart quantitative trading platform
For digital asset users, a platform’s security, transparency, and compliance are often just as important as profit opportunities.
MoneySimpler continuously improves its platform security system and adheres to international digital asset management standards to provide users with more reliable intelligent quantitative services.
The platform’s security and compliance system includes:
- Compliant with the UK Financial Conduct Authority and the EU MiCA (Mini-Assets Framework) standards for crypto assets;
- Quarterly earnings audits by PwC;
- Lloyd’s of London provides insurance coverage for the platform’s funds;
- Cloudflare and McAfee provide enterprise-grade cybersecurity and real-time security protection.
With a robust compliance, security, and risk control system, MoneySimpler is committed to providing global ETH, USDT, and USDC holders with a safer, more transparent, and intelligent quantitative asset management experience.
Summarize
The development of the digital asset market is driving investors to shift from “long-term holding” to “enhancing asset profitability.”
For users holding ETH, USDT, or USDC, MoneySimpler offers a smarter, automated asset management approach, allowing idle digital assets to generate more value.
Register an account now on the Money Simpler official platform, claim new user rewards, experience AI-powered quantitative trading, and start the daily passive income journey.
Disclosure: This content is provided by a third party. Neither crypto.news nor the author of this article endorses any product mentioned on this page. Users should conduct their own research before taking any action related to the company.

TLDR:
- Solana RWA distributed asset value climbed to $3.03B after posting a 13.2% increase over 30 days.
- Monthly RWA transfer volume surged 120.5% to $8.53B, marking the fastest-growing network metric.
- RWA holders reached 290,481 after growing 24.4% in one month, showing wider ecosystem participation.
- Solana stablecoin market cap rose to $15.77B, supporting liquidity across the expanding RWA market.
Solana’s real-world asset market continues to expand as fresh on-chain data points to stronger activity across tokenized assets.
The latest figures show higher asset values, growing participation, and a sharp rise in transfer volume. Stablecoins also remain a major source of liquidity across the network. The new metrics highlight steady growth across multiple parts of the Solana ecosystem.
Solana RWA Ecosystem Records Higher Asset Value and User Growth
Data shared by Everstake shows the Solana RWA ecosystem reached $3.03 billion in distributed asset value. That marks a 13.2% increase over the past 30 days.
The same dataset shows the number of RWA holders climbed to 290,481. Monthly holder growth reached 24.4%, indicating broader participation in tokenized assets.
Transfer activity expanded even faster. Solana recorded $8.53 billion in 30-day RWA transfer volume, representing a 120.5% increase from the previous month.
Everstake highlighted transfer volume as the strongest metric during the latest reporting period. The figures suggest assets moved across the network at a much faster pace than before.
The platform also reported 2,115 tokenized real-world assets operating on Solana. Represented asset value stood at $125.86 million during the same period.
Stablecoins Continue Powering Solana RWA Market Activity
Stablecoins remained the largest segment supporting the Solana RWA market. Network data placed the total stablecoin market capitalization at $15.77 billion, up 3.43% over 30 days.
Stablecoin transfer volume reached $487.08 billion during the month. Activity increased 3.59%, even as stablecoin holders declined 7.77% to 10.95 million.
The league table published alongside the data ranked Circle as the largest platform by asset value. Circle accounted for approximately $7.1 billion across three supported asset classes.
Tether Holdings followed with roughly $3.8 billion, while Paxos ranked third at $1.4 billion. BitGo, Securitize, Anchorage Digital Bank, Ethena, Ctrl Alt, Solstice, and Ondo completed the top ten.
Among individual assets, USDC remained the largest tokenized product on Solana with nearly $6.97 billion in distributed value. USDT followed at about $3.77 billion, while BitGo’s USD1 exceeded the $1 billion mark.
Other leading products included Anchorage Digital Bank’s USDGO, Paxos-issued PYUSD, and Securitize’s BlackRock USD Institutional Digital Liquidity Fund.
According to Everstake’s published figures and the accompanying Solana RWA dashboard, stablecoins continue to dominate network value while tokenized treasuries, private equity, and corporate credit products steadily expand their presence.

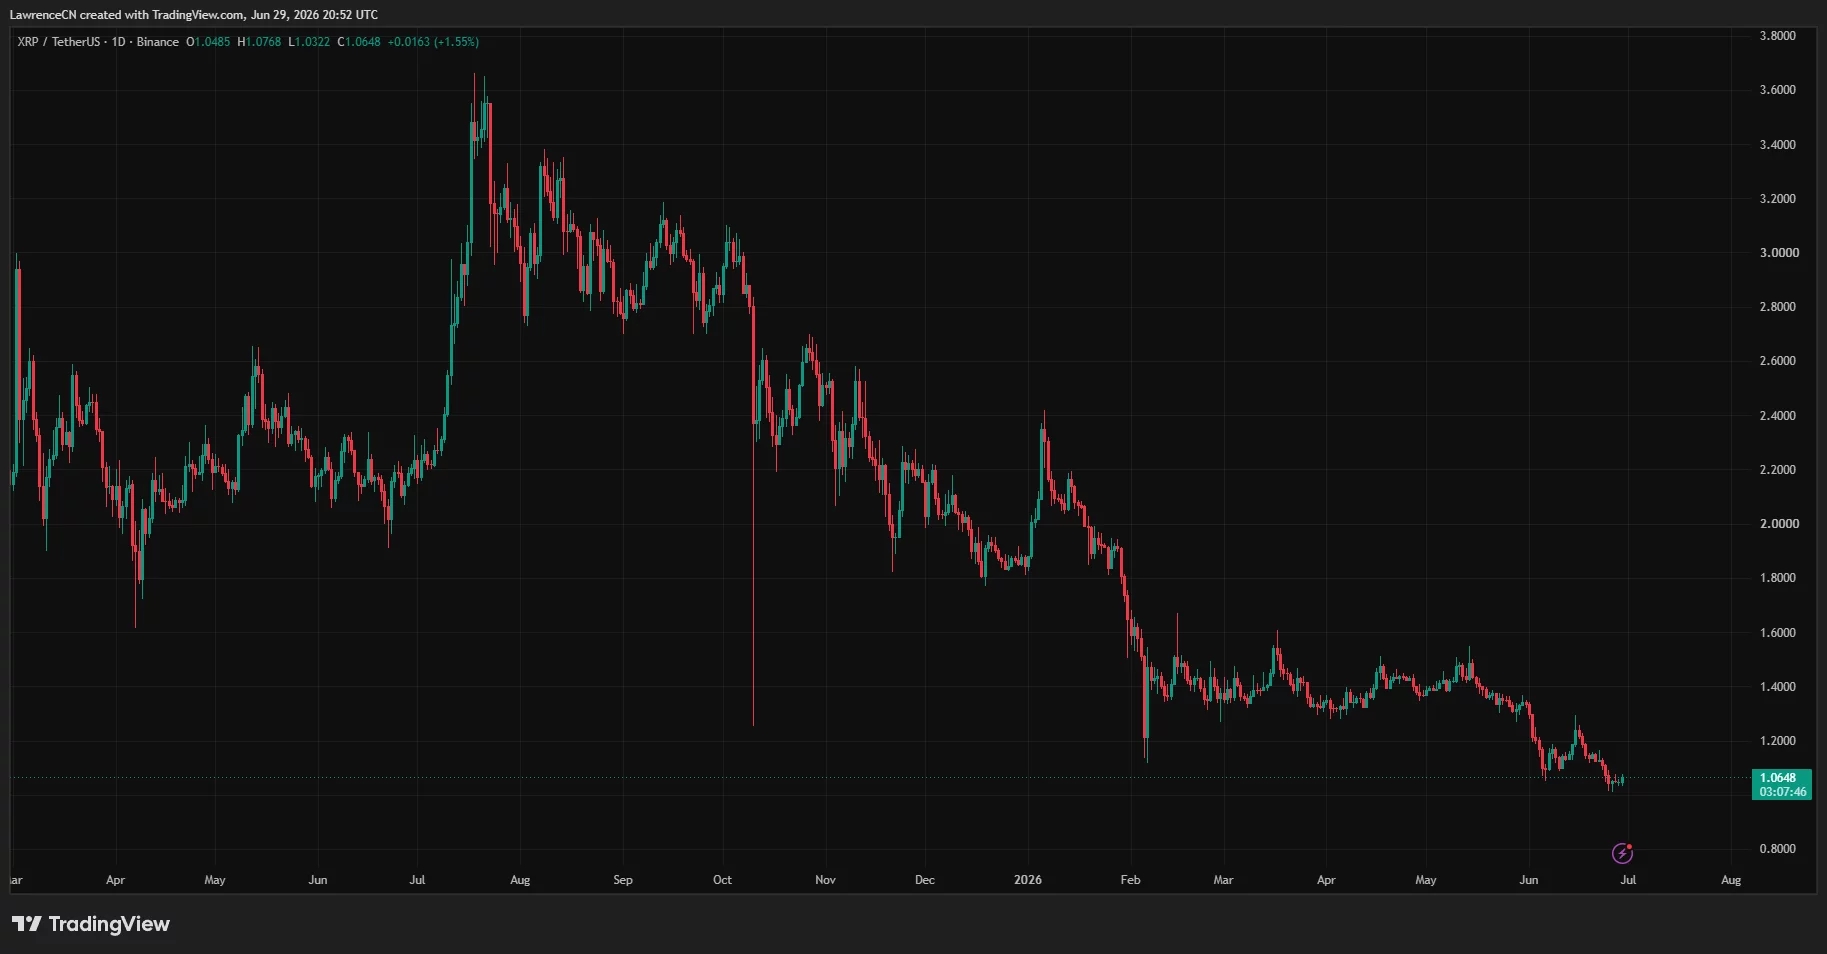
XRP has slid to around $1, down from its $3.66 high last year, with retail in fear even as whale wallets hit record highs. Where could it finish 2026? Credible forecasts run from below $1 to $8, and the gap comes down to one question. Here is what would push XRP to each level, and which path looks most defensible.
Summary
- XRP trades near $1.04 as of late June 2026, down from a July 2025 cycle high near $3.66, with relative strength near oversold and moving averages around $1.13 to $1.14 sitting overhead as resistance.
- The forecast range for year-end 2026 is unusually wide: bearish models point below $1, conservative models to roughly $1.40 to $1.80, Standard Chartered to $2.80, and bullish publishers toward $4.36 to $8.
- Standard Chartered’s Geoffrey Kendrick cut his year-end target from $8 to $2.80 while keeping a $28 call for 2030, capturing the split between near-term caution and long-term conviction.
- The entire range turns on one question: whether the XRP token itself, not just Ripple’s network, captures the cross-border payment and settlement volume flowing through it.
- A move to $2 or $3 needs stabilization, ETF support, and better sentiment, while $5 or higher needs a genuine shift in market structure and proven token utility.
XRP (XRP) is trading near $1.04 as of late June 2026, and for holders it has been a deeply frustrating year: the token has cleared nearly every obstacle its community spent years waiting for, yet the price has done close to nothing but fall. XRP is down from a cycle high near $3.66 reached in July 2025, having declined through the back half of last year and the first half of this one, and it now sits roughly a third below where it began 2026.

The technical picture is heavy. The relative strength index hovers near 30, at the lower boundary where downtrends sometimes exhaust themselves, and the 50-day and 200-day moving averages cluster overhead around $1.13 to $1.14, acting as the resistance XRP must reclaim to change its trend. Sentiment is weak, with retail traders fearful, even as on-chain data shows whale wallet counts at record highs, a contrarian split in which large holders appear to be accumulating while smaller holders capitulate. The question this article addresses is where that leaves XRP at the end of 2026, and the honest answer is that the credible range is enormous.
That range, from below $1 to $8, is not a sign of lazy forecasting; it reflects a real and unresolved disagreement about what XRP fundamentally is and whether its token captures value. This article works through the question methodically: where XRP stands and how it got here, the bearish case for a finish below $1, the base case in the $1.40 to $2.80 zone, the bullish case for $4 to $8, the meaning of Standard Chartered’s high-profile cut from $8 to $2.80, the enormous valuation gap that Bitwise’s own model reveals, the catalysts that could actually move the price, and three concrete scenarios for year-end.
Throughout, the goal is to show what each outcome requires rather than to pick a number, because XRP’s path depends on variables that genuinely could resolve in very different directions. The forecasts here are information, not advice, and the single most useful thing to carry through the piece is the question underneath every target: does XRP the token capture the volume that Ripple the company is winning, or does the value accrue elsewhere? Almost everything about the price follows from the answer.
Where XRP stands and how it got here
To judge where XRP might end 2026, you need the recent history, because XRP’s price has been driven as much by legal and structural events as by market cycles. The token spent years under the shadow of the United States Securities and Exchange Commission lawsuit against Ripple, and that case formally concluded in 2025, establishing that XRP is not a security when sold on exchanges and removing the single largest overhang on the token.
On the back of the resolution and a friendlier regulatory climate, XRP surged to a cycle high near $3.66 in July 2025, approaching the kind of levels its long-suffering community had anticipated for years. Spot XRP exchange-traded funds launched in November 2025 and drew over $1 billion in net inflows, another long-awaited milestone. By the standards of what the community had been waiting for, 2025 delivered nearly the full checklist.
And yet the price has fallen steadily since. From the July 2025 high near $3.66, XRP declined through the rest of the year and into 2026, sliding to around $1.04 by late June against a backdrop of broad crypto weakness. The frustration in the XRP community is precisely that the token cleared every hurdle and still dropped, which has fueled a debate about whether the good news was already priced in, whether broader market conditions simply overwhelmed XRP’s catalysts, or whether something more structural is limiting how much value flows to the token.
The current setup reflects that tension: XRP is liquid and actively traded, whale wallets are accumulating at record levels in what looks like strategic positioning, but retail sentiment is fearful, and the chart is below its key moving averages. The token sits at a level that is either a coiled accumulation base before the next move higher or a waypoint in a continued decline, and which one it is depends on the catalysts and the value-accrual question explored below. The history matters because it shows XRP has already spent its biggest bullish catalysts, the legal resolution and the ETF launch, which raises the bar for what it takes to push the price meaningfully higher from here.
The bearish case: a finish below $1
The case for XRP ending 2026 below $1 is grounded in both technicals and a structural skepticism that deserves to be taken seriously. Technically, XRP trades below its key moving averages near $1.13 to $1.14, and a market that cannot reclaim those levels is, by definition, still in a downtrend. Several model-based and technical forecasting systems remain bearish on XRP, with some, such as Gov Capital and WalletInvestor, projecting outright losses over a 1-year horizon, treating recent weakness as part of a broader risk pattern rather than a dip to be bought. If macro conditions deteriorate, whether through a broad crypto downturn, a risk-off shift in markets, or disappointing follow-through on ETF flows, XRP could test and break its current support, with technical analyses pointing to downside levels in the low-$1 range and below if the bearish trend persists.
The deeper bearish argument is structural and connects to the value-accrual question at the heart of this piece. Skeptics contend that Ripple’s commercial success, its growing roster of financial-institution partnerships and its cross-border payments business, does not necessarily translate into demand for the XRP token, because much of Ripple’s settlement activity can be conducted without participants holding XRP for any meaningful duration, and because Ripple’s own dollar stablecoin offers an alternative settlement instrument that does not require the token at all. In this reading, XRP could remain a liquid, speculative asset whose price is driven by sentiment and trading rather than by genuine, sustained utility demand, and absent a clear mechanism forcing value into the token, it could drift lower or stagnate even as Ripple thrives as a company.
The bearish case, then, is not merely a chart pattern; it is a thesis that XRP the token may be structurally disconnected from the network’s success, and that a finish below $1 is what happens if the market comes to share that view while macro conditions stay unsupportive.
The base case: $1.40 to $2.80
The base case, where a plurality of serious forecasts cluster, sees XRP recovering modestly to somewhere between roughly $1.40 and $2.80 by year-end, and it rests on a more balanced set of assumptions. Conservative, model-driven forecasters such as CoinCodex and Changelly project XRP in the $1.40 to $1.80 area, with Changelly specifically modeling a December range around $1.29 to $1.55 and an average near $1.42.
These forecasts assume XRP stabilizes, reclaims some lost ground as the broader market steadies, and benefits from continued but not explosive ETF interest, without breaking decisively above its major resistance levels. This is essentially a recovery-without-breakout scenario: XRP stops falling, grinds back toward and through its moving averages, but does not enter a new bull phase.
The upper end of the base case is anchored by the most-watched institutional forecast on XRP. Geoffrey Kendrick at Standard Chartered, after cutting his target, places XRP’s year-end 2026 level at $2.80, a number that sits deliberately between the cautious algorithmic models and the more bullish crypto-publisher calls. That $2.80 figure has become a useful benchmark precisely because it comes from a major bank instead of from automated technical models or retail-facing commentary, and it implies meaningful recovery from current levels without requiring a structural transformation in how XRP captures value.
The base case overall assumes that XRP’s concluded legal status, its live ETFs, and its institutional relationships provide enough of a foundation for a recovery toward the $1.40 to $2.80 band, supported by moderate ETF inflows and a stable-to-improving macro environment, but that the bigger moves toward $5 and beyond require catalysts that are not yet in evidence. For a token that has spent its largest bullish events already, a base-case recovery into the low-single-digits is a reasonable central expectation, and it is where the weight of credible forecasting sits.
The bullish case: $4 to $8
The bullish case for XRP reaching $4 to $8 by year-end is not fringe; it has institutional roots, but it requires conditions that go well beyond a general crypto rebound. The bullish group of forecasts starts near $4.36 and extends above $6, drawing on sources including PricePrediction.net, Telegaon, and commentary such as Dominic Basulto at The Motley Fool, who has floated $5 for XRP in 2026 with asset tokenization as a potential catalyst.
At the top of the credible bull range sits Standard Chartered’s original $8 target for 2026, which Kendrick held before cutting it and which was predicated on sustained ETF inflows and the regulatory clarity following the SEC settlement. The common thread is that these higher targets all assume XRP converts its structural advantages, concluded legal status, live ETFs, and Ripple’s institutional footprint, into real, sustained demand for the token.
What would it actually take to get there? The bullish case requires several things to align: ETF inflows would need to accelerate substantially, with some bullish models assuming flows climbing toward the multibillion-dollar range that Standard Chartered modeled as the trigger for its higher targets; the CLARITY Act or similar legislation would need to pass and codify XRP’s commodity status, unlocking institutional capital that has stayed on the sidelines; Ripple’s expanding use of XRP in cross-border settlement and its banking ambitions would need to translate into demonstrable token demand; and the broader market would likely need an altcoin-favorable phase instead of the current Bitcoin-dominated, risk-off mood.
The cleanest way to summarize it, echoing the analysts who have studied the range, is that a move toward $2 to $3 requires stabilization, ETF support, and better sentiment, while a move toward $5 or higher requires a stronger shift in market structure, institutional demand, and proven token utility. The bull case is achievable, but it is conditional on XRP answering the value-accrual question in the affirmative, which is exactly what remains unproven.
Why Standard Chartered cut from $8 to $2.80
The most instructive single event in XRP’s forecast landscape this year is Standard Chartered’s revision, because it crystallizes the shift from hope to realism. Geoffrey Kendrick, the bank’s digital-assets research lead, had previously set an $8 year-end 2026 target for XRP, a number that implied a large rally and was anchored in expectations of sustained ETF inflows and the post-settlement regulatory clarity.
As the year progressed and XRP failed to sustain the more aggressive assumptions priced into that forecast, Kendrick cut the year-end target to $2.80. The revision fit the broader weakness seen across crypto in 2026 and reflected that the catalysts, while real, were not translating into price at the pace the original target assumed. The cut matters because it came from a credible institutional source recalibrating to reality instead of from a perma-bear or a hype account, which makes the new $2.80 figure a more grounded benchmark than the targets above it.
Crucially, Kendrick left his longer-term call untouched: he kept a $28 target for XRP by 2030 even as he slashed the near-term number. That juxtaposition, $2.80 by year-end but $28 by 2030, captures the defining feature of serious XRP analysis, which is a split between near-term caution and long-term conviction. The long-term bull case rests on XRP becoming a major institutional settlement asset as Ripple’s banking and cross-border infrastructure matures, a process measured in years instead of months.
The near-term caution reflects that, right now, those flows have not materialized at the scale needed to drive the price, and the token remains hostage to sentiment and macro conditions. For anyone trying to forecast year-end 2026 specifically, the lesson of the Standard Chartered cut is sobering: even a committed long-term bull at a major bank concluded that the near-term path was far more modest than the $8 he once projected, and $2.80 now functions as the credible ceiling of the base case instead of the floor of the bull case.
The valuation gap that defines XRP
If one piece of analysis captures why XRP forecasts diverge so violently, it is the valuation work from the asset manager Bitwise, which ran XRP through a formal model and produced 2030 outcomes ranging from roughly $0.13 at the bottom to above $29 at the top. That is more than a 200-fold gap between the same firm’s bearish and bullish cases for the same token, and it sounds absurd until you see what drives it. The entire spread rests on a single assumption: whether XRP the token captures a meaningful chunk of the cross-border payment and settlement volume that Ripple is winning. Bitwise’s high case assumes it does, with XRP becoming the bridge asset that institutional value routes through; its low case assumes it does not, with banks sticking to existing systems and dollar stablecoins, including Ripple’s own, moving the money instead while XRP is bypassed.
This is the question underneath every XRP price target, and it is why the same catalysts can be read as wildly bullish or quietly bearish. Standard Chartered’s $28 by 2030 and the high single-digit-to-low-teens targets from other analysts all quietly lean on the assumption that the token captures the volume; the bearish models assume it does not.
The reason the question is so hard to settle is that Ripple can and does conduct much settlement activity without participants holding XRP for long, and its dollar stablecoin offers a token-free alternative, so the mechanism by which network success forces sustained demand into XRP is contested instead of obvious. For year-end 2026, the practical implication is that XRP’s price will be driven less by any single catalyst than by how the market’s collective answer to this question evolves. If confidence grows that the token captures the volume, the higher targets come into reach; if doubt deepens, the lower ones do. Everything else- the ETF flows, the legislation, the partnerships- ultimately feeds into that one judgment, which is why the credible forecast range is a chasm instead of a band.
The catalysts that could move XRP
Several concrete catalysts could push XRP toward one end of the range or the other before year-end, and watching them is more useful than fixating on a target. The 1st is the CLARITY Act and the broader regulatory picture. Passage of legislation codifying XRP’s commodity status into law, instead of leaving it resting on the concluded lawsuit, could unlock institutional capital that has stayed cautious, and XRP is widely seen as a beneficiary alongside other payment-focused tokens.
The 2nd is ETF flows. The spot XRP ETFs that launched in late 2025 are central to any serious forecast, because they remove supply from exchanges as providers accumulate, and the trajectory of their inflows, whether they reaccelerate toward the multibillion-dollar levels bulls assume or stagnate, will heavily influence the price. The 3rd is Ripple’s own business: its expanding use of XRP in cross-border corridors, its banking and custody ambitions, and the growth of its dollar stablecoin, which cuts both ways by validating Ripple while offering a token-free settlement path.
The 4th set of catalysts is macro and market structure: the Federal Reserve’s policy path, broad crypto liquidity, Bitcoin’s behavior, and whether the market rotates into altcoins or stays concentrated in Bitcoin. XRP, like most altcoins, tends to need a risk-on, altcoin-favorable environment to sustain large moves, and the current Bitcoin-dominated, fearful market has been a headwind.
The contrarian signal worth watching is the divergence between record whale accumulation and fearful retail sentiment, which historically can precede a reversal if the large holders prove right, though it can also simply reflect long-term holders averaging into a continued decline.
The honest framing is that these catalysts are real, but their effects are conditional, and none of them individually guarantees a direction; collectively, they will determine whether XRP’s year-end print lands in the bearish, base, or bullish zone. For a token that has already spent its biggest catalysts, the marginal mover from here is most likely the combination of ETF-flow momentum and the market’s evolving answer to the value-accrual question.
Three scenarios for XRP at year-end 2026
Drawing the analysis into scenarios clarifies the range. In the bull scenario, XRP finishes 2026 somewhere between $4 and as high as $8. This requires ETF inflows to accelerate meaningfully, the CLARITY Act or similar to pass and unlock institutional capital, an altcoin-favorable market phase to arrive, and growing confidence that XRP the token genuinely captures Ripple’s settlement volume. It is the path the most bullish credible forecasts describe, and it depends on the value-accrual question resolving in XRP’s favor while macro conditions turn supportive. It is achievable but conditional, and the bar is high given that XRP has already spent its legal and ETF-launch catalysts.
In the base scenario, the most heavily populated by serious forecasts, XRP recovers modestly to roughly $1.40 to $2.80. Support holds, the broader market steadies, ETF interest continues at a moderate pace, and XRP grinds back toward and possibly through its key moving averages without entering a new bull phase, with Standard Chartered’s $2.80 marking the credible upper edge. This recovery-without-breakout outcome fits the weight of model-based and institutional forecasting and is arguably the most likely central case. In the bear scenario, XRP finishes below $1. Macro conditions deteriorate, or ETF flows disappoint; the market comes to doubt that the token captures the network’s volume, support breaks, and XRP drifts lower as the structural skeptics’ thesis gains traction, validating the bearish models that project outright losses.
Which scenario unfolds depends primarily on ETF-flow momentum, regulatory progress, the macro backdrop, and above all the market’s evolving judgment on whether XRP the token captures the volume Ripple is winning. All 3 are live, and the wide gap between them is the most honest description of where XRP stands.
Frequently Asked Questions
Where could XRP end 2026?
The credible range is unusually wide, from below $1 to $8. Bearish models and some technical systems point below $1 if support breaks and the market doubts the token captures value. The base case, where most serious forecasts cluster, sees a modest recovery to roughly $1.40 to $2.80, with Standard Chartered’s $2.80 as the credible upper edge. The bullish case of $4 to $8 requires accelerating ETF inflows, regulatory progress, an altcoin-favorable market, and growing confidence that XRP captures Ripple’s settlement volume. The outcome depends on those catalysts and, above all, on the market’s evolving answer to whether the token, not just the network, captures value.
Why has XRP fallen to $1?
XRP is down from a July 2025 cycle high near $3.66, sliding through the back half of last year and the first half of 2026 amid broad crypto weakness. Part of the frustration is that XRP cleared its biggest catalysts: the SEC lawsuit concluded in 2025, and spot ETFs launched that November, yet the price still fell, which suggests the good news may have been priced in or overwhelmed by market conditions. The deeper question is structural: skeptics argue Ripple’s commercial success does not necessarily force sustained demand into the XRP token, especially with Ripple’s own dollar stablecoin offering a token-free settlement path. That value-accrual doubt, plus a Bitcoin-dominated risk-off market, has weighed on the price.
Why did Standard Chartered cut its XRP target?
Geoffrey Kendrick, Standard Chartered’s digital-assets research lead, had set an $8 year-end 2026 target for XRP based on expectations of sustained ETF inflows and post-settlement regulatory clarity. As 2026 progressed and XRP failed to sustain the aggressive assumptions behind that number, he cut the year-end target to $2.80, fitting the broader crypto weakness this year. Notably, he kept his $28 target for 2030 unchanged, which captures the split in serious XRP analysis between near-term caution and long-term conviction. The cut matters because it came from a credible institutional bull recalibrating to reality, which makes $2.80 a grounded benchmark and the effective ceiling of the base case instead of the floor of the bull case.
Can XRP reach $5 or more in 2026?
It is possible but conditional on several things aligning. The bullish forecasts of $4.36 to $8 assume ETF inflows accelerate substantially, the CLARITY Act or similar passes and unlocks institutional capital, the market rotates into an altcoin-favorable phase, and XRP demonstrably converts Ripple’s settlement footprint into sustained token demand. As analysts who have studied the range put it, a move to $2 to $3 needs stabilization, ETF support, and better sentiment, while $5 or higher needs a stronger shift in market structure, institutional demand, and proven token utility. The bar is high because XRP has already spent its biggest catalysts, so reaching the bull range requires new, larger drivers instead of a simple market rebound.
What is the value-accrual question for XRP?
It is the single question underneath every XRP price target: whether the XRP token itself, not just Ripple’s network, captures the cross-border payment and settlement volume flowing through it. Bitwise’s formal model shows why it matters so much, producing 2030 outcomes from about $0.13 to above $29, a more than 200-fold gap driven entirely by this assumption. The high case assumes XRP becomes the bridge asset institutional value routes through; the low case assumes banks and dollar stablecoins, including Ripple’s own, move the money while XRP is bypassed. Because Ripple can conduct much settlement without participants holding XRP for long, the mechanism forcing demand into the token is contested, which is why forecasts diverge so violently.
Are whales accumulating XRP?
On-chain data shows XRP whale wallet counts at record highs even as retail sentiment sits in fear, a contrarian divergence in which large holders appear to be accumulating while smaller holders capitulate. Bulls read this as strategic positioning ahead of a potential reversal, on the logic that large, informed holders are buying weakness. The cautionary reading is that record whale accumulation can also reflect long-term holders averaging into a continued decline that does not reverse on schedule, so it is a supportive signal instead of a guarantee. It is one of the more constructive data points in XRP’s current setup, but like every catalyst here, its payoff depends on the broader market and the value-accrual question resolving
This article is information, not financial or investment advice. XRP price levels, indicator readings, and analyst forecasts reflect data available as of June 28, 2026, are point-in-time, and can change rapidly. Cryptocurrency is highly volatile, and you can lose money. Price predictions are inherently uncertain, and the scenarios described are not guarantees. Do your own research and consult a qualified financial professional before making any investment decision.
South Korean brokerage Kiwoom Securities is reportedly in talks to buy a stake in Bithumb, making it the latest traditional financial firm in the country to seek exposure to a local crypto exchange.
The two companies are reportedly discussing a third-party allotment of new shares that would allow Kiwoom Securities to acquire new shares issued by Bithumb, Chosun Biz reported on Monday.
Cointelegraph contacted Kiwoom Securities and Bithumb for comment on the reported talks.
The development makes Kiwoom Securities the latest traditional finance (TradFi) company to seek entry into the crypto markets as South Korea’s Financial Services Commission (FSC) prepares to announce new regulatory reforms in July, including a framework for tokenized securities, as the country prepares to bring them under its capital markets framework from 2027.
The developments are part of the amended Capital Markets Act and Electronic Securities Act, the country’s first tokenized securities framework, scheduled to take full effect on Feb. 4, 2027.
On Wednesday, the FSC folded token securities infrastructure into a broader overhaul of the country’s capital markets, as part of its efforts to modernize traditional financial markets and potentially bring blockchain-based investment products closer to systems used for mainstream securities settlement and trading.

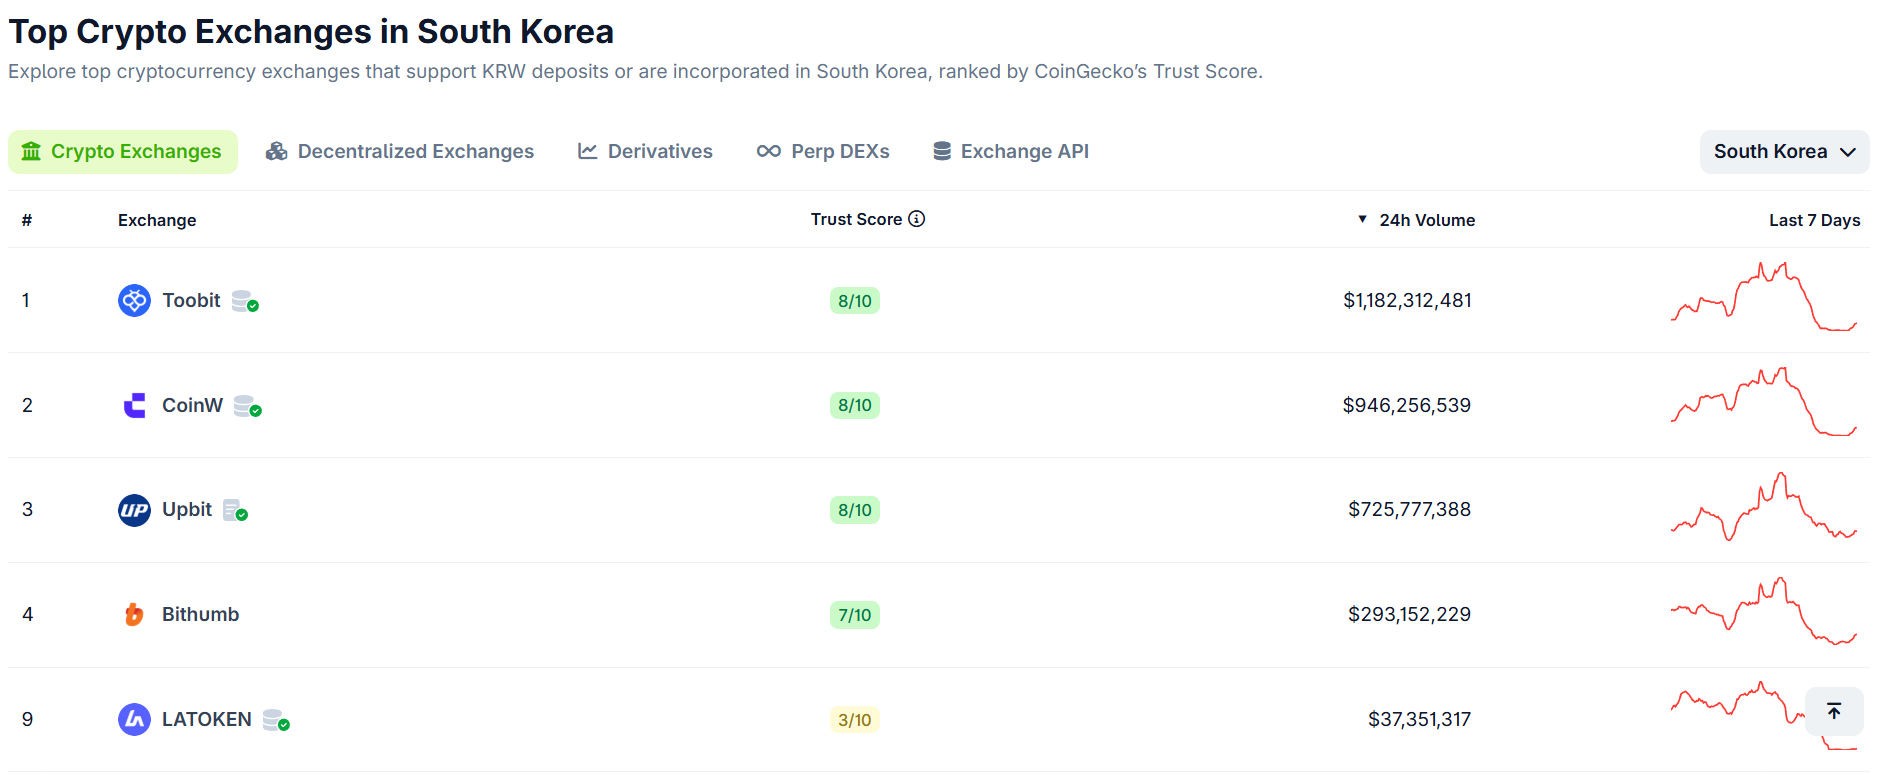
Top five cryptocurrency exchanges in South Korea by daily trading volume. Source: CoinGecko
Bithumb is one of South Korea’s largest crypto exchanges by daily volume, CoinGecko data shows.
Related: South Korea police probe Polymarket users over illegal gambling claims: Report
Korean brokerages target crypto exchanges
The reported Kiwoom talks come after several major South Korean financial firms moved to buy stakes in local crypto exchanges and exchange operators.
On May 29, Korea Investment & Securities (KIS) and OKX Ventures agreed to invest a combined 160 billion won ($106 million) to buy a 19.6% stake in South Korean crypto exchange Coinone.
A day earlier, Samsung Securities, Samsung SDS and Samsung Card acquired a combined 4% stake in Dunamu, the operator of South Korean crypto exchange Upbit, for $408 million, Cointelegraph reported on May 28.
On May 15, Hana Financial Group said it would acquire a 6.55% stake in Dunamu from Kakao Investment for more than $668 million, making it the Upbit operator’s fourth-largest shareholder.
In February, Mirae Asset Consulting agreed to acquire a 92.06% stake in Korbit for $93 million, taking control of the majority of the exchange as part of its digital asset push.
Magazine: Polymarket seeks Japan entry, Harvard dumps entire ETH position: Hodler’s Digest, May 17 – 23

Cryptocurrency exchanges already approved to operate in European Union member states under the soon-to-be enforced Markets in Crypto-Assets (MiCA) framework are incentivizing users from companies that failed to gain license approval.
With MiCA restrictions set to be enforced starting on July 1, executives of cryptocurrency exchanges including Coinbase and OKX have taken to social media to sway users from soon-to-be unauthorized companies, like Binance and Bybit Global.
The world’s largest crypto exchange, Binance, said that it would restrict services for EU-based users after withdrawing its MiCA application last week. Bybit Global on Monday said access to services for users in the European Economic Area “will be progressively limited” starting on July 1, though its Bybit EU arm is authorized to operate under MiCA through its Austrian licensee.
As of Monday, regulators in EU member states had approved 244 total licenses for crypto companies under MiCA. Of those, about a quarter (57) came from Germany’s Federal Financial Supervisory Authority, or BaFin. Authorities in Greece, Hungary, Poland, Portugal and Romania had not issued any licenses as of Friday.
Erald Ghoos, CEO of OKX Europe, said on Monday that the exchange would offer 8% on new deposits, suggesting that Binance and Bybit users transfer their funds. Coinbase CEO Brian Armstrong said on Friday that the company would offer a 5% transfer bonus for users before July 13, about two weeks after MiCA takes effect. Kraken, also authorized under MiCA, offered a $1.1 million prize draw for euro deposits.

Source: OKX CEO Mingxing “Star” Xu
Under MiCA, crypto companies offering services to EU-based users in 27 countries must be licensed as a Crypto-Asset Service Provider (CASP) by a regulator in one of the member states. While many exchanges, including Coinbase, FalconX, Kraken and OKX, have obtained licenses to operate after the June 30 deadline, the absence of others could significantly impact the region’s crypto market.
Related: Binance faces EU service limits next week as MiCA rules take effect
As Bybit pulls back in EEA, MENA business expands
While Bybit moves to limit its services in the EEA, the company is ramping up business in the Middle East.
Derek Dai, Bybit’s head for the Middle East and North Africa, said at a Tel Aviv event on Sunday that the company was stepping up efforts to build in the region as it restricted certain services for EU users.

Bybit MENA head Derek Dai (left) and Collider partner Eylon Aviv (right) at Sunday’s event in Tel Aviv. Source: Cointelegraph
“Our business strategy for MENA has been to differentiate marketing and business plans to make sure that each group of customers are well served,” said Dai. “We are creating halal products that meet the needs of more conservative customers in a number of the Arabic countries while focusing on derivative products that are of interest to younger investors in Morocco who are starting to develop their trading skills and interests.”
Magazine: Bitcoin slides to $58K, XRP hits $1 but onchain data promising: Market Moves

Nearly one year after CNBC’s “Mad Money” host Jim Cramer grouped Palantir (PLTR), Applovin (APP), Robinhood (HOOD), and Coinbase (COIN) into the “PARC” basket, three of the four stocks have either fallen or gone nowhere.
At the time, many in the industry felt that cross-stitching the four into one word meant that Cramer was feeling bullish about crypto, but now, the most industry-linked stock of the lot has suffered the largest drop.
PARC Report Card Leaves Coinbase as the Biggest Loser
Cramer named PARC on July 14, 2025, grouping Palantir, Applovin, Robinhood, and Coinbase together as the stocks retail investors had, in his words, “anointed and taken up without any real bounds.” He framed the market at the time as split into two: the S&P 500 and the PARC four, which were running on pure momentum.
However, in a June 29, 2026 post on X, market commentator Heisenberg posted updated performance figures showing that since Cramer introduced the acronym, Coinbase had performed the worst after dipping by 62%.
Additional data from Yahoo Finance shows that across 52 weeks, the stock has traded between $139 and $444, and is currently sitting near the bottom of that range at around $149, a long way from where conviction was running when Cramer put it in the basket. Interestingly, Donald Trump’s financial disclosure filed in May showed the president bought COIN between January and March of this year, although those transactions are handled by third-party financial institutions.
Meanwhile, Palantir is down roughly 25% since the acronym was coined and about 40% in 2026 alone. Its 52-week high was around $207, and at the time of writing it was trading near $113.
On its part, Robinhood is essentially flat, which might count as a mild win in this context given how the other two have moved. Early this month, the company entered the Canadian crypto space after completing a $180 million acquisition of WonderFi and now counts well over 1 million international funded customers, although that has not done much for the stock price.
Applovin is the only one that has genuinely performed and is up 34% since PARC was named. However, its current price of around $477 is still well below its one-year high of $745, but compared to the rest of the group, it is the clear outlier.
From PARC to CRAP
Back in 2025, Cramer had a choice of two meme acronyms: PARC, which he eventually settled for, and CARP (Coinbase, Applovin, Robinhood, Palantir).
However, some cheeky community members came up with a third one: CRAP, and one year later, it looks to have held better than the basket itself, a point that was revisited by analyst Shanaka Anslem Perera when commenting on the development in a post on X:
“The acronym arrived at the precise moment conviction in these names ran hottest, and the year that followed turned a throwaway joke into a price chart,” he wrote. “CRAP was never an insult. It was the forecast, written a year early.”
The post Coinbase (COIN) Down 62% One Year After Jim Cramer’s PARC Basket appeared first on CryptoPotato.
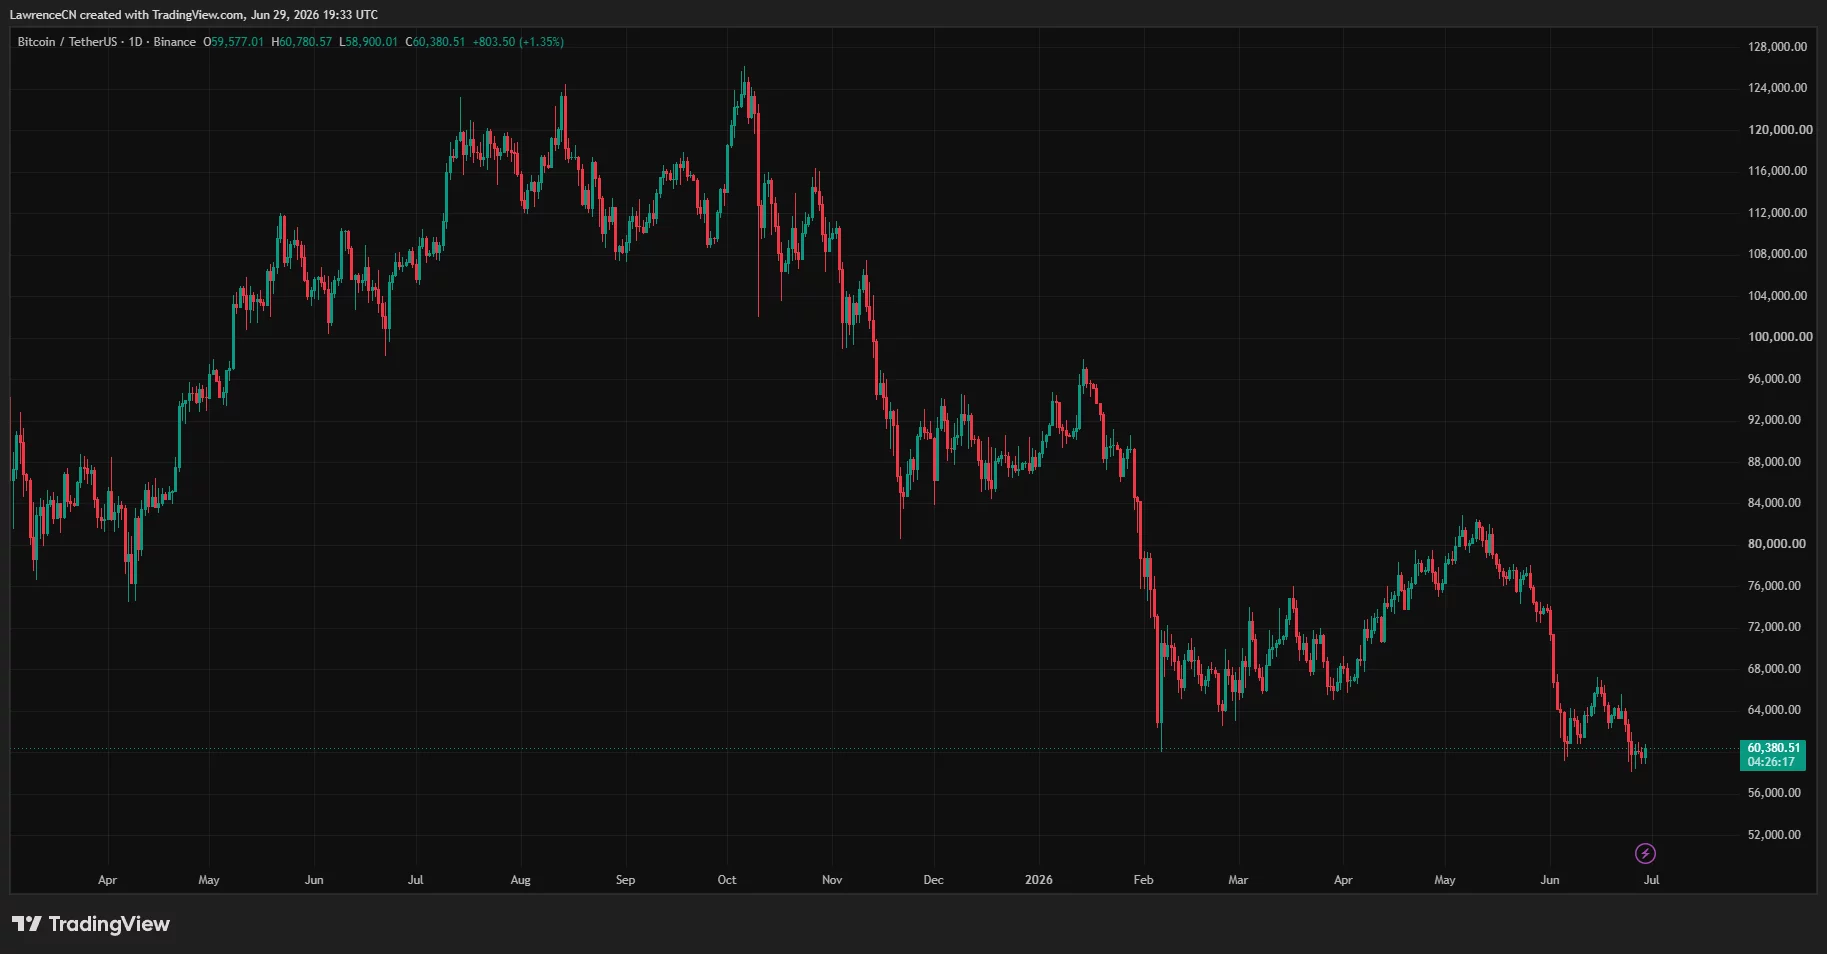
Bitcoin has fallen to around $60,000, more than half off its all-time high, with the Fear and Greed Index in extreme fear and momentum near oversold. Is this the bottom before the next leg higher, or a pause on the way to $55,000 and lower? Here is what the charts, the 4-year cycle, and the analysts actually say.
Summary
- Bitcoin trades near $60,000 as of late June 2026, down roughly 18% on the month and about 52% below its all-time high near $126,000 set late last year.
- The bottom case rests on extreme fear, oversold momentum, support holding near $58,000, and structural demand from ETFs and corporate treasuries.
- The lower case rests on a broken technical structure below every major moving average, a late-cycle position historically tied to deep corrections, and a loss of $58,000 opening $55,000 and below.
- The single most important level is the 50-month exponential moving average near $65,600; reclaiming it on a monthly close would shift the picture, while failure keeps sellers in control.
- Analyst year-end targets span an enormous range, from the low-$40,000s in bearish models to $180,000 and beyond from prominent bulls, which tells you how unsettled the outcome is.
Bitcoin (BTC) is trading near $60,000 as of late June 2026, and the question dividing traders is simple to state and hard to answer: is this the bottom, or is there more pain to come? The price sits roughly 52% below the all-time high near $126,000 reached late last year, down about 18% over the past month, with the Crypto Fear and Greed Index mired in extreme fear at a reading around 18 and the relative strength index near 31, close to the oversold zone.

Bitcoin price is stuck below the 50-month exponential moving average near $65,600, a level that has historically separated Bitcoin bull markets from bear markets, and the immediate support that bulls are defending sits near $58,100, with $55,000 the next major shelf below that. This is the kind of moment that defines cycles.
Either extreme fear and oversold momentum mark a durable low from which Bitcoin recovers, as they often have before, or the late-cycle structure resolves lower in the classic post-halving correction that history warns about. Both outcomes have serious advocates and serious evidence, and the honest answer is that the setup is genuinely balanced rather than obvious in either direction.
This article works through the question from every angle a serious trader would weigh: where Bitcoin actually stands on the charts, the strongest version of the case that $60,000 is the bottom, the strongest version of the case that $55,000 or lower is next, the specific price levels that will confirm one path or the other, where Bitcoin sits in its 4-year halving cycle and whether that framework still applies, what the major analysts are forecasting and why their numbers diverge so wildly, and finally three concrete scenarios for the rest of 2026. The aim is not to tell you what Bitcoin will do, because nobody can, but to lay out what each outcome requires so that you can watch the right signals and form your own view.
The forecasts that follow are information, not advice, and the spread among them is itself the most honest summary of where Bitcoin stands: deeply uncertain, at a level that will look in hindsight like either a generational entry or a bull trap, with the evidence today pointing both ways.
Where Bitcoin stands right now
Start with the unvarnished technical picture, because it frames everything else. Bitcoin near $60,000 is in a confirmed downtrend on the higher timeframes. It trades below the 50-month exponential moving average near $65,600, the level many long-term traders treat as the dividing line between bull and bear regimes, and well below shorter-term averages such as the 20-month exponential moving average near $80,000, which shows how far price has fallen from its recent range. The monthly candle is down sharply, around 18%, and the broader drawdown from the $126,000 peak is about 52%, a decline consistent in scale with past Bitcoin bear phases.
Momentum is weak: the monthly relative strength index sits near 31, at the lower boundary that has historically marked important bottoms but which can also stay depressed while price grinds lower. Composite technical readouts across the major analytics platforms lean bearish, with the clear majority of tracked indicators flashing sell signals rather than buy signals.
Sentiment matches the price action. The Fear and Greed Index reads around 18, deep in extreme fear, the zone where past panic-driven selling has often exhausted itself and set up rebounds, though extreme fear can also persist through further declines when a real bear market is underway.
The key support structure is well defined, which is useful: immediate support sits near $58,100, and a decisive loss of that level would expose $55,000 and then lower shelves beneath it. On the upside, the first hurdle is reclaiming the 50-month average near $65,600 on a monthly closing basis, which would be the earliest technical sign that the worst is over. Until that happens, the structure favors sellers, and the burden of proof sits with the bulls.
None of this resolves the bottom question by itself, but it maps the terrain: oversold, fearful, below the key line, defending support, with a clear level overhead that needs to be reclaimed before any recovery can be called real.
The case that $60,000 is the bottom
The bottom thesis is not wishful thinking; it rests on a coherent set of signals. The first is sentiment as a contrarian indicator. The Fear and Greed Index at extreme-fear levels has, in Bitcoin history, frequently coincided with major lows, because by the time fear reaches these readings, the holders most inclined to sell in panic have largely done so, leaving a market with less downside fuel.
The 2nd is momentum. A monthly relative strength index near 31 is close to the oversold threshold that has historically preceded recoveries, and on the weekly timeframe some analysts note RSI approaching levels that have marked important bottoms in past cycles, suggesting the correction is closer to its end than its beginning. The 3rd is the price structure itself: Bitcoin is defending support near $58,100, and as long as that floor holds on a closing basis, the bottoming case remains technically intact.
The deeper support for the bottom thesis is structural demand that did not exist in earlier cycles. Spot Bitcoin exchange-traded funds now hold very large quantities of Bitcoin, on the order of well over 1 million coins across the complex, and corporate treasuries continue to accumulate, with some holdings approaching levels that rival the largest known wallets. This persistent, price-insensitive buying provides a demand floor that earlier Bitcoin bear markets lacked, and bulls argue it changes the math of how low Bitcoin can realistically fall before institutional buyers step in.
Layer on the regulatory tailwind, with clearer United States rules advancing through the digital-commodity framework, and the bull case is that Bitcoin near $60,000 is being offered at a steep discount precisely when its structural demand base is the strongest it has ever been. In this reading, extreme fear plus oversold momentum plus a record institutional bid equals a bottom, and the people selling here are handing cheap coins to long-term accumulators. It is a serious argument backed by real flows, not merely hope.
The case that $55,000 or lower is next
The bearish thesis is equally coherent and arguably has the cleaner technical structure behind it right now. The starting point is that Bitcoin trades below every major moving average that matters, from the 50-month exponential average near $65,600 on down, and price below falling long-term averages is the textbook definition of a downtrend, not a bottom. Extreme fear and oversold momentum, the bears note, are necessary but not sufficient for a low; in genuine bear markets, both conditions can persist for months while price keeps sliding, and a reading of extreme fear is just as consistent with the middle of a decline as with its end.
The support at $58,100 is the line in the sand, and a weekly close below it would, on this view, confirm further downside and bring $55,000 into focus, with little structural support between there and lower levels once that shelf breaks.
The macro and cyclical context reinforces the bearish read. Bitcoin is roughly 26 months past the April 2024 halving, which places it deep in the late-cycle phase that has historically followed the halving with a peak and then a substantial correction.
If the cycle top was the $126,000 high reached late last year, then a 52% drawdown is well within the range of past bear-market declines, and history would suggest the correction could run deeper and longer before a true bottom forms. Bears also point to the risk that the very institutional structures bulls celebrate could amplify a decline: leveraged corporate Bitcoin treasuries that bought at higher prices may face pressure to sell if their financing terms or share valuations deteriorate, and ETF flows that were a tailwind on the way up can reverse into outflows that remove the demand floor exactly when it is needed.
In this reading, $60,000 is not a bottom but a way station; the support break to $55,000 is the more probable next move, and the late-cycle clock argues for patience over bottom-fishing.
The levels that will settle it
Rather than guess, traders can watch a specific ladder of levels that will confirm which thesis is playing out, and this is where the abstract debate becomes concrete. On the downside, the first decisive level is $58,100. A clean weekly or monthly close below it would invalidate the immediate bottoming case and open the door to $55,000, which is the next significant shelf. Below $55,000, the structure thins out, and a loss there would suggest the broader bear phase has further to run, with traders then watching round-number psychological levels and prior-cycle reference points beneath. The bears need that $58,100 break to confirm their case; until it happens, the lower targets remain hypothetical.
On the upside, the levels are equally clear. The first and most important is the 50-month exponential moving average near $65,600. A monthly close back above it would be the earliest serious signal that the downtrend is ending, because reclaiming that bull-bear line has historically preceded recoveries. Above it, the next hurdles are the 200-day moving average near $65,200, which sits close by, and then the 20-month average near $80,000, a reclaim of which would signal a genuine trend change instead of a relief bounce. The bulls need that $65,600 monthly close to confirm their case; a rejection there would keep the structure bearish even if price bounces in the meantime.
The practical takeaway is that the bottom question will be answered not by sentiment or narrative but by which of these levels gives way first. Hold $58,100 and reclaim $65,600, and the bottom case strengthens decisively. Lose $58,100, and $55,000 becomes the conversation. Everything between is noise.
The 4-year cycle and where Bitcoin sits in it
No Bitcoin price discussion is complete without the halving cycle, and right now it cuts toward caution while raising a genuine question about whether the old framework still holds. Bitcoin’s supply issuance halves roughly every 4 years, and the April 2024 halving cut the block reward to 3.125 coins. Historically, the 12 to 18 months after a halving have produced the cycle’s price peak, followed by a deep correction into the next cycle’s accumulation phase. Bitcoin is now around 26 months past that halving, which places it firmly in the late-cycle window where, in past cycles, the top was already in, and a correction was underway or complete. If history rhymes, the $126,000 high late last year was the cycle peak, and the current drawdown is the correction phase, which historically has run deep before bottoming. That reading supports patience and the lower-price case.
But there is a serious counterargument that this cycle may not behave like the past ones, and it is the crux of the most important debate in Bitcoin right now. The arrival of spot ETFs, large corporate treasuries, and institutional adoption has injected a new kind of demand that did not exist in earlier cycles, and some analysts argue this could either smooth out the 4-year pattern, blunting both the euphoric tops and the brutal bottoms, or extend the cycle by adding sustained buying that delays the peak. If the cycle is being stretched or dampened by institutionalization, then late-cycle timing alone is a weaker guide than it used to be, and a drawdown to $60,000 could be a mid-cycle shakeout instead of the start of a multi-year bear market.
The honest position is that nobody yet knows whether the 4-year cycle still governs Bitcoin or whether institutionalization has changed the rules, and that uncertainty is precisely why the bottom question is so contested. The cycle clock says caution; the structural-demand argument says this time may differ. Both could be partly right.
What the analysts are forecasting
The dispersion among professional forecasts is wide enough to be its own data point, and it reflects exactly the unresolved debate this article describes. On the bullish side, Ripple chief executive Brad Garlinghouse has pointed to $180,000 for Bitcoin in 2026 on favorable market and regulatory conditions, and Bitwise chief investment officer Matt Hougan has reiterated a $200,000 target for the year, while acknowledging he did not expect the scale of selling that hit the market on the way down.
More structured institutional views are more measured but still constructive: the head of research at CoinShares has projected Bitcoin holding a $120,000 to $170,000 range across 2026 with stronger action in the 2nd half, and Carol Alexander has described a high-volatility band of $75,000 to $150,000 with a central tendency near $110,000.
Longer-term, Bitwise has floated $500,000 as Bitcoin approaches a share of gold’s market value, and various quantitative models, from stock-to-flow to power-law frameworks, sit anywhere from $100,000 to well above $250,000.
Against those stand the cautious and bearish models. Algorithmic forecasters such as CoinCodex read the 2026 setup as bearish on technical indicators, and model-based ranges from sources like CoinLore place 2026 anywhere from the low-$40,000s at the bottom to roughly $118,000 at the top, depending on conditions, with near-term projections clustering close to current levels. The sheer gap, from a low-$40,000s downside to a $200,000-plus upside within the same year, is not a sign that forecasters are careless; it reflects that Bitcoin’s 2026 path depends on variables that genuinely could break either way, chiefly ETF flows, macro liquidity and Federal Reserve policy, and whether the 4-year cycle reasserts itself.
When the credible range is this wide, the responsible conclusion is not to pick a number but to recognize that the outcome is unusually open, and to size risk accordingly. The analysts are not telling you where Bitcoin is going; collectively, they are telling you it is a genuine coin-flip at a decision point.
What would confirm a bottom, and what would break it
Pulling the threads together, a real bottom would announce itself through a recognizable cluster of signals instead of a single one. Technically, it would start with $58,100 holding on a closing basis, followed by a monthly close back above the 50-month average near $65,600, ideally on rising volume that shows real buying instead of a low-conviction bounce. Fundamentally, it would coincide with ETF flows turning consistently positive again after any period of outflows, since that institutional bid is the demand floor the bull case depends on, and it would likely be helped by a supportive macro shift, such as the Federal Reserve easing policy or broad liquidity improving, conditions under which risk assets like Bitcoin tend to recover. A stabilization or reversal in Bitcoin dominance and a lift in sentiment off extreme-fear lows would round out the confirmation. If those align, the case that $60,000 marked the low becomes strong.
The breakdown scenario is the mirror image. It would begin with a decisive loss of $58,100, opening $55,000 and then lower levels with little support beneath, and it would be reinforced by ETF flows turning to sustained outflows that remove the demand floor. The macro trigger would be tightening conditions, a stronger dollar, or a broad risk-off episode that pulls capital out of speculative assets.
The cyclical trigger would be confirmation that the 4-year pattern is intact and the late-cycle correction has further to run. And a specific structural risk worth watching is forced selling from leveraged Bitcoin treasury companies, whose need to sell into weakness could amplify a decline well beyond what spot demand alone would produce.
The practical discipline for anyone navigating this is to treat $58,100 as the hinge: above it, with $65,600 reclaimed, the bottom case has the upper hand; below it, the lower targets become the base case. Watching those levels and those flows beats guessing, because the market itself will signal which path it has chosen.
Three scenarios for Bitcoin into late 2026
Synthesizing the evidence into scenarios makes the range concrete without pretending to certainty.
In the bull scenario, $60,000 proves to be the cycle low or close to it. Support at $58,100 holds, extreme fear and oversold momentum mark the exhaustion of selling, ETF inflows resume, and a supportive macro turn lets Bitcoin reclaim the 50-month average near $65,600 and then push back toward and beyond $80,000 over the 2nd half of 2026, validating the more constructive analyst targets and putting 6-figure prices back in view into 2027. This scenario leans on the structural-demand argument and the possibility that institutionalization has changed the cycle, and it is the path the prominent bulls like Hougan and Garlinghouse are forecasting toward.
In the base scenario, Bitcoin chops in a wide, volatile range without a clean resolution for some time. It defends the low-$58,000s to $60,000 area more often than not but struggles to reclaim $65,600 decisively, spending the rest of 2026 oscillating between roughly the mid-$50,000s and the mid-$70,000s as bulls and bears fight over the cycle question, with the outcome unresolved into 2027. This middle path fits the high-volatility ranges that measured analysts like Carol Alexander and CoinShares describe, and it is arguably the most likely outcome given how balanced the evidence is.
In the bear scenario, the late-cycle correction reasserts itself. Bitcoin loses $58,100, slides to $55,000 and then lower, ETF flows reverse, treasury-company selling amplifies the move, and the 4-year cycle plays out classically with a deeper and longer bottoming process that drags into 2027 before a new accumulation phase begins, validating the bearish models that see the low-$40,000s as a real possibility. Which scenario unfolds depends on the levels and flows described above, and the only intellectually honest stance today is that all 3 are live.
Frequently Asked Questions
Has Bitcoin bottomed at $60,000?
It is truly unresolved. The bottom case rests on extreme fear, oversold momentum near a monthly RSI of 31, support holding near $58,100, and record structural demand from ETFs and corporate treasuries. The lower case rests on Bitcoin trading below every major moving average, a late-cycle position around 26 months past the April 2024 halving that historically precedes deeper corrections, and the risk that a loss of $58,100 opens $55,000 and below. The deciding signal is whether Bitcoin holds $58,100 and reclaims the 50-month average near $65,600 on a monthly close. Until then, neither side is confirmed, and the evidence points both ways.
What is the key level to watch for Bitcoin?
The 50-month exponential moving average near $65,600 is the single most important level, treated by many long-term traders as the line between bull and bear regimes; a monthly close above it would be the earliest serious sign the downtrend is ending. On the downside, $58,100 is the critical support, and a decisive close below it would expose $55,000 and lower. The 200-day moving average near $65,200 sits close to the 50-month average and reinforces that zone, while the 20-month average near $80,000 is the level a true trend change would need to reclaim. Watch $58,100 as the hinge and $65,600 as the confirmation.
Why is Bitcoin down so much from its high?
Bitcoin is about 52% below its all-time high near $126,000 reached late last year, having fallen roughly 18% in the past month alone. The decline reflects a combination of factors: a late-cycle position about 26 months past the April 2024 halving, the phase that has historically followed the halving peak with a correction; weakening momentum and sentiment, with the Fear and Greed Index in extreme fear; and macro pressures including liquidity conditions and uncertainty about Federal Reserve policy. Whether this is a normal cyclical correction or the start of a deeper bear market is exactly the question dividing analysts, and it depends heavily on whether ETF and institutional demand offsets the cyclical downdraft.
What are analysts predicting for Bitcoin in 2026?
The range is extremely wide, which reflects real uncertainty. Bullish forecasts include $180,000 from Ripple’s Brad Garlinghouse and $200,000 from Bitwise’s Matt Hougan, with longer-term calls like Bitwise’s $500,000 tied to Bitcoin taking share from gold. More measured institutional views include CoinShares at $120,000 to $170,000 for the year and Carol Alexander’s $75,000 to $150,000 band centering near $110,000. Cautious and bearish models run lower, with ranges extending into the low-$40,000s in weak scenarios. The gap from the low-$40,000s to above $200,000 within 1 year shows that the outcome depends on variables, chiefly ETF flows, macro liquidity, and the cycle, that truly could break either way.
Could Bitcoin fall to $55,000 or lower?
Yes, it is a real possibility if support breaks. The bearish path runs through a decisive loss of $58,100, which would open $55,000 as the next major level, with thin support beneath it once that shelf gives way. The case is reinforced by Bitcoin trading below all major moving averages, the late-cycle timing that historically precedes deeper corrections, the risk of ETF flows reversing into outflows, and the specific danger of forced selling from leveraged corporate Bitcoin treasuries that bought higher. Bearish models see the low-$40,000s as possible in a weak 2026. Whether it happens hinges on the $58,100 support; as long as that holds on a closing basis, the lower targets remain hypothetical.
Is the 4-year cycle still valid for Bitcoin?
This is one of the most important open debates in Bitcoin right now. The traditional pattern, in which price peaks roughly a year or so after each halving and then corrects deeply, would place Bitcoin in a late-cycle correction now, around 26 months past the April 2024 halving, and argues for caution. But the arrival of spot ETFs, corporate treasuries, and broad institutional adoption has introduced sustained demand that did not exist in earlier cycles, which some analysts argue could smooth out the pattern, blunting both tops and bottoms, or stretch the cycle by delaying the peak. Nobody yet knows whether the cycle still governs Bitcoin or whether institutionalization has changed the rules, and that uncertainty is central to why the current bottom question is so contested.
This article is information, not financial or investment advice. Bitcoin price levels, indicator readings, and analyst forecasts reflect data available as of June 28, 2026, are point-in-time, and can change rapidly. Cryptocurrency is highly volatile, and you can lose money. Price predictions are inherently uncertain and the scenarios described are not guarantees. Do your own research and consult a qualified financial professional before making any investment decision.
Roy Keane slams Casemiro as World Cup flop dubbed ‘shadow of former self’ before perfect response

PG&E Continues To Incrementally Improve Its Portfolio (NYSE:PCG)

AI Cuts Animation Costs by 90% as Hollywood Braces for Mass Layoffs


-
 Sports6 days ago
Two goals and an assist by sheer aura: Cristiano Ronaldo just entered the World Cup chat
-

 Fashion3 days ago
Weekend Open Thread: Staud – Corporette.com
-

 Politics4 days ago
The House | Manchesterism won’t survive the painful trade-offs unless it gets citizens on board
-

 Politics4 days ago
Potential 2028er World Cup attendee leaderboard
-

 News Videos1 day ago
MAJOR BITCOIN & MARKET UPDATE!!!! (MUST WATCH ASAP!!!)
-

 Business4 days ago
Asia stock markets slide as tech shares slump
-

 Tech4 days ago
A Look At A Gaggle Of Transputer Boards
-
Crypto World6 days ago
Bitcoin (BTC) Dips Below $62K, Ethereum (ETH) Plunges 6% Daily: Market Watch
-
 Crypto World4 days ago
Dell (DELL) Shares Tumble Over 5% Following Analyst Downgrade to Hold
-

 Crypto World2 days ago
Coinbase, Circle Deepen Crypto Stock Losses Despite Resilient S&P 500
-

 Crypto World6 days ago
Securitize Wraps Roubini's SEC-Registered ETF as Dubai VARA Digital Security
-
Business6 days ago
Entergy settles forward sale agreements, raises $672 million in cash proceeds
-

 Crypto World3 days ago
Kraken's xStocks Opens Bending Spoons IPO Registration to EEA Retail
-

 Sports3 days ago
FIH Pro League: India defeat Pakistan 7-1, register biggest win of campaign | Other Sports News
-

 Tech2 days ago
Russian hackers now target Signal backup recovery keys
-

 Tech2 days ago
Bluekit phishing kit adopts browser-in-the-middle for login theft
-
 Crypto World4 days ago
Bitcoin Sparks $600M Hourly Liquidations With $65,000 Set To Become Resistance
-

 Crypto World3 days ago
RTX holders must register wallets before token distribution begins
-
Crypto World3 days ago
Hyperliquid Named on Singapore MAS Investor Alert Register
-
 Crypto World5 days ago
Ripple and SBI launch RLUSD in Japan after JFSA approval
You must be logged in to post a comment Login