

Crypto World
FedEx (FDX) Shares Decline Nearly 4% Amid $1.4 Billion Logistics Unit Sale Negotiations

Key Highlights
- FDX shares declined 3.7% during Wednesday’s pre-market session following news of potential $1.4B Supply Chain unit divestiture
- CMA CGM, the globe’s third-largest container shipping operator, is identified as the prospective purchaser
- The company exceeded Q4 FY2026 expectations with earnings of $6.31 per share and revenue of $25.01B, reflecting a 12.5% annual increase
- Company insiders have divested 48,104 shares totaling approximately $17.6M in the previous quarter
- Analyst consensus points to a “Moderate Buy” rating with a mean price objective of $349.60
Shares of FedEx (FDX) experienced a 3.7% decline in Wednesday’s pre-market session, beginning trading at $313.44, following a Financial Times report indicating that negotiations to divest its third-party logistics division have reached an advanced phase.
The business unit under discussion is FedEx Supply Chain, responsible for warehousing operations, distribution services, and managing product returns. According to reports, CMA CGM, ranked as the world’s third-largest container shipping enterprise, stands as the potential acquirer.
Sources suggest the transaction carries an estimated valuation of approximately $1.4 billion.
This development represents another strategic step in FedEx’s initiative to concentrate on its primary air and ground transportation services. The logistics giant recently separated FedEx Freight (FDXF) into an independent trucking entity.
Divesting the Supply Chain business would further streamline FedEx’s operational structure and intensify its concentration on package delivery services.
Strong Quarterly Performance Amid Strategic Transitions
FedEx delivered impressive Q4 FY2026 financial results on June 23. The shipping giant reported earnings per share of $6.31, surpassing Wall Street projections of $5.91 by $0.40. Total revenue reached $25.01 billion, exceeding the consensus estimate of $24.04 billion and representing a 12.5% increase from the previous year.
FedEx also highlighted enhanced package volume metrics and ongoing cost reductions stemming from its comprehensive transformation initiative.
Stifel’s analyst J. Bruce Chan expressed optimism regarding continued enhancement in profit margins and asset efficiency.
Looking ahead to FY2027, FedEx has provided earnings guidance ranging from $16.90 to $18.10 per share. Wall Street analysts project an average of $20.89 in full-year earnings.
Notwithstanding the earnings outperformance, FDX shares have faced headwinds. The company’s transition to calendar-year financial reporting has introduced some investor ambiguity.
Notable Insider Transactions and Institutional Activity
Regarding insider activity, Executive Vice President Gina F. Adams divested 20,450 FDX shares on April 14 at a price of $366.45 per share, generating approximately $7.49 million in proceeds. This transaction reduced her holdings by 51%.
Board member Susan C. Schwab sold 5,795 shares the following day at $369.00 per share, totaling roughly $2.14 million — representing a 36.6% decrease in her ownership stake.
Cumulatively, company insiders have disposed of 48,104 FDX shares valued at approximately $17.6 million during the past 90-day period.
Institutional investor Janney Montgomery Scott reduced its FedEx holdings by 16.6% during Q1, selling 10,993 shares. The firm maintains ownership of 55,268 shares with an estimated value of $19.7 million.
Institutional investors control 84.47% of FedEx stock.
Wall Street analysts have recently adjusted their price projections. Truist reduced its target from $425 to $365 while retaining a Buy recommendation. Stifel decreased its objective from $442 to $326, also maintaining Buy. HSBC lowered its forecast to $289.89 with a Hold rating. Sanford C. Bernstein established a $397 target.
Morgan Stanley maintains the sole Underweight rating, projecting a $230 price target.
The prevailing Wall Street consensus stands at Moderate Buy, featuring an average price objective of $349.60.
FedEx’s 52-week trading range extends from a minimum of $172.88 to a maximum of $345.36. The equity’s 50-day moving average currently rests at $361.08.
A quarterly dividend distribution of $1.22 per share was issued on July 7, yielding 1.6%.


Remittix has moved into a busier launch window, and one update is now taking priority across the community: airdrop registration.
The registration page is live through the official Remittix site, giving RTX holders a clear step to complete before token distribution moves closer. For presale buyers, the focus is shifting from simply watching updates to taking action, registering wallets and preparing for the next stage of the Remittix rollout.
The timing is important. Remittix is currently building toward several major updates, including the RTX launch price reveal expected in 3 days, the extended 350% RTX bonus, the approaching public platform launch and the $32 million milestone expected to unlock the official launch date reveal.
Why Airdrop Registration Is Now In Focus
The Remittix airdrop is connected to the distribution of RTX tokens purchased during the presale. It is not being presented as a separate free-token campaign. Instead, it is part of the process for helping holders prepare for token distribution.
To register, holders need to visit the official Remittix site, connect their wallet, submit their wallet address and complete the registration page. Users can also add optional notification details so they can receive future updates linked to the airdrop, distribution and launch process.
Once the process is complete, the page confirms that the holder has successfully registered.
This has made registration one of the most practical updates for the community. While launch headlines continue to build, wallet submission is the step holders can complete now.
Launch Updates Are Starting To Stack Up
The next few updates could be important for Remittix. The RTX launch price reveal is expected in 3 days, giving holders a clearer view of how the token will be positioned heading into launch.
At the same time, the project is closing in on the $32 million milestone, which is expected to unlock the official launch date reveal. This has added more attention around the current registration period, especially as holders wait for clearer launch timing.
The extended 350% RTX bonus is also still active, adding another incentive for users watching the final stretch before launch activity increases.
Platform Launch Adds A Utility Angle
Beyond token distribution, Remittix is still building its wider crypto-to-fiat payments story.
The platform is designed to let users send crypto while recipients receive fiat directly into bank accounts. Multiple community members have reportedly received fiat payments through the Remittix system, giving the project practical proof as public platform access moves closer.
That is why the airdrop registration update matters beyond wallet submission alone. It arrives at the same time as launch price news, platform momentum, the 350% bonus extension and the $32 million milestone.
For RTX holders, the next step is straightforward. Register through the official Remittix site, submit wallet details and stay ready as the next Remittix launch updates approach.
Discover the future of PayFi with Remittix by checking out their project here:
Website: https://remittixpresale.io
Airdrop Registration: https://airdrop.remittixpresale.io
FAQ
Why is airdrop registration important for Remittix holders?
Airdrop registration allows RTX holders to submit their wallet address and prepare for the upcoming token distribution process.
What major Remittix updates are approaching?
The main updates include the RTX launch price reveal in 3 days, the $32 million milestone for the launch date reveal and the approaching public platform launch.
What is the Remittix platform designed to do?
The Remittix platform is designed to let users send crypto while recipients receive fiat directly into bank accounts.
Disclaimer: This is a Press Release provided by a third party who is responsible for the content. Please conduct your own research before taking any action based on the content.
Key Points
- Christopher Delgado admits guilt in $400M cryptocurrency fraud operation
- Federal prosecutors reveal Ponzi-style structure using new investor funds
- At least $250M in verified losses connected to the fraudulent scheme
- Agreement includes forfeiture of luxury properties, vehicles, and high-end goods
- Federal sentencing scheduled for October 8 in ongoing fraud prosecution
Christopher Alexander Delgado, former chief executive of Goliath Ventures, has entered a guilty plea in connection with a massive $400 million cryptocurrency fraud operation in Florida. Federal authorities allege that Goliath collected investor capital by promising substantial returns through digital asset liquidity pool investments. Instead, investigators claim the funds financed payouts to earlier investors, extravagant personal purchases, and corporate entertainment expenses.
Executive Acknowledges Involvement in Fraudulent Operation
According to the U.S. Attorney’s Office, Delgado entered guilty pleas on charges including conspiracy, wire fraud, and money laundering. Each wire fraud charge carries a potential sentence of up to 20 years behind bars. The money laundering charge adds an additional maximum penalty of 10 years in federal prison.
Delgado assumed leadership of Goliath Ventures following its earlier incarnation as Gen-Z Venture Firm. Federal prosecutors indicate that the Crypto Fraud scheme operated continuously from January 2023 until January 2026. Throughout this timeframe, the company marketed consistent monthly profits supposedly generated from cryptocurrency liquidity pool operations.
Federal authorities state that Delgado has acknowledged responsibility for investor losses totaling at least $250 million. Prosecutors further assert that Goliath collected approximately $400 million from defrauded victims. The executive now awaits his sentencing hearing scheduled for October 8.
Federal Investigation Reveals Luxury Asset Trail
Government prosecutors detail how Goliath employed incoming investor capital to satisfy withdrawal requests from previous participants. The organization simultaneously processed payouts and maintained outward appearances of legitimate investment activities. According to prosecutors, merely $1 million actually reached genuine cryptocurrency assets.
The Crypto Fraud investigation uncovered substantial luxury expenditures, based on federal court documents. Prosecutors documented purchases by Delgado including multiple residential properties, exotic automobiles, premium timepieces, designer handbags, upscale wallets, and fine jewelry. The spending spree encompassed Lamborghini and Rolls-Royce vehicles, Rolex watches, and custom-designed Tiffany & Co. jewelry pieces.
The plea arrangement mandates that Delgado surrender eight real estate properties and eleven luxury vehicles. Additional forfeitures include 30 high-end watches and over 50 designer bags and wallets. Delgado has also consented to relinquish no fewer than 29 pieces of jewelry.
Fraud Investigation Raises Questions About Financial Oversight
The investigation attracted significant attention even before Delgado’s guilty plea. Affected investors initiated a proposed class-action complaint against JPMorgan Chase in March. The legal action accused the banking institution of permitting questionable Goliath transactions through its banking infrastructure.
The civil complaint asserted that approximately $253 million flowed through a JPMorgan business account. Plaintiffs additionally claimed that roughly $123 million subsequently transferred to Goliath-controlled wallets at Coinbase. Independent federal filings documented additional transaction flows involving Bank of America accounts and Coinbase wallet addresses.
The Crypto Fraud prosecution underscores the disconnect between promotional representations and verifiable blockchain transactions. While liquidity pools function as legitimate DeFi mechanisms, companies must demonstrate transparent on-chain evidence. In this instance, federal prosecutors contend that Goliath exploited the liquidity pool concept to facilitate an extensive Crypto Fraud enterprise.


The seasonal pattern normally runs the other way. Across bitcoin’s full record, the fourth quarter has been its strongest by a wide margin, averaging a 77% gain with a median near 48%, the stretch that has repeatedly salvaged mediocre years.
The third quarter is the opposite, the weakest quarter on average and often flat. The calendar, in other words, would normally argue for a quiet third quarter and a strong fourth-quarter finish. In 2018 and 2022, that seasonal strength failed. The bear market overrode the calendar, and the fourth quarter, usually the best, became one of the worst.
A sample of two may tell little on its own and both of those years turned on specific collapses that have no exact equivalent today. The comparison does not mean 2026 must follow 2018 or 2022, but it does mean the only other times bitcoin started a year this weakly, the weakness was a symptom of something structural rather than a passing dip.
Whether 2026 belongs in that category depends on what is driving the selling, and the drivers look more like a grind than a panic.
U.S. spot bitcoin exchange-traded funds (ETFs) have seen record outflows over the past month, the number of active users onchain has stayed near the low end of its range, and capital has rotated steadily into AI stocks, which just posted their best quarter in years while crypto fell.


Global mergers and acquisitions (M&A) reached a record $2.8 trillion in the first half of 2026, up 48% from a year earlier. This marked the strongest opening six months since LSEG began tracking deals in 1980.
Large takeovers carried the market. Fewer companies changed hands, yet the deals that closed were far bigger, lifting total value to a record.
Global M&A Surges to Record $2.8 Trillion
Transactions above $10 billion set the pace. Roughly 47 such deals, worth more than $1.3 trillion combined, drove close to half of all value in the period, according to LSEG data.
Meanwhile, the total number of deals fell 9% to about 24,000, the lowest first-half count in six years. Buyers favored fewer, bigger bets over broad activity.
Ivan Farman, co-head of Global M&A at Bank of America, said the stronger pace of large-scale deals compared with smaller transactions “reflects a growing view that a $1 billion to $3 billion deal takes just as much time as a larger one, so when an opportunity for a big transaction arises, companies see this as the moment to act.”
“So when an opportunity for a big transaction arises, companies see this as the moment to act,” Farman added.
Follow us on X to get the latest news as it happens
Ample financing made that ambition possible. Global investment-grade corporate debt issuance reached $3.4 trillion in the first half, up 10% from last year, Reuters reported.
Technology continued to dominate global merger and acquisition activity. Announced deals totaled $649 billion in the first six months of the year.
Meanwhile, cross-border M&A surged to $893 billion during the first half of 2026, marking a 62% increase from the same period last year. It also represented the strongest start to a year since 2018. The US drew the most interest, at 25% of cross-border transactions. Britain ranked a close second.
While the first half has been notable, full-year momentum points higher. Global M&A is projected to reach $4 trillion in 2026, which would mark the strongest year since 2021, according to PwC.
Subscribe to our YouTube channel to watch leaders and journalists provide expert insights
The post Mega-Deals Drive Global M&A to $2.8 Trillion in First Half of 2026 appeared first on BeInCrypto.
Crypto World
707 Cayman Holdings (JEM) Stock Explodes 267% on New Director Appointment and Blockchain Strategy

Key Highlights
- Shares of JEM closed 267.59% higher during Tuesday’s regular session at $3.97, followed by an additional 154.41% gain after-hours to $10.10
- The explosive move followed news that Robin Hoksnes Karlsen was appointed as executive director, revealed before markets opened
- Volume exploded to 122.24 million shares — approximately 130 times the typical daily average of 940,600
- Directors greenlit exploration of an AI-powered blockchain supply chain system with a preliminary budget of $10–12 million across three years
- No funds have been allocated yet; any cryptocurrency payment trials require regulatory clearance in Hong Kong, the EU and compliance with FATF standards
707 Cayman Holdings (JEM) delivered one of Tuesday’s most dramatic market performances. Shares finished regular trading up 267.59% at $3.97, before climbing an additional 154.41% in extended hours to $10.10.
707 Cayman Holdings Limited Ordinary Shares, JEM
The dramatic rally was sparked by news that Robin Hoksnes Karlsen had been named executive director. The announcement arrived ahead of market open.
Karlsen is the founder of AMIHAN Innovations Ltd., a Web3 and technology firm, and brings over ten years of expertise spanning real estate investing, capital structuring and institutional Real World Asset (RWA) tokenization within decentralized finance ecosystems. His educational credentials include a master’s degree from the University of Hong Kong and an undergraduate degree from University College London.
Trading activity underscored the intensity of investor interest. The session saw 122.24 million units change hands — roughly 130 times JEM’s standard daily volume of 940,600.
With a market capitalization around $7.15 million, the company remains firmly within small-cap boundaries. JEM’s 52-week trading range spans $1.02 to $135, while its RSI currently registers at 67.99 after the dramatic price movement.
Company Unveils AI and Blockchain Supply Chain Strategy
Also on July 1, the board revealed approval to investigate a cutting-edge digital infrastructure merging AI capabilities, blockchain-based traceability and a cryptocurrency payment pilot designed to digitalize its worldwide apparel supply network.
The initiative responds to growing demand from European and North American customers for enhanced supply chain visibility, accelerated restocking cycles and authenticated ESG documentation.
Leadership presented a preliminary three-year funding framework of $10 million to $12 million for staged implementation. The roadmap encompasses AI-enhanced supply chain efficiency, AI design tools, blockchain-powered origin verification and a crypto transaction pilot program.
The board emphasized that no capital commitments have been finalized. The schedule and extent of any cryptocurrency payment operations hinge on securing regulatory permissions in Hong Kong, the EU and meeting FATF compliance requirements.
Karlsen’s expertise in blockchain tokenization and real estate finance is being highlighted as strategically aligned with this expansion trajectory.
Short Position Data and Historical Performance
Some broader perspective deserves attention here. While Tuesday brought explosive gains, JEM remains down 96.17% across the trailing twelve months. The six-month performance shows a gain of 12.15%.
Short interest currently represents 36.2% of available float. Such elevated short positioning can magnify price swings in either direction when traders rush to close positions.
Technical analysis signals from TipRanks currently indicate a sell rating for the stock.
JEM’s market capitalization stays modest at $5.6–7.15 million based on different measuring points. This means even moderate purchase activity can generate disproportionate price reactions.
The company’s typical daily trading activity before Tuesday stood at merely 940,600 units, contrasting sharply with the 122.24 million shares that traded during the session.

Ethereum has remained pinned near the $1,500 support zone after quarter-end selling, whale distribution, and weak institutional flows kept the second-largest cryptocurrency under pressure despite continued corporate treasury accumulation.
Summary
- Ethereum has logged its first-ever third straight quarterly loss as quarter-end selling keeps ETH near $1,500 support.
- SharpLink and Bitmine expanded their ETH treasuries, but whale selling and ETF outflows continue to weigh on price.
- Analysts say reclaiming $1,700 is key, while losing $1,500 could expose ETH to another leg lower.
According to data from crypto.news, Ethereum (ETH) traded around $1,580 at the time of writing, down roughly 5.3% over the past seven days and about 25% for the quarter. The decline completed Ethereum’s first-ever streak of three consecutive quarterly losses.
Selling pressure also intensified after the Ethereum Foundation announced a restructuring on June 23 that included a 20% workforce reduction and a 40% budget cut, raising fresh concerns about development spending while large holders continued reducing exposure.
Corporate buyers, however, have continued to accumulate into the weakness. SharpLink disclosed another purchase of 10,000 ETH at an average price of $1,611, spending about $16.1 million to expand its treasury. Separately, Bitmine added 27,084 ETH during the past week, lifting its holdings above 5.7 million ETH. Those purchases have so far failed to offset persistent selling from whales and institutional investors.
Bitmine, however, framed the quarter-end weakness as partly technical rather than purely fundamental. In a June 30 post on X, the company said “window dressing is taking place,” adding that institutions often sell underperforming assets toward the end of a quarter. Bitmine noted that Bitcoin was down 13% and Ethereum was down 25% for the quarter, saying crypto was “being sold” into the reporting period.
On-chain activity has remained mixed. According to Ali Martinez, Ethereum whales sold roughly 550,000 ETH over the past week, adding substantial supply to the market. Lookonchain separately reported that one whale exited a 2,468 ETH position after holding it for more than five months, realizing a loss of about $4.33 million after selling near $1,572.
FG Nexus has also struggled with its Ethereum treasury strategy. According to Lookonchain, the company has realized about $86.6 million in losses after buying ETH near the 2025 highs and later selling at much lower prices.
Meanwhile, institutional demand has yet to recover. Spot Ether ETFs have recorded approximately $274 million in cumulative net outflows across consecutive sessions without posting a single day of positive inflows. At the same time, capital has continued flowing into U.S. artificial intelligence stocks and the recently launched SpaceX IPO, leaving fewer buyers available to absorb Ethereum’s selling pressure.
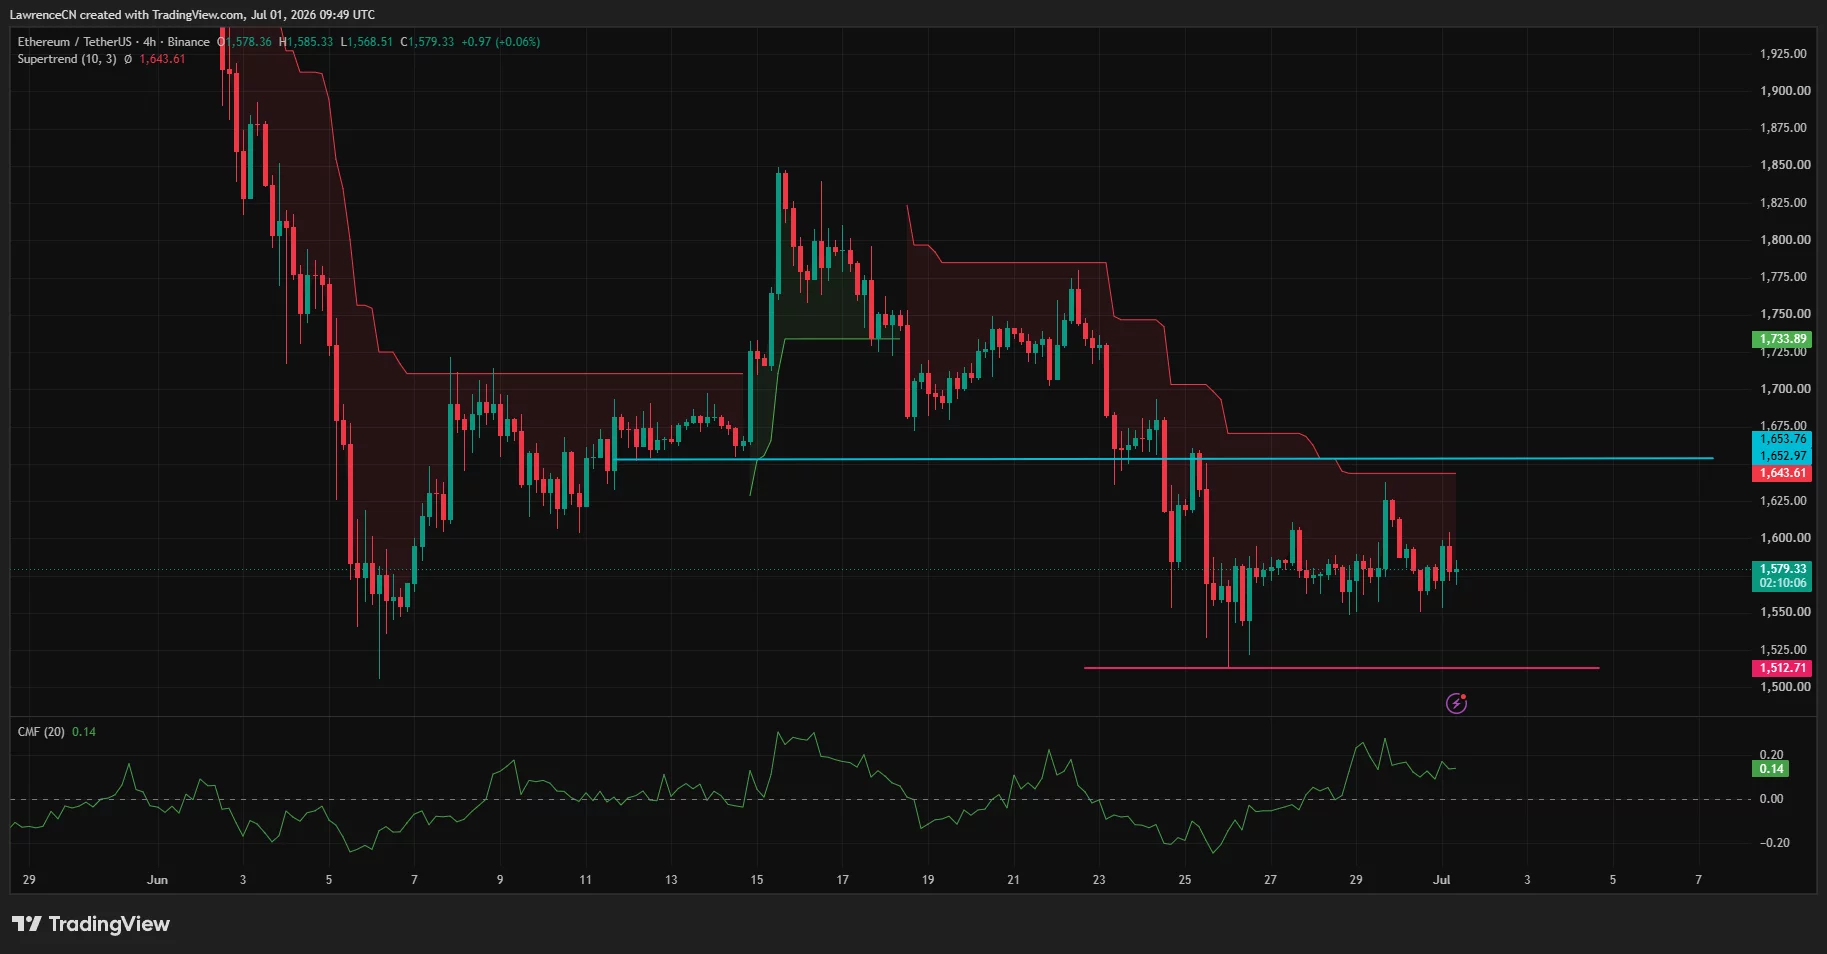
Technical structure leaves Ethereum trapped between $1,500 and $1,650
Ethereum’s daily chart continues to trade below a descending trendline that has capped every recovery attempt since May. The asset also remains below the daily Supertrend resistance near $1,644, while the 78.6% Fibonacci retracement around $1,695 forms the next major resistance level should buyers regain control.
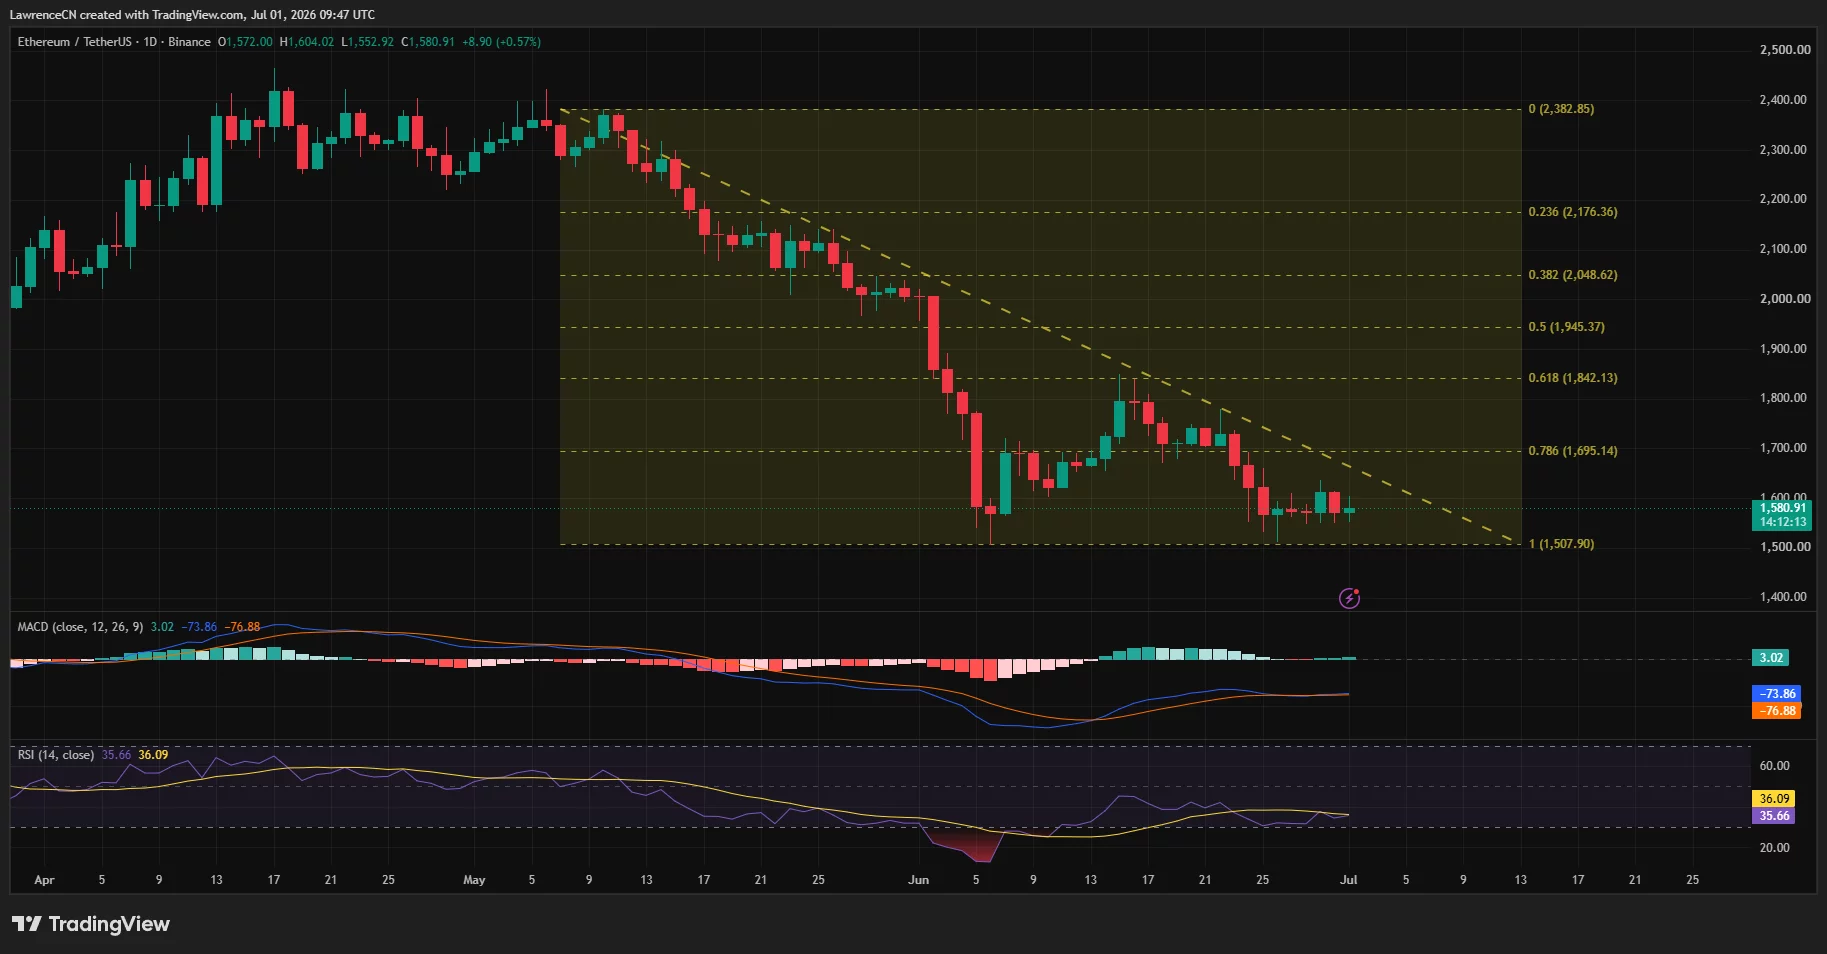
Momentum indicators have yet to confirm a reversal. The daily RSI remains near 36, keeping Ethereum in bearish territory despite stabilizing above recent lows. MACD has begun flattening after weeks of decline but has not produced a decisive bullish crossover. On the 4-hour chart, Chaikin Money Flow has climbed back above zero, suggesting buyers have started returning, although the recovery remains limited while price stays below key resistance.
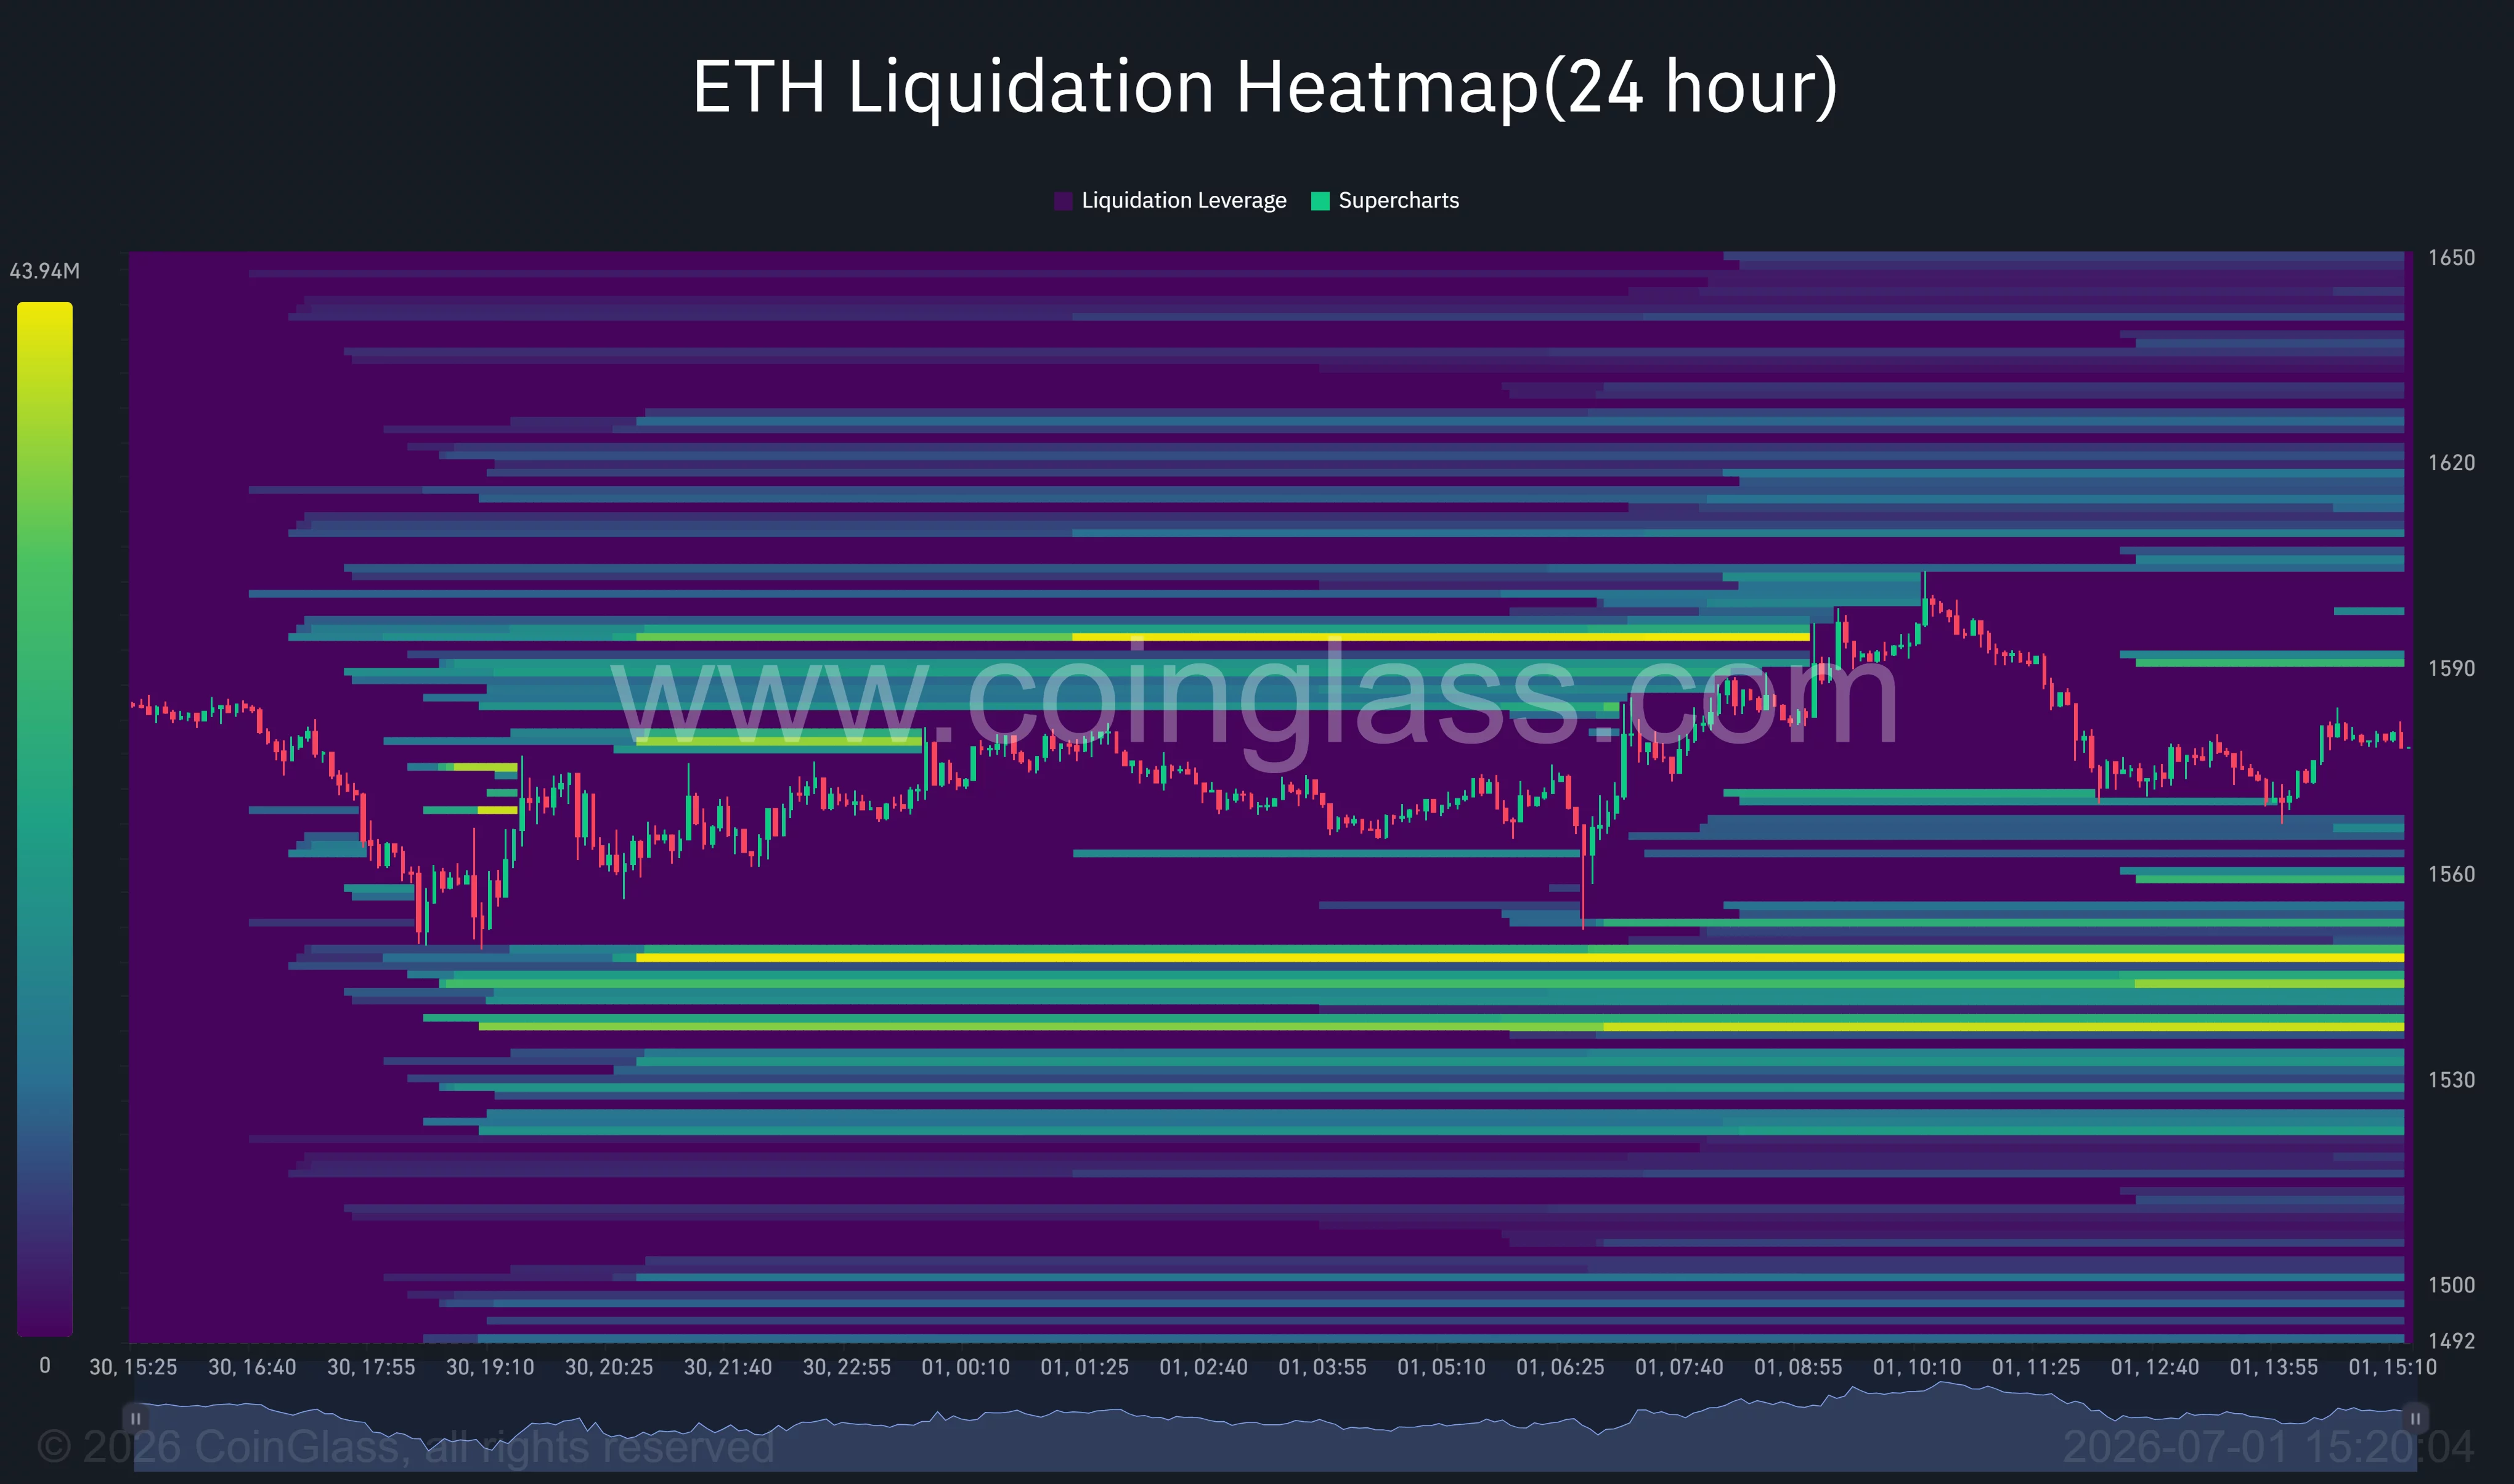
Derivatives positioning also presents a mixed picture. CoinGlass liquidation data shows the largest short liquidation cluster sitting around $1,590-$1,600, while a much larger concentration of long liquidations has built between roughly $1,530 and $1,545. A break above the upper cluster could trigger a short squeeze toward the $1,640-$1,700 region, whereas losing the lower liquidity pocket could accelerate selling into the psychological $1,500 support.
Commenting on the market structure, crypto analyst Ted Pillows wrote:
“ETH is holding better than BTC now… Until Ethereum reclaims the $1,700 level, the chances of a new low will go up.”
His view aligns with the current technical picture, where reclaiming $1,700 would invalidate the series of lower highs that has controlled price action for nearly two months.
Loss of $1,500 support could expose another leg lower
The bearish case strengthens if Ethereum fails to defend the $1,500-$1,510 support band, which also aligns with the recent swing low on the daily chart. A breakdown below that region would invalidate the current consolidation and expose the next downside targets near $1,400 before attention shifts toward the $1,200 area discussed by several market participants.
Macro conditions continue to add uncertainty. Sticky U.S. inflation, expectations for higher interest rates, geopolitical tensions in the Middle East, and weaker decentralized finance activity have reduced risk appetite across digital assets.
Unless ETF flows stabilize, whale selling eases, and Ethereum reclaims resistance above $1,640 and eventually $1,700, quarter-end weakness may continue to weigh on price even as corporate treasuries keep accumulating ETH.
Disclosure: This article does not represent investment advice. The content and materials featured on this page are for educational purposes only.

Against the backdrop of a weak UK economy and inflation above target, the Bank of England paused on 18 June, leaving the base rate unchanged at 3.75% for a fourth consecutive meeting, despite internal disagreements among committee members over the need for a rate hike. The contrast with the European Central Bank’s actions was notable: on 11 June, the ECB raised interest rates in response to a surge in eurozone inflation driven by higher energy prices amid the Middle East conflict. As a result, the monetary policy paths of London and Frankfurt temporarily diverged, with market attention now shifting to two upcoming meetings: the ECB on 23 July and the Bank of England on 30 July.
Technical Outlook
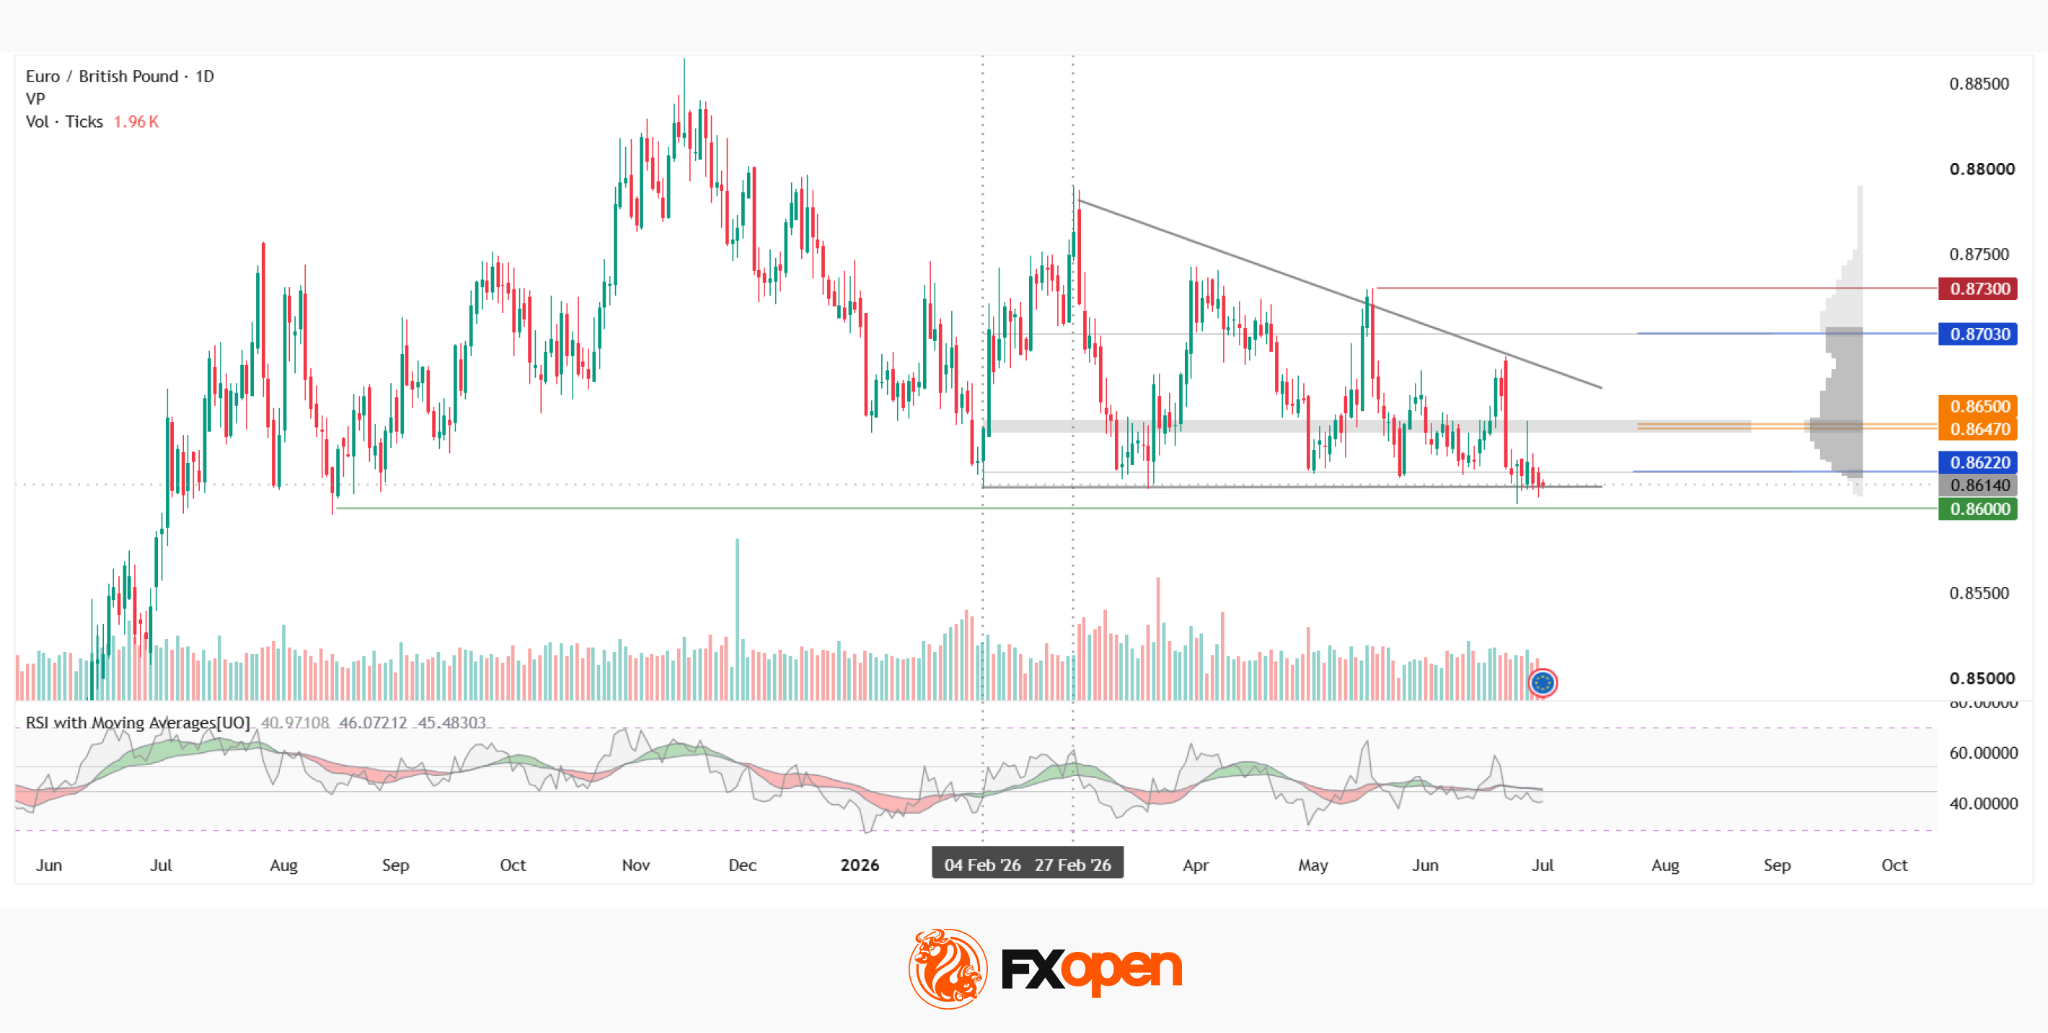
On the daily chart, EUR/GBP has been forming a bearish structure since November last year. After peaking around 0.8860, the pair moved into a broad trading range, and in February a descending triangle began to take shape. The price is currently testing the triangle's lower boundary.
Immediately below the triangle's lower boundary lies support at 0.8600, while slightly above it is the lower boundary of the current volume profile at 0.8622. This cluster of three technical levels could help keep the pair within the triangle, whereas a downside break may trigger increased market activity.
Above this area is the Point of Control (POC) zone at 0.8647–0.8650, where the bulk of trading volume for the first half of the year is concentrated. If the price breaks above this zone, it could move on to test the triangle's upper boundary. Should buying pressure overcome the descending resistance line, the upper boundary of the volume profile at 0.8703 and the resistance level at 0.8730 may act as the next barriers.
The RSI and MAs indicators currently stand at 41, 46 and 45, respectively. The RSI remains below the neutral 50 level, while the MAs, although approaching the lower boundary of the neutral zone, remain positively aligned.
Summary
The combination of the Bank of England keeping interest rates unchanged and the ECB's recent rate hike creates a backdrop in which the technical reaction around 0.8600 or the POC zone could become a key factor in determining the next directional move for EUR/GBP.


The MiCA transition period and final deadline have ended, marking a decisive shift for the European crypto market. Only providers holding a valid license under the EU Markets in Crypto-Assets Regulation (MiCA) can now legally offer services across the European Economic Area.
The grace period that allowed unlicensed crypto service providers to keep operating is now gone. In the weeks leading up to the deadline, the European Securities and Markets Authority (ESMA) issued a final warning to unauthorized firms, telling them to wind down EEA operations before the cutoff.
A Single EU Rulebook Replaces 27 Markets
For the first time, a harmonized regulatory framework covers crypto-asset service providers across Europe. MiCA’s passporting principle means a single license obtained in one member state is valid throughout the entire EU.
This eliminates the patchwork of national regimes that previously required separate compliance efforts in each country.
For institutional investors, that clarity is critical. Regulatory uncertainty has kept many banks and asset managers on the sidelines of the digital asset space.
MiCA now sets explicit standards for custody, governance, and capital requirements, a framework that traditional financial institutions can actually plan around.
Simon Schneider, CEO of Sygnum Europe, describes the end of the transition period as a defining moment for the competitive landscape:
“The end of the transition period is a sorting moment: the market will increasingly consolidate around regulated players who can both operate at scale in terms of operational experience and regulatory compliance as much as innovative products and service. Bank-grade trust becomes a competitive moat under MiCAR.”
Market Consolidation Already Underway
The shakeout is well underway. Bybit restricted its platform for EEA users as Binance also scaled back its European presence.
On the other side, Coinbase opened a MiCA hub in Luxembourg covering all 27 EU states, and Ripple secured a preliminary CASP license in Luxembourg. Euro stablecoins hit record highs under MiCA, suggesting that regulatory clarity does attract capital.
For regulated providers already holding licenses and operational infrastructure, the new environment opens significant growth opportunities.
More than 5,000 banks across Europe have not yet offered digital asset services, largely due to the cost and complexity of building the required infrastructure safely.
MiCA’s clarity changes the calculus. For many, the realistic path may be through established regulated partners rather than building from scratch.
Schneider sees this as a structural shift in how trust and market access relate:
“As traditional and digital finance increasingly converge, trust will remain Europe’s most valuable currency. Direct access to the European market, powered by our global banking platform, will help us bring Sygnum’s trusted, secure services to more clients across Europe,” said the CEO of Sygnum Europe.
Whether MiCA delivers the expected acceleration in institutional crypto adoption will become clearer over the coming months. This is particularly true as MiCA-compliant stocks attract investor attention and banks decide whether to build, partner, or stay out entirely.
The post MiCA Transition Period Ends: Who Wins the EU Crypto Market? appeared first on BeInCrypto.
Cryptocurrency markets headed into the third quarter of 2026 with a notable reset in leverage, but also with noticeably thinner liquidity. A wave of liquidations in Q2 cleared out a large portion of leveraged positioning, even as key demand drivers weakened into the same period, according to Talos data cited in a market update.
That combination—less leverage clearing the system but less depth to cushion future selling—sets up a market that may be less prone to immediate forced cascades, while still capable of sharp price swings when large orders hit thin order books.
Key takeaways
- Q2 liquidation totals were substantial: Talos reports $8.35 billion in combined Bitcoin and Ether long liquidations.
- Derivatives leverage fell: Bitcoin open interest dropped to $33.5 billion (down 32% from its Q2 peak) and Ether open interest fell to $16.2 billion (down 40%).
- Liquidity thinned: Bitcoin order-book depth slipped to roughly $35–$40 million by late June from around $70 million in early May.
- Demand pressures aligned with deleveraging: Talos links the liquidation wave to spot Bitcoin ETF outflows, reduced buying by Strategy, and contraction in stablecoin supply.
Deleveraging cleared leverage, but market depth fell
Talos’ update points to Q2 as a period where speculative positions were largely unwound. Long liquidations for Bitcoin and Ether totaled $8.35 billion, a move that Talos describes as contributing to a more stable environment entering Q3.
However, stability after a liquidation event does not automatically translate into resilience. Talos warns that reduced order-book depth—meaning there is less buy and sell liquidity near current prices—can leave the market less able to absorb renewed selling pressure. In practical terms, fewer resting orders can raise the odds of abrupt moves when market participants try to exit at once.
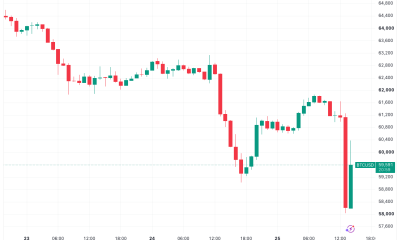
By midweek, Bitcoin was trading at $58,656, after hitting an intraday low of $57,742. That level was its lowest since Sept. 17, 2024, underscoring how the post-liquidation reset did not eliminate downside pressure.
Open interest drops: a gauge of how much leverage remains
One of the clearest signals that leverage was reduced in Q2 is open interest, which tracks the notional value of outstanding derivatives positions. Talos reports that Bitcoin open interest fell to $33.5 billion, down 32% from the Q2 peak. For Ether, open interest declined to $16.2 billion, a 40% drop.
Lower open interest generally means fewer leveraged bets remain outstanding. That can reduce the likelihood of rapid liquidation spirals if prices move sharply. Still, the other side of Talos’ caution is liquidity: if trading activity remains weak and depth stays shallow, markets can still experience large price swings even without the same level of leveraged positioning.
Stablecoins, order books, and spot volumes: the liquidity picture
Alongside the deleveraging, Talos highlights a market that is trading with less capacity to absorb shocks. Bitcoin’s 2% order-book depth—the aggregate value of orders within 2% of the market price—fell to about $35–$40 million by late June from approximately $70 million in early May.
Spot activity also weakened. Talos reports spot exchange volume declined 28% quarter-over-quarter to $2.32 trillion. When both order-book depth and spot volumes contract, traders often face a market that clears faster but with less friction—meaning fewer participants are absorbing size, and price can move more quickly on incremental flow.
Demand softening: ETF outflows and Strategy’s slower buying
Talos ties the deleveraging period to weakening spot demand during Q2. The report points to spot Bitcoin ETF outflows and reduced Bitcoin purchases by Strategy, alongside a contraction in stablecoin supply.
ETF flows illustrate that demand did not hold steady. Cointelegraph previously reported that US spot Bitcoin ETFs logged $696.3 million in net outflows on June 25. Earlier coverage also noted that June saw roughly $4.5 billion in outflows, which pushed year-to-date outflows to $5.5 billion (as reported by Cointelegraph in links cited above).
Strategy’s buying pace also slowed materially over the same quarter window. Company disclosures cited in the original coverage indicate Strategy purchased about 3,600 BTC in June—down from roughly 25,000 BTC in May and more than 50,000 BTC in April. The same set of disclosures indicated a net sale of 32 BTC earlier in June and a June ending treasury of 847,363 BTC, bought at an average price of $64,103 per coin (details referenced in the cited Cointelegraph links).
The significance for investors and traders is straightforward: when spot demand is weaker, the market has less “natural” buyer absorption during selloffs. That doesn’t guarantee a downtrend, but it can change how quickly prices react to negative catalysts—especially when liquidity is already thinning.
What to watch next: depth, flows, and leverage metrics
The key question heading deeper into Q3 is whether liquidity and demand stabilize at current levels. Talos’ data suggests the market may be less leveraged but also less buffered, so traders should monitor order-book depth, spot volumes, ETF net flows, and open interest for signs of either renewed fragility—or a return of steadier participation.
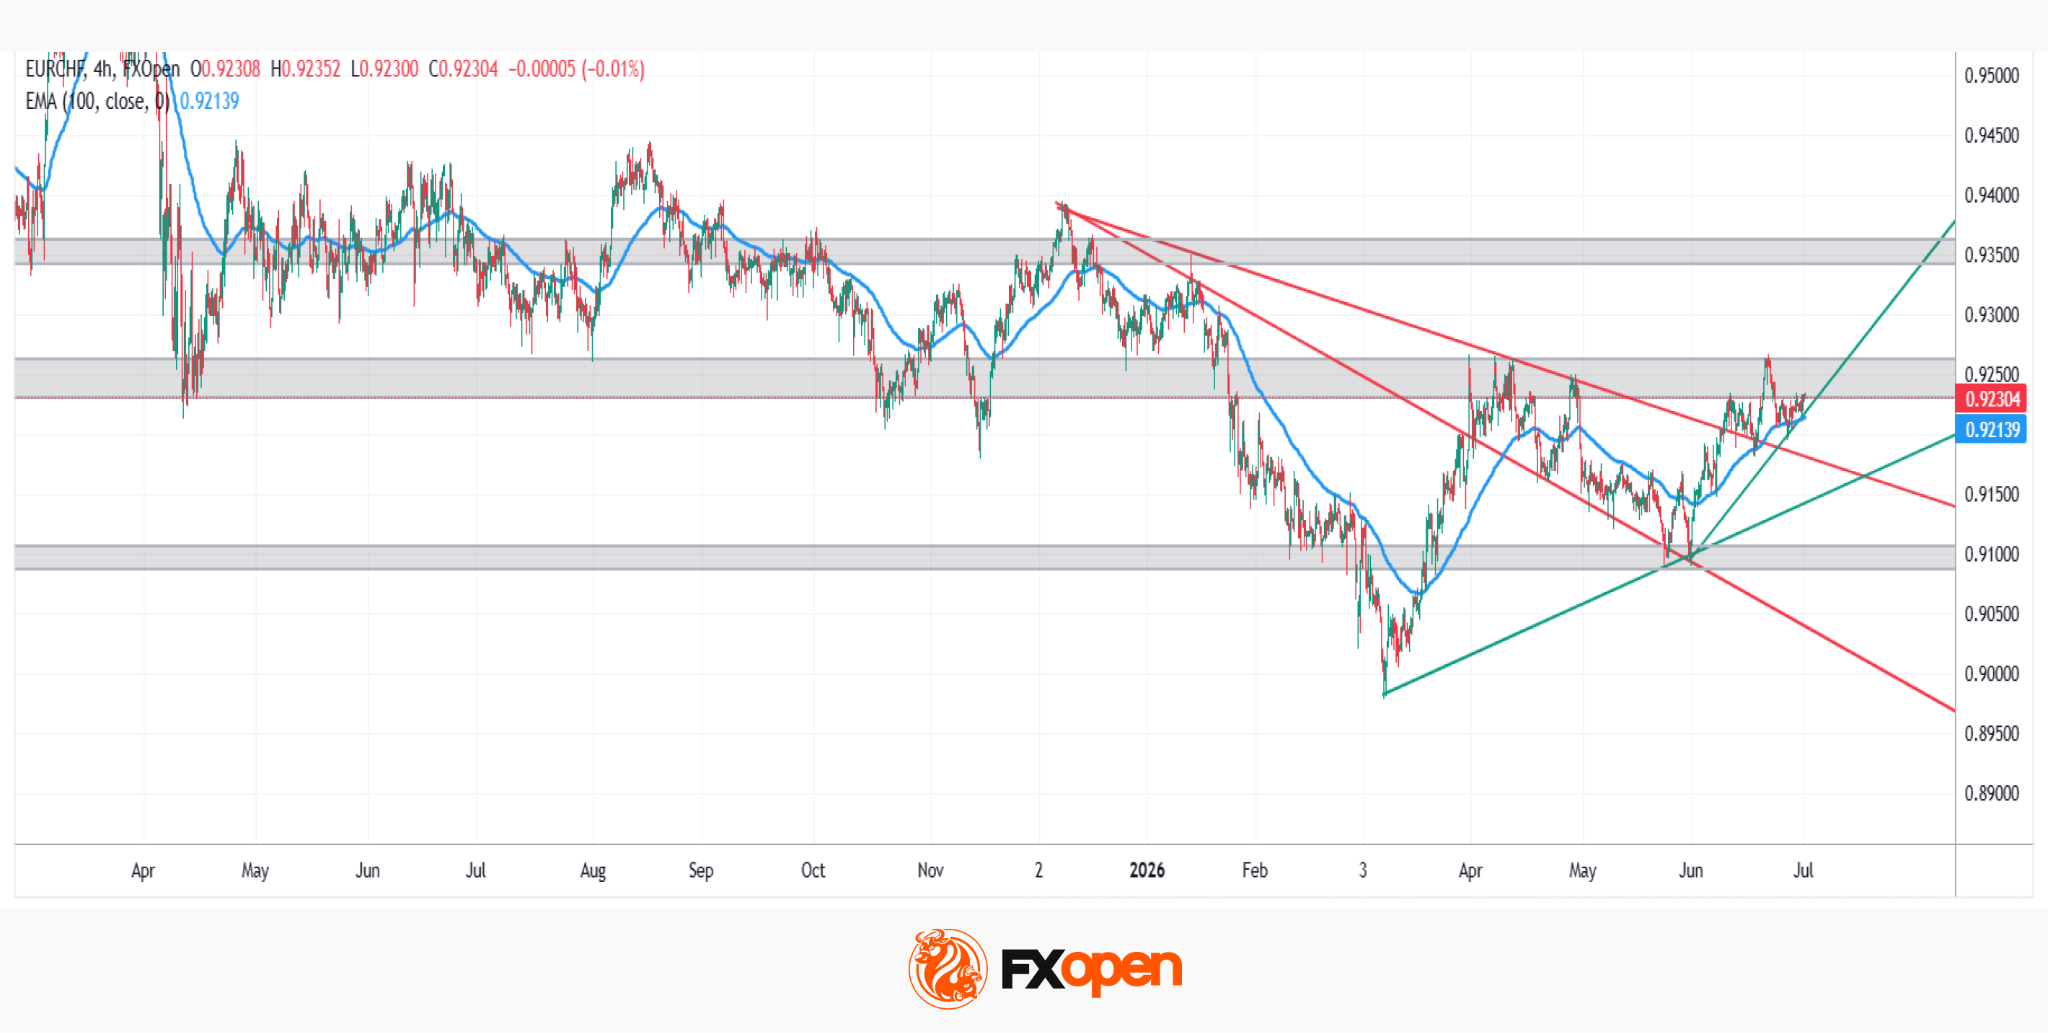
The EUR/CHF pair is trading within a clear divergence between the two central banks. The ECB raised rates by 25 basis points on 11 June, lifting the deposit rate to 2.40% — its first hike since 2023 — after eurozone inflation climbed to 3.2% in May on the back of the Middle East-driven energy shock. More recent signals suggest easing pressure, though, as falling oil prices following the peace agreement have reduced expectations of a further hike in July.
On the Swiss side, the SNB left rates unchanged at 0.00% on 18 June, while signalling greater readiness to intervene in the currency market to contain excessive franc strength. Despite the ECB’s rate advantage, the franc remains structurally firm below parity, underpinned by its so-called safe-haven status and the still-fragile geopolitical backdrop. A renewed bout of risk-off sentiment could see the franc regain ground even against a higher-yielding euro.
Technical Analysis of EUR/CHF

After bottoming out in March 2026, EUR/CHF has been building a medium-term bullish structure. Price is now testing a pivotal zone, the former support around 0.9240–0.9260, which has since flipped into resistance.
Bullish scenario
The 100-period EMA has been underpinning price for several sessions, while two ascending trendlines reinforce the recent breakout from the descending channel. A confirmed break above the 0.9240–0.9260 zone could open the way toward the next key level near 0.9350, validating a bullish structural shift for the pair.
Bearish scenario
A rejection from the current zone, with price slipping back inside the descending channel it recently broke out of, could reignite stronger bearish pressure and drag the pair back toward the 0.9100 support area.
With both the fundamental and technical picture converging at this decisive juncture, and the next central bank moves still uncertain, will EUR/CHF finally manage to break through this heavily contested zone?
Trade over 50 forex markets 24 hours a day with FXOpen. Take advantage of low commissions, deep liquidity, and spreads from 0.0 pips (additional fees may apply). Open your FXOpen account now or learn more about trading forex with FXOpen.
This article represents the opinion of the Companies operating under the FXOpen brand only. It is not to be construed as an offer, solicitation, or recommendation with respect to products and services provided by the Companies operating under the FXOpen brand, nor is it to be considered financial advice.

XRP RED ALERT: $258.79 RIPPLE PRIME Just Confirmed

Hays Travel hosts summer garden party in Sunderland

Why Youth Mentoring Is a Business Imperative


-

 Fashion5 days ago
Weekend Open Thread: Staud – Corporette.com
-

 Politics5 days ago
The House | Manchesterism won’t survive the painful trade-offs unless it gets citizens on board
-

 Crypto World1 day ago
Strategy authorizes up to $1.25B in Bitcoin sales under new capital plan
-

 Politics5 days ago
Potential 2028er World Cup attendee leaderboard
-

 Business5 days ago
Asia stock markets slide as tech shares slump
-

 News Videos3 days ago
MAJOR BITCOIN & MARKET UPDATE!!!! (MUST WATCH ASAP!!!)
-

 Tech6 days ago
A Look At A Gaggle Of Transputer Boards
-
 Crypto World6 days ago
Dell (DELL) Shares Tumble Over 5% Following Analyst Downgrade to Hold
-

 Crypto World4 days ago
Coinbase, Circle Deepen Crypto Stock Losses Despite Resilient S&P 500
-

 Business1 day ago
Australia treasurer says alleged access of prime minister’s bank data ’incredibly concerning’
-

 Crypto World4 days ago
Kraken's xStocks Opens Bending Spoons IPO Registration to EEA Retail
-

 Sports5 days ago
FIH Pro League: India defeat Pakistan 7-1, register biggest win of campaign | Other Sports News
-
 Crypto World5 days ago
Bitcoin Sparks $600M Hourly Liquidations With $65,000 Set To Become Resistance
-

 Tech3 days ago
Bluekit phishing kit adopts browser-in-the-middle for login theft
-

 Tech4 days ago
Russian hackers now target Signal backup recovery keys
-
Crypto World5 days ago
Hyperliquid Named on Singapore MAS Investor Alert Register
-
 Crypto World6 days ago
Ripple and SBI launch RLUSD in Japan after JFSA approval
-

 Crypto World5 days ago
RTX holders must register wallets before token distribution begins
-

 Tech1 day ago
Anonymous researcher drops 0-day ‘exploitarium’ repo
-
 Business2 days ago
The AI boom won’t burst all at once. It will pop in ‘rolling bubbles’: Macquarie
You must be logged in to post a comment Login