

Crypto World
Trump earned $1B from crypto. What he holds


The headline number is income, not a wallet balance. Trump’s disclosure shows more than a billion dollars in crypto earnings, but what he holds today is a smaller and more specific story worth reading carefully.
Summary
- President Trump’s annual financial disclosure, released June 30, 2026, reports more than $1 billion in crypto-related income for 2025, with some outlets totaling the figure near $1.4 billion.
- The largest single line is about $635 million in royalties tied to the $TRUMP meme coin, paid through CIC Digital LLC under a licensing arrangement described as Celebration Coins.
- World Liberty Financial, the Trump-linked venture that issues the WLFI token and the USD1 stablecoin, accounts for the bulk of the rest, roughly $515 million to $592 million across token sales and an equity sale.
- Income is not the same as holdings: the filing lists current cold-wallet positions of over $50 million in Bitcoin and a smaller Ethereum position, plus staking rewards, figures far below the headline earnings number.
- The disclosure has drawn conflict-of-interest criticism, which the White House denies, and it lands as crypto market-structure legislation remains stalled in the Senate.
The number everyone repeated was “more than a billion dollars,” and it is accurate. But it answers a different question from the one most readers think they are asking. Trump’s disclosure reports crypto income, the money his ventures earned and distributed over the year, not a snapshot of a wallet. What he actually holds today is a separate and smaller figure, and the gap between the two is the most important thing in the filing.
This piece separates the earnings from the holdings, walks through where each number comes from, explains the vehicles behind them, and covers the conflict question honestly, with the criticism and the denial both on the page. The goal is the real picture, not the headline. Trump’s crypto ventures were extraordinarily lucrative in 2025, but that does not mean the disclosure shows a billion-dollar crypto wallet. It shows a much more specific mix of licensing income, token-sale proceeds, Bitcoin holdings, Ethereum exposure, staking rewards, and Trump-linked token businesses.
What the disclosure is
The document is a routine but revealing instrument: the annual public financial disclosure that federal officials must file, submitted on the Office of Government Ethics Form 278e and covering the 2025 reporting year, the first full year of Trump’s second term. It was released on June 30, 2026, after a 45-day extension, and it is enormous, running to roughly 900 pages by most counts, with one tally at 847. For comparison, recent predecessors filed forms in the single or low double digits of pages. That scale alone explains why the first wave of headlines focused on the biggest and easiest number to repeat.
Two features of the format matter for reading it correctly. First, values are reported in dollar ranges, or brackets, not exact amounts, which is standard for government ethics filings. When the disclosure says a holding is worth “over $50 million,” that is the top bracket on the form, and the true figure could be higher. Second, the filing mixes income and assets throughout, listing what ventures earned alongside what the filer holds.
Conflating the two is the single most common error in the coverage, and avoiding it is the whole point of reading the document carefully. Income tells you what flowed in during the year. Holdings tell you what remained as assets at the reporting date. The filing contains both, and the difference between them changes the story.
The income: where the billion-plus came from
The earnings side is where the large numbers live, and it breaks into two main sources. The single biggest line on the entire filing is roughly $635 million in royalties tied to the $TRUMP meme coin, paid through CIC Digital LLC under a licensing arrangement the filing describes as Celebration Coins. That one item accounts for more than half of the crypto income by itself. It is also why the TRUMP meme coin category matters here: the biggest number in the disclosure came from a politically branded token business, not from ordinary trading gains.
The second major source is World Liberty Financial. Across the filing, WLF-linked proceeds run to roughly $515 million to $592 million, depending on how the line items are grouped. That total includes general token-sale distributions in the low hundreds of millions, an equity sale of about $65 million tied to a Trump-affiliated entity that held a 38.25% stake in the venture, and a wallet-by-wallet breakdown of token proceeds. That breakdown is unusually granular: Ethereum proceeds of about $150.6 million, Bitcoin proceeds of about $33.5 million, USDC proceeds of about $56 million, and smaller distributions in tokens including Link, Aave, ENA, Move, and Ondo.
Add the two sources together and the crypto income clears $1 billion, with some outlets putting the full-year figure near $1.4 billion. The key word across all of this is income. These are proceeds from selling tokens and licensing a brand, realized and distributed over the year. They describe money that came in, not a pile of assets sitting in a wallet today.
The holdings: what he actually owns now
This is the part the headlines skip. Separate from the income, the disclosure lists current crypto holdings, and they are far smaller than the earnings. The filing shows a cold-wallet Bitcoin position valued at over $50 million, the top bracket on the form, and a smaller Ethereum position, reported in a multimillion-dollar range that varies across readings of the filing’s line items. It also notes ether staked through a Coinbase arrangement that produced about $1.8 million in validator rewards, meaning some of the Ethereum is generating yield.
The contrast is the story. More than a billion dollars flowed through Trump’s crypto ventures as income, but the disclosed holdings amount to a Bitcoin stake above $50 million and a smaller Ethereum stake, plus whatever exposure runs through the WLFI token and USD1 stablecoin tied to World Liberty Financial. In other words, the ventures earned enormously, but the reported end-of-period crypto assets are a fraction of that, consistent with income being distributed or moved rather than accumulated as a growing on-chain balance. Anyone picturing a billion-dollar wallet is misreading the filing.
That does not make the holdings trivial. A cold-wallet Bitcoin position above $50 million is still a large disclosed crypto asset for any public official, and it sits inside a much wider portfolio. But it is not the same thing as the income number. The more accurate read is that the crypto businesses generated the headline money, while the disclosed direct crypto holdings show a smaller ongoing exposure led by Bitcoin.
Income versus holdings: why the distinction matters
The gap between the two numbers is not a technicality. It changes what the disclosure actually tells you. Income measures the flow of money a venture generated and paid out over a period. Holdings measure the stock of assets held at a point in time. A licensing deal can generate $635 million in royalty income without any of it remaining as a crypto holding, because royalties are paid in cash or converted, not held as tokens.
Token sales generate proceeds precisely by selling the tokens, which reduces holdings even as it produces income. That is why a venture can produce hundreds of millions of dollars in crypto-related income while the end-of-period balance sheet shows a much smaller direct crypto position. The same logic applies to staking rewards: a reward is income, while the staked ether is a holding. Mixing those categories makes the disclosure look like a single giant pile of crypto, when it is actually a set of different flows and assets.
So the honest framing is this: Trump’s crypto ventures were extraordinarily lucrative in 2025, and his disclosed crypto holdings at the end of the period were comparatively modest, led by a Bitcoin position above $50 million. Both facts are true, and reporting only the first inflates the picture. The holdings figure is the better guide to ongoing exposure, while the income figure is the better guide to how much the ventures earned. Reading them as one number, a billion-dollar hoard, is simply wrong.
World Liberty Financial and the token machine
Understanding the income requires understanding the vehicle behind most of it. World Liberty Financial is the Trump-linked crypto venture, co-founded by family members including Eric Trump and Donald Trump Jr., that issues the WLFI governance token and the USD1 stablecoin. It is the engine that produced the bulk of the non-meme-coin crypto income in the disclosure, through token sales and the equity stake held by an affiliated entity. For readers trying to parse the structure, the WLFI governance token and the USD1 stablecoin are different instruments with different economics.
WLF matters beyond the 2025 figures because it is an ongoing business, not a one-time event. A governance token and a stablecoin are products that keep generating activity, fees, and potential proceeds, which means the venture is a recurring source of income rather than a closed chapter. For anyone tracking the crypto-market implications, WLFI and USD1 are the live instruments to watch, since their adoption and trading are where the venture’s future value, and the associated exposure, will show up. The disclosure quantifies what WLF generated in one year; the tokens are how the story continues.
That is also why the WLF portion of the filing is politically and commercially important. It is not merely a passive investment line. It is a live Trump-linked crypto business operating in the same sector the administration is regulating. The financial disclosure does not settle the ethics question, but it gives the market a clearer picture of how large the business has already become.
The $TRUMP meme coin
The largest single income line deserves its own look. The $TRUMP meme coin launched on the Solana network just days before Trump returned to office in January 2025, and the roughly $635 million in the filing came almost entirely from royalties on a licensing agreement, routed through CIC Digital LLC and described as Celebration Coins. This is a licensing structure: the earnings are royalty income from the use of the brand and the coin, not proceeds from Trump trading the token himself. That distinction matters because it explains why the line can be so large without matching a current token balance.
The meme coin is also the clearest illustration of the income-versus-holdings point. A licensing royalty of $635 million is a payment for the use of a name and a product, and it does not imply a corresponding crypto holding. It is cash income generated by the coin’s existence and trading, flowing to the licensor. The meme coin made a great deal of money as a business line, which is a separate fact from whether the president holds a large position in the token today.
It also carries the heaviest headline risk. A politically branded meme coin is not just a crypto product; it is a financial instrument tied to a public officeholder’s name and political identity. That makes it commercially powerful and ethically sensitive at the same time. The disclosure confirms the scale of the income, but it does not make the token safer, less volatile, or less politically exposed.
The conflict-of-interest question
No honest account of this disclosure can skip the controversy, and no fair one can take a side on it. The scale of a sitting president earning more than a billion dollars from crypto ventures, while his administration pursues favorable crypto policy, has drawn sharp conflict-of-interest criticism, including from lawmakers. Some Democrats opposing crypto market-structure legislation have argued it should not pass without ethics language barring the president and his family from crypto businesses. Critics frame the overlap between Trump’s crypto income and his crypto policy as the core problem.
The White House rejects the framing. A spokesperson has said neither the president nor his family has engaged or will engage in conflicts of interest, and the Trump Organization says the assets are managed by third-party institutions with trades executed through automated technology, meaning the president does not direct the investments. The administration casts its crypto stance as promoting American innovation and economic growth rather than personal benefit. Both positions are part of the record.
The disclosure documents the numbers; whether they represent an improper conflict is a contested judgment, and this article reports the dispute without resolving it. The market implication is that the Trump-linked tokens now sit at the center of both commercial opportunity and legislative scrutiny. That scrutiny matters because the market-structure legislation remains part of the broader policy backdrop for every major crypto business in the U.S. The more directly presidential crypto interests enter that debate, the harder the politics become.
What it means for the Trump-linked tokens
For the crypto market specifically, the disclosure sharpens attention on the instruments tied to Trump: the $TRUMP meme coin, the WLFI governance token, and the USD1 stablecoin. Quantifying how much these ventures earned confirms they are significant, active businesses instead of novelties, which is relevant context for anyone assessing the tokens. Heavy political attention, regulatory debate, and the ongoing legislative fight over crypto rules all bear on how these assets trade. They now carry both market risk and political risk in a way few crypto assets do.
None of that is a reason to buy or avoid them, and this is not advice. It is a note that the tokens now carry a documented commercial and political weight that will keep them in the headlines, and that headline risk cuts both ways, drawing interest and scrutiny in equal measure. The disclosure is a data point about the ventures behind the tokens, not a signal about where their prices go. It proves the businesses generated enormous income; it does not prove the tokens are good investments.
The distinction matters most for the meme coin. A meme coin can generate royalty income for a brand owner while still being volatile, speculative, and structurally risky for traders. A stablecoin can grow as a payments product while its token remains designed to hold a dollar peg. A governance token can represent influence over a protocol without automatically producing cash flows for every buyer. The disclosure makes the businesses legible, not the token outcomes predictable.
The stocks alongside the crypto
Crypto was the headline, but it sat inside a much larger portfolio that the filing also details, and that context matters for reading the crypto numbers correctly. The disclosure lists hundreds of individual company stocks, including large purchases of Apple, Microsoft, and Nvidia, each recorded in a bracket between $5 million and $25 million, among the biggest single transactions in the document. It also follows an earlier disclosure that covered stock trades made in the first part of the year, including crypto-adjacent names such as Robinhood and Coinbase, and it references investment-account activity in companies including the private-prison operator GEO Group. The filing is not a crypto-only document; it is a broad financial map.
The timing of some trades drew attention. One reading noted that a large Nvidia purchase came shortly after an announcement affecting the company’s China revenue, the kind of overlap that fuels the conflict questions covered above. The Trump Organization has said the president does not direct these trades, which are handled by third-party managers through automated technology, a point the White House emphasizes when the timing is raised. Those denials are part of the same record as the critics’ concerns.
The broader portfolio is relevant to the crypto story because it shows the crypto income and holdings as one slice of a diversified balance sheet, not the entirety of it. The meme-coin royalty was the largest single line, but the disclosure describes a wide spread of assets, which is part of why the crypto holdings, at over $50 million in Bitcoin, look modest against the income figures and against the rest of the portfolio. For market context, the Bitcoin market context is separate from the disclosure itself: Trump’s reported Bitcoin holding is an exposure line, not a forecast for BTC.
How the picture has changed in a year
The disclosure also marks a trajectory, and the trajectory is as striking as any single number. Trump’s estimated net worth has climbed to roughly $6 billion, up from about $2.3 billion a year earlier, according to Forbes, and crypto is a central reason for the jump. In the space of a single reporting year, digital-asset ventures moved from a smaller part of the picture to among the largest income lines on the entire filing, driven by the meme-coin licensing and the World Liberty Financial token sales. That speed is the real story.
It is not just that a sitting president earned a great deal from crypto; it is how quickly crypto became a dominant contributor to a rapidly growing fortune. The pace raises the stakes of the conflict debate, because the larger and faster-growing the crypto income, the sharper the questions about the overlap with crypto policy, and the firmer the White House denials in response. It also signals that the ventures behind the numbers, the $TRUMP meme coin and World Liberty Financial, are likely to keep generating income and attention, since they are active businesses instead of one-year events. For the crypto market, the takeaway is that these instruments are now tied to a high-profile, fast-growing financial story that will keep them in the spotlight.
The year-over-year change, more than any single figure, is what makes this disclosure a marker instead of a footnote. Crypto is no longer a side interest in the financial picture. It is one of the central engines of the reported income and wealth expansion. That makes the next filings, and the policy fights around them, worth watching.
Why the disclosure matters beyond the numbers
Strip away the specific figures and the document still marks something without a clear precedent: a sitting president whose personal fortune is now deeply entangled with an industry his administration actively regulates. Historians reviewing the filing have noted that no modern president has had financial interests of comparable scale and complexity, and the crypto ventures are the sharpest example, because they sit at the intersection of the president’s private income and his public policy. That intersection is what makes the disclosure consequential regardless of where any single number lands. The size of the income turns an ethics debate into a market-structure issue.
The two readings of that fact are both worth stating plainly, because the debate is not going away. One view holds that the entanglement is a structural conflict: when the person setting crypto policy also earns enormously from crypto, the incentives are compromised no matter how the assets are managed, and disclosure alone does not cure it. The other view holds that transparency is the safeguard the system asks for, that the assets are handled by third parties without the president’s direction, and that pro-crypto policy reflects a genuine economic strategy instead of self-dealing. The Trump Organization frames the nearly thousand-page filing itself as evidence of transparency.
Critics frame the same length as evidence of how tangled the interests have become. Both can point to the same document. For the crypto industry specifically, the disclosure is a double-edged moment: it confirms that crypto has reached the highest levels of American wealth and power, while also tying the industry’s public image to a politically charged figure and an unresolved ethics fight. That scrutiny could shape the very legislation the sector is watching.
The stalled market-structure bill, and the push by some lawmakers to attach ethics language limiting presidential crypto involvement, shows how directly the president’s holdings feed back into the rules the whole industry will operate under. That feedback loop, personal holdings shaping policy that shapes the market, is the real reason this filing matters beyond its dollar figures. It is why the crypto market will keep watching how the conflict debate resolves. The filing is not only about what Trump earned; it is about how crypto money, political power, and market rules now overlap.
Frequently asked questions
How much did Trump earn from crypto in 2025?
His annual financial disclosure, released June 30, 2026, reports more than $1 billion in crypto-related income for 2025, with some outlets totaling it near $1.4 billion. The largest piece is about $635 million in meme-coin licensing royalties, and most of the rest comes from World Liberty Financial token sales and an equity sale. These are earnings figures, not a wallet balance. That distinction is the main point: the disclosure shows very large crypto income, but not a billion-dollar crypto holding.
What crypto does Trump actually hold?
The disclosure lists current holdings far smaller than the income. It shows a cold-wallet Bitcoin position valued at over $50 million, the top bracket on the form, and a smaller multimillion-dollar Ethereum position, plus ether staked through Coinbase that produced about $1.8 million in rewards. He also has exposure through the WLFI token and USD1 stablecoin tied to World Liberty Financial. The filing therefore shows a meaningful direct crypto position, but one led by Bitcoin and far below the headline income figure.
Why is the income number so much bigger than the holdings?
Because income and holdings measure different things. Income is money the ventures earned and distributed over the year, such as licensing royalties and proceeds from selling tokens. Holdings are the assets still held at period end. Selling tokens produces income while reducing holdings, and royalties are paid in cash, not held as crypto, so large earnings can leave modest holdings.
What is the $635 million meme-coin figure?
It is royalty income from a licensing agreement tied to the $TRUMP meme coin, paid through CIC Digital LLC and described in the filing as Celebration Coins. The meme coin launched on Solana just days before Trump returned to office in January 2025. The $635 million is a licensing payment for the brand and coin, the single largest line item on the entire disclosure. It is not the same as saying Trump holds $635 million of the token today.
What is World Liberty Financial?
World Liberty Financial is the Trump-linked crypto venture, co-founded by family members including Eric Trump and Donald Trump Jr., that issues the WLFI governance token and the USD1 stablecoin. It produced most of the non-meme-coin crypto income in the disclosure, roughly $515 million to $592 million across token sales and an equity sale by an affiliated entity that held a 38.25% stake. It matters because it is an ongoing token and stablecoin business, not just a one-time income line. Future WLFI and USD1 activity will shape how the story develops.
Are the disclosed figures exact?
No. Government ethics filings report values in ranges, or brackets, not exact amounts. A holding listed as “over $50 million” reflects the top bracket on the form, and the actual figure could be higher. Income line items are more specific, but the holdings figures in particular should be read as bracketed ranges instead of precise balances. That is why exact wallet-style claims should be treated carefully.
Why is the disclosure controversial?
Because a sitting president earning more than a billion dollars from crypto while his administration pursues favorable crypto policy has drawn conflict-of-interest criticism, including from lawmakers seeking ethics limits in crypto legislation. The White House denies any conflict, says the assets are managed by third parties with automated trades, and casts its crypto policy as pro-innovation. Both positions are part of the public record. The disclosure provides the numbers, while the ethics judgment remains contested.
What does this mean for the Trump-linked tokens?
It confirms that the $TRUMP meme coin, the WLFI token, and the USD1 stablecoin sit behind real, sizable businesses, which is relevant context for assessing them. It also means they carry heavy political and regulatory attention that can move sentiment in either direction. This is context, not investment advice, and the disclosure is a data point about the ventures instead of a signal about token prices. The businesses may be significant even if the tokens remain volatile and politically exposed.
Disclaimer: This article is for information purposes only and does not constitute financial, investment, or trading advice, and it takes no political position. Figures are drawn from public reporting on a government disclosure that uses bracketed ranges, and details may be revised as the filing is analyzed further. Nothing here is a recommendation to buy or sell any asset. Always do your own research and consider consulting a licensed professional before making financial decisions. Information is accurate as of July 1, 2026, and will change.

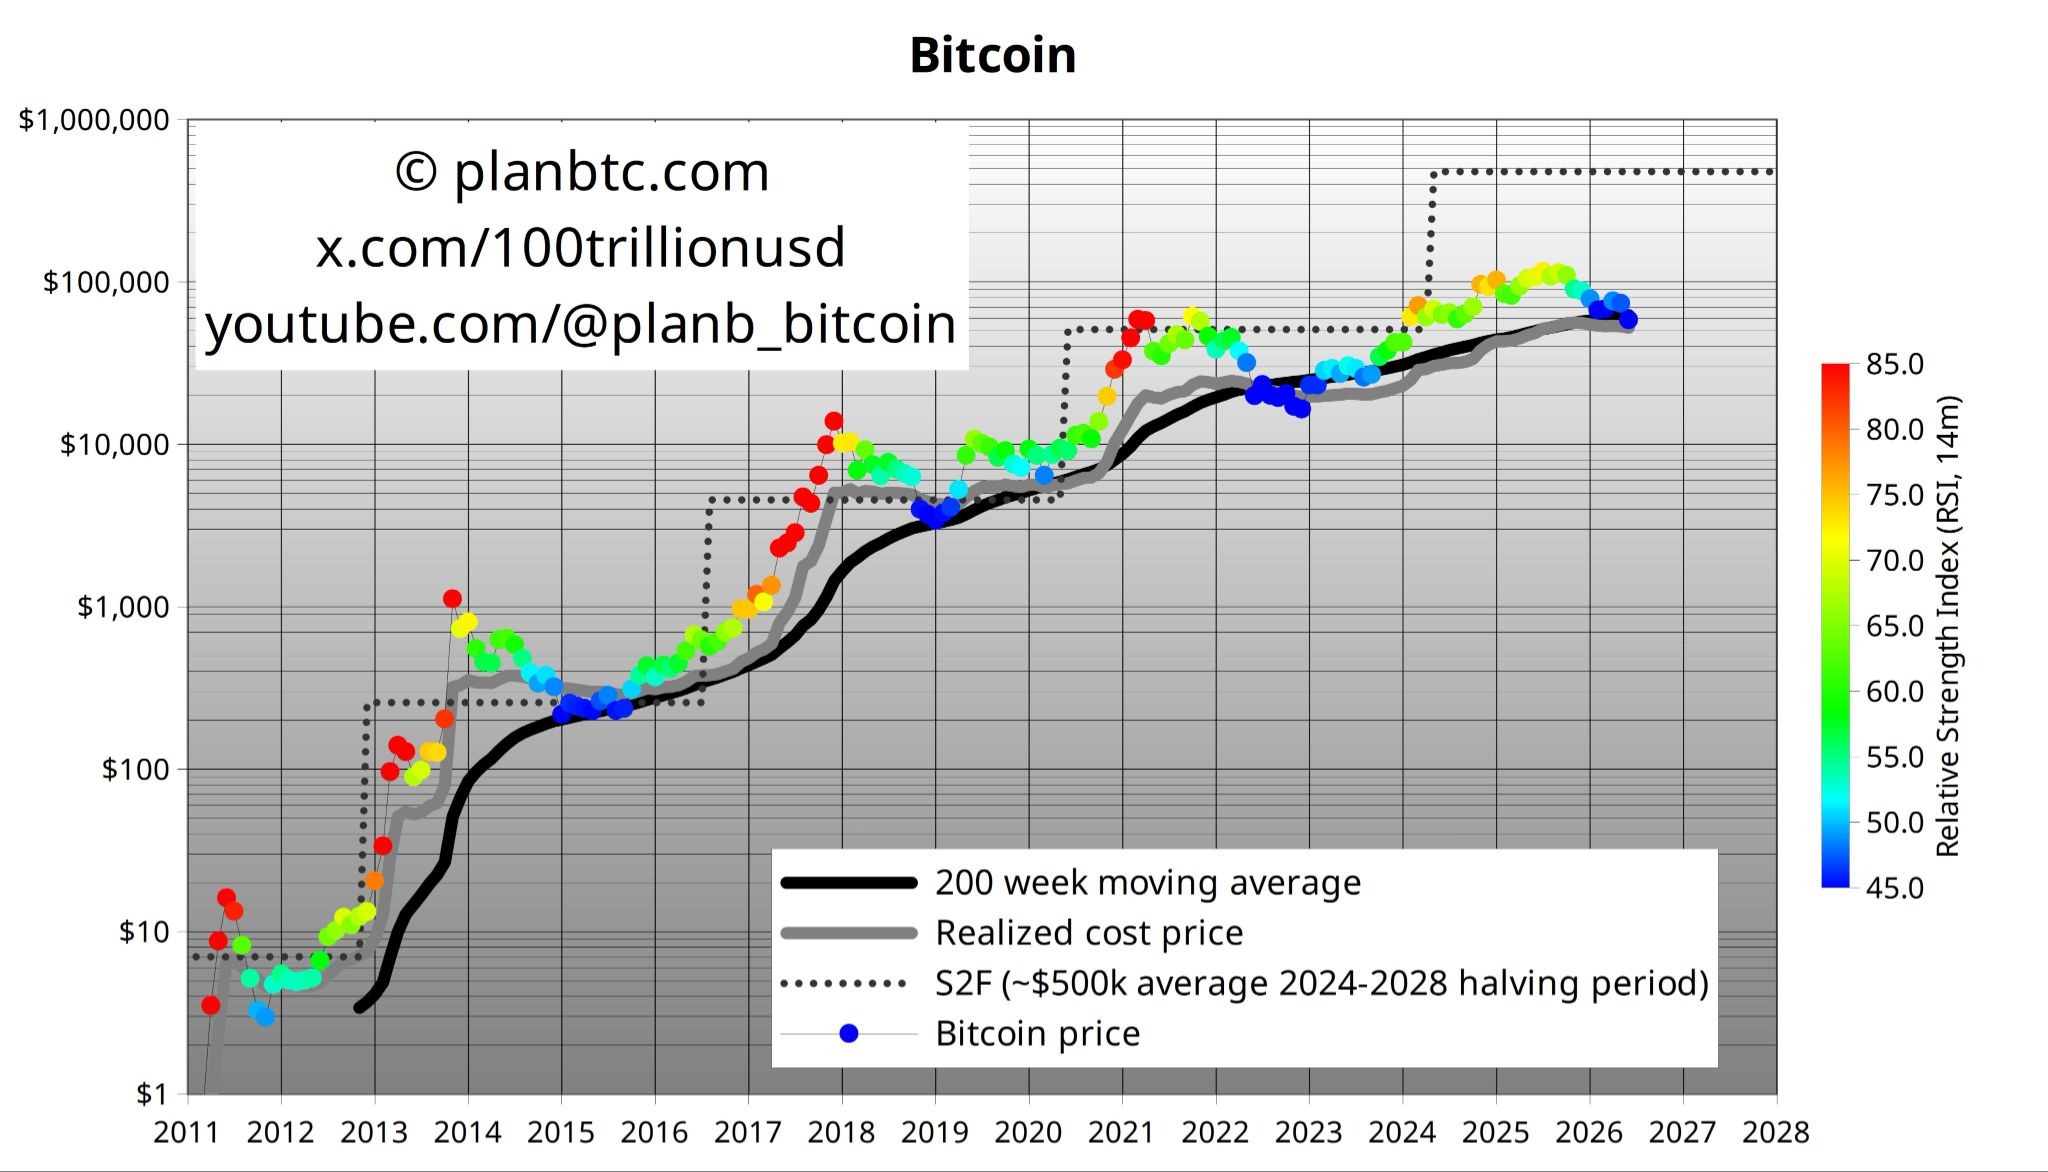
Bitcoin could face further downside pressure after ending June below its 200-week moving average but above its realized price, a combination that crypto analyst PlanB says suggests the market has yet to reach a bear market bottom.
Bitcoin fell 20.5% in June to close the month at $58,526 — its worst monthly performance since June 2022 — below its 200-week moving average of $62,000 but above its realized price of $52,000.
“ALL previous bear market bottoms were below realized price,” said PlanB, the creator of the stock-to-flow pricing model, on Wednesday, adding in a separate post that Bitcoin could drop to $52,000.
The price move would mean Bitcoin falling about 60% from its all-time high of $126,000 in October. The dip could be even deeper, as previous bear markets have seen Bitcoin fall even further, such as 83% in 2018 and 76% in 2022.
BTC is undervalued but can still go lower
“Right now, price is much lower than value and indeed might go lower from here (below realized),” PlanB said. “So, Bitcoin is undervalued but can still go lower.”

BTC is trading between the 200-week moving average and the realized price. Source: PlanB
Bitcoin’s realized price is the aggregate cost basis of all coins in circulation, calculated by valuing each unspent transaction output (UTXO) at the price when it last moved on-chain. It represents the average price at which holders acquired their coins, serving as a key onchain metric for support levels during bear markets.
Related: Bitcoin bounces off 21-month low, but leverage data signals caution: Was $57K the bottom?
Andri Fauzan Adziima, research lead at Bitrue Research Institute, told Cointelegraph that the June close above realized price but below the 200-week moving average “signals the bear bottom is still ahead per prior cycles.”
“I’m eyeing late-2026 capitulation there before the next leg up, though shallower this cycle due to institutions,” he said.
Lacie Zhang, research analyst at Bitget Wallet, told Cointelegraph that the current consolidation near $60,000 is “approaching a potential bottom zone, with strong historical and technical support likely forming around the $55,000 level if further downside occurs.”
Midterm year market bottom
ITC Crypto founder Benjamin Cowen also speculated there could be a cycle bottom for Bitcoin this year, given it is a US midterm election year. This has previously coincided with bear market bottoms in 2018 and 2022.
“The second half of midterm years usually marks the accumulation zone/market cycle bottom,” he said.
The US midterms are scheduled for Nov. 3, when all House of Representatives seats and about a third of Senate seats are up for election.
Magazine: Bitcoin slides to $58K, XRP hits $1 but onchain data promising: Market Moves
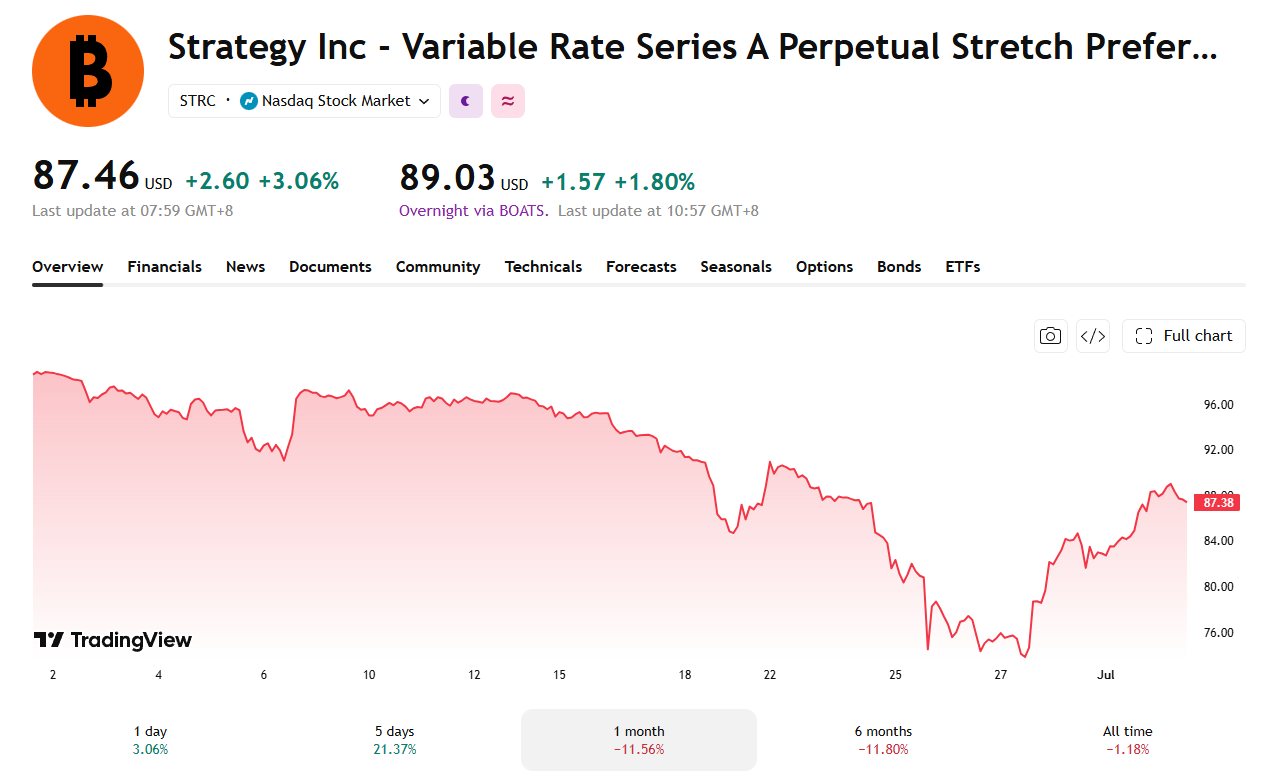
Michael Saylor reiterated on X that Strategy’s corporate objective remains for STRC to trade between $99 and $100, as the preferred stock attempts to climb back from its all-time low set on June 26.
The comment came as STRC rebounded from that record low of $71.25 to around $87.46 off the back of a new capital framework announcement. Even so, the gap to par remains wide with Bitcoin’s price also languishing.
STRC Still Trades Below Saylor’s Target
STRC, Strategy’s Variable Rate Series A Perpetual Stretch Preferred Stock, is not common stock. It is a preferred security designed to trade near a $100 face value. Strategy adjusts its dividend rate monthly to keep the price anchored, unlike common shares.
Bitcoin (BTC) had dropped below $60,000 in the same week STRC recorded its low, deepening a preferred stock crash that had already alarmed investors. STRC has since recovered but the stock is still about $13 short of the par value Saylor says remains the company’s goal.

On Monday, June 29, Strategy raised STRC’s dividend rate by 50 basis points to 12%. The increase takes effect for July record dates and is part of the capital management overhaul Strategy announced the same day.
Strategy reviews the rate using STRC’s trading level, Bitcoin’s price and volatility, and its own cash reserves. It will not raise the rate automatically just because the stock trades below par.
“As Strategy disclosed Monday: our corporate objective is for $STRC to trade over time at $99–$100.”
The tweet repeats language from Monday’s press release without adding new detail. Its timing during STRC’s rebound suggests Strategy wants the market to read the recovery as validation of its plan.
The reiteration follows weeks of criticism from Ripple (XRP) CEO Brad Garlinghouse. He called STRC’s slide a damning indictment of Strategy’s financing model. Rosen Law Firm has also opened a securities investigation into the company’s disclosures.
Whether STRC can climb back to par depends largely on Bitcoin’s trajectory. Bitcoin remains the primary driver of Strategy’s capital structure and dividend coverage.
The post Strategy’s Saylor Doubles Down on $100 STRC Target Despite Being $13 Off appeared first on BeInCrypto.

Tradeweb has carried out an onchain trade that pairs tokenized US Treasuries with tokenized cash, using Franklin Templeton as the seller of a tokenized Treasury security and Virtu Financial as the buyer. The execution reportedly took place over the Canton Network, with the companies saying settlement was completed in real time.
The deal is positioned as an industry milestone because it settles a tokenized Treasury against USDCx, a USDC-backed stablecoin issued on Canton. While the parties did not disclose the trade size, the firms framed the transaction as a practical step toward broader tokenized Treasury market infrastructure—particularly as major back-office plumbing, including DTCC’s planned tokenization services, moves closer to launch later this year.
Key takeaways
- Tradeweb executed a real-time onchain purchase-and-sale of a tokenized US Treasury settled against USDCx on the Canton Network.
- Franklin Templeton transferred the tokenized Treasury to Virtu Financial in exchange for tokenized cash, with Canton Network handling settlement synchronization.
- The trade is described as the first real-time purchase and sale of a tokenized US Treasury against USDCx, according to a Tradeweb spokesperson.
- The timing matters ahead of DTCC’s planned Tokenization Services rollout later this year.
- The transaction underscores how tokenized government bonds are moving from pilots toward production-style workflows.
A tokenized Treasury trade, settled in real time
According to the companies involved, Tradeweb served as the execution venue and source of price discovery for the transaction. Canton Network, meanwhile, coordinated settlement between the tokenized Treasury security and the tokenized cash leg of the trade.
Tradeweb and its counterparties said the trade settled in real time, though the exact notional amount was not released. Execution and settlement roles are often separated in traditional market structure; this type of workflow highlights how tokenization can compress those steps—at least within a controlled network environment—by linking asset and payment rails directly to the same settlement layer.
In a statement provided to Cointelegraph, a Tradeweb spokesperson said the transaction marked what they described as the industry’s first real-time purchase and sale of a tokenized US Treasury settled against USDCx, a USDC-backed stablecoin issued on Canton. Participants included Blockdaemon, Digital Asset, Societe Generale, Franklin Templeton, Tradeweb, and Virtu Financial.
Why the USDCx pairing is meaningful
The stablecoin used for settlement is not a minor detail. In tokenized Treasury markets, the “cash leg” is where many of the operational and compliance questions tend to concentrate: liquidity management, settlement finality, and how the payment instrument fits existing controls.
By explicitly citing settlement against USDCx on Canton, the firms are signaling that tokenized Treasuries can be paired with a stablecoin payment instrument on-chain—without requiring the buyer and seller to rely solely on separate off-chain cash processing. That matters for investors and trading desks because it can reduce settlement friction and shorten the path between trade execution and cash/asset finality, which are often decisive factors in institutional adoption.
At the same time, it remains important to watch how broadly these rails can scale beyond a limited set of participants. Real-time settlement claims are most meaningful when replicated across more counterparties, varied liquidity conditions, and larger volumes. The transaction size was not disclosed, leaving market participants to interpret the operational significance rather than the economic scale.
DTCC tokenization services as the next infrastructure milestone
The onchain trade also arrives ahead of a separate but related development: DTCC’s planned Tokenization Services later this year. DTCC has said the offering will enable participants to tokenize select stocks, exchange-traded funds (ETFs), and US Treasury securities while maintaining “the same investor protections and ownership rights as traditional assets,” according to DTCC’s published materials.
In practice, DTCC’s role is often associated with standardizing and simplifying settlement and custody workflows across the industry. If DTCC’s services deliver interoperable tokenization capabilities, they could help bridge the gap between isolated tokenization efforts and wider market participation. That makes Tradeweb and Canton’s transaction more than a standalone experiment—it can be read as preparation for a future where more participants can connect through shared tokenization infrastructure.
What remains uncertain is how DTCC’s approach will interact with existing tokenized Treasury ecosystems, including the specific stablecoin-based cash rails used for settlement. The Tradeweb/Canton transaction shows one functional pathway; the industry will likely be watching whether DTCC supports similar settlement models and whether cash and asset tokenization can be standardized across networks and venues.
Franklin Templeton’s wider tokenization push
This latest transaction fits into Franklin Templeton’s ongoing expansion of tokenized financial assets. Earlier this year, the asset manager partnered with Binance to let institutions use tokenized money market fund shares as trading collateral while keeping the underlying assets in regulated custody. Franklin Templeton has also partnered with Ondo Finance to bring tokenized ETFs onto blockchain networks, pointing to a broader strategy of onboarding institutional use cases through established market counterparties and custody frameworks.
The Treasury segment has been gaining attention alongside money markets and tokenized funds, in part because sovereign debt is often viewed as a foundational asset class for stable, yield-bearing tokenization strategies. While this does not automatically mean tokenized Treasuries will displace traditional Treasuries in size, each successful onchain settlement test reduces uncertainty about whether tokenized ownership can be operationally viable.
Governments and market data: tokenized sovereign debt keeps growing
Tokenized government bond efforts are not limited to the private sector. Several jurisdictions have launched blockchain-based initiatives to test issuance, settlement, and market infrastructure for sovereign debt.
Hong Kong was among the early movers, launching an inaugural digital green bond in 2023 and completing its third digital green bond issuance in November 2025, according to Hong Kong Monetary Authority announcements. Separately, the HKMA has said it will build a digital asset platform to support issuance and settlement of tokenized bonds, with plans to expand the infrastructure to other digital assets and connect with tokenization platforms across the region.
In the UK, the government appointed HSBC Orion to support its Digital Gilt Instrument pilot, designed to test blockchain-based issuance, settlement, and secondary trading of government bonds.
Meanwhile, on-chain Treasuries have reached significant scale in tokenized form. Data from RWA.xyz cited in the announcement places the tokenized US Treasury market at $14.6 billion, spanning 84 on-chain products and representing the largest segment within the tokenized real-world assets market.
Taken together, the picture that emerges is one of gradual maturation: policy pilots are exploring the mechanics of tokenized sovereign debt, while institutional market players are running increasingly production-like trades that validate execution and settlement workflows. The Tradeweb–Franklin Templeton–Virtu Financial transaction adds a concrete “cash + asset” settlement example—one that is particularly relevant for traders and custodians who need clarity on how stablecoin-based settlement can function alongside tokenized Treasuries.
Next, investors and market participants should watch for how DTCC’s forthcoming Tokenization Services change the connectivity and standardization of tokenized Treasuries settlement, and whether real-time USDCx-based settlement models prove replicable across more counterparties and larger volumes.

Zcash price has remained pinned below the $400 level after last month’s Orchard security scare, persistent overhead supply, and cautious derivatives positioning offset signs of improving buying pressure.
Summary
- Zcash price remains below $400 as sellers continue defending key resistance after June’s security-driven selloff.
- Technical charts show $410 as the breakout level, with $440 and $490 emerging as the next upside targets.
- Liquidation data and macro uncertainty keep downside risks alive unless buyers reclaim the descending trendline.
According to data from crypto.news, Zcash (ZEC) traded around $396 at the time of writing, little changed over the past week despite a relief bounce across several large-cap altcoins.
The privacy coin continues to recover from its violent early June collapse, when a critical flaw in the Orchard zero-knowledge proof circuit briefly raised double-spending concerns before developers deployed an emergency network upgrade. Although no funds were stolen, the event triggered a wave of liquidation and institutional selling that continues to weigh on price.
The fallout extended beyond the technical fix. Arthur Hayes exited his ZEC position during the panic, while the earlier 50% crash from roughly $624 to $309 left a large concentration of trapped holders at higher prices. That supply continues to emerge whenever ZEC approaches the $400-$420 region, limiting follow-through buying despite the stabilization seen during the past several sessions.
Descending trendline keeps Zcash trapped below key Fibonacci resistance
The daily chart shows ZEC trading just beneath the 61.8% Fibonacci retracement level near $419, a zone that rejected multiple recovery attempts following the June breakdown. Price also remains below a descending trendline that has defined the lower-high structure since the post-crash rebound peaked near $530 in mid-June.
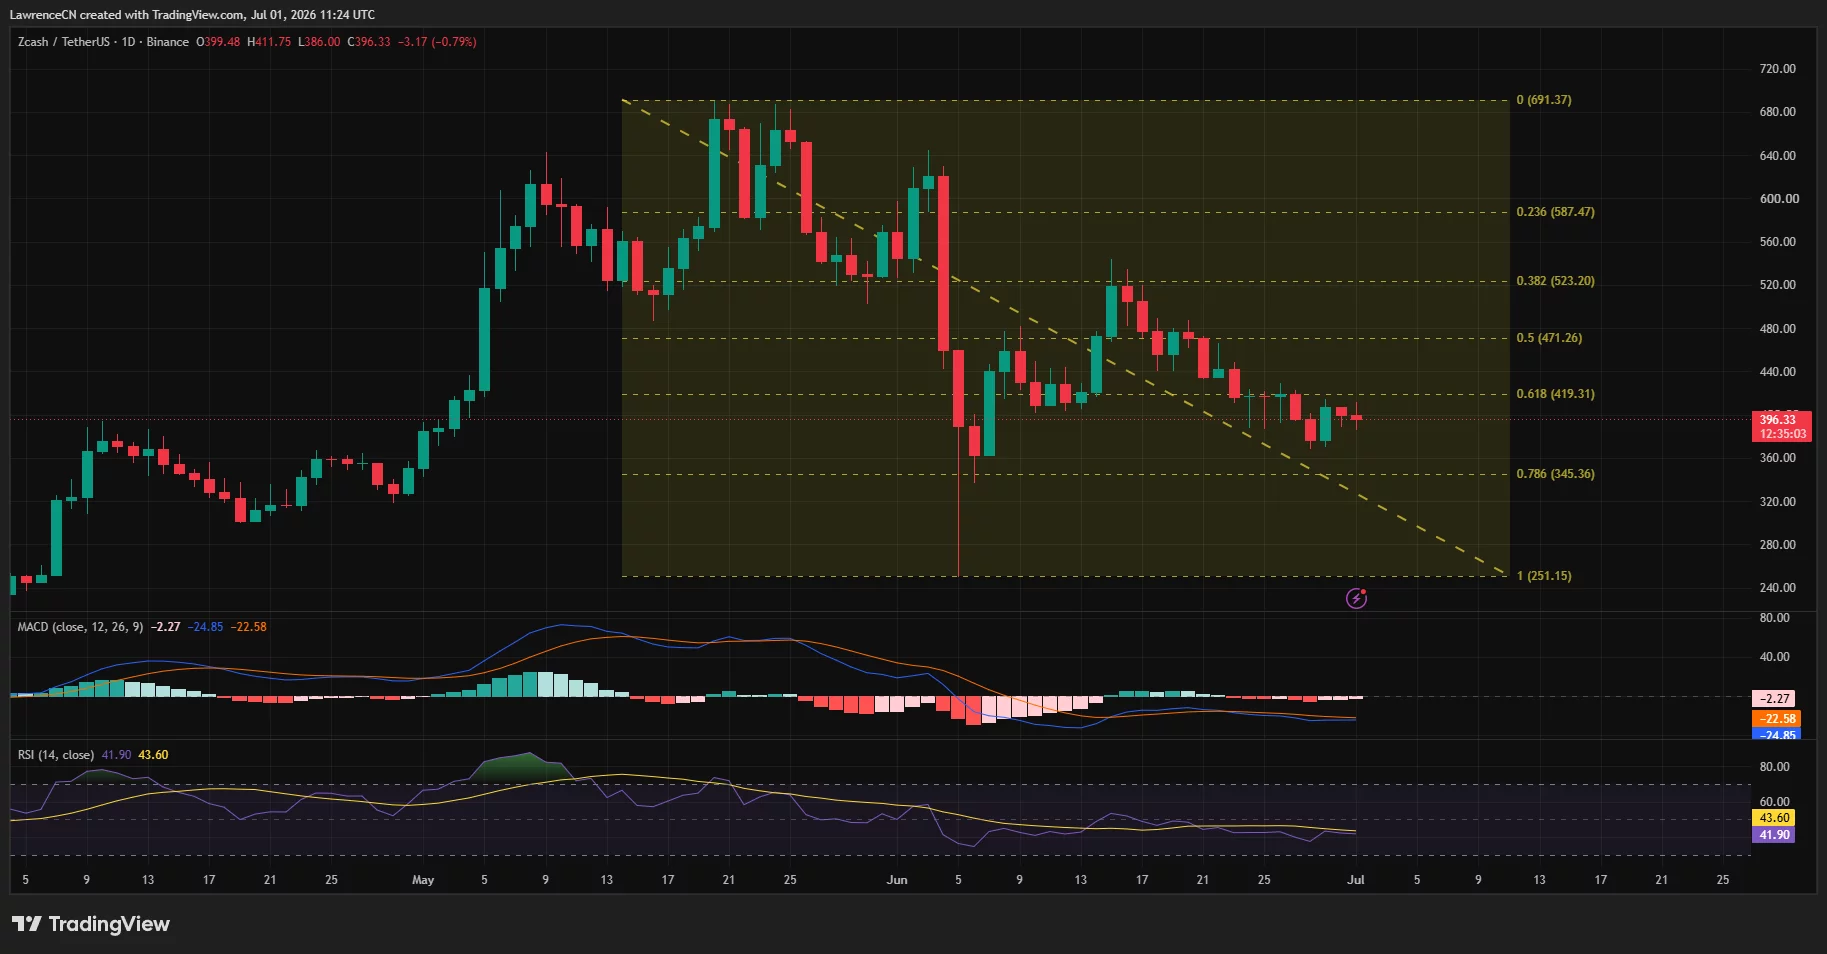
Momentum indicators remain mixed. The daily RSI sits near 41, leaving room for another recovery attempt without entering overbought territory, while the MACD remains below its signal line despite the bearish histogram steadily shrinking. Together, the indicators suggest selling pressure has eased but buyers have yet to regain control of the longer-term trend.
The 4-hour chart presents a slightly more constructive picture. ZEC has begun testing the descending resistance line that has capped every rally over the past two weeks, while the Chaikin Money Flow has climbed back above zero, suggesting fresh capital has started entering the market. Even so, the Aroon indicator continues to favor the prevailing downtrend, showing that bullish momentum has not yet replaced the existing market structure.
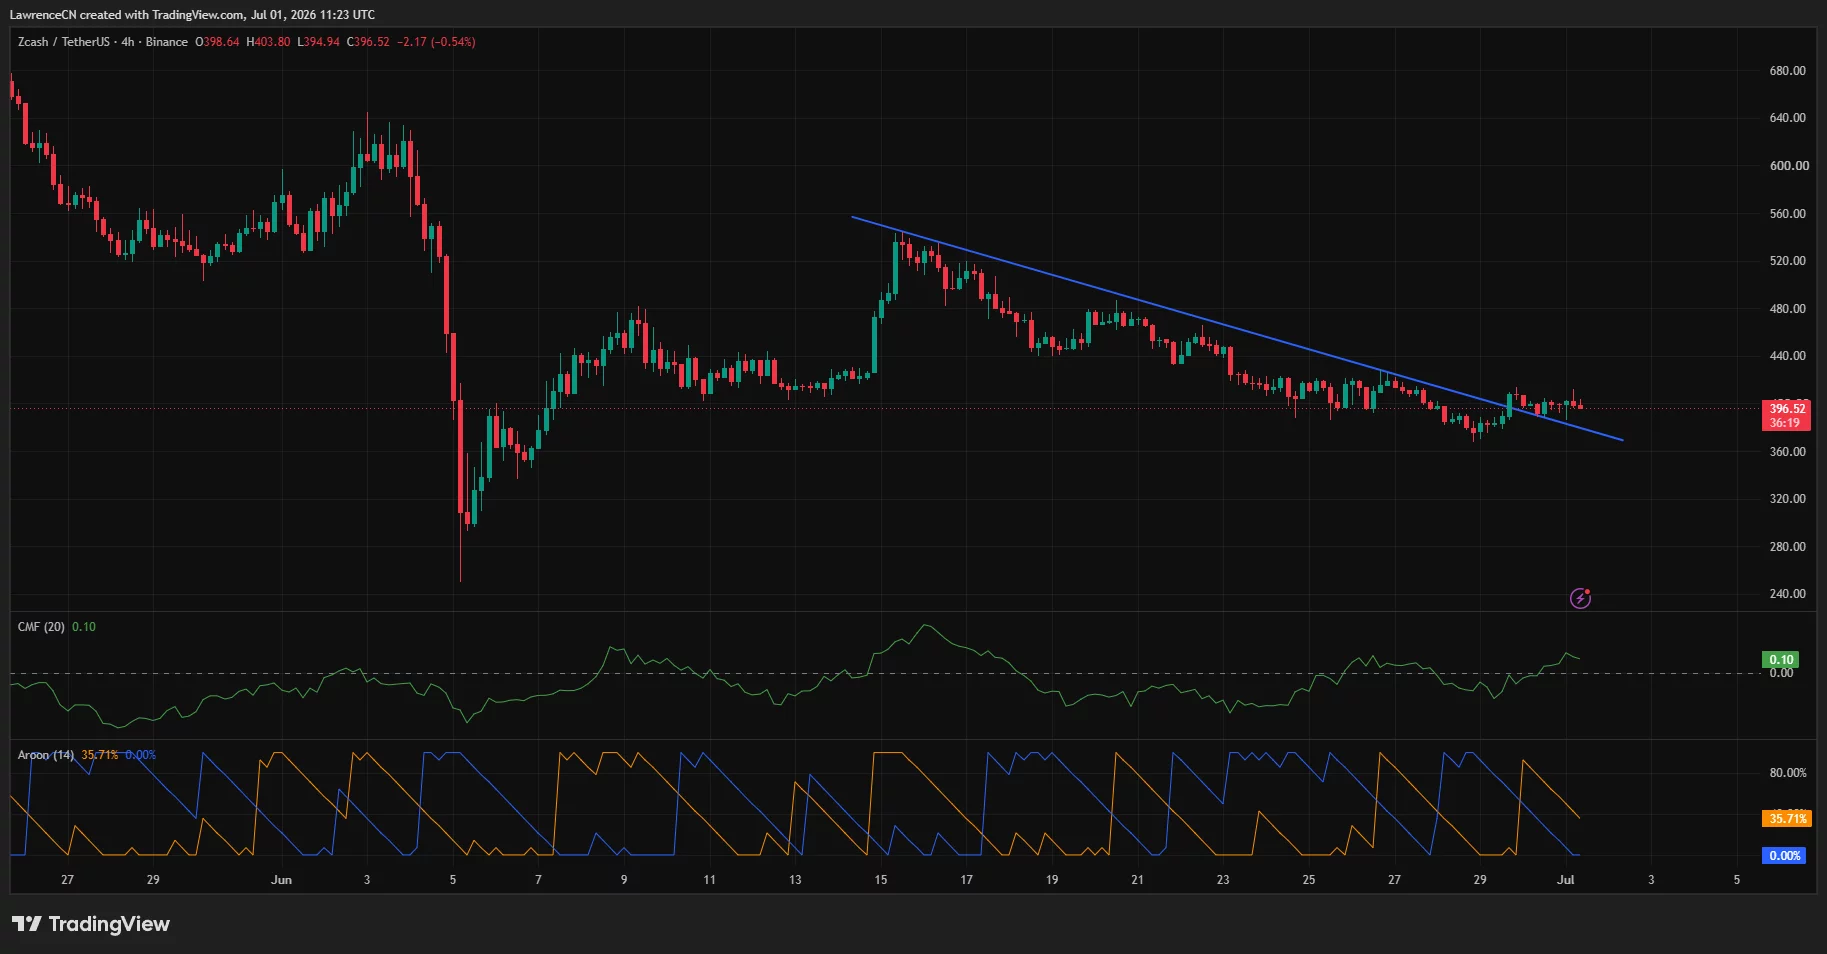
According to analyst Team LAMBO, a decisive move through the immediate ceiling could change the short-term outlook. “ZEC can breakout above 410 to target 440 and 490 again,” the analyst wrote in a recent market update, identifying $410 as the trigger level that could expose the next resistance areas near $440 and $490.
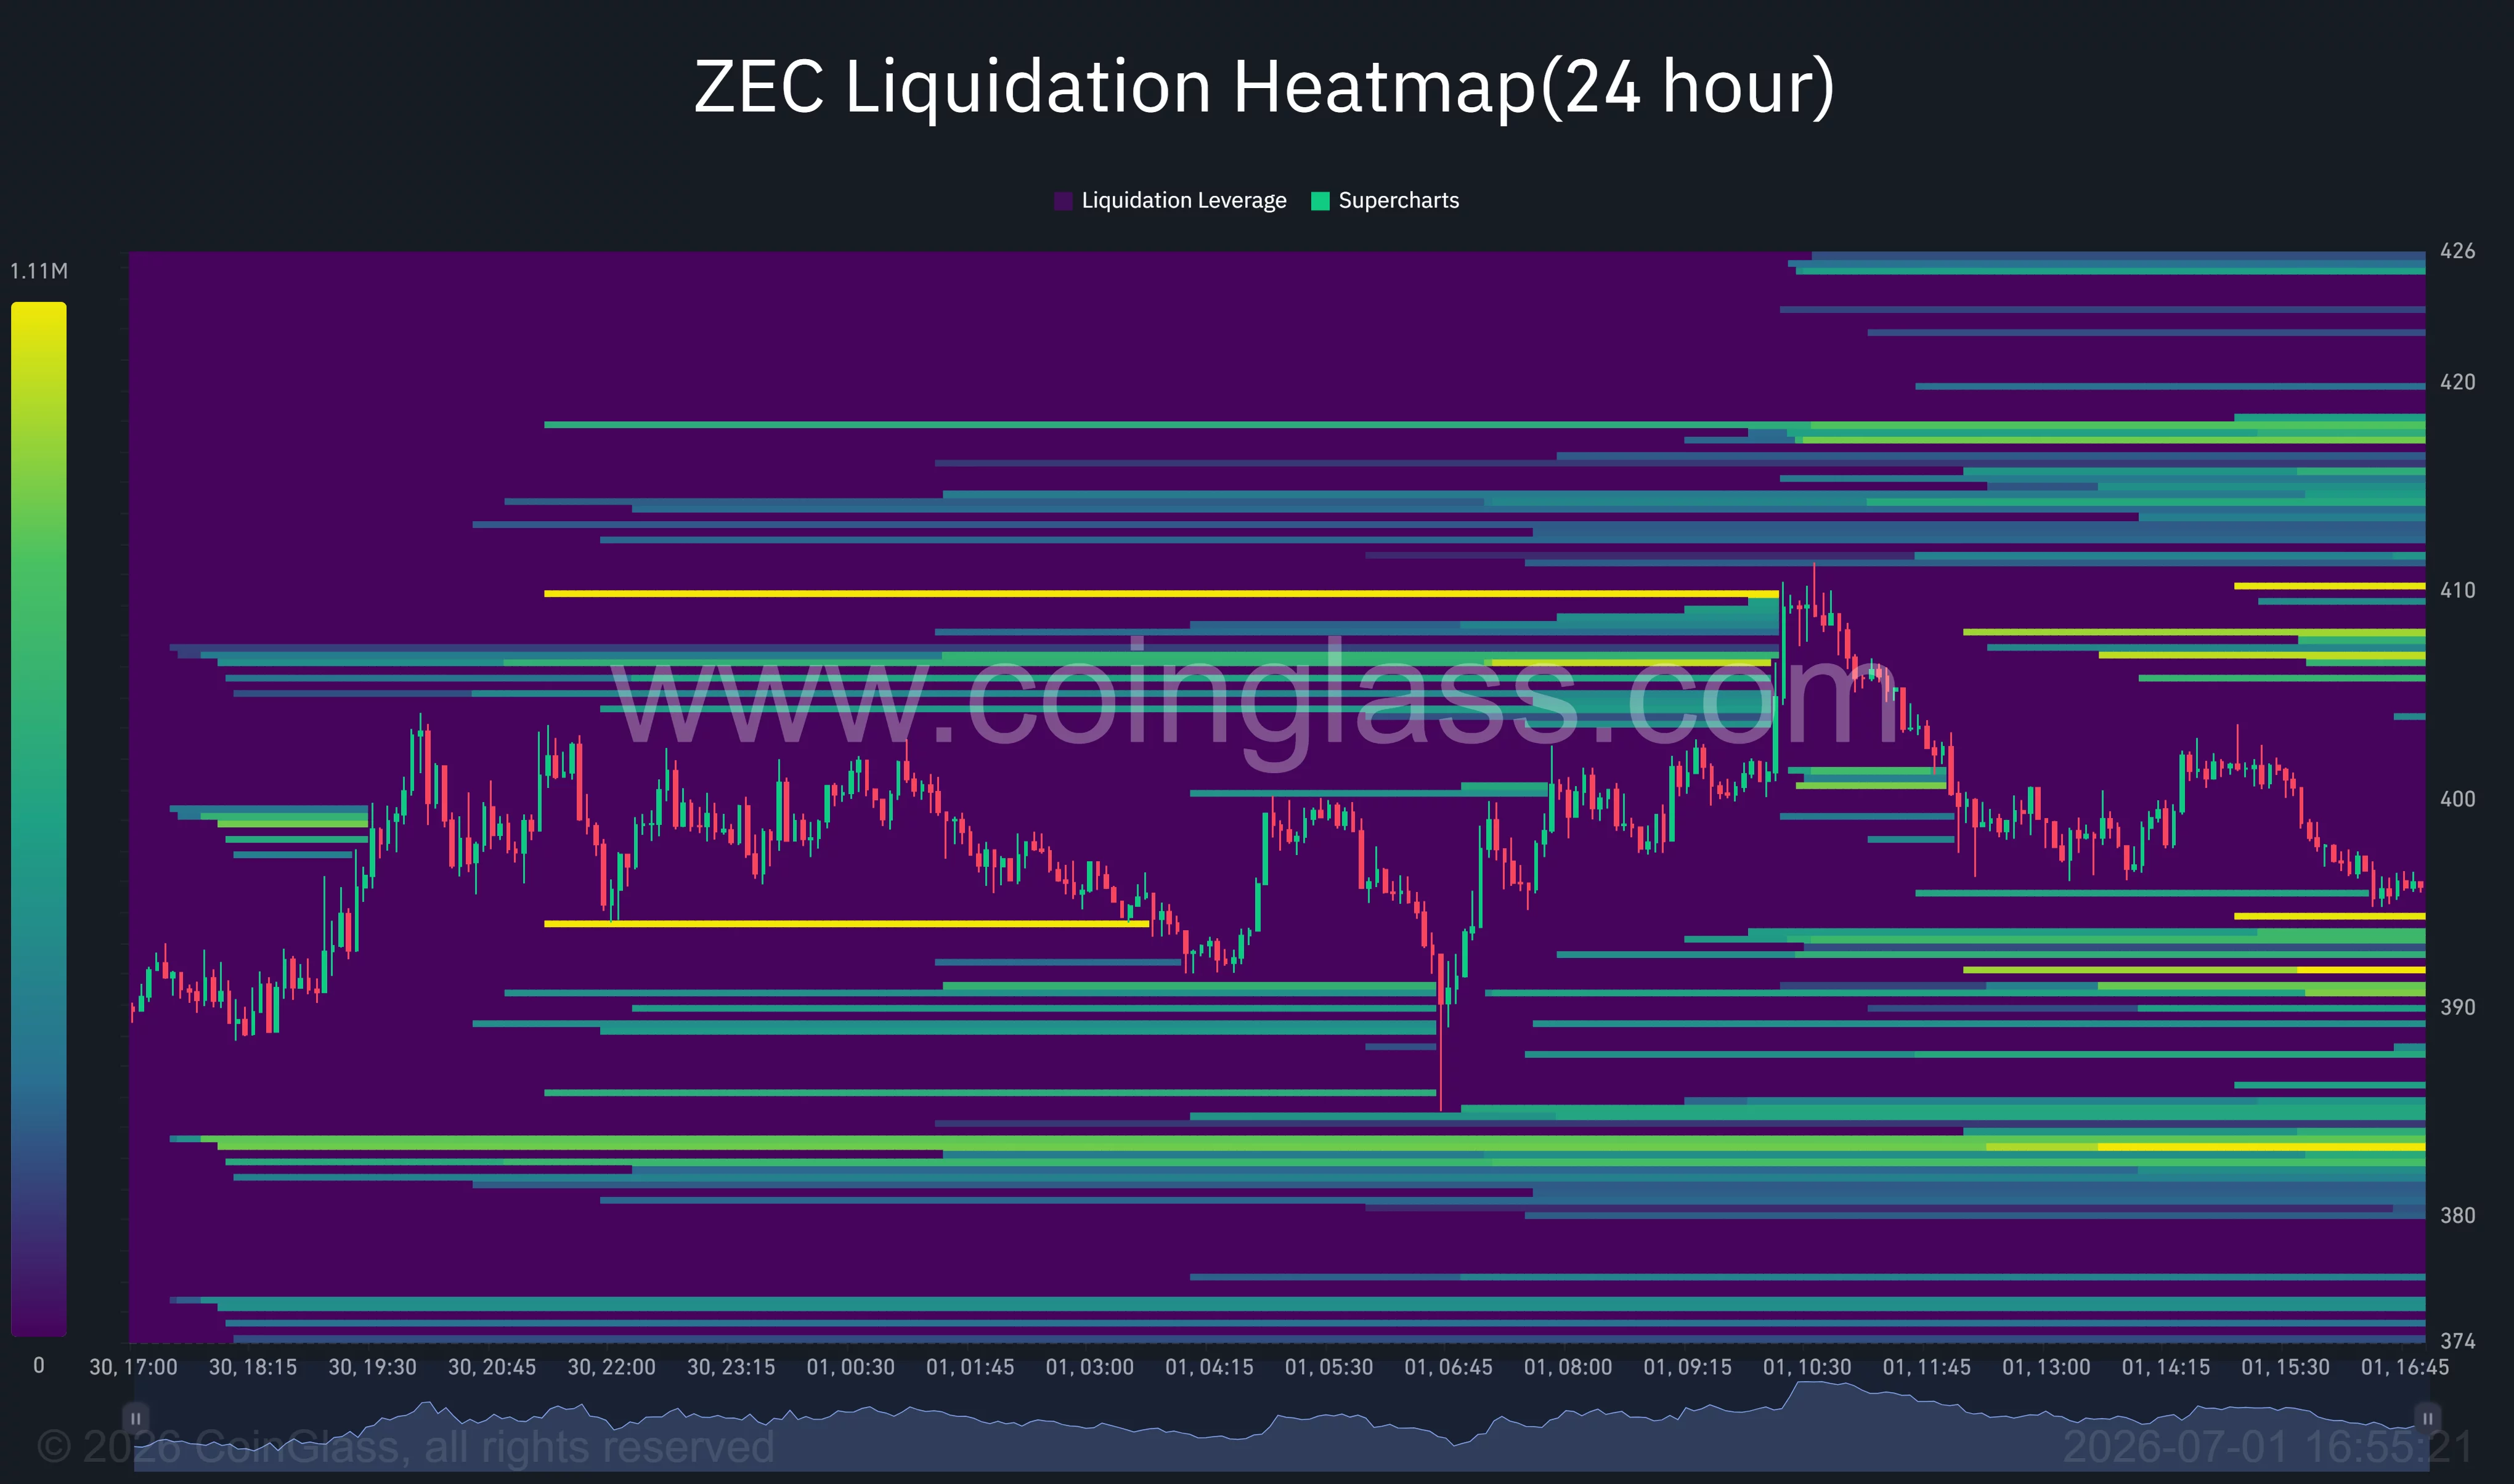
Derivatives positioning also shows why the current range remains difficult to escape. CoinGlass liquidation heatmaps reveal dense clusters of leveraged short positions concentrated around $405-$410 and again near $418-$420. A sustained break through those zones could force short liquidations and accelerate upside momentum. On the downside, another significant concentration of long liquidations sits between roughly $392 and $385, creating an area where volatility could increase if sellers regain control.
Macro risks continue to challenge the recovery thesis
Several external risks continue to limit appetite for privacy-focused cryptocurrencies despite improving technical conditions. Crypto market sentiment remains fragile after weeks of elevated volatility, while investors continue to monitor U.S. inflation data, interest-rate expectations, and geopolitical tensions that have reduced demand for higher-risk digital assets.
Regulatory uncertainty also remains a headwind unique to the privacy coin sector. European compliance initiatives and tighter scrutiny of anonymous digital assets continue to discourage institutional participation, reducing the amount of fresh capital available to absorb the overhead supply left behind by June’s selloff.
The bullish setup would weaken if ZEC fails to hold support around $390, with a break below that level exposing the stronger demand zone near $380 and potentially the 78.6% Fibonacci retracement around $345.
A confirmed close above $410, however, would invalidate the current lower-high sequence and increase the probability of a move toward the $440 resistance area, with $490 becoming the next upside objective if buying momentum accelerates.
Disclosure: This article does not represent investment advice. The content and materials featured on this page are for educational purposes only.


Solana perpetuals exchange Drift Protocol has rebranded to Velocity DEX, the protocol's official X account announced on Wednesday. Solana's own account confirmed the switch shortly after, posting "FYI: @driftprotocol is now @VelocityDEX." Velocity DEX said the new name reflects "a cleaner… Read the full story at The Defiant
Jupiter has surged more than 15% after a sharp rebound in June protocol revenue revived bullish sentiment despite persistent risk-off conditions across the crypto market.
Summary
- Jupiter jumped more than 15% after June protocol revenue climbed to a three-month high.
- Technical indicators show JUP has reclaimed its 200-day EMA as open interest and funding rates strengthened.
- Bulls now target the $0.24-$0.26 range, while losing $0.218 support could revive selling pressure.
According to data from crypto.news, Jupiter (JUP) traded around $0.233 at the time of writing after briefly touching an intraday high near $0.238, extending its weekly gain to almost 30%.
The token’s rally followed a sharp improvement in protocol activity during June. Data from DeFiLlama showed Jupiter generated 261,909 SOL in user fees and 76,257 SOL in protocol revenue during the month, reversing three consecutive months of weakening network activity.
Because a portion of protocol revenue feeds Jupiter’s staking and governance model, the jump in cash flow quickly translated into renewed demand for the token.
The move also arrived while risk appetite across digital assets remained subdued. The Crypto Fear & Greed Index has continued to hover in Extreme Fear territory near 11 as macro uncertainty and tighter liquidity conditions keep investors selective toward altcoins. Jupiter nevertheless outperformed most large-cap tokens, suggesting traders have prioritized protocol-specific fundamentals over macro headwinds.
Derivatives traders joined the advance rather than fading it. Open interest climbed roughly 11% to $58.7 million, while funding rates stayed positive near 0.0021%, showing leveraged traders have continued paying a premium to maintain long exposure instead of aggressively hedging the rally. That combination generally supports sustained momentum as long as fresh buying continues to absorb profit-taking.
Bulls have reclaimed the long-term trend while momentum targets higher resistance
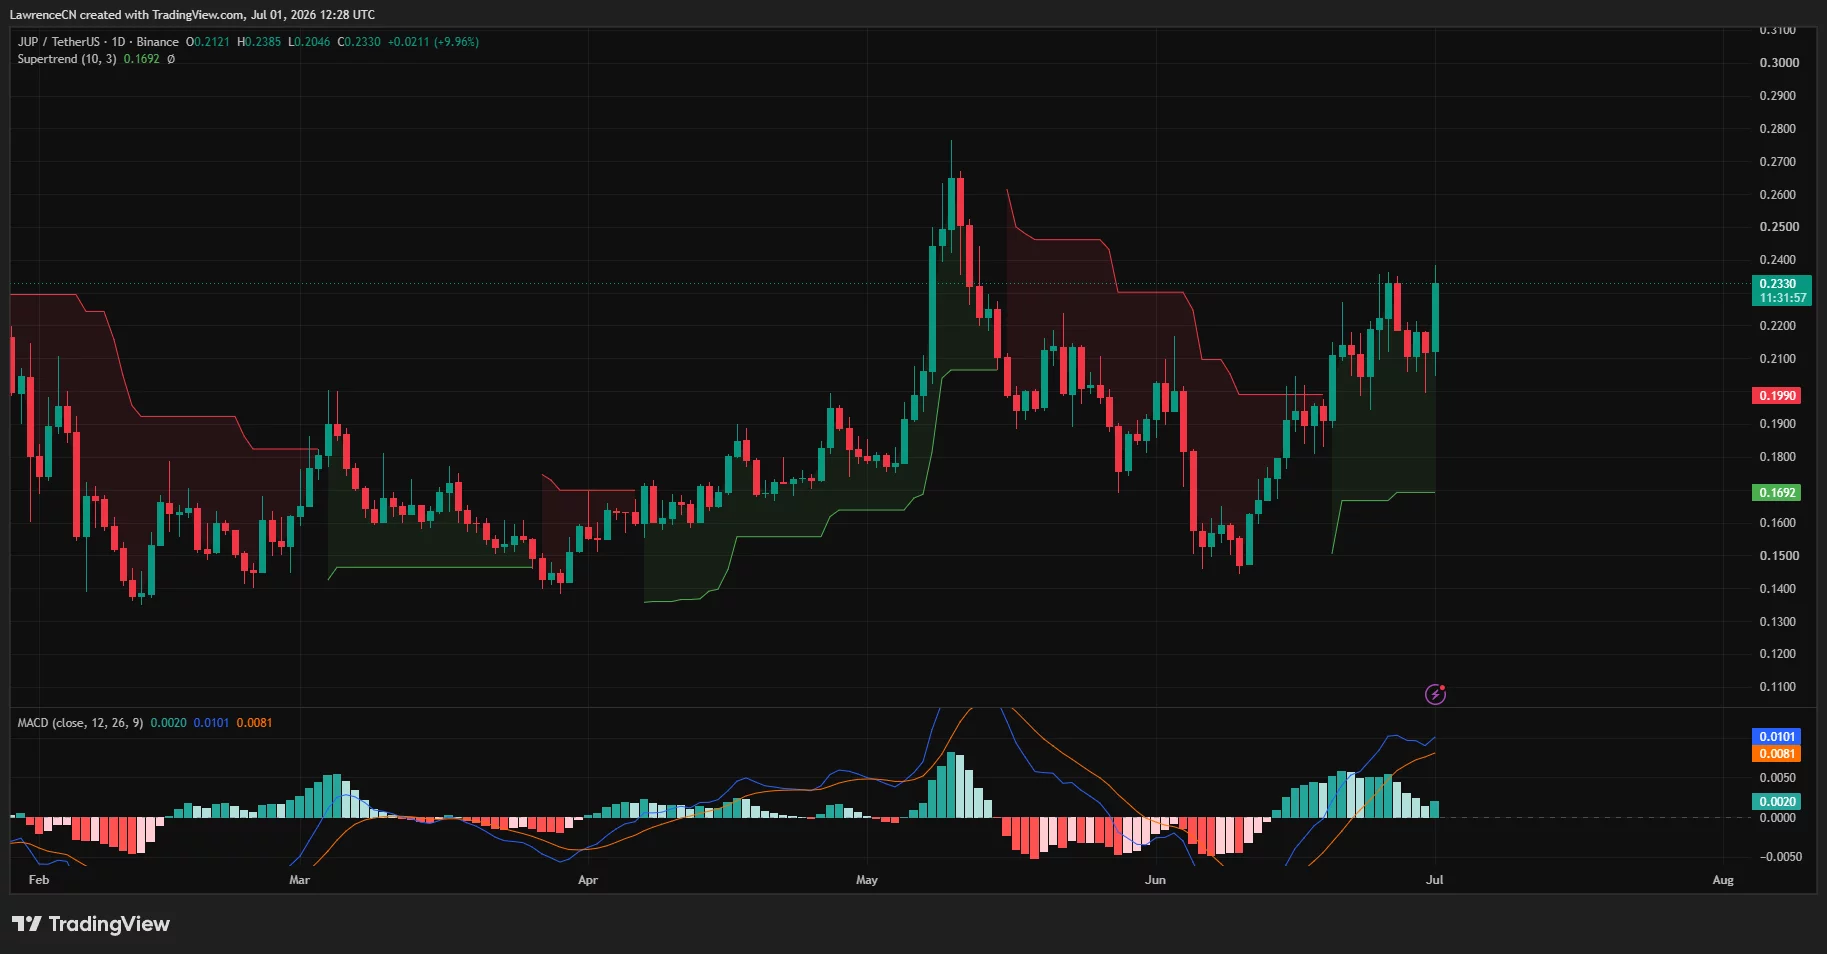
The daily chart shows JUP has reclaimed its 200-day exponential moving average around $0.219, a level that repeatedly rejected advances during the previous decline. Price has also remained comfortably above the daily Supertrend indicator near $0.169, preserving the bullish structure established after June’s recovery.

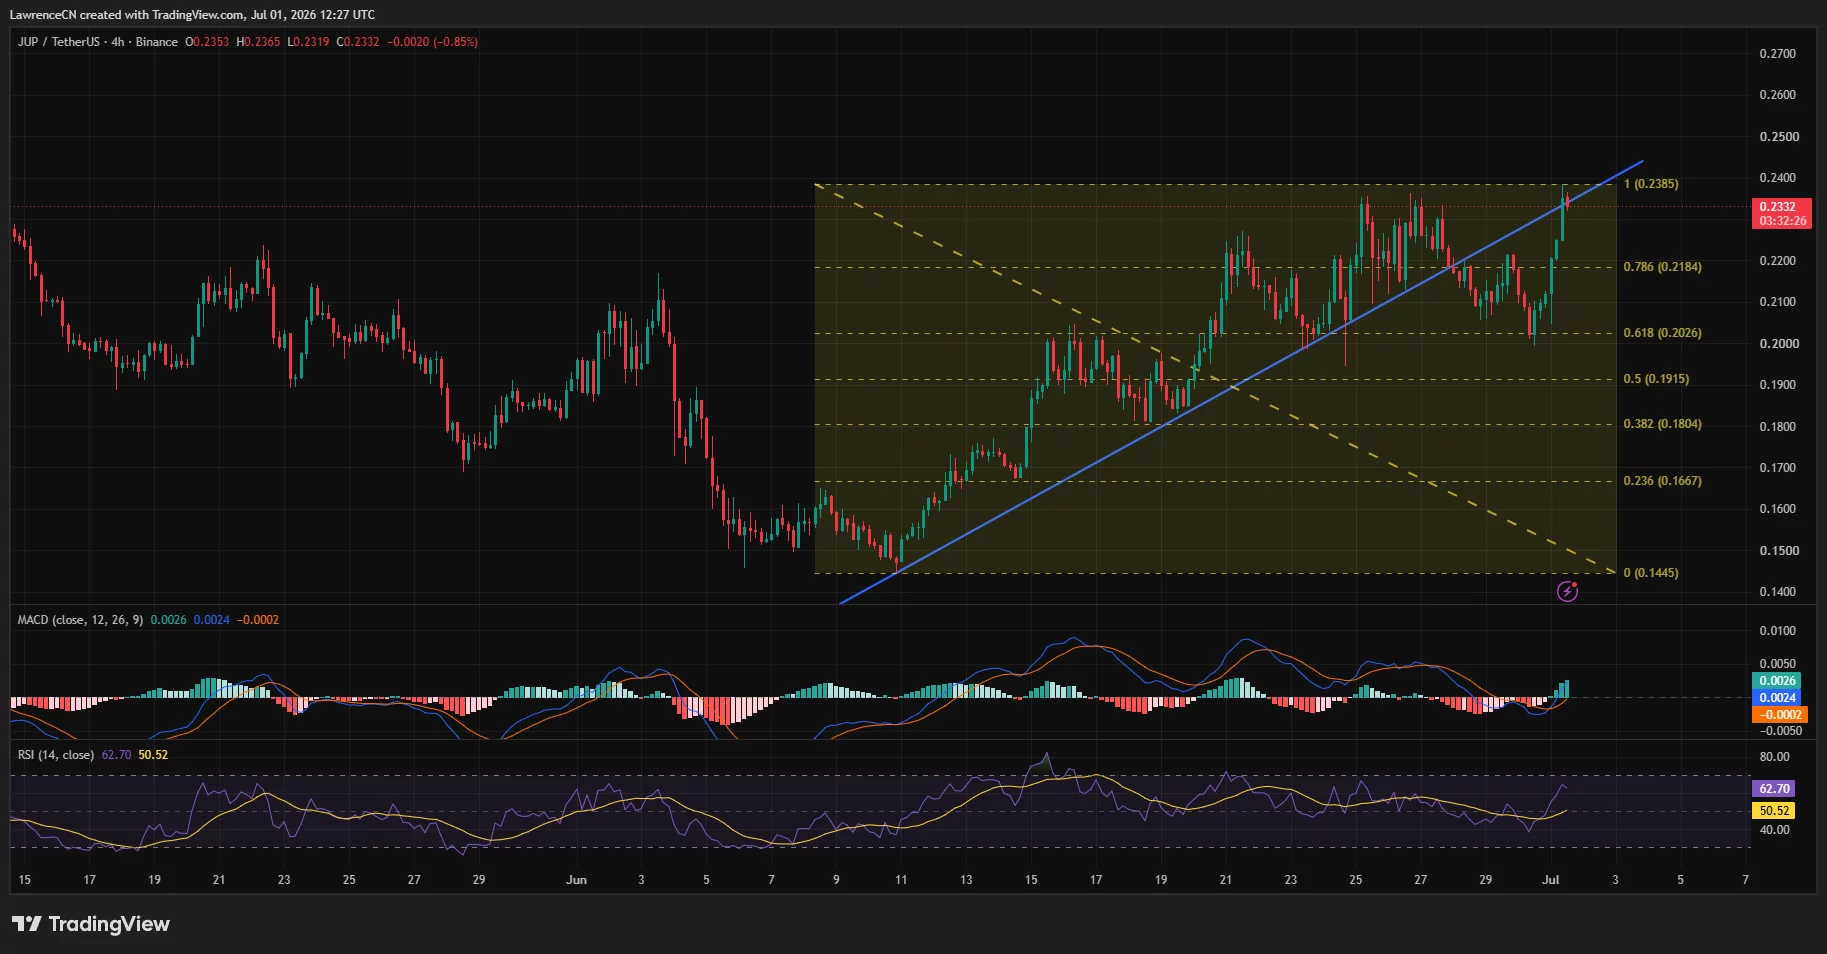
Momentum indicators continue to favor buyers. The daily MACD remains above its signal line despite a modest slowdown in histogram expansion, suggesting upside momentum has eased but has not reversed. On the four-hour chart, RSI has climbed to about 63 without entering overbought territory, while the MACD has completed another bullish crossover as price pushes back toward the recent swing high.
The 4-hour structure also shows JUP trading above an ascending trendline that has supported higher lows since early June. Fibonacci retracement levels place immediate resistance near $0.238, followed by the psychological $0.24 region. A decisive close above that zone could expose the May peak around $0.26, while the 0.786 Fibonacci level near $0.218 now serves as the first important support during any pullback.
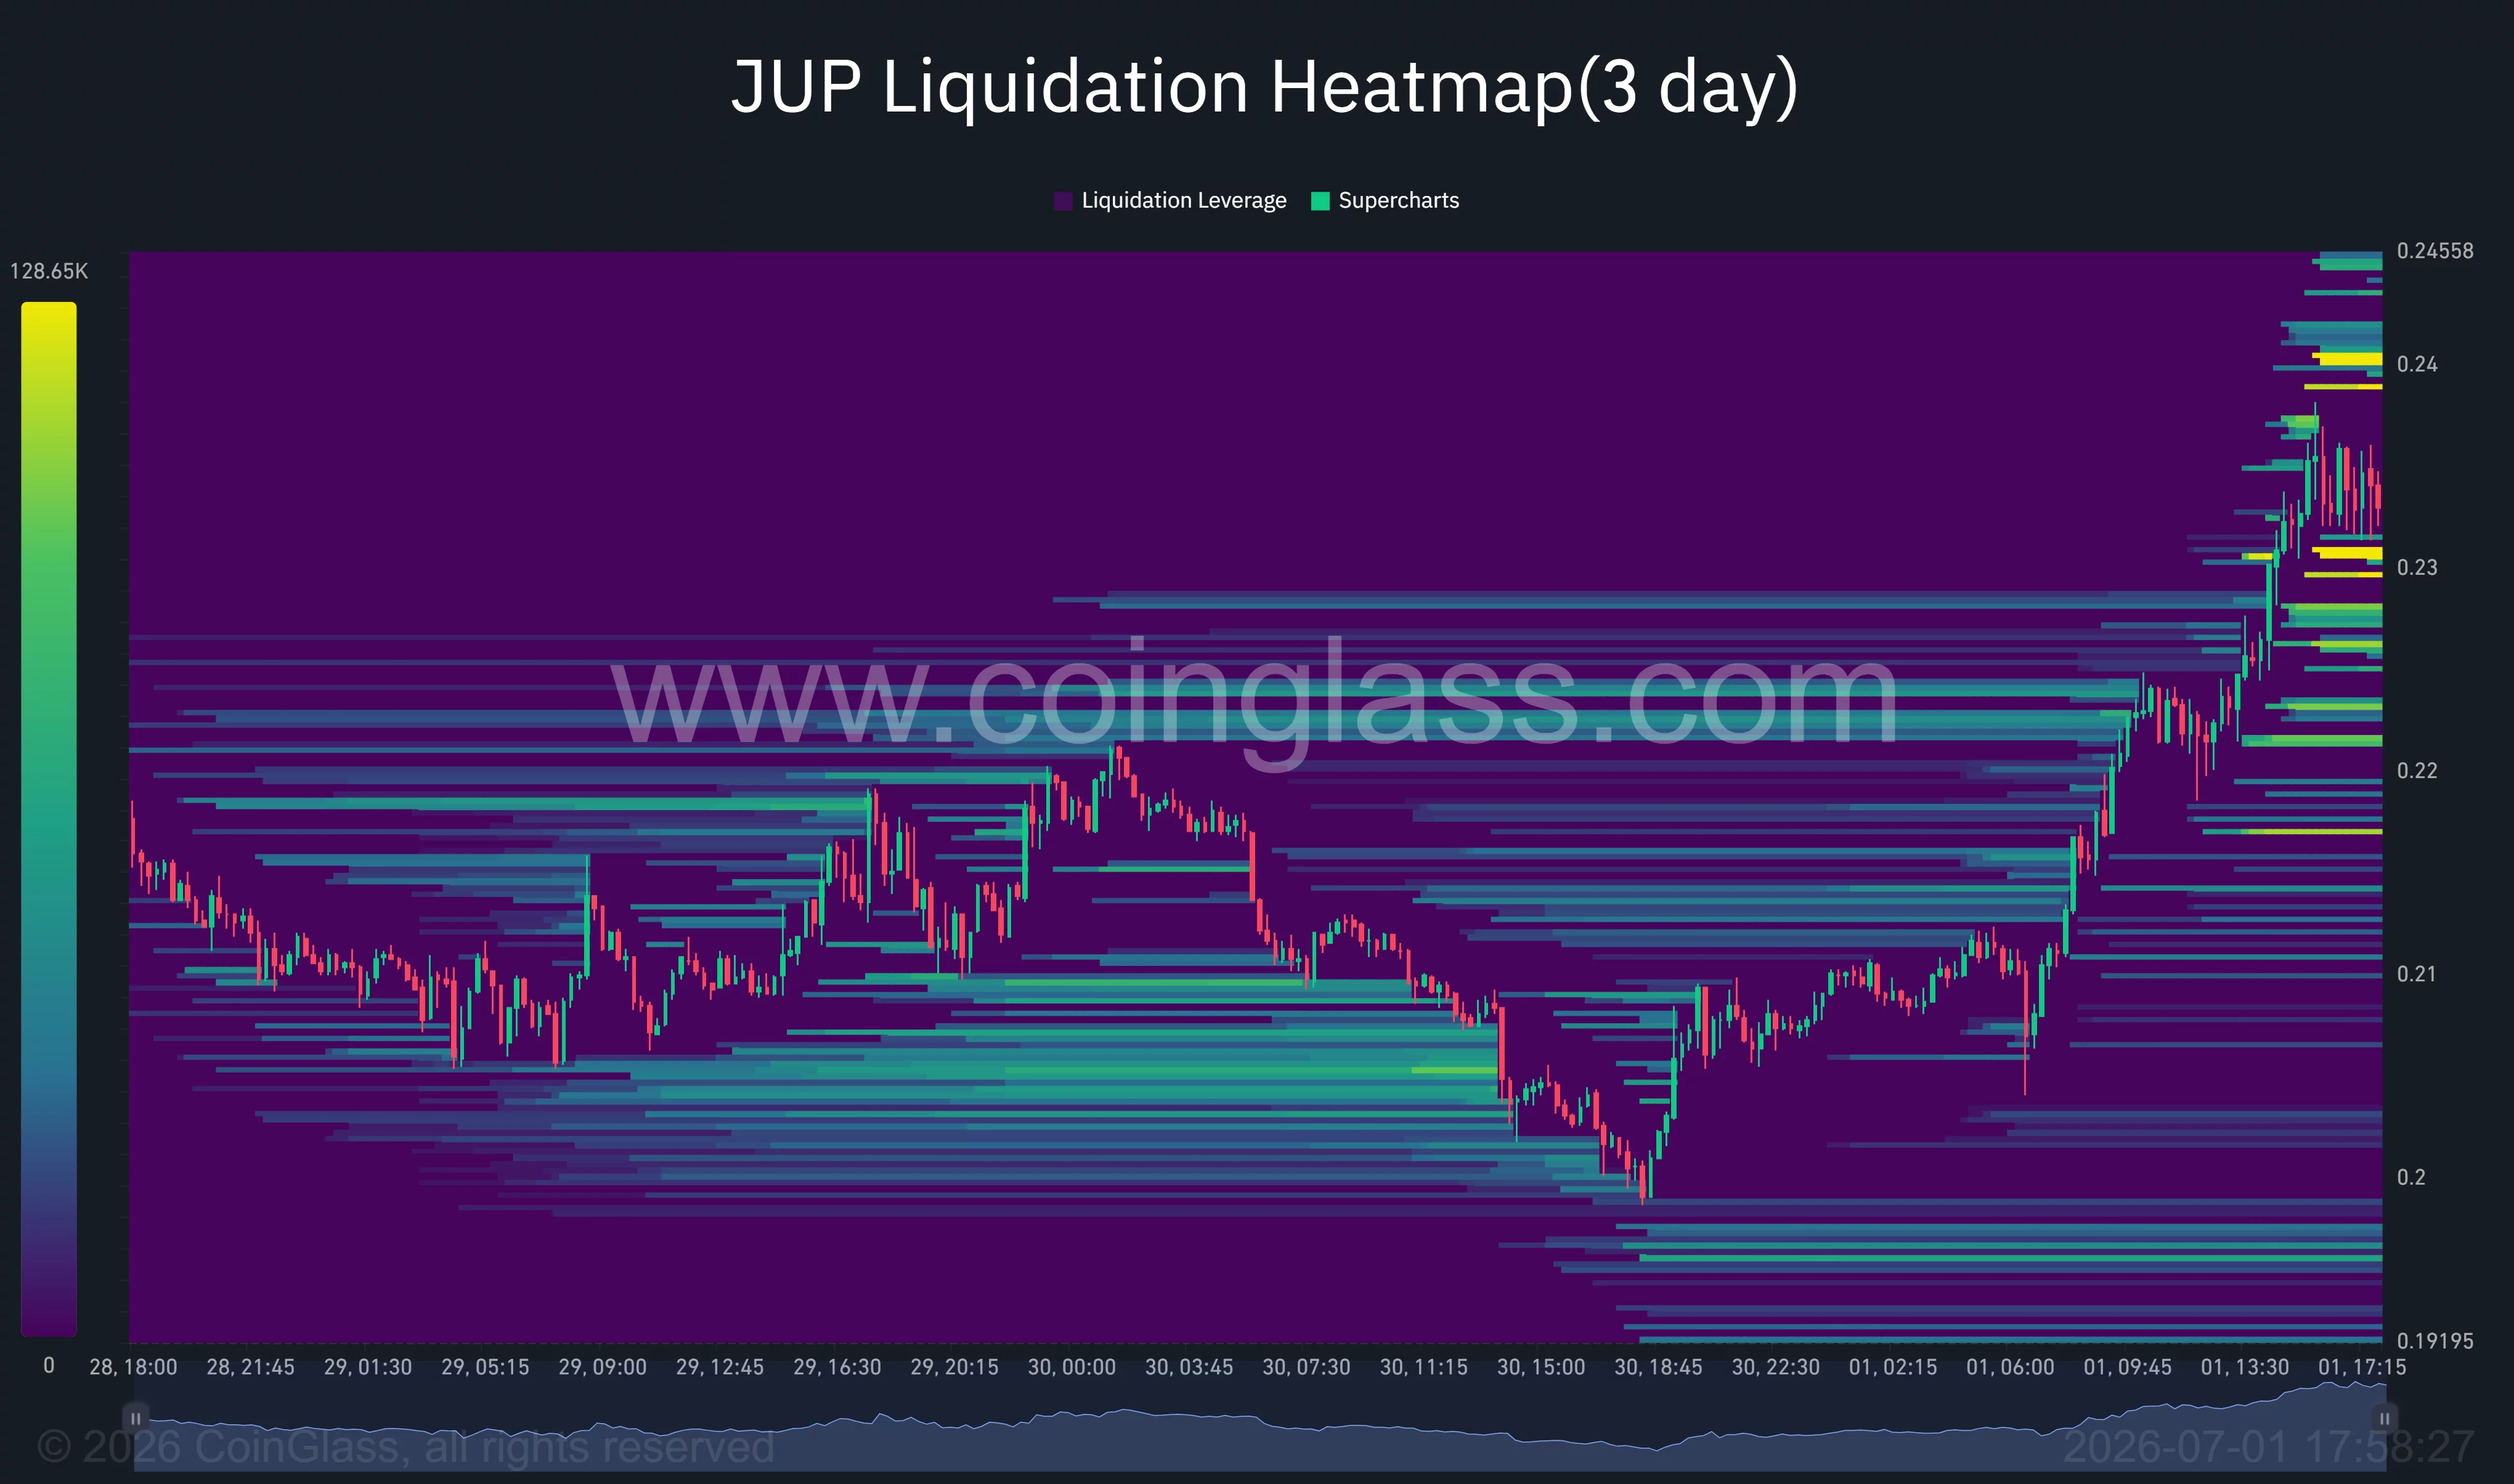
CoinGlass liquidation data reinforces those technical levels. The largest concentration of short liquidations sits between roughly $0.238 and $0.245, creating a potential liquidity pocket if buyers force another breakout. Below the market, notable long liquidation clusters have formed around $0.22 and $0.21, areas that could attract buyers if price retraces before attempting another advance.
Failure to hold support could revive the previous bearish trend
The bullish outlook would weaken if JUP loses the ascending trendline and falls back below the former breakout zone around $0.218. Such a move would place the 200-day EMA under pressure again and increase the probability of a decline toward the $0.20-$0.19 region, where the 0.5 Fibonacci retracement aligns with previous consolidation.
Macro risks also remain in place despite Jupiter’s strong fundamentals. Persistent risk-off sentiment, reduced liquidity across crypto markets, or renewed weakness in Solana ecosystem tokens could limit follow-through buying. Without continued growth in protocol revenue and sustained derivatives participation, the latest breakout could lose momentum before challenging the next major resistance zone above $0.24.
Disclosure: This article does not represent investment advice. The content and materials featured on this page are for educational purposes only.
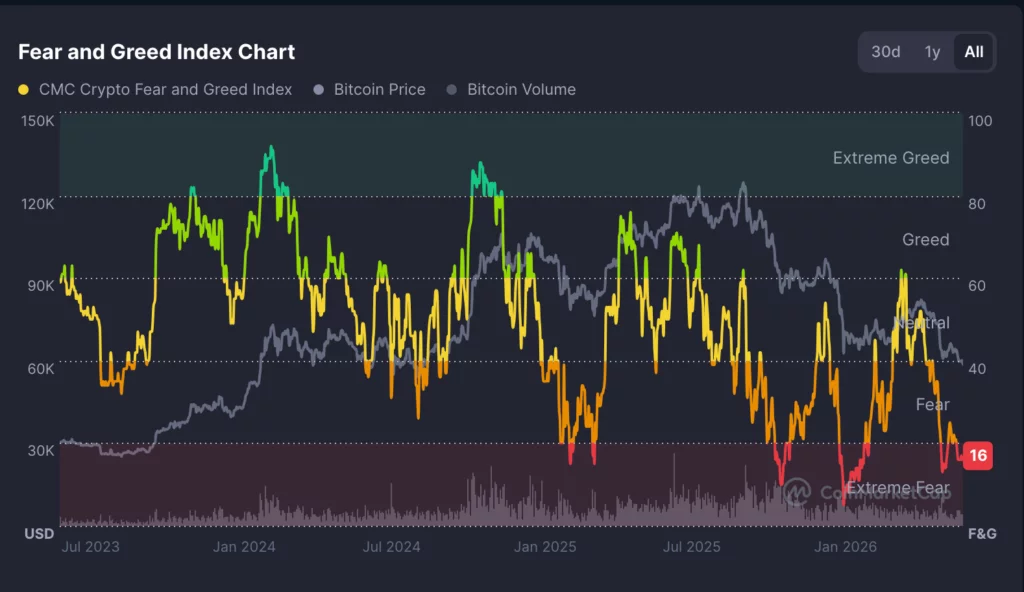
Bitcoin sits near $58,000 to $60,000 with the Fear and Greed Index buried in extreme fear. History says washed-out sentiment often precedes bottoms, but fear is a signal, not a floor. Here are the gauges traders are actually watching.
Summary
- Bitcoin trades near $58,000 to $60,000 as of July 1, 2026, down about 53% from its October 2025 record of $126,198, after back-to-back quarterly losses to open the year.
- The Fear and Greed Index sits around 12 to 16, deep in extreme fear, a zone that has historically appeared near local bottoms but is not a timing tool on its own.
- Bullish positioning signals are stacking up: open interest has collapsed from over $90 billion to about $44.5 billion, leverage is flushed, and coins are leaving exchanges in a pattern that suggests accumulation.
- The bearish counterweight is real: spot Bitcoin ETFs posted a record $4.5 billion of outflows in June, the Fed is hawkish with a likely December rate hike priced in, and one cycle model points to a bottom only around mid-October.
- The signals that would confirm a turn are concrete: reclaiming the 20-day and longer moving averages, a flip back to ETF inflows, open interest rebuilding alongside price, and the fear gauge lifting off its extremes.
Extreme fear is one of the most misread conditions in markets. When the Fear and Greed Index drops into the low teens, the crowd reads it as a reason to run, and the contrarian reads it as a reason to buy. Both are oversimplifying. Sentiment this low tells you that positioning is stretched and conviction is gone, which is often the raw material of a bottom, but “often” is not “now,” and fear can always get more extreme before it breaks.
The useful move is not to treat the fear gauge as a signal by itself, but to read it alongside the harder data on positioning, flows, and price. This piece walks through the signals traders are watching, lays out the bullish and bearish readings of each, and identifies what would actually confirm that the turn has arrived. The key point is simple: fear tells traders to pay attention, not to assume the bottom is already in.
What the Fear and Greed Index is saying
Start with the gauge everyone quotes. The Fear and Greed Index compresses several inputs, volatility, momentum, volume, and social signals, into a single 0 to 100 reading, and the latest chart still shows the market deep in extreme fear. Historically, readings this low have clustered near local bottoms, because they mark the point where sellers have largely exhausted themselves and the marginal holder is fearful rather than greedy. That is the contrarian appeal: when nobody wants the asset, much of the selling may already be done.

The caution is that the index is a description of the present, not a prediction of the future. Extreme fear can persist for weeks, and it can deepen. During genuine downtrends, the gauge has sat in fear for long stretches while price kept falling, so treating a low reading as an automatic buy signal has burned plenty of traders. The right way to use it is as context: it tells you the emotional backdrop is washed out, which raises the odds that other bottoming signals are meaningful, without confirming anything on its own.
That is why how the index works matters before using it as a trading signal. The number is useful because it summarizes the market mood, but it is not a floor under price. For confirmation, traders still need price levels, ETF flows, leverage data, and macro conditions to line up.
Signal one: positioning has reset
The most constructive signal under the surface is what happened to leverage. Open interest in Bitcoin derivatives has collapsed from above $90 billion to roughly $44.5 billion over recent weeks, less than half its peak. That drop reflects long liquidations, profit-taking, and traders reducing speculative exposure. In plain terms, the leverage that builds up in a rally and makes a market fragile has been flushed out.
Why this matters for a turn is mechanical. A market loaded with leveraged longs is vulnerable, because small drops trigger liquidations that cascade into larger drops. A market where that leverage has been cleared is sturdier, because the forced-selling fuel is gone. Resets like this often precede bottoms, since they remove the overhang that drags price lower and leave room for fresh positioning to push the other way.
The bearish reading is that falling open interest also signals fading demand and cautious participation, not just healthy deleveraging. Traders stepping back can mean they see no reason to buy, and a market with thin conviction can drift lower on light volume. The reset is a necessary condition for a durable bottom, but it is not sufficient by itself, because clean positioning can still sit under a price that keeps grinding down.
Signal two: exchange flows and accumulation
The second signal comes from where the coins are moving. Through the drawdown, Bitcoin has seen exchange outflows exceed inflows, meaning more coins are leaving exchanges than arriving. That pattern is typically read as accumulation: holders pulling coins into self-custody or long-term storage rather than keeping them on exchanges ready to sell. When supply leaves the venues where selling happens, it thins the pool of coins available to hit the market.
The bullish interpretation is that long-term holders are quietly buying weakness while short-term traders panic, a divergence that has marked accumulation phases before. Steady outflows during extreme fear suggest conviction underneath the fear, the kind of hands that absorb selling and set the base for a recovery. That is the constructive version of the on-chain story, and it fits with the broader idea that the market is moving from forced selling toward accumulation.
The counterpoint is that exchange flows are noisy and can reflect custody shifts, institutional plumbing, or one-off moves rather than genuine accumulation. Outflows are encouraging, but they are a soft signal, easily overstated. On their own they confirm that some holders are unbothered, not that the bottom is in. They matter most when they line up with stronger evidence from ETF flows and price.
Signal three: the ETF bid
The third signal is the one cutting against the bulls, and it is the most important on the bearish side. Spot Bitcoin ETFs recorded about $4.5 billion of net outflows in June 2026, their worst month since launching, removing the steady institutional bid that had cushioned earlier declines. The funds that were supposed to represent durable, price-insensitive demand instead became a source of selling, and their flows have tracked the drawdown closely.
This matters because the ETF bid was a structural change in how Bitcoin traded. When it was flowing in, it provided a floor of consistent demand. When it reverses, that floor becomes a headwind, and the market has to find other buyers to absorb the redemptions. For sentiment to turn convincingly, this is the signal that most needs to flip.
A return to sustained ETF inflows would tell the market that institutions are stepping back in, which would validate the bullish reading of the other signals. Continued outflows would keep the pressure on regardless of how washed out the fear gauge looks. That is why the ETF bid that reversed deserves more weight than a sentiment reading alone. In this cycle, flows are not a side detail; they are one of the main channels moving the market.
Signal four: oversold technicals
The fourth signal is on the chart. The relative strength index has dropped near 30, the oversold threshold, indicating that momentum has fallen far and fast and that the move may be stretched to the downside. Price sits near support in the $58,000 area, below the 20-day exponential moving average around $62,450, and well beneath the longer-term moving averages, the 200-day near $65,200 and the 50-month near $65,600, that mark the bull-bear boundaries.
The bullish read is that oversold conditions at support are where reversals begin, and a bounce off the high $50,000s that reclaims the moving averages would signal the downtrend is weakening. The bearish read is that oversold can stay oversold in a strong downtrend. Until price actually reclaims those moving averages, the path of least resistance points lower, with a break below support opening the door toward the mid-$50,000s. The technicals frame the levels, but they do not resolve the direction until price picks one.
That is why the level-based bottom question matters alongside sentiment. Bitcoin does not bottom because the index is low; it bottoms when buyers defend levels, reclaim resistance, and force trend-followers to change position. The fear gauge tells traders the market is stretched. The chart tells them whether the stretch is becoming a reversal.
The bull read: capitulation precedes bottoms
Put the constructive signals together and a coherent bottoming case emerges. Extreme fear, flushed leverage, steady accumulation, and oversold momentum are the classic ingredients of capitulation, the moment when the last weak hands sell and stronger hands absorb the supply. In prior cycles, this combination has marked the exhaustion of a downtrend, the point where selling pressure runs out because everyone inclined to sell already has. In this reading, the current setup looks less like the start of a new collapse and more like the late stage of a forced reset.
The bull case also treats the record ETF outflows as a lagging sign of the same capitulation instead of a fresh catastrophe. Institutions derisked into weakness, leverage was cleared, and sentiment collapsed into extreme fear. If that selling has already happened, the market may be closer to a base than the headline fear suggests. The reset positioning and the accumulation on-chain suggest a foundation is forming under the panic.
If that is right, the setup favors a recovery once a catalyst arrives to flip sentiment, and the extreme fear reading becomes, in hindsight, the marker of the low. This is the contrarian thesis, and the data gives it real support. The key caveat is timing: a market can be in a bottoming zone before the actual bottom is printed. Bulls still need confirmation before calling the turn.
The bear read: fear can deepen
The opposing case is equally grounded, and it starts with the fact that Bitcoin is down about 53% from its high with back-to-back quarterly losses, a genuine bear market instead of a shallow dip. Deep drawdowns can extend, and washed-out sentiment can get more washed out. The macro backdrop offers no relief: the Fed is hawkish under its current chair, markets are pricing a strong chance of a December rate hike as inflation drifts back toward 4%, and a key jobs report looms, all of which pressure risk assets like Bitcoin, which trades as high-beta risk far more than as a haven.
There is also a timing argument. One cycle model notes that bear-market corrections have averaged about 12 months, which, measured from the October 2025 record, points to a bottom only around mid-October 2026. By that reading, the current fear could be a stop along the way instead of the destination, with more downside and more time required before a durable low. The record ETF outflows, in this frame, are an active headwind, not a capitulation tail.
Fear is a signal, not a floor, and it can persist far longer than the impatient expect. The chart can stay oversold, ETF flows can stay negative, and macro can keep forcing risk assets lower. That does not invalidate the bottoming signals; it simply means they are conditions, not confirmations. The bear case is strongest as long as price remains below the key moving averages and the ETF bid stays absent.
What would confirm a turn
The way to cut through the debate is to watch for confirmation instead of guessing at the bottom. Four signals would mark a genuine turn. The first is price reclaiming the 20-day EMA near $62,450 and then the heavier resistance around $64,000, which would break the pattern of lower highs and put buyers back in control. The second is ETF flows flipping from outflows back to sustained inflows, the clearest sign the institutional bid has returned.
The third is open interest rebuilding alongside a rising price, which would show fresh capital coming in with conviction instead of a low-volume drift. The fourth is the Fear and Greed Index lifting off its extremes, confirming that the emotional backdrop is normalizing. Until several of those align, the constructive signals remain a setup instead of a trigger. Extreme fear, reset leverage, and accumulation describe a market that could turn, not one that has.
The discipline is to treat washed-out sentiment as a reason to watch closely, while waiting for price and flows to confirm before concluding the low is in. That is how experienced traders use a reading in extreme fear: not as a buy button, but as a cue to track the signals that actually mark the turn. The lower the fear gauge falls, the more important confirmation becomes, because the emotional temptation to act early grows stronger.
How this fear compares with past bottoms
Extreme fear is not new, and prior episodes offer a rough guide to how it tends to resolve, with a large caveat. In earlier cycles, the deepest fear readings have often clustered near major lows, appearing when a drawdown was closer to its end than its beginning, precisely because fear peaks when selling has run far. The pattern that has marked durable bottoms combines washed-out sentiment with flushed leverage and steady accumulation by long-term holders, the same three ingredients visible now. On that template, the current setup rhymes with past bottoming conditions.
The caveat is that the template has failed often enough to demand humility. Extreme fear has also appeared in the middle of downtrends, not just at their ends, and readers who bought every low reading in a bear market bought too early more than once. The difference between a fear reading that marks a bottom and one that marks a pause is usually not visible in the sentiment gauge itself. It shows up later, in whether price reclaims key levels and whether the institutional bid returns.
There is also a structural change that makes the comparison imperfect. The presence of spot ETFs has altered how Bitcoin trades, adding a large, flow-driven institutional participant that did not exist in earlier cycles. That means past bottoming patterns, built in a market without ETFs, may not map cleanly onto this one. The ETF flows can amplify moves in both directions, which is why the record June outflows matter so much and why this cycle’s bottom may look different from the ones the historical template describes.
The macro calendar that matters
Because Bitcoin is trading as a high-beta risk asset, the signals most likely to flip or deepen sentiment are macroeconomic, and the calendar is crowded. The nearest is the monthly jobs report, a read on labor-market strength that feeds directly into rate expectations: a hot number would reinforce the case for the Fed staying tight, pressuring risk assets, while a soft number could revive hopes for easier policy and lift them. Traders watching for a sentiment turn are watching that print closely. It is not a crypto-native signal, but it can decide whether crypto-native bottoming signals actually matter.
Further out sits the Fed itself. With markets pricing a meaningful chance of a December rate hike as inflation drifts back toward 4%, each inflation report and each Fed meeting becomes a potential catalyst. A hawkish surprise would deepen the risk-off mood that has weighed on Bitcoin, while any sign the tightening is ending could mark the macro turn that a sentiment-driven bottom needs. The path of rates, more than any crypto-native signal, is the backdrop against which the fear gauge will either normalize or sink further.
The practical point is that a durable turn in Bitcoin sentiment probably requires a shift in the macro wind, not just an oversold chart. The internal signals, reset leverage, accumulation, extreme fear, describe a market primed to respond, but the trigger is likely to come from outside crypto: a softer labor market, a friendlier inflation path, or a Fed that signals the end of tightening. Until the macro calendar delivers one of those, the constructive crypto signals remain a coiled setup waiting for a catalyst, which is why traders track the economic data as closely as the order book right now.
The one signal that matters most
With so many gauges flashing at once, it helps to rank them, and in this cycle one signal outranks the rest: the ETF bid. Before spot Bitcoin funds existed, a bottom was mostly a story about on-chain holders, leverage, and sentiment, the classic signals. Those still matter, but the arrival of ETFs added a large, flow-driven institutional participant whose buying and selling now sets much of the marginal price. When that participant is buying, it provides a steady floor. When it is selling, as it was through the record June outflows, it becomes a persistent drag that the other signals cannot easily overcome.
That is why the ETF flow number deserves more weight than the fear gauge or the RSI. Extreme fear can mark a bottom, reset leverage can prime one, and accumulation can build a base, but none of them forces the institutional bid to return. The flows do that directly. A market can sit at extreme fear with clean positioning and still grind lower if the funds keep redeeming, because the redemptions are real selling that has to be absorbed.
Conversely, a decisive flip back to sustained inflows would validate every other constructive signal at once, confirming that the capitulation the other gauges describe has actually ended. The practical takeaway is a hierarchy. Treat the ETF flows as the primary confirmation, the signal that most reliably separates a real turn from a false one. Treat reset leverage and on-chain accumulation as supporting evidence that the setup is favorable. Treat extreme fear and oversold technicals as context that raises the odds without confirming anything.
The macro calendar is the likely trigger that moves the flows one way or the other. Reading the signals in that order, flows first, positioning second, sentiment last, is how to avoid the classic trap of buying extreme fear too early. The gauge in extreme fear tells you the market is primed. The ETF flows will tell you when it has actually turned.
Frequently asked questions
What does a Fear and Greed reading near 16 mean?
It means the index sits deep in extreme fear, its lowest zone, reflecting washed-out sentiment across volatility, momentum, volume, and social signals. Historically, readings this low have appeared near local bottoms because much of the selling may be exhausted. But it is a description of the present, not a prediction, and extreme fear can persist or deepen during a real downtrend.
Is extreme fear a reliable buy signal?
Not on its own. Low readings raise the odds that a bottom is near, but sentiment can stay fearful for weeks while price keeps falling. It is best used as context alongside harder data on positioning, flows, and price, instead of as a standalone trigger. Treating a low reading as an automatic buy has repeatedly caught traders too early.
Why does falling open interest matter?
Open interest dropping from over $90 billion to about $44.5 billion means leverage has been flushed out through liquidations and derisking. That makes the market sturdier, because the forced-selling fuel that drives cascading drops is gone, which often precedes bottoms. The caveat is that falling open interest can also signal fading demand, so it is a necessary but not sufficient condition for a turn.
What are exchange outflows telling us?
More Bitcoin has been leaving exchanges than arriving, a pattern typically read as accumulation, with holders moving coins into storage instead of keeping them ready to sell. It suggests conviction underneath the fear. But exchange flows are noisy and can reflect custody or institutional shifts, so they are a soft signal that some holders are unbothered, not proof the bottom is in.
Why are the ETF outflows so important?
Spot Bitcoin ETFs posted a record $4.5 billion of outflows in June 2026, turning the steady institutional bid that once cushioned drops into a headwind. Because that bid was a structural support, its reversal is the signal that most needs to flip for a convincing turn. A return to sustained inflows would validate the bullish case, while continued outflows keep pressure on regardless of sentiment.
Where is Bitcoin’s key support and resistance?
Support sits near the $58,000 area, and reclaiming the 20-day EMA around $62,450 is the first upside test, followed by heavier resistance near $64,000 and the longer-term moving averages around $65,200 to $65,600. RSI near 30 shows oversold momentum. A break below support opens the door toward the mid-$50,000s, while reclaiming the moving averages would signal the downtrend is weakening.
Could Bitcoin fall further from here?
Yes. Bitcoin is down about 53% from its record with back-to-back quarterly losses, and deep drawdowns can extend. A hawkish Fed, a likely December rate hike, and looming jobs data pressure risk assets, and one cycle model points to a bottom only around mid-October 2026. Extreme fear is a signal, not a floor, and it can persist longer than expected.
What would confirm that Bitcoin has turned?
Four signals: price reclaiming the 20-day EMA near $62,450 and then resistance around $64,000, ETF flows flipping back to sustained inflows, open interest rebuilding alongside a rising price, and the Fear and Greed Index lifting off its extremes. Until several align, the constructive signals describe a market that could turn instead of one that has, so confirmation should come before conviction.
Disclaimer: This article is for information purposes only and does not constitute financial, investment, or trading advice. Cryptocurrency prices are highly volatile, and technical and sentiment analysis is speculative and may not predict actual movements. Nothing here is a recommendation to buy or sell any asset. Always do your own research and consider consulting a licensed professional before making financial decisions. Figures are accurate as of July 1, 2026, and will change.

Shares in the Trump family-backed American Bitcoin (ABTC) sank to an all-time low on Wednesday after the crypto miner set a date for a 1-for-15 reverse stock split in a bid to stay listed on the Nasdaq.
American Bitcoin said its reverse stock split will go into effect after the market closes Thursday and will begin trading on a split-adjusted basis when the market opens Monday. It would continue to trade under the ticker ABTC.
It said every 15 shares of the company’s Class A and B common stock will be reclassified as one share. The company expects its common stock to be reduced from more than 1 billion outstanding shares to about 73 million.
American Bitcoin is the only public crypto company tied to the Trump family’s sprawling interests in the sector, and a reverse stock split is typically seen as a negative, as it indicates the company is in distress and is looking to artificially boost its share price.
American Bitcoin said the split aims to prop up its shares to maintain compliance with Nasdaq’s minimum bid requirements, which allow the exchange to delist the company if it trades below a $1 closing price for 30 consecutive trading days.
Shareholders had approved the reverse stock split on June 22.
American Bitcoin shares hit all-time low
Shares in American Bitcoin dropped nearly 8.4% to close trading Wednesday at an all-time low of 62 cents. The stock saw a slight lift after-hours, rising 4.5% to 65 cents.
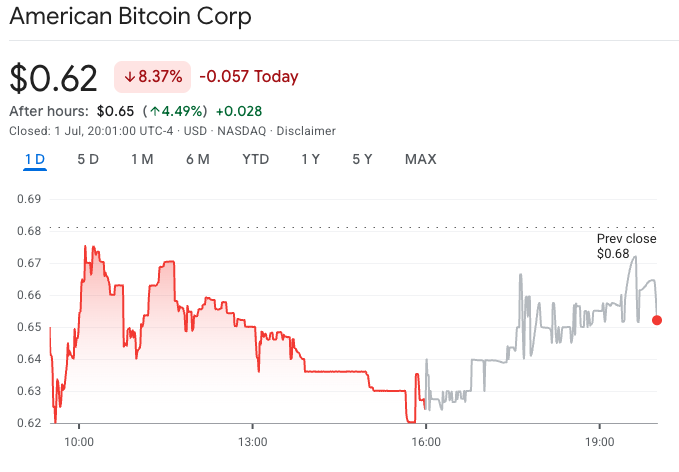
American Bitcoin’s stock tumbled to an all-time closing low of 62 cents on Wednesday. Source: Google Finance
American Bitcoin’s stock is down more than 63% so far this year and has fallen more than 92% since the brand started trading on the Nasdaq on Sept. 3.
The company was co-founded early last year by US President Donald Trump’s sons, Donald Trump Jr. and Eric Trump.
American Bitcoin merged with the Nasdaq-listed Gryphon Digital Mining to go public, with the Trump brothers and crypto miner Hut 8 together owning around 98% of the newly formed company.
Related: Bitcoin miners need billions to fund AI ambitions, led by IREN’s $21B gap
The company’s falling share price comes amid a wider downturn in the crypto market. American Bitcoin reported in May that it lost $81.7 million in the first quarter.
Other crypto companies have also turned to reverse stock splits to prop up their share price. Bitcoin financial services company Nakamoto completed a 1-for-40 reverse stock split in May in a bid to stay listed on the Nasdaq after it reached a low of 16 cents in April.
Bitcoin (BTC) was trading at around $60,000 early Thursday, down 32% so far this year and having more than halved from its peak of more than $126,000 in October, according to CoinGecko.
Magazine: Clarity Act risks repeat of Europe’s mistakes, crypto lawyer warns
American Bitcoin (ABTC) is set to complete a 1-for-15 reverse stock split as it tries to remain listed on Nasdaq, a move that arrives as the company’s shares sink to fresh lows. The miner said the split becomes effective after the market closes on Thursday and will be reflected in trading on a split-adjusted basis when the market opens Monday, with the stock continuing to trade under the ABTC ticker.
Under the plan, every 15 shares of the company’s Class A and Class B common stock will be consolidated into a single share. American Bitcoin expects that its share count will fall from more than 1 billion outstanding shares to about 73 million. According to the company’s release, shareholders approved the reverse split on June 22, and the company now aims to satisfy Nasdaq’s minimum bid rules.
Key takeaways
- ABTC’s 1-for-15 reverse stock split takes effect after Thursday’s market close and begins trading on a split-adjusted basis on Monday.
- American Bitcoin expects its outstanding shares to drop from over 1 billion to roughly 73 million while keeping the ABTC ticker.
- The company’s stated reason is to maintain compliance with Nasdaq’s requirement that the stock not trade below $1 for 30 consecutive sessions.
- Shares fell to an all-time low of 62 cents on Wednesday, down nearly 8.4% on the day, before a modest after-hours rebound.
- The move reflects a broader pattern among crypto-related public companies using reverse splits to address prolonged weakness in share prices.
Reverse split scheduled to protect Nasdaq listing
Reverse stock splits are often viewed by investors as a sign that a company is struggling to keep its stock above exchange listing thresholds. In American Bitcoin’s case, the company explicitly tied the action to Nasdaq’s minimum bid requirements, which can lead to delisting if a stock closes below $1 for 30 consecutive trading days.
American Bitcoin said it is implementing the consolidation to support its share price and maintain compliance with those rules. The company also confirmed that it would continue trading under the ABTC ticker through the process.
Shares hit a record low as crypto equities remain under pressure
Wednesday’s trading brought another sharp decline for ABTC. Shares fell nearly 8.4% to close at an all-time low of 62 cents. After the close, the stock reportedly edged higher by about 4.5% to 65 cents in after-hours trading.
The stock’s broader performance has been weak. American Bitcoin is down more than 63% year-to-date and has fallen more than 92% since it began trading on Nasdaq on Sept. 3, when the company launched through a merger process involving a publicly listed crypto mining entity.
American Bitcoin was founded earlier this year by Donald Trump Jr. and Eric Trump, according to the company’s background described in the reporting. The business merged with Nasdaq-listed Gryphon Digital Mining to go public, with the Trump brothers and crypto miner Hut 8 together holding roughly 98% of the combined company.
Financial results and market turbulence weigh on the stock
American Bitcoin’s share weakness is unfolding amid a wider downturn affecting parts of the crypto market and the equities that trade as proxies for it. In May, the company reported that it lost $81.7 million in the first quarter, with the figure cited in earlier coverage from Cointelegraph.
Reverse splits can help companies avoid immediate delisting pressures, but they do not address underlying business fundamentals. For traders, that means investors may still be exposed to the same operational risks—especially in a sector where revenue can be influenced by factors such as mining economics, digital asset prices, and cost structures.
Bitcoin itself was trading around $60,000 in early Thursday trading, down 32% so far this year and more than halved from its October peak of above $126,000, according to CoinGecko.
Broader trend: crypto firms use reverse splits to stay listed
American Bitcoin is not alone in turning to reverse stock splits to manage listing compliance. Another example cited in the reporting is Bitcoin treasury company Nakamoto, which completed a 1-for-40 reverse stock split in May after its shares reached a low of 16 cents in April, also in an effort to remain on Nasdaq.
The pattern is notable because it highlights a recurring tension for crypto-linked equities: when digital assets or mining sentiment deteriorate, smaller-cap listed firms can quickly slip below exchange price floors. Reverse splits can temporarily alter the math of share price—though they leave investors’ proportional exposure unchanged in most cases—while companies work to stabilize operations or regain market confidence.
For ABTC holders, the immediate practical impact is timing. With the split scheduled to take effect after Thursday’s close and begin reflecting on Monday’s open, investors will want to watch how the market recalibrates around the new share count and whether trading volume or liquidity dynamics change after the adjustment.
Going forward, the key unknown is whether the company can sustain its share price long enough to satisfy Nasdaq’s ongoing $1 minimum-bid condition. The next few trading weeks will be the real test: the exchange compliance clock runs on consecutive closing prices, so investors should track ABTC’s daily closes after the effective date to see whether the reverse split achieves its intended listing protection.


dYdX Labs launched Arcus on Wednesday, a decentralized exchange that combines tokenized stock trading with perpetual futures. Founder Antonio Juliano announced the launch on X, built jointly with Robinhood Crypto. Arcus runs on Robinhood Chain, the EVM-compatible layer 2 that Robinhood opened to… Read the full story at The Defiant

So wird man bei Finanzprodukten abgezockt – Thomas Kehl, Finanzfluss

Affirm: Investor Day Bolsters Confidence That Growth Is Just Getting Started (NASDAQ:AFRM)

Bitcoin June Close Below 200 Week MA Above Realized Price


-

 Fashion5 days ago
Weekend Open Thread: Staud – Corporette.com
-

 Politics6 days ago
The House | Manchesterism won’t survive the painful trade-offs unless it gets citizens on board
-

 Crypto World2 days ago
Strategy authorizes up to $1.25B in Bitcoin sales under new capital plan
-

 Politics6 days ago
Potential 2028er World Cup attendee leaderboard
-

 Business6 days ago
Asia stock markets slide as tech shares slump
-

 News Videos3 days ago
MAJOR BITCOIN & MARKET UPDATE!!!! (MUST WATCH ASAP!!!)
-

 Tech6 days ago
A Look At A Gaggle Of Transputer Boards
-
 Crypto World6 days ago
Dell (DELL) Shares Tumble Over 5% Following Analyst Downgrade to Hold
-

 Crypto World4 days ago
Coinbase, Circle Deepen Crypto Stock Losses Despite Resilient S&P 500
-

 Business2 days ago
Australia treasurer says alleged access of prime minister’s bank data ’incredibly concerning’
-

 Crypto World5 days ago
Kraken's xStocks Opens Bending Spoons IPO Registration to EEA Retail
-

 Sports5 days ago
FIH Pro League: India defeat Pakistan 7-1, register biggest win of campaign | Other Sports News
-
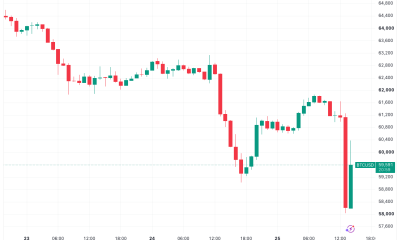
 Crypto World6 days ago
Bitcoin Sparks $600M Hourly Liquidations With $65,000 Set To Become Resistance
-

 Tech4 days ago
Bluekit phishing kit adopts browser-in-the-middle for login theft
-

 Tech5 days ago
Russian hackers now target Signal backup recovery keys
-

 Tech2 days ago
Anonymous researcher drops 0-day ‘exploitarium’ repo
-
 Crypto World6 days ago
Hyperliquid Named on Singapore MAS Investor Alert Register
-

 Crypto World5 days ago
RTX holders must register wallets before token distribution begins
-

 Crypto World7 days ago
Ripple and SBI launch RLUSD in Japan after JFSA approval
-

 Sports15 hours ago
Broncos roster: OL Ben Powers (No. 74) entering final year of contract
You must be logged in to post a comment Login