

Crypto World
Irish Authorities Seize Another 500 Bitcoin in Criminal Proceeds
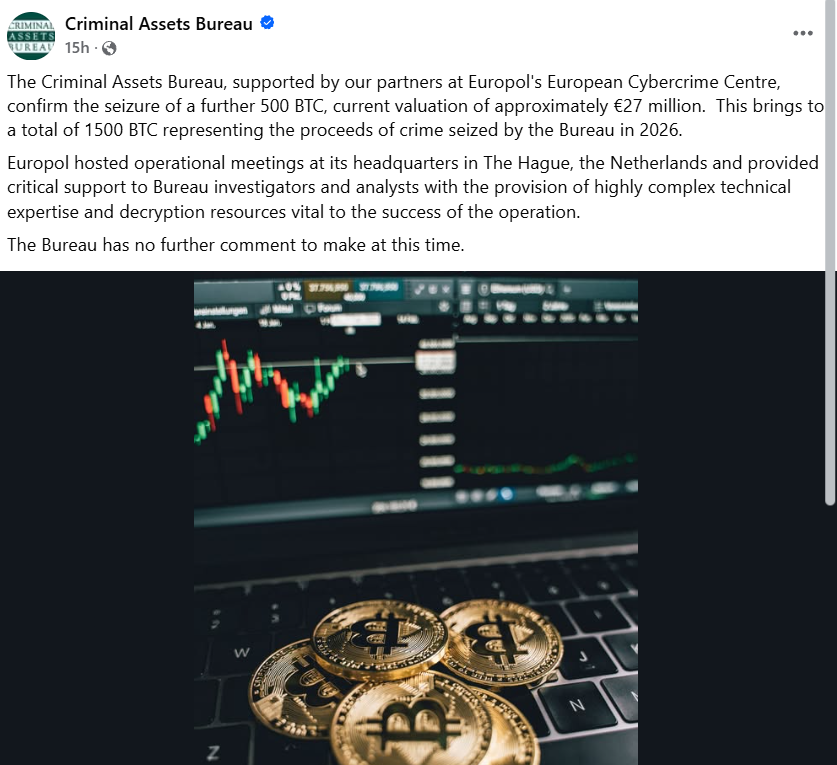
Ireland’s Criminal Assets Bureau (CAB) confirmed the seizure of another 500 Bitcoin, currently worth about 27 million euros ($30.9 million), in collaboration with Europol’s European Cybercrime Centre.
That brings the total Bitcoin seized by CAB in 2026 to 1,500 BTC, worth about $92.4 million, the law enforcement agency said in a social media post on Thursday. CAB said Europol had provided operational coordination, technical expertise and decryption support during the investigation.
The agency did not disclose the identity of the wallet owner or details of the underlying investigation, adding that it had no further comment.
The latest seizure comes months after CAB said it had gained access to and seized a cryptocurrency wallet containing 500 Bitcoin, which Irish media linked to a convicted drug dealer.

CAB seized another 500 BTC. Source: Criminal Assets Bureau
Collins-linked Bitcoin wallet becomes active
Following the previous seizure, The Irish Times reported that the wallet authorities accessed in March was one of 12 holding about 6,000 BTC once owned by Clifton Collins, a convicted drug dealer. The paper containing the wallet’s private keys was reportedly lost.
While authorities haven’t confirmed whether the latest seizure is linked to Collins, a wallet address associated with him moved 500 Bitcoin to an unknown address on Thursday. Wallets associated with Collins still hold 4,500 Bitcoin, currently worth about $277 million, as of Friday.
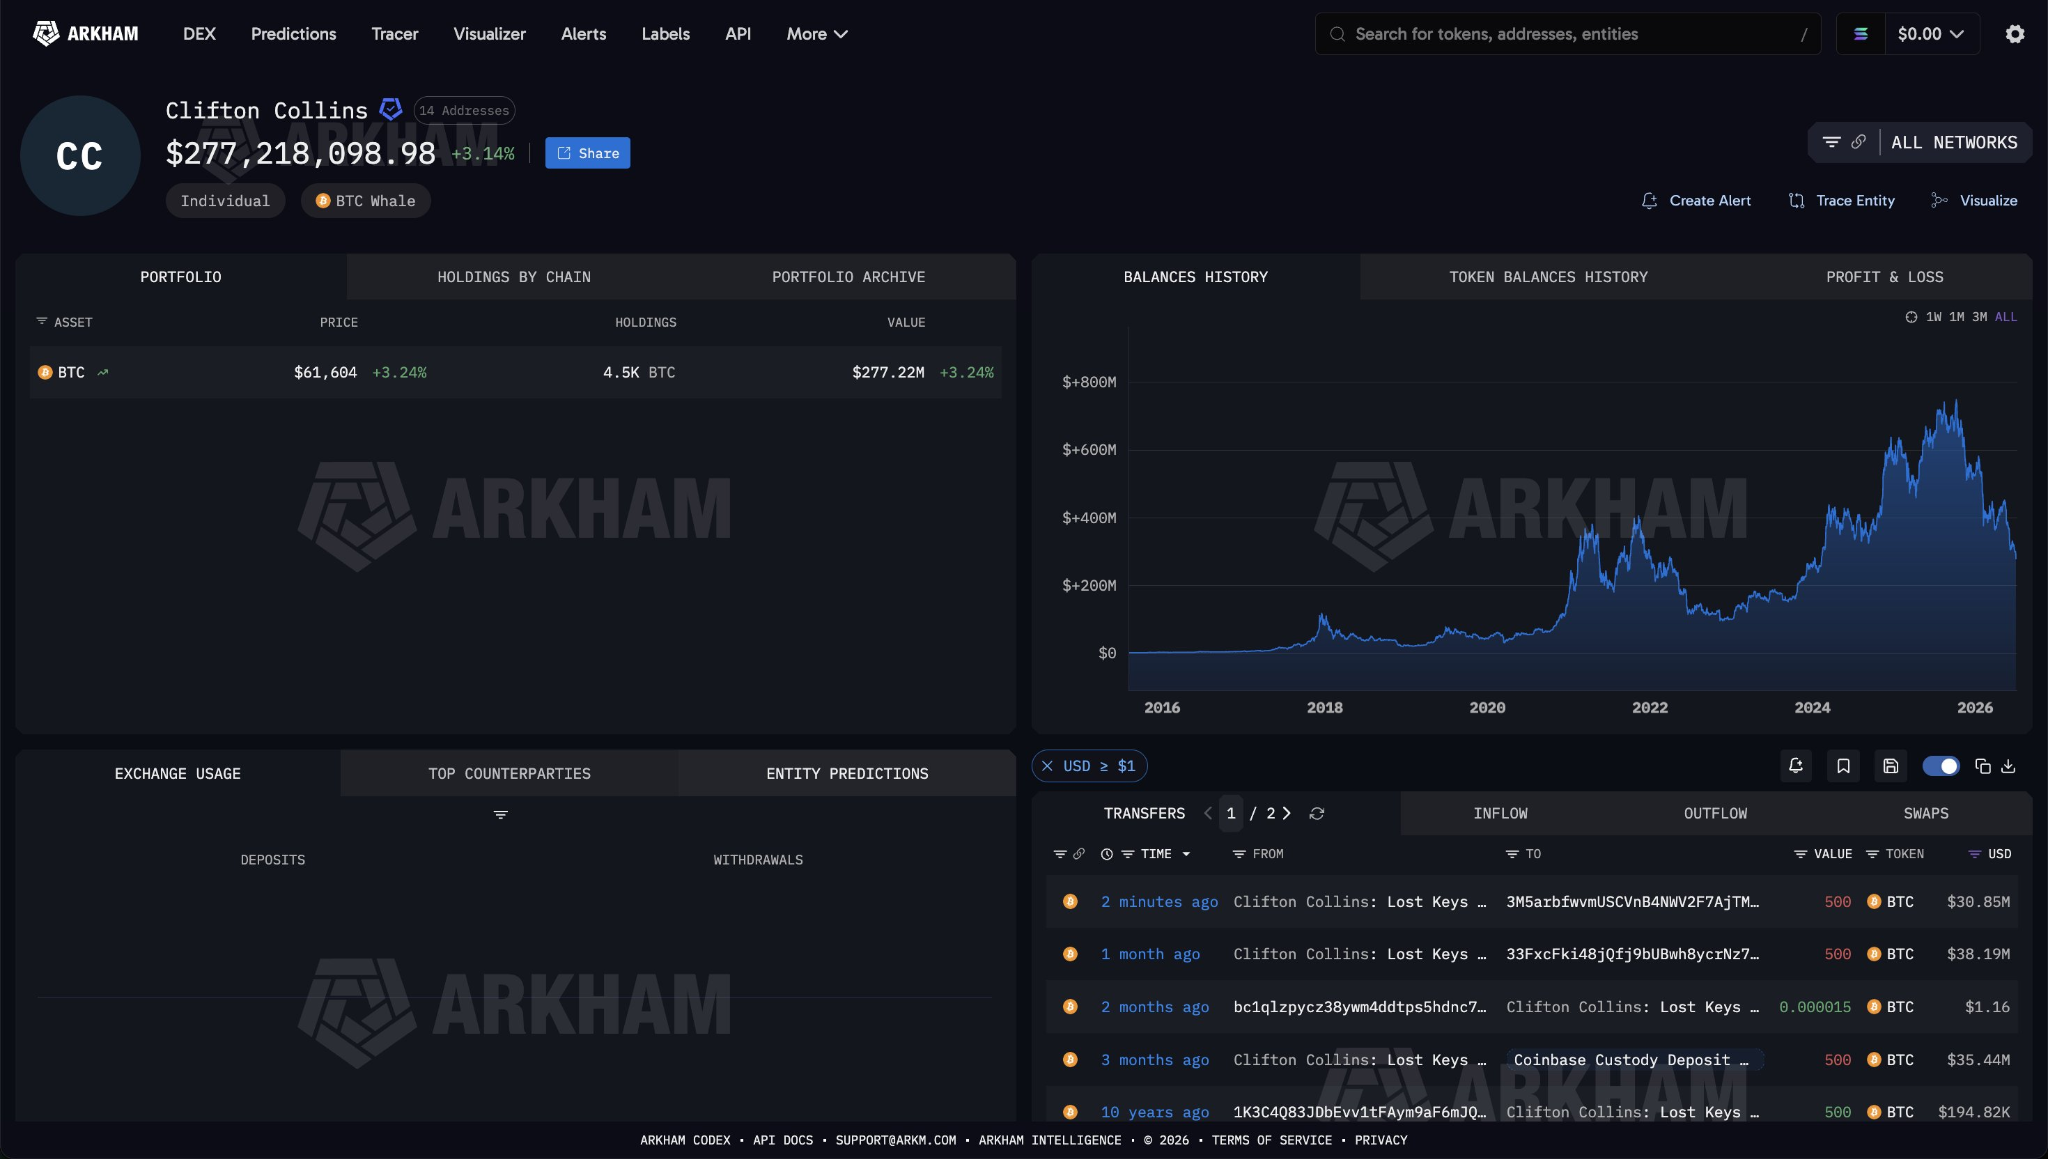
Source: Arkham
Related: US sanctions Sinaloa cartel-linked Ethereum addresses
Collins was arrested in 2017 after police searched his car and found a stash of cannabis, according to the Guardian.
Police said Collins used proceeds from his drug operation to purchase 6,000 Bitcoin in late 2011 and early 2012, spreading the holdings across 12 wallets. He stored the wallet keys on a single sheet of A4 paper, hidden inside the aluminum cap of a fishing rod case at his rental home.
Collins’ landlord allegedly discarded his belongings after his arrest. Collins claimed the fishing rod case was stolen before the landlord entered the property.
Magazine: How crypto laws changed in 2025 — and how they’ll change in 2026


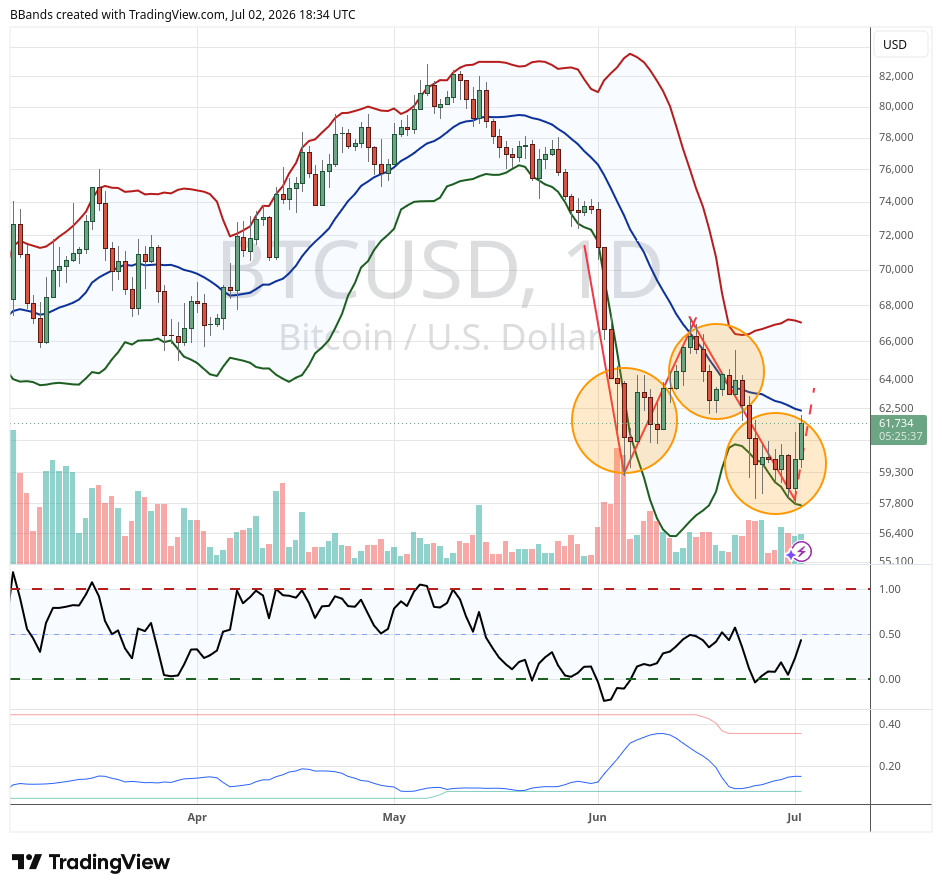
Bitcoin appears to be nearing a potential technical turning point as analyst John Bollinger points to a “W”-shaped double-bottom pattern forming on the daily chart. In a fresh set of posts on X, Bollinger argued that the setup is “perfectly fractal,” suggesting the market could be moving into the final phase of a longer bearish cycle.
The technical discussion is landing alongside evidence that institutional demand may be cautiously reappearing. Data shared by market participants indicated that US spot Bitcoin ETFs recorded their first net inflows in ten days, while traders noted that BTC’s ability to hold near the $60,000 area despite broader outflows may signal absorption of selling pressure.
Key takeaways
- John Bollinger highlighted a daily “W” double-bottom structure on BTC/USD, framing it as a candidate to break the prevailing downtrend.
- Bollinger described the pattern as “perfectly fractal,” including smaller “w” formations near prior lows and a corresponding “m” at the rebound apex.
- US spot Bitcoin ETFs saw their first net inflows in ten days, signaling easing pressure in the ETF channel.
- Traders said BTC’s stability around the ~$60,000 region—despite ETF outflows earlier—could matter if price continues holding into the next week.
Bollinger’s “perfectly fractal” double bottom
Bollinger, known for creating the Bollinger Bands volatility indicator, used X to examine the current BTC/USD structure. He pointed to a “W”-shaped reversal pattern—typically defined by two swing lows with a rebound in between—arguing that such formations become bullish once price clears the level of resistance created at the rebound.
In his posts, Bollinger noted that prior bullish patterns had been broken, reinforcing his view that the downtrend has been dominant. He then asked whether the present “W” could be the one that “breaks” the trend.
Bollinger also shared a chart aligning the setup with the lower Bollinger Band on daily time frames. He emphasized the fractal nature of the structure, stating that smaller “w” shapes appear at the nadirs and a smaller “m” forms near the apex of the bounce. He further referenced a similar “W” on the weekly chart, implying the idea is not only limited to the daily timeframe.
For traders, the practical question is what counts as confirmation. In classical pattern terms, the bullish outcome hinges on BTC pushing through the rejection level between the two lows. Until that occurs, the pattern remains a hypothesis rather than a verified reversal.
Why the ETF channel is drawing attention
While Bollinger’s analysis is technical, the accompanying focus on ETFs reflects how institutional flows are often used as a real-time indicator of demand. According to market participants on X, US spot Bitcoin exchange-traded funds recorded their first net inflows in ten days on Friday.
Analyst Axel Adler Jr., a contributor to onchain analytics platform CryptoQuant, characterized the move as meaningful for gauging whether ETF-related pressure is easing. In his summary, Adler Jr. said that Bitcoin may be in the late stage of the bear cycle, but the ETF segment had, for the first time, signaled reduced pressure.
Another trader, Daan Crypto Trades, responded by cautioning that the inflow amount—reported as $220 million—was “not massive.” Still, he suggested the context matters: BTC had been holding roughly the $60,000 region even while there were many outflows. In his view, the area becomes more relevant if price continues to bounce further into the next week, since that would imply a larger amount of “absorption” has taken place.
This is an important distinction. In bearish phases, inflows can be sporadic and not necessarily change the broader trend. The market impact tends to be clearer when price holds and demand persists rather than appearing briefly.
Signals vs. expectations for a macro bottom
Even with renewed interest in ETF flows, the broader market narrative still points to uncertainty about when the macro bottom will arrive. Earlier coverage cited by the same discussion noted that multiple price indicators have been flashing signals not seen since the 2022 bear market. However, many participants continue to believe the next macro bottom is still ahead, with timing expectations pointing to Q3 or later.
Bollinger’s framing fits into that wider tension between “early signals” and “final bottoms.” A W-shaped reversal, if it plays out as expected, would suggest momentum could shift sooner than the macro timetable implies. But without confirmation—especially a breakout through the pattern’s rejection level—the setup could also end up failing or only triggering a temporary bounce within a longer downtrend.
From an investor perspective, that makes the coming price action particularly consequential. If BTC can hold near the reclaimed levels mentioned in the ETF discussion and then follow through on a breakout, the technical pattern could align with improving demand. If not, it may reinforce the view that market participants have not yet reached the stage where bearish pressure fully dissipates.
What to watch next
The next phase will likely depend on whether BTC can translate ETF inflows and near-$60,000 stability into sustained upside, particularly through the key resistance level implied by Bollinger’s “W” structure. Readers should watch for actual confirmation of the pattern—rather than relying only on improving signals—and track whether institutional demand remains supportive beyond this first inflow after a ten-day stretch.

Key Takeaways
- Bloom Energy shares have climbed approximately 194% in 2026 and more than 1,100% over the trailing 12 months, currently trading near $271
- First-quarter 2026 earnings per share reached $0.44, significantly exceeding the $0.12 analyst consensus; revenue totaled $751M, reflecting 130.4% year-over-year expansion
- The company and Brookfield Asset Management quintupled their AI infrastructure financing arrangement to $25 billion
- Full-year 2026 EPS outlook was upgraded to a range of $1.85–$2.25; institutional holders control 77% of shares outstanding
- Wall Street maintains a consensus “Hold” recommendation with a mean price objective of $236.14, trailing the current market price
Bloom Energy (BE) stock is hovering around $271, marking an approximate 194% gain year-to-date and a staggering 1,100%-plus advance from the same period last year. The solid oxide fuel cell manufacturer has emerged as one of 2026’s most explosive equities, propelled by accelerating demand for distributed power solutions serving AI-driven data facilities.
Shares began Friday’s session at $271.13. The 52-week trading range spans from $22.81 to $351.28, with the 50-day simple moving average positioned at $280.49 and the 200-day at $190.83. The company’s market capitalization currently stands at approximately $77 billion.
Bloom’s solid oxide technology transforms natural gas into electricity through an electrochemical process that bypasses traditional combustion. These systems can be installed and operational within a three-month window — a compelling advantage over conventional grid infrastructure, which often requires multi-year development timelines.
Hewlett Packard Enterprise CEO Antonio Neri has projected that the United States may confront a 19-gigawatt electricity supply deficit by 2028. Data centers are anticipated to drive nearly half of all incremental U.S. power demand through the end of the decade. This emerging supply-demand imbalance represents a structural growth driver for Bloom.
First Quarter Delivers Blowout Performance
Product revenue in Q1 — predominantly energy server shipments — tripled compared to the prior-year period. Consolidated revenue reached $751 million versus the Street’s $539.94 million estimate. Earnings per share landed at $0.44, crushing the consensus forecast of $0.12. Net profit margin registered at 0.25% while return on equity measured 21.05%.
On the strength of these results, Bloom management elevated full-year 2026 EPS guidance to a band of $1.85–$2.25. The current analyst consensus for the fiscal year sits at $1.34 per share.
In a move that attracted considerable attention, Bloom and Brookfield Asset Management expanded their collaborative AI power financing framework from $5 billion to $25 billion. This fivefold expansion underscores strong visibility into the fuel cell deployment pipeline at hyperscale computing facilities.
Institutional shareholders now account for 77% of outstanding shares. Leonteq Securities AG boosted its stake by 396.3% during the first quarter, acquiring an additional 89,185 shares to reach a total position of 111,687 shares valued at approximately $15.1 million.
Executive Selling and Wall Street Skepticism
Despite the rally, corporate insiders have been reducing holdings. Chief Commercial Officer Aman Joshi offloaded 8,343 shares on July 1 at a price of $300.37, generating proceeds of roughly $2.5 million. Director John T. Chambers divested 55,000 shares in late May at $297.69 per share, totaling more than $16.3 million. Across the past 90 days, insider dispositions have exceeded $59.8 million in aggregate value.
Wall Street opinion remains divided. Roth MKM maintains a “neutral” stance with a $285 price target. Barclays assigns an “equal weight” rating at $276. TD Cowen holds at $235. BMO Capital Markets offers one of the more constructive views with an “outperform” designation. Zacks Investment Research recently lowered its recommendation from “strong-buy” to “hold.”
The Street consensus settles at “Hold” with an average twelve-month target of $236.14 — approximately 13% beneath current trading levels.
Bloom carries a debt-to-equity ratio of 2.90 and a negative trailing price-to-earnings multiple, reflecting that profitability remains inconsistent despite robust top-line momentum.
BMO Capital Markets reiterated its “outperform” view on June 9, positioning itself among the minority of firms expressing bullish conviction at prevailing valuations.


Key Takeaways
- Wolfe Research raised CVX to Outperform, establishing a $210 price target based on underappreciated long-term cash generation
- Current market assumptions imply Brent crude under $60/barrel, while normalized futures suggest closer to $70/barrel
- The Uaru development in Guyana is projected to reach a critical free cash flow milestone during late 2026
- CVX surpassed Q1 expectations with $1.41 earnings per share versus $1.00 consensus, offering a 4.2% dividend
- Several major institutional holders expanded their CVX stakes throughout Q1 and Q2 2026
Chevron (CVX) advanced 1.6% Thursday following Wolfe Research’s decision to elevate the energy stock to Outperform from Peer Perform, accompanied by a $210 valuation target. Shares began Friday’s session at $169.06, remaining considerably beneath the $214.71 52-week peak.
According to Wolfe analyst Doug Leggate, fluctuating commodity prices have obscured meaningful enhancements to Chevron’s sustainable cash generation capabilities. He contends the market currently assumes long-term Brent pricing beneath $60 per barrel — significantly lower than the approximately $70 normalized forward pricing curve.
This valuation disconnect, Leggate maintains, presents a compelling entry point.
RBC Capital likewise maintained its Buy stance on CVX this week, contributing to the predominantly optimistic analyst sentiment. The equity currently carries a consensus Moderate Buy recommendation with a mean price objective of $205.71 spanning 26 analysts — comprising 19 Buy, 6 Hold, and 1 Sell ratings.
Mizuho elevated its target from $225 to $230 in late May. Goldman Sachs and UBS both maintain Buy recommendations with targets of $216 and above.
Guyana Represents the Primary Catalyst
Leggate identifies Guyana as the most significant near-term growth driver. The Uaru development is anticipated to commence operations and achieve a free cash flow turning point during the latter half of 2026, which should bolster CVX’s financial stability even if crude prices remain subdued.
Guyana is also projected to generate sufficient cash to offset the dividend obligations tied to the Hess acquisition — and eventually, Leggate anticipates it becoming Chevron’s largest single source of free cash flow.
This becomes particularly relevant approaching 2033, when the Tengiz partnership in Kazakhstan reaches its contractual conclusion.
Beyond Guyana, Chevron has obtained fresh development rights this year across Venezuela, Libya, and Iraq, with a possible ninth Guyana development phase under consideration. According to Wolfe, these initiatives could sustain production expansion well past 2030.
Institutional activity has intensified concurrent with analyst upgrades. Peregrine Asset Advisers more than doubled its CVX holdings during Q1, expanding its position by 118.7% to 20,344 shares valued at approximately $4.21 million.
Financial Results and Shareholder Returns
CVX most recently disclosed earnings on May 1st, delivering $1.41 earnings per share compared to consensus expectations of $1.00 — exceeding forecasts by $0.41. Revenue totaled $47.56 billion, representing 2.1% year-over-year growth, though modestly trailing the $51.86 billion analyst projection.
The corporation distributed a quarterly dividend of $1.78 per share in June, translating to a $7.12 annualized payout and a 4.2% yield. The current payout ratio stands at 123.4%.
CVX’s Q2 2026 earnings announcement is slated for later this month, with analysts already identifying it as the next potential stock catalyst.
The 50-day moving average rests at $183.31 while the 200-day sits at $180.40, with CVX’s present price of $169.06 positioned below both technical indicators.

TLDR;
- Bhutan Bitcoin Transfer activity moved 700 BTC worth about $43.75 million to Binance, drawing attention as Bitcoin traded above $62,000.
- Bhutan-linked wallets still reportedly hold around 1,750 BTC after the latest transfer, keeping the country among watched sovereign crypto holders.
- A Binance deposit does not always confirm a sale, as large holders may use exchanges for OTC deals, liquidity, or treasury operations.
- Bitcoin’s move above $62,000 followed renewed buyer interest near $58,000, with traders watching whether support holds again.
The Bhutan Bitcoin tansfer has drawn fresh market attention after government-linked wallets reportedly moved 700 BTC to Binance. The transfer was worth about $43.75 million, based on Bitcoin’s price near $62,500.
The move came as BTC reclaimed the $62,000 zone after defending support near $58,000. Traders often watch large exchange deposits closely, as they can signal possible selling.
Still, a transfer to Binance does not always mean immediate liquidation. Large holders may also use exchanges for OTC trading, liquidity planning, or internal treasury movements. Bitcoin traded near $62,500 on Saturday.
Bhutan Bitcoin Transfer Puts Binance Flows Under Watch
The Bhutan Bitcoin transfer involved two separate transactions to the same Binance deposit wallet. The larger transfer moved 634 BTC, valued near $39.6 million. A second transaction moved 66 BTC, worth about $4.12 million.
Together, the transfers brought the total to 700 BTC. That made the activity one of the latest major Bhutan-linked movements tracked by market watchers. Earlier transfers by Bhutan-related wallets also moved large BTC amounts this year.
The wallets are tied to the Royal Government of Bhutan through Arkham Intelligence labels. As reported previously, Bhutan’s Bitcoin holdings came from government-backed mining operations, rather than criminal seizures.
After the latest movement, the wallets reportedly still hold about 1,750 BTC. A prior report in June also showed Bhutan-linked wallets holding nearly 1,749.96 BTC after a Binance transfer. That earlier transfer moved 533 BTC, worth about $34.5 million at the time.
BTC Selloff Risk Rises as Bitcoin Reclaims $62K
Bitcoin is recovering from recent pressure trading near $62,555, with daily volume above $21 billion. The price rebound followed two defenses of the $58,000 area. That level has turned into a key short-term support zone for traders. Buyers stepped in near that range, while short liquidations helped fuel the recovery.
Meanwhile, macro data added another layer to the move. Softer U.S. labor figures supported expectations that the Federal Reserve may stay less aggressive. Risk assets often respond to that shift, especially when liquidity hopes improve.
Still, large BTC exchange deposits can unsettle traders. A government-linked transfer may raise concerns about supply hitting the market. At the same time, exchange movement alone does not prove a sale.
For now, traders are watching Binance flows, BTC volume, and the $58,000 support zone. A clean hold above $62,000 could keep buyers active. A sharp reversal may bring attention back to the latest Bhutan-linked wallet activity
Bitcoin (BTC) is completing a “perfectly fractal” reversal pattern that a well-known analyst hopes could end the bear market.
Key points:
- Bitcoin is on the final leg of what could become a major “W”-shaped reversal pattern.
- John Bollinger suggests that its success could “break” the downtrend in place since October 2025.
- Institutional interest slowly returns as newly reclaimed $60,000 holds.
John Bollinger hints BTC price “W” reversal could break bears
In X posts on Friday, John Bollinger, creator of the Bollinger Bands volatility indicator, eyed a “W”-shaped double bottom on BTC/USD.
“$BTC has seen a series of bullish patterns broken, evidence of the power of the downtrend,” he commented.
“Will this ‘W’ be the one that breaks the trend?”
“W”-shaped reversals involve two swing lows with a rejected rebound in between, with price ultimately breaking through that rejection level to form a new uptrend.
Bollinger uploaded a chart showing how neatly the current setup aligns with the lower band of the Bollinger Bands indicator on daily time frames.
“Note that it is perfectly fractal. The are small ‘w’s at the nadirs and a small ‘m’ at the apex,” he added, also pointing to a “W” on the weekly chart.

BTC/USD one-day chart with Bollinger Bands. Source: John Bollinger/X
Bollinger has been bullish on BTC for some time. In early May, he revealed a new long position via his Bitcoin investment vehicle.
As Cointelegraph reported, an increasing number of price indicators are flashing signals not seen since the last bear market in 2022. Despite this, market participants broadly believe that the next macro bottom is still to come and is due in Q3 or later.
Bitcoin ETF inflow comes amid major supply “absorption”
Continuing, analyst Axel Adler Jr., a contributor to onchain analytics platform CryptoQuant, stressed the significance of re-emerging institutional buyer interest.
Related: Bitcoin price tags $62.3K nine-day high after global stocks hit historic record
On Friday, the US spot Bitcoin exchange-traded funds (ETFs) saw their first net inflows in ten days.
“Bitcoin is in the late stage of the bear cycle, but the ETF segment has for the first time signaled that the pressure is easing,” he summarized on X.
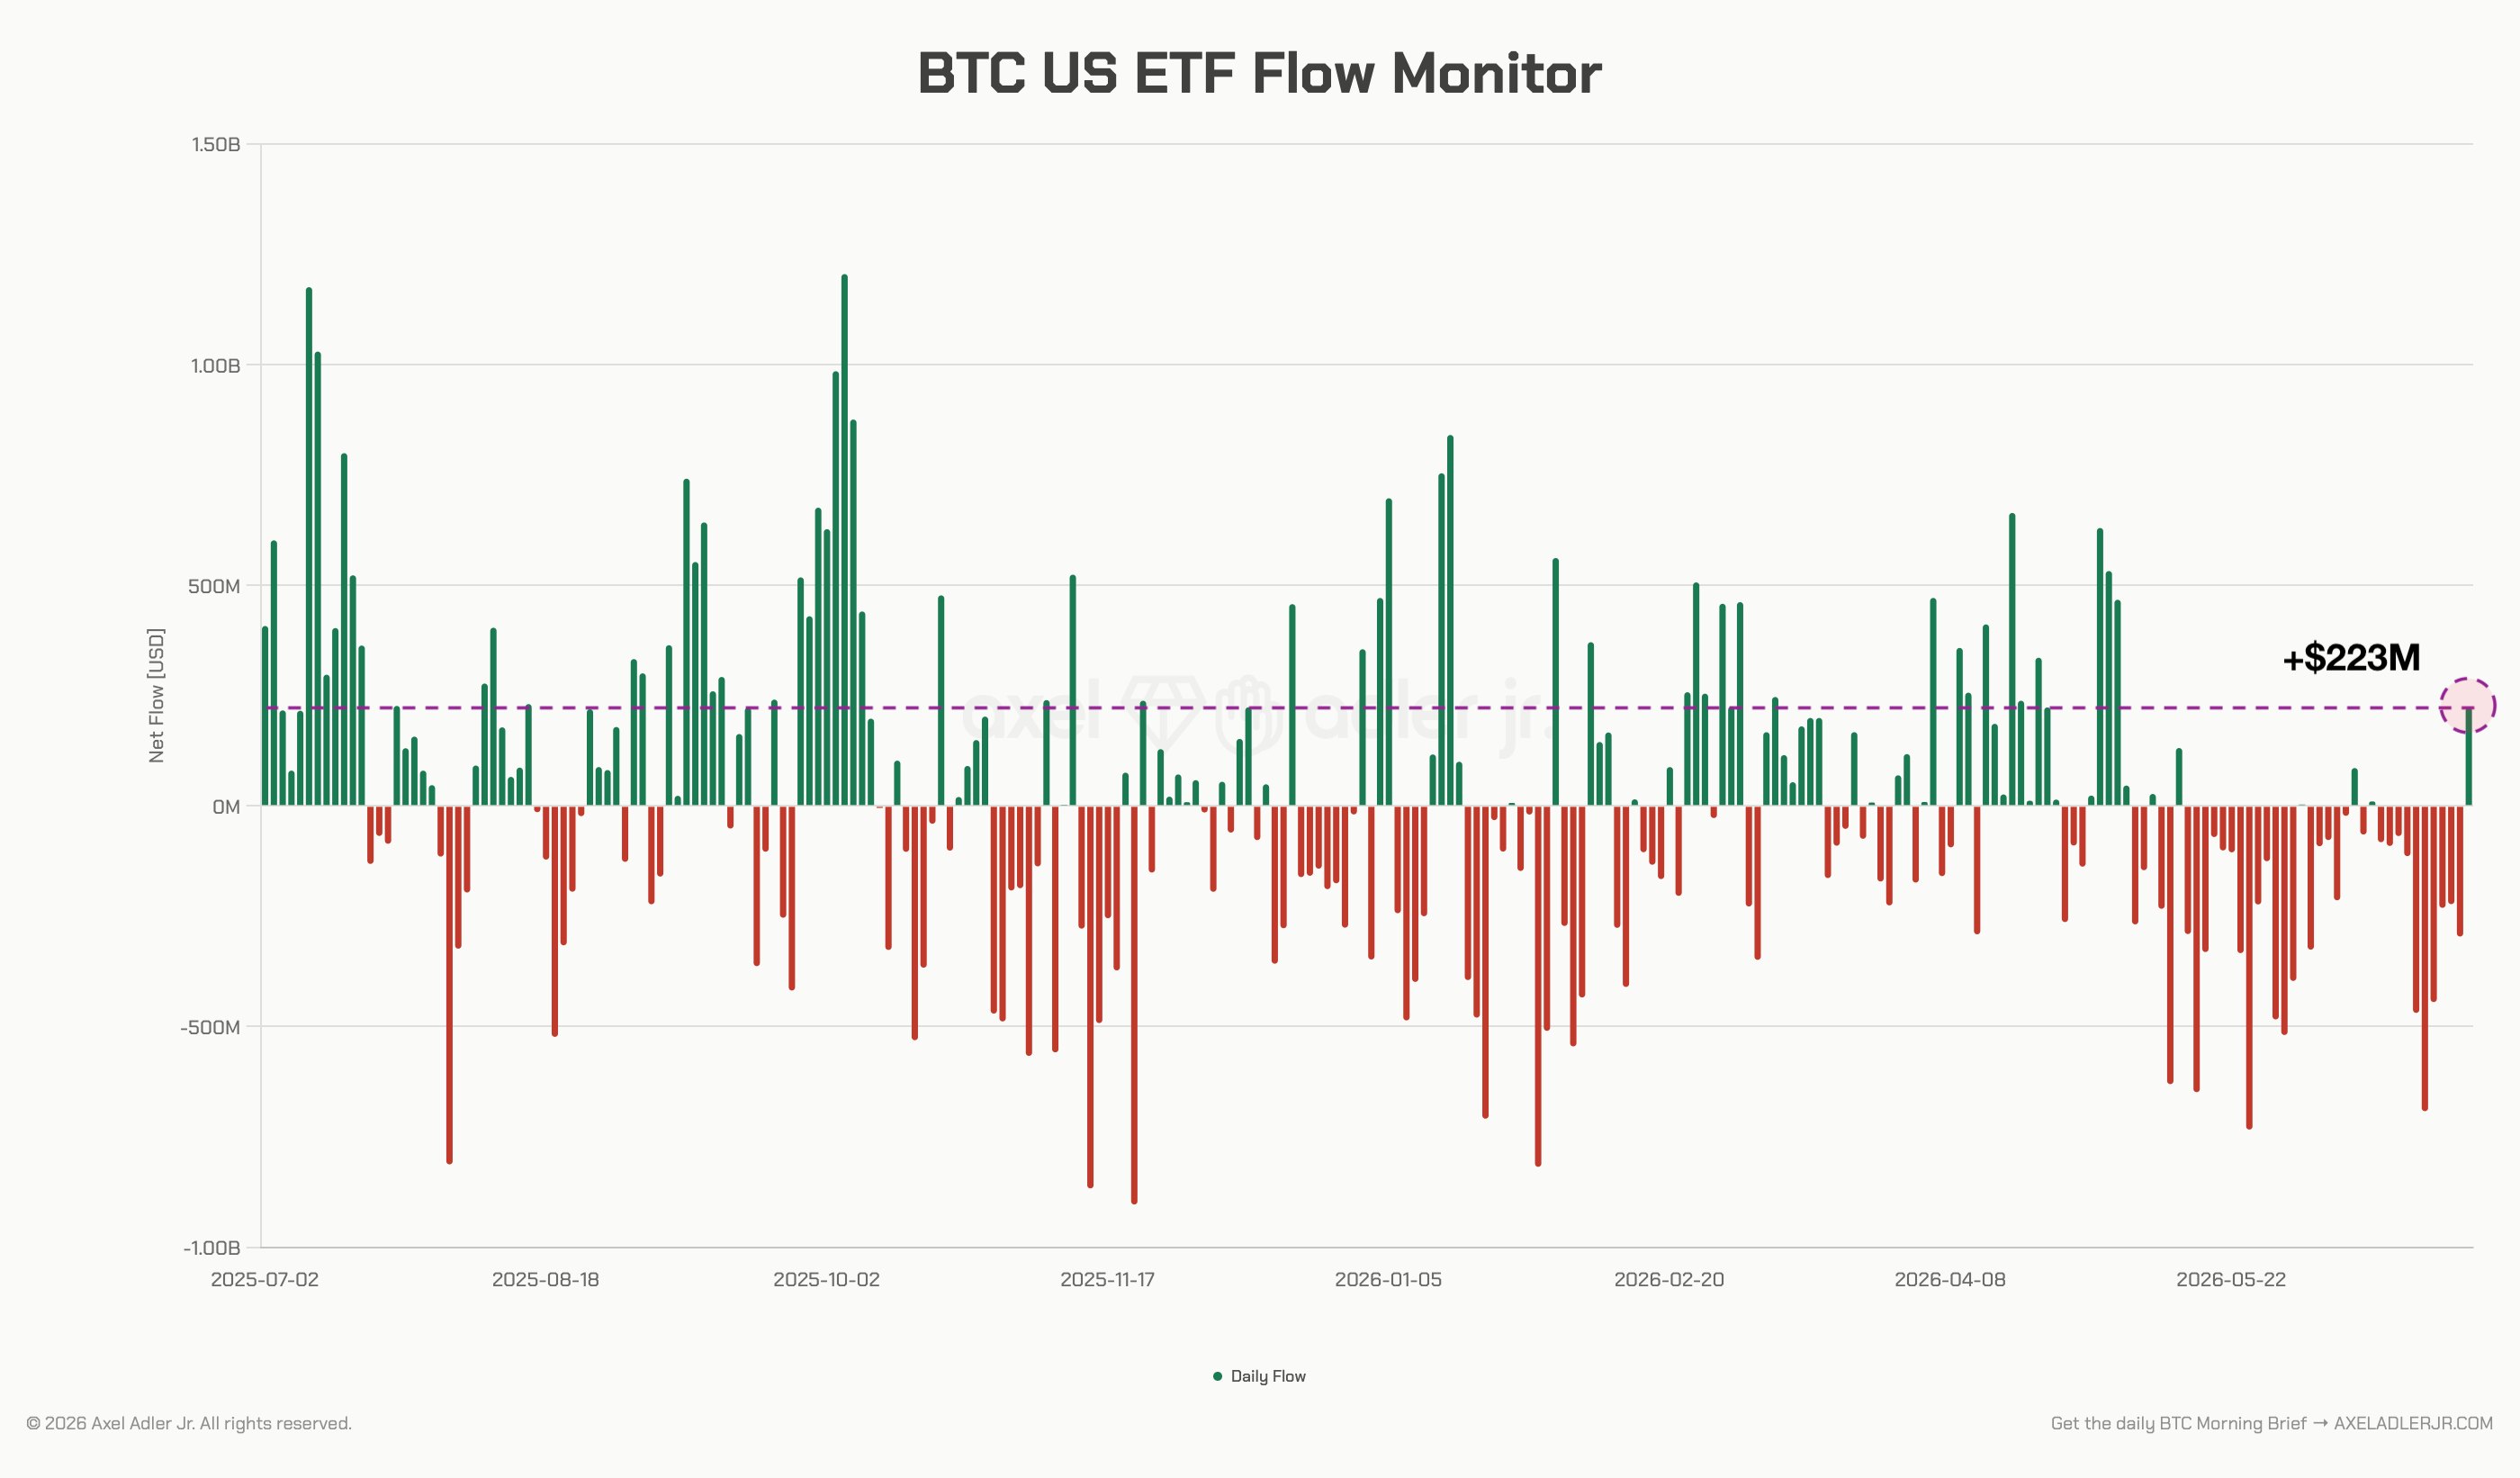
US spot Bitcoin ETF netflows. Source: Axel Adler Jr./X
Trader Daan Crypto Trades acknowledged that while the $220 million inflows were “not massive,” they could have implications for BTC price support going forward.
“Also good to note how price has been holding this ~$60K region regardless of the many outflows. That will become meaningful if price does bounce further into next week as it means a lot of absorption has taken place,” he told X followers.
Crypto World
Top Technology Dividend Champions for July 2026: Microsoft (MSFT), Broadcom (AVGO), and Qualcomm (QCOM) Stand Out

Key Highlights
- Three premier technology dividend stocks emerge as standouts for July 2026 investors
- Each company demonstrates significant artificial intelligence market penetration while maintaining shareholder distributions
- Microsoft boasts over twenty consecutive years of dividend growth backed by exceptional free cash flow generation
- Broadcom’s strategic VMware purchase enhanced its portfolio with predictable software-based revenue streams alongside AI silicon capabilities
- Qualcomm diversifies revenue channels beyond mobile handsets into vehicles, artificial intelligence platforms, and edge infrastructure
The technology sector’s reputation once centered exclusively on capital appreciation rather than income generation. This paradigm has fundamentally shifted. Today’s leading technology enterprises produce such substantial cash reserves that they simultaneously pursue aggressive expansion while distributing increasing shareholder payments. Three exceptional opportunities deserve investor attention this July.
Microsoft Dominates Through Artificial Intelligence and Cloud Computing
Microsoft represents one of the planet’s most financially robust corporations. Through its Azure cloud computing infrastructure, Microsoft 365 productivity ecosystem, and strategic OpenAI partnership, the company occupies a central position within the artificial intelligence revolution.
Despite massive capital allocation toward AI data center infrastructure, the enterprise continues producing exceptional free cash flow volumes. These cash reserves support both dividend distributions and aggressive stock repurchase programs.
For more than twenty consecutive years, Microsoft has increased its quarterly dividend payment. Management maintains a prudent payout ratio, preserving substantial capacity for future increases. While the current yield remains moderate, the powerful combination of consistent dividend escalation and capital appreciation potential creates an attractive long-term investment proposition.
Broadcom Capitalizes on AI Silicon and Enterprise Software
Broadcom has emerged as a semiconductor industry leader. The company provides advanced networking components, customized AI accelerators, and connectivity technologies powering the world’s largest hyperscale data centers.
The transformative VMware acquisition introduced substantial recurring subscription-based software revenues. This strategic move enhances business model diversification while strengthening predictable long-term cash flow generation.
Broadcom maintains an impressive history of consecutive dividend increases while simultaneously funding significant growth initiatives. Few semiconductor manufacturers can match its dual achievement of expanding profitability alongside accelerating shareholder returns. Investors seeking artificial intelligence market exposure combined with expanding income streams will find Broadcom particularly compelling.
Qualcomm Diversifies Beyond Mobile Device Markets
Qualcomm established its industry leadership through wireless communication chips powering smartphones worldwide. The company now aggressively pursues automotive electronics, edge computing platforms, personal computer processors, and AI-optimized data center infrastructure.
Executive leadership has articulated ambitious expansion plans for its emerging AI data center segment, establishing a promising long-term revenue channel beyond traditional wireless communications.
Qualcomm delivers consistently strong free cash flow performance. With over two decades of uninterrupted dividend increases and ongoing share repurchase activity, the stock currently trades at attractive valuation multiples relative to technology sector peers. This combination enhances appeal for income-oriented investors.
Determining the Optimal Investment Choice
Each equity offers distinctive advantages.
Microsoft provides unparalleled financial stability and deeply entrenched enterprise customer relationships. Broadcom delivers accelerated dividend growth fueled by surging AI infrastructure demand. Qualcomm presents reasonable valuation metrics alongside multiple expansion opportunities.
Holding positions across all three companies creates diversified exposure spanning cloud computing, semiconductor manufacturing, wireless technologies, automotive electronics, and enterprise software solutions—capturing several technology sector growth leaders while mitigating concentration risk.
Concluding Perspective
Technology sector dividends have evolved from negligible considerations to strategic priorities. Microsoft, Broadcom, and Qualcomm have each constructed business models generating the substantial cash flow volumes required to sustain rising dividend payments indefinitely.
Each organization pursues artificial intelligence opportunities through distinct strategic approaches. Each maintains balance sheet strength sufficient to continue rewarding shareholders throughout economic downturns.
For long-term investors seeking simultaneous income generation and capital appreciation within unified portfolios, these three corporations represent the most compelling opportunities currently available in the technology sector.
UK-headquartered fintech Revolut has informed some users that it will remove support for the Tether USDT stablecoin, with restrictions beginning in July and a full delisting scheduled for the end of August 2026. The bank said the change is driven by “regulatory and risk considerations,” while it also outlined how remaining USDT balances will be handled.
According to a customer notice reviewed by Cointelegraph, Revolut will stop letting users buy USDT starting July 6, 2026. Deposits will no longer be supported after July 30, 2026, and any incoming USDT transfers after that date will be rejected. Revolut’s final step is a full delisting by Aug. 31, 2026, after which it will automatically convert any remaining USDT into the user’s base currency at the exchange rate for that day.
Key takeaways
- Revolut will restrict USDT purchases from July 6, 2026, with full delisting set for Aug. 31, 2026.
- USDT deposits will end July 30, 2026, and transfers made afterward will be rejected.
- Unsold USDT after August will be automatically converted to users’ base currency using that day’s exchange rate.
- The company cites “regulatory and risk considerations” but does not specify which regulatory framework triggered the decision.
- The move fits a broader pattern of stablecoin access being reduced by European crypto service providers under MiCA.
Revolut’s timeline for USDT removal
Revolut’s notice divides the process into three practical phases for users. First, new USDT purchases will stop on July 6, 2026. Second, USDT deposits will cease on July 30, 2026, meaning users will not be able to add fresh USDT into Revolut accounts from that point onward. Third, if any USDT remains after the Aug. 31, 2026 delisting deadline, Revolut will convert those remaining holdings into a user’s base currency at the prevailing daily exchange rate.
That structure is important for anyone holding or planning transfers: the ability to receive USDT stops roughly a month before the complete delisting, and conversion happens automatically if the asset is still on-platform. In other words, even users who do nothing between the end of deposits and the end of August should expect their USDT exposure to be removed from Revolut.
Regulatory pressure in Europe, without a clear jurisdiction answer
The notice, seen by Cointelegraph, frames the USDT delisting as the result of “regulatory and risk considerations.” However, Revolut did not clarify whether its delisting applies globally or only to particular jurisdictions.
For users, that ambiguity matters. Many regulated crypto service providers in Europe have adjusted product offerings in response to the EU’s Markets in Crypto-Assets (MiCA) regime, but the scope of those adjustments can differ by region. Cointelegraph said it reached out to Revolut to ask which jurisdictions are affected and for clarification on the scope of its crypto offering, but did not receive a response by publication.
Revolut’s own regulatory status appears to be intertwined with the European framework. Cointelegraph reported that Revolut was granted a MiCA license as a crypto asset service provider (CASP) in November 2025, citing the ESMA register. The license was reportedly issued by the Cyprus Securities and Exchange Commission (CySEC), according to ESMA’s published information.
Why MiCA-era stablecoin compliance keeps reshaping access
The Revolut decision echoes a broader European trend. Cointelegraph noted that other exchanges, including Coinbase, began delisting USDT in Europe in 2024 to align with MiCA requirements. The underlying issue is that MiCA imposes rules on crypto asset service providers and expects stablecoin issuers that serve those markets to meet particular compliance expectations.
In this case, Cointelegraph also referenced reporting that Tether has refused to comply with MiCA. As Cointelegraph described, USDT has been gradually delisted by CASPs in Europe since late 2024, with the issuer’s stance contributing to the access reductions.
Tether’s leadership has criticized MiCA in public. Cointelegraph reported that CEO Paolo Ardoino has repeatedly argued that aspects of the framework are flawed, including reserve-related requirements applicable to certain stablecoin issuers—requirements that involve holding a portion of reserves with EU credit institutions. Cointelegraph also noted Ardoino’s remarks in a May 2025 interview criticizing the legislation as “very not well thought.”
The tension is straightforward: stablecoins may be widely used by traders and payment-oriented users, but the ability of regulated intermediaries—exchanges, platforms, and banks—to offer those tokens can depend on how the stablecoin issuer interacts with the relevant rule set.
Stablecoin scale remains large even as on-ramps shrink
Even as access is tightened by certain regulated providers, USDT remains a major part of the crypto ecosystem. Cointelegraph stated that USDT is the third-largest crypto asset by market capitalization after Bitcoin and Ether, citing a market value of $184 billion at the time of publication. It also referenced CoinGecko data for broader ranking context, stating Circle’s USDC has a market cap of about $73 billion and is positioned as the fifth-largest crypto asset according to CoinGecko.
For investors and active users, the key question is less whether USDT exists in the market and more how easily it can move through mainstream channels. When banks and fintech platforms reduce purchase options, stop deposits, or delist stablecoins entirely, users may be pushed toward alternative routes such as on-exchange trading, self-custody, or different regulated products—each with different costs, user experience, and risk profiles.
In that environment, Revolut’s move is likely to be viewed as another step in the “stablecoin access” tightening cycle in Europe: even where a platform holds a relevant MiCA authorization, its product lineup can still shift if it determines the compliance and risk picture for a specific issuer is not acceptable under its operating requirements.
Users affected by Revolut’s notice should watch the cut-off dates closely—particularly July 30 for incoming deposits and Aug. 31 for automatic conversion. What remains uncertain is the exact geographic scope of Revolut’s action, and whether further stablecoin adjustments will follow as Europe continues to implement and enforce MiCA requirements.
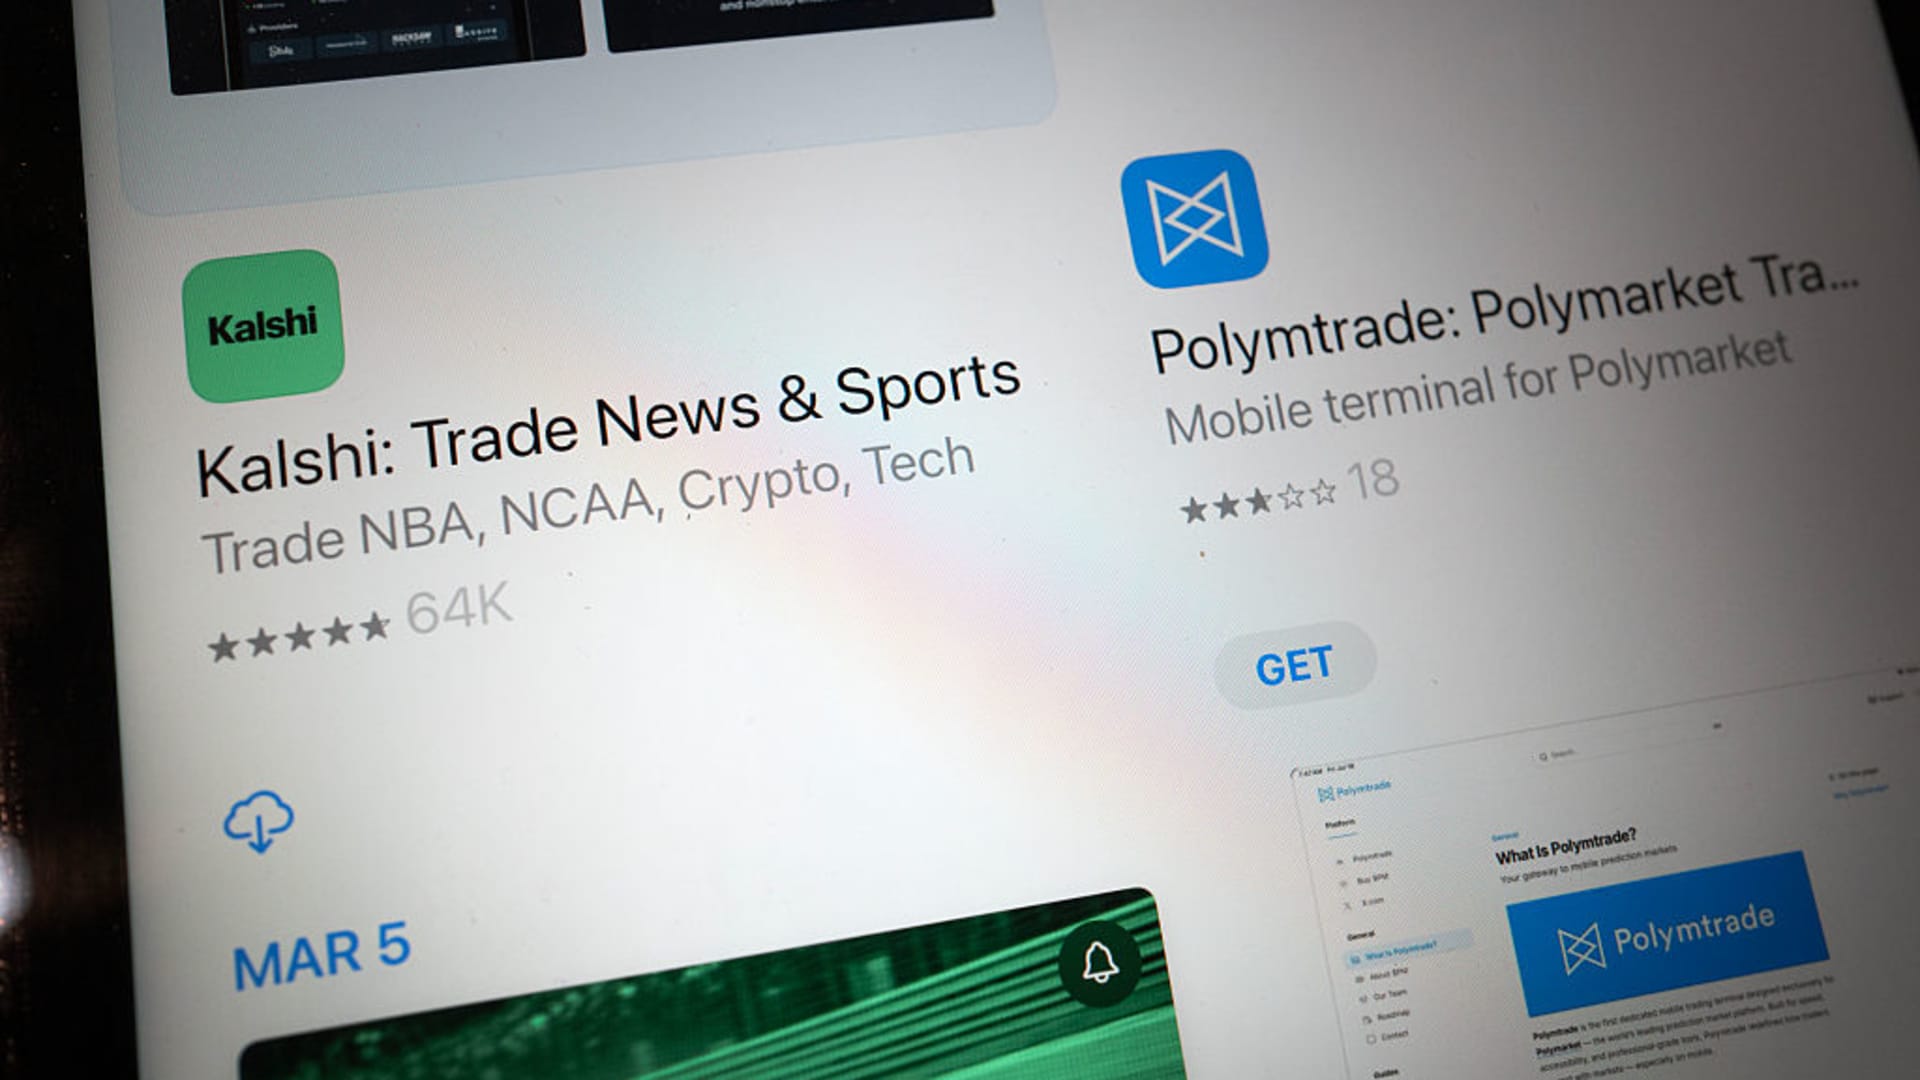
In this photo illustration, Apps for online prediction market sites are shown on an electronic device on Feb. 25, 2026 in Chicago, Illinois.
Scott Olson | Getty Images
The 2026 FIFA World Cup was forecast to be the biggest gambling event in history. For prediction market platforms, that’s led to soaring trading volumes in June.
Kalshi saw more than $31 billion in notional volume during the month, a more than 70% increase from May’s total of $17.9 billion, according to user collected data on Dune Analytics. The platform has consistently managed volume over $1 billion daily since the soccer tournament began on June 11.
Polymarket’s international event contract exchange set a new record high in monthly volume, with notional trading exceeding $10.8 billion in June. That reverses a downtrend in April and May, when volume fell.
Meanwhile, Polymarket’s U.S. platform did north of $3.5 billion in notional volume during the month, up from $1.77 billion in May.
Team USA Monday
Team USA is set to play Belgium in the round of 16 on Monday night. More than $64 million on Kalshi and $122 million on Polymarket has been traded on whether the U.S. will win the tournament, though odds of that happening are just 4.3% and 3%, respectively, on each platform.
World Cup enthusiasm has given a jolt to prediction market platform Rothera, a joint venture between Susquehanna International Group and Robinhood. Rothera debuted in June, when Robinhood began routing certain World Cup contracts on its brokerage to the platform.
Rothera saw $2 billion in notional trading volume during the month, and now accounts for 7% of U.S. prediction market volume, according to Bank of America.
All platforms leaned into the World Cup to boost traffic. Polymarket launched a competition to reward up to $2 million to whoever can craft a perfect World Cup knockout round bracket. On the Apple app store, Kalshi boasted that users can “Trade the World Cup” in the title of its mobile platform.
Heightened open interest — the total number of active, unsettled contracts on the platforms — may also reflect World Cup excitement. Kalshi open interest is now above $1 billion. Polymarket open interest is just under $400 million — elevated, but about where its international platform has been for the last few months.
Sports were the focus last month for event contract exchanges, but how the platforms handled the surge in volume may be a sign of how they manage other contract topics in the future.
Asaf Meir, CEO at Solidus Labs — a market integrity company that has a partnership with Kalshi — said the World Cup is a key moment for platforms as both regulators and institutions are eying how they perform.
Outside observers are asking, “Is it safe enough? Is it mature enough? Does it have enough volume?,” Meir said. “The World Cup is such a huge pressure test to see whether indeed prediction markets are able to deliver their word on maintaining a level playing field for all investors for a long period of time in a sustained high-volume environment.”
Disclosure: CNBC and Kalshi have a commercial relationship that includes customer acquisition and a minority investment.

Key Takeaways
- HSBC upgraded Intel’s price target from $100 to $200 — the highest on Wall Street — maintaining a Buy rating
- Analyst Frank Lee boosted 2026 server CPU shipment projections to 25% YoY growth and 2027 to 30%
- Intel’s EMIB packaging tech could deliver significant advantages as TSMC faces capacity constraints until late 2027
- Apple and Terafab confirmed as foundry partners; negotiations underway with Google and NVIDIA
- INTC shares opened Friday at $120.35; trading range over past year spans $18.97 to $142.35
Intel (INTC) received a significant endorsement this week when HSBC analyst Frank Lee established a new Wall Street high price target of $200 for the semiconductor giant, effectively doubling the firm’s prior $100 target while maintaining its Buy recommendation.
Shares of INTC began Friday’s trading session at $120.35. The chipmaker’s stock has fluctuated between a 52-week low of $18.97 and a high of $142.35, with the 50-day moving average currently positioned at $115.64.
According to HSBC’s Lee, Intel stands “well positioned to deliver upside” to its 2026 and 2027 server CPU shipment forecasts, primarily fueled by strategic internal foundry capacity realignment.
The analyst revised his 2026 server CPU shipment growth projection upward from 20% to 25% on a year-over-year basis. This adjustment places his DCAI revenue forecast at $24.1 billion, representing approximately 4% above the current Wall Street consensus.
Lee’s optimism extends even further into 2027, where he elevated his shipment growth projection from 20% to 30% year-over-year, contending that market analysts continue to undervalue Intel’s expansion trajectory for that timeframe.
Foundry Business Gains Traction
Lee emphasized that Intel’s foundry story is showing meaningful improvement. The company’s EMIB — Advanced Embedded Multi-die Interconnect Bridge — technology represents a potential catalyst for “material upside” within the foundry division.
Given that TSMC’s expanded 3nm production capacity won’t be available until the latter half of 2027, Lee observes that customers are actively seeking alternative foundry solutions. Intel is positioning itself as a leading contender.
Apple and Terafab have already committed as Intel foundry clients. Active discussions are underway with Google and NVIDIA. Lee highlighted that Intel’s EMIB technology can accommodate up to 12x reticle size, substantially exceeding CoWoS-S which maxes out at 3.3x — positioning it as a compelling alternative while TSMC CoWoS capacity remains constrained.
Institutional Ownership Remains Robust
Institutional investors currently control 64.53% of INTC shares. QRG Capital Management increased its stake by 29.2% during Q1, concluding the quarter with 485,549 Intel shares worth approximately $21.4 million.
Norges Bank established a fresh position valued at more than $2.2 billion in Q4. Vanguard maintains ownership of over 404 million Intel shares worth nearly $14.9 billion. Capital Research Global Investors expanded its holdings by 285.9% during Q4.
Intel’s Q1 2026 financial results significantly exceeded Wall Street projections — delivering $0.29 earnings per share versus the consensus forecast of $0.01. Revenue reached $13.58 billion, surpassing the $12.32 billion estimate and representing 7.4% year-over-year growth.
Jim Cramer recently identified Intel as his top stock pick, highlighting CEO Lip-Bu Tan’s transformation strategy and identifying three key growth drivers for the corporation.
The current consensus analyst rating for INTC stands at “Hold” with an average price target of $96.69 — significantly below the stock’s current trading level. The rating breakdown includes two Strong Buy recommendations, 15 Buy ratings, 28 Hold ratings, and four Sell ratings.
Intel has issued Q2 2026 EPS guidance of $0.20, while the full-year analyst consensus projects $0.63 EPS.
Crypto World
Himax Technologies (HIMX) Stock: Could Apple and Nvidia Be Secret Partners Behind AI Glasses Push?

Key Takeaways
- Himax Technologies currently trades at $13.16, approximately 45% under the analyst consensus price target of $23.70
- Shares plummeted more than 45% over the last month following a nearly 66% surge in the preceding 90-day period
- Company forecasts “substantial” revenue expansion from AI and augmented reality glasses in coming years
- A major brand partner has integrated Himax’s WiseEye technology into smart glasses, with volume manufacturing slated for late 2026
- Industry research points to Apple and Nvidia as potential unnamed anchor clients
Himax Technologies ($HIMX) currently sits at $13.16 per share, representing a decline exceeding 45% throughout the previous month. This retreat follows an impressive rally that pushed shares up nearly 66% during the prior three-month window.
Himax Technologies, Inc., HIMX
The recent selloff hasn’t deterred Wall Street analysts, whose consensus fair value estimate stands at $23.70 — implying roughly 45% upside from current levels. However, a contrasting discounted cash flow analysis from Simply Wall St suggests intrinsic value could be as low as $2.32 per share.
This dramatic valuation discrepancy keeps the investment debate very much in play.
Bullish investors focus primarily on one catalyst: AI-powered smart glasses. Himax produces ultra-low-power artificial intelligence chips and micro display technology — specialized components that remain difficult to source and essential for battery-efficient smart eyewear functionality.
During the company’s Q1 2025 earnings discussion, CEO Jordan Wu revealed that “a leading brand has adopted our WiseEye for its smart glasses,” noting that high-volume production should commence later this year. Wu added that additional major brands are anticipated to join the ecosystem.
Research analysis from Hunterbrook Media and Citrini Research, examining patent filings, supply chain patterns, and capital allocation trends, indicates these undisclosed partners may include Apple and Nvidia. Neither technology giant has publicly acknowledged such arrangements.
Current Financial Performance
Revenue has contracted on a year-over-year basis for multiple consecutive quarters, while net profit margins hover around 4%. These metrics don’t paint the picture of a traditional growth story.
Yet management has provided guidance calling for 10% to 13% sequential revenue expansion in Q2, which would simultaneously represent a return to positive year-over-year comparisons. The company also anticipates improved gross margin performance, potentially flowing through to enhanced bottom-line profitability.
Himax recently introduced its HE Series indirect Time-of-Flight depth decoder integrated circuits — a novel 3D sensing solution that OFILM has already incorporated into robotics applications.
The firm’s co-package optics (CPO) development represents another strategic initiative, focused on enabling ultra-fast data transmission for AI-driven data centers and advanced computing environments.
Industry Competition and Positioning
Meta Platforms currently dominates the commercial smart glasses market. The social media giant unveiled a fresh product range in June with entry-level pricing at $224. Meanwhile, Apple, Alphabet, and Amazon are each developing proprietary versions incorporating augmented reality capabilities.
The investment case for Himax rests on its position as a cross-platform component provider, supplying multiple competitors rather than depending on a single platform winner.
The company’s market capitalization currently registers at $2.3 billion. Its 52-week trading range spans from $6.85 to $25.09, underscoring significant price volatility.
Himax confronts genuine operational risks. Geopolitical trade friction, tariff implementation, and inconsistent customer ordering patterns could pressure profit margins and earnings projections. The substantial gap between cash flow-based valuations and earnings-based models creates analytical uncertainty — both frameworks cannot simultaneously prove accurate.
According to its latest quarterly disclosure, Himax anticipates revenues from AI and AR glasses applications will expand substantially throughout the coming years, with mass manufacturing from at least one significant brand partner launching in late 2026.

7-14% Yields: My Top High-Yielding Fund Picks For H2 2026

Bollinger Bands’ creator suggests Bitcoin may be ending its bear trend

Lewis Hamilton denied by Kimi Antonelli in British GP sprint race


-

 Tech7 days ago
Bluekit phishing kit adopts browser-in-the-middle for login theft
-

 Fashion20 hours ago
Weekend Open Thread: High Hopes
-

 Tech6 days ago
Claude Code turned every engineer into three. Now companies need more product thinkers
-

 Crypto World4 days ago
Strategy authorizes up to $1.25B in Bitcoin sales under new capital plan
-

 Politics1 day ago
The House | “Reframing the debate from a binary discussion of winners and losers”: Yuan Yang reviews ‘We Are Not Machines’
-

 News Videos6 days ago
MAJOR BITCOIN & MARKET UPDATE!!!! (MUST WATCH ASAP!!!)
-

 Tech5 days ago
Anonymous researcher drops 0-day ‘exploitarium’ repo
-

 Crypto World7 days ago
Coinbase, Circle Deepen Crypto Stock Losses Despite Resilient S&P 500
-

 Business4 days ago
Australia treasurer says alleged access of prime minister’s bank data ’incredibly concerning’
-
 Business5 days ago
The AI boom won’t burst all at once. It will pop in ‘rolling bubbles’: Macquarie
-

 Sports3 days ago
Broncos roster: OL Ben Powers (No. 74) entering final year of contract
-

 NewsBeat4 days ago
Presenter Caroline Flack’s brother Paul Flack dies aged 55
-

 Crypto World2 days ago
Binance stock trading tops $1B in first month after launch
-

 Tech7 days ago
Silicon Valley paid to kill AI regulation, now it wants the rules back
-

 News Videos4 days ago
How to Build INSANE Live Financial Dashboards With Claude
-

 Crypto World2 days ago
Alibaba-affiliate Ant Group enters the humanoid robot market with 12 deals
-
 NewsBeat2 days ago
New exhibition reflects five decades of movement between island of Ireland and GB
-

 Business3 days ago
Meta Platforms Stock Jumps 7% Today as Bloomberg Reports Company Plans to Enter the Cloud Business
-

 Business1 day ago
What a 10 Percent Drop Means for Buyers, Sellers and Renters
-

 Crypto World2 days ago
Binance Re-Enters Philippines As EU MiCA Rules Restrict Access
You must be logged in to post a comment Login