

Business
US Democrat Ro Khanna detained by Israeli settlers during West Bank visit



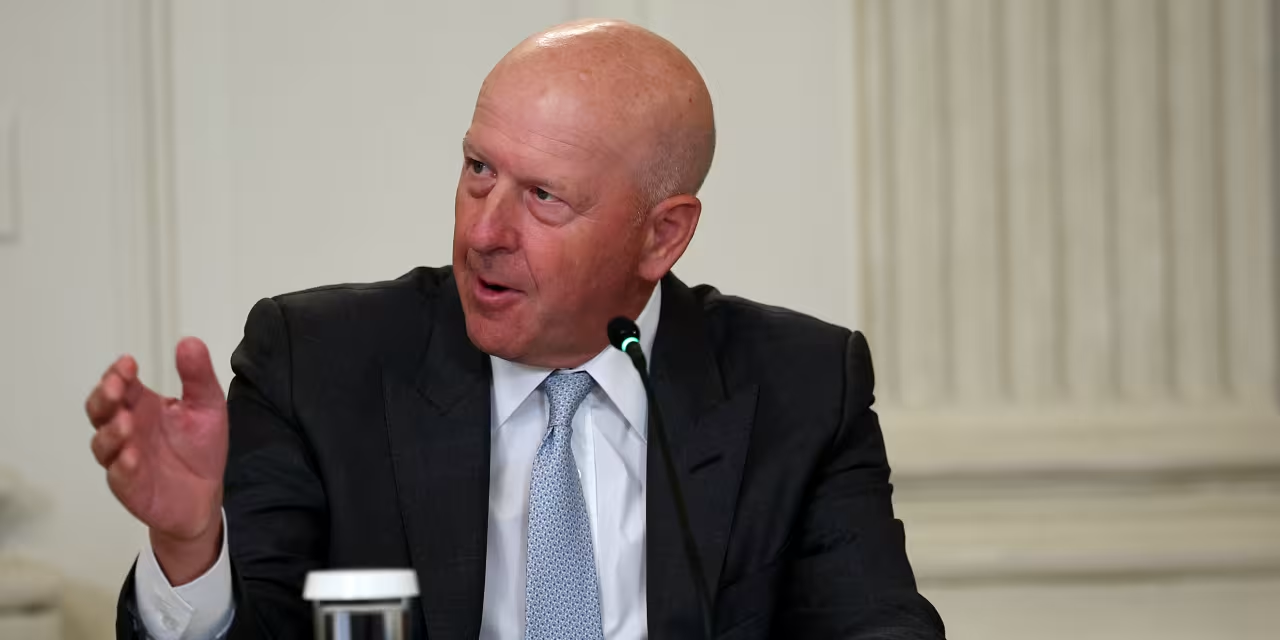
Wall Street Raises Expectations for Goldman, Other Banks After Strong Earnings

Chevron: Solid Energy Demand Ahead


Thematic. Top down. I often find the theme before I find the stock. My philosophy is that themes are often born quiet and die loud. I try to catch them while they’re still finding their voice. When the music plays, I mainly chase pockets that rhyme with growth, momentum, perception shifts, and sometimes even the most absurd narratives (mostly AI-related). When the music slows and the tape deteriorates, I don’t wait around. I raise cash/rotate out, and watch for the next setup. A parabolic run may trigger a similar move. During a bull run, you won’t find much common ground between the deep value crowd and me. I liked the core ideas of deep value investors, and I briefly followed that philosophy. However, it demands patience, and the AI supercycle broke whatever patience I had left. The market changed, and so did I. My style is not set in stone. I’m mostly long when the music is playing. When it stops/slows down, I may dabble with shorts via put options, although it’s not my forte. My style is highly speculative. I have a high risk tolerance that most rational investors would find alarming. I don’t have a favorite timeframe. That said, I trade mostly the mid-term and the short-term. I have a pathetic low six-digit portfolio, and I consider myself part of the mid to low end of the K-shaped economy. It sometimes drops to the five-digit range when life has other plans. I’ve been in the game since mid 2024, although my first dabbles with stocks (i.e., burning $100 trading accounts in a matter of days) go back to the early/mid 2010s. I have a B.Sc. in aeronautical engineering and experience as a consultant in the aerospace sector. The latter statement is not relevant to my investment style, but I thought to add it for self-indulgent purposes. I live on the wrong side of the Atlantic. The opening bell is my lunch bell. I like astrology, so I’m a follower of technical analysis (mainly trends and support/resistance/psychological levels). I also look at the fundamentals of individual names, although the theme and the macro often prevail in my decision-making. I dislike empty suits, high-level BS, deep-level BS (especially), unnecessary jargon, and self-indulgent, third-person written introductions with an air of superiority.
Analyst’s Disclosure: I/we have no stock, option or similar derivative position in any of the companies mentioned, and no plans to initiate any such positions within the next 72 hours. I wrote this article myself, and it expresses my own opinions. I am not receiving compensation for it (other than from Seeking Alpha). I have no business relationship with any company whose stock is mentioned in this article.
I may initiate a long position in any of the securities named in this piece within the next 72 hours.
I am not a registered investment adviser, broker, dealer, or tax professional. This article, including any comments or replies I post, reflects my personal opinions only and is provided for informational and educational purposes. Nothing I write is investment, legal, tax, or financial advice, or a personalized recommendation to buy, sell, hold, or short any security. My views may change without notice. Nothing I write is tailored to any reader’s objectives, financial situation, risk tolerance, or portfolio. Investing involves risk, including possible loss of principal. Readers should conduct their own research and consult a qualified professional before making investment decisions.
Seeking Alpha’s Disclosure: Past performance is no guarantee of future results. No recommendation or advice is being given as to whether any investment is suitable for a particular investor. Any views or opinions expressed above may not reflect those of Seeking Alpha as a whole. Seeking Alpha is not a licensed securities dealer, broker or US investment adviser or investment bank. Our analysts are third party authors that include both professional investors and individual investors who may not be licensed or certified by any institute or regulatory body.
Business
X (Twitter) Down? Users Report Widespread Outage Early Saturday Morning as Downdetector Complaints Surge
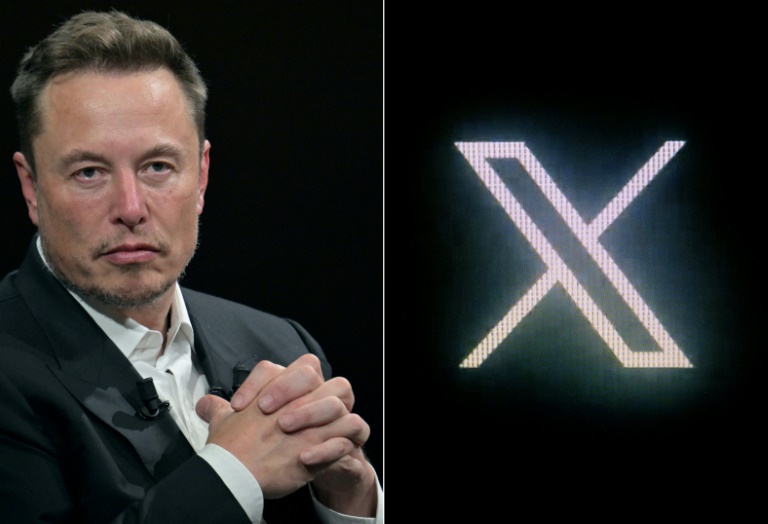
Users of the social media platform X, formerly known as Twitter, began reporting widespread access problems early Saturday morning, according to outage-tracking service Downdetector, which recorded a sharp spike in user complaints beginning at 3:46 a.m. Eastern time.
Downdetector, which aggregates real-time reports from users to identify potential service disruptions across websites and apps, flagged the surge in its social media post, prompting the hashtag #XTwitterDown to begin trending on the platform as affected users shared their experiences. As of Saturday morning, X had not issued a public statement addressing the reported outage, and the platform’s official developer API status page had not shown any confirmed incident, a pattern that has occurred during several of the platform’s previous disruptions this year.
Saturday’s reported outage adds to what has become a recurring pattern of service disruptions for X throughout 2026. The platform has experienced at least one notable outage roughly every month this year, according to tracking by multiple outlets, with incidents ranging from brief, localized disruptions lasting under an hour to more severe events affecting tens of thousands of users across multiple countries.
One of the year’s most significant disruptions occurred in February, when users across the United States, United Kingdom and India reported widespread access issues beginning early Monday morning. Downdetector recorded more than 40,000 user reports of problems with the platform as the outage unfolded, with the number continuing to climb throughout the morning. That February incident came not long after X owner Elon Musk announced plans to make the platform’s recommendation algorithm, including the code determining which organic and advertising posts are shown to users, fully open source, with updates to be released every four weeks alongside developer notes explaining any changes.
X has also experienced more severe, longer-lasting outages tied to issues beyond its own infrastructure. In November 2025, the platform suffered what was described as its most significant outage of that stretch, when Cloudflare, a major cloud and network services provider used by X and numerous other websites, experienced its own outage that left multiple platforms without service for several hours. Cloudflare said at the time that it did not immediately know the direct cause of the disruption affecting its network.
Other outages this year have varied in scope and duration. One incident saw reports spike suddenly around 1:45 p.m. Pacific time, surpassing 4,000 reports within the first 20 minutes, with the disruption lasting just over an hour and primarily affecting the platform’s browser-based version rather than its mobile app. During that particular incident, X’s official developer API status page never reflected any issues, remaining green throughout the disruption despite the surge in user-reported problems, a discrepancy that has become a recurring feature of how the platform’s outages are tracked and confirmed.
A separate January outage struck significant numbers of users shortly after Musk’s algorithm transparency announcement, though it remains unclear whether the two events were directly connected. In each case, the platform’s outages have tended to follow a similar pattern: a sudden spike in Downdetector reports, often numbering in the thousands within a short window, followed by a gradual decline in complaints as service is restored, typically without an official public explanation from X regarding the underlying cause.
X’s ownership structure adds another layer of scrutiny to its recurring reliability issues. Musk acquired the platform, then known as Twitter, for $44 billion in 2022, later rebranding it to X in July 2023. The service reports having up to 650 million monthly active users globally, with more than 132 million users accessing the platform daily, figures that underscore the scale of disruption even relatively brief outages can cause when they affect a meaningful share of that user base.
Common symptoms reported during X’s past outages have included persistent “Something went wrong” error messages, timelines that fail to refresh or remain stuck displaying older posts, and inconsistent access between the platform’s desktop website and its mobile applications, with one often continuing to function while the other fails entirely. Users experiencing access problems are typically advised to check both the official X Support account and third-party monitoring tools, since the platform’s own status indicators have not always reflected ongoing incidents in real time during past disruptions.
As of Saturday morning, it remained unclear how many users were affected by the reported outage, which specific features or platforms were experiencing the most significant disruption, or how long the issue might persist before service is fully restored. Given the pattern established by X’s previous outages this year, affected users may see intermittent functionality return gradually throughout the morning, though the platform’s history suggests the precise cause of Saturday’s disruption may not be publicly disclosed even after service is restored.
Users seeking updates on the status of Saturday’s reported outage were directed to monitor Downdetector’s live reporting page, along with X’s own official accounts, for further information as the situation develops. Given the frequency of similar incidents throughout 2026, technology analysts have continued to raise questions about the platform’s underlying infrastructure reliability, even as X has maintained that the vast majority of its service remains operational on a day-to-day basis despite the recurring disruptions.
Business
(VIDEO) BTS Breaks Spotify Record With ‘NORMAL’ Music Video, Most-Streamed K-Pop Video in a Single Day

BTS set a new streaming milestone this week after releasing the music video for their song “NORMAL” exclusively on Spotify, with the platform confirming Friday that the video became the most-streamed K-pop music video in a single day in Spotify’s history.
The video, released Friday at 1 p.m. Korea Standard Time, marks the latest visual from the group’s fifth studio album, “ARIRANG,” which itself became the most-streamed K-pop album in Spotify history on March 20. Spotify announced the new record on its Instagram and X accounts shortly after the video’s release, according to reporting from The Music Universe.
“NORMAL” offers what Spotify described as a deeply personal look at the seven-member group, moving between scenes captured during a late-night celebration and the quieter moments of the following morning. The video follows each member through that arc, portraying what daily life looks like for BTS when they step away from the stage and the spotlight that typically surrounds them. According to Big Hit Music, the group’s label, the setting was a deliberate creative choice intended to offer fans an unfiltered look at the band’s everyday, private side in contrast with their more polished on-stage personas.
One of the video’s most talked-about moments recreates a viral promotional image the group had teased in the lead-up to the release, showing all seven members standing in a row in front of a set of urinals with their backs to the camera. That image originated from a midnight teaser clip posted to HYBE Labels’ YouTube channel the night before the video’s release, which showed the members in the restroom setting before BTS leader RM squeezed past the group in an unguarded, comedic moment. The teaser also resolved a mystery that had been circulating online for days, tied to a series of attention-grabbing advertisements that ran earlier in July in print newspapers including the San Francisco Chronicle and the New York Post. Those ads featured the urinal-themed photo beneath a tabloid-style headline reading, “BTS Members Seen in Bathroom Amid Mysterious Gathering,” part of a broader promotional campaign that the music video ultimately brought full circle.
Alongside the video, BTS released three additional versions of “NORMAL,” including a Korean-language rendition that had first been revealed during the group’s concert in Busan, as well as an instrumental version. A physical single CD is also being made available through the Weverse platform. “NORMAL” serves as the second single from “ARIRANG,” following the album’s lead single, “SWIM,” and originally debuted at No. 41 on the Billboard Hot 100 chart dated April 4, drawing praise for its understated vocal delivery and conversational sing-rapping style.
“ARIRANG” itself has continued performing strongly on the Billboard charts in the months since its March release. The album spent three consecutive weeks atop the Billboard 200, the top albums chart in the United States, and remained at No. 25 on the chart dated July 18. “SWIM” has extended its own run on the Hot 100, sitting at No. 84 in its 16th consecutive week on that chart as of the same date.
The “NORMAL” video’s Spotify-first release continues a broader partnership between BTS and the streaming platform that began earlier this year to mark the group’s return following an extended hiatus. As part of that collaboration, Spotify hosted a series of immersive live events bringing fans, known collectively as ARMY, together in cities around the world. Among those events, BTS performed at Pier 17 in New York City in March, marking the group’s first U.S. performance in four years. Spotify also introduced in-app features tied to the album’s release, including an interactive experience called Decoding ARIRANG and a dedicated BTS Music Quiz, giving fans new ways to engage with the group’s music directly within the app.
The video’s exclusive debut on Spotify, rather than a traditional platform such as YouTube, reflects a broader strategy tied to the group’s digital footprint on the streaming service, where BTS draws roughly 35.5 million monthly listeners. The video is currently available only in select beta markets for Spotify Premium subscribers, part of the platform’s ongoing rollout of music videos as a feature alongside exclusive content such as live performances and cover recordings. Spotify noted that the “NORMAL” release followed closely behind another artist’s video exclusive on the platform, with country singer Jelly Roll launching the video for his song “Hands Up” exclusively on Spotify for 48 hours just days earlier.
The “NORMAL” video itself is set to remain a Spotify exclusive for 48 hours before becoming available on other streaming and video platforms, following the same release pattern used for the platform’s other recent artist exclusives.
BTS’s commercial dominance extends well beyond this latest record. According to Spotify, the group’s tracks appear on more than 130 million user-generated playlists on the platform, and BTS has had six songs inducted into Spotify’s Billions Club, a designation reserved for tracks that surpass one billion streams. Those songs include “Dynamite,” “My Universe,” “Butter,” “Boy With Luv” featuring Halsey, “FAKE LOVE” and “Life Goes On.” Listenership for the group spans a wide global footprint, with the United States, Japan and Peru currently ranking among the top countries streaming BTS’s music.
The group’s promotional push around “NORMAL” arrives during an active stretch on the touring front as well. BTS is currently wrapping up the European leg of its Arirang World Tour, with concerts scheduled at Paris’s Stade de France. The group is also set to make a high-profile appearance this weekend, joining Justin Bieber, Madonna and Shakira as co-headliners of the halftime show for the FIFA World Cup final, scheduled for Sunday, July 19, at MetLife Stadium in East Rutherford, New Jersey, adding another major milestone to what has already been an eventful comeback year for the group following their extended hiatus.


My name is Maxell Agustin Aguiran. I have a background in finance and have been interested in financial markets since I began following and trading stocks at the age of 15. Over time, this interest developed into a broader focus on investment research, quantitative analysis, data analysis, and financial modeling.My investment approach is primarily data-driven. I combine traditional fundamental analysis with quantitative evidence, historical data, and independent judgment. When evaluating a company, I consider factors such as earnings, valuation multiples, revenue growth, cash flow, financial strength, competitive position, and market expectations. I also use analytical methods to test investment ideas and identify patterns that may not be immediately visible through conventional research alone.My main areas of interest include equities, quantitative investing, predictive analytics, machine learning, and systematic trading. I develop models designed to analyze financial instruments such as stocks, commodities, futures, and foreign exchange markets. I am particularly interested in using historical data to identify relationships, recurring patterns, and potential predictive signals.I write independent investment research because I enjoy transforming complex financial information into clear and understandable investment theses. My goal is to produce analysis that combines fundamental valuation, quantitative evidence, and independent thinking. I am especially interested in undervalued companies, potential value traps, overlooked opportunities, and situations where data may challenge the prevailing market view.
Analyst’s Disclosure: I/we have no stock, option or similar derivative position in any of the companies mentioned, and no plans to initiate any such positions within the next 72 hours. I wrote this article myself, and it expresses my own opinions. I am not receiving compensation for it (other than from Seeking Alpha). I have no business relationship with any company whose stock is mentioned in this article.
Seeking Alpha’s Disclosure: Past performance is no guarantee of future results. No recommendation or advice is being given as to whether any investment is suitable for a particular investor. Any views or opinions expressed above may not reflect those of Seeking Alpha as a whole. Seeking Alpha is not a licensed securities dealer, broker or US investment adviser or investment bank. Our analysts are third party authors that include both professional investors and individual investors who may not be licensed or certified by any institute or regulatory body.


I spent 30 years in the institutional trenches as a trader, analyst, and portfolio manager, eventually running the equity trading desk at Northern Trust in Chicago. Those decades shaped my approach: stay disciplined, trust the data, and keep emotion out of the way. Since 2009, when I began publishing my stock selections, my portfolio has delivered solid long term results—compounding in the mid teens annually through 2025. Today I’m a private investor and investing coach, with a rules based framework that helps people build better portfolios. My work focuses on systematic thinking, behavioral awareness, and evidence over opinion. For my market outlook and model portfolio updates, visit zeninvestor.org. .
Analyst’s Disclosure: I/we have a beneficial long position in the shares of NVDA, AVGO, GOOGL either through stock ownership, options, or other derivatives. I wrote this article myself, and it expresses my own opinions. I am not receiving compensation for it (other than from Seeking Alpha). I have no business relationship with any company whose stock is mentioned in this article.
Seeking Alpha’s Disclosure: Past performance is no guarantee of future results. No recommendation or advice is being given as to whether any investment is suitable for a particular investor. Any views or opinions expressed above may not reflect those of Seeking Alpha as a whole. Seeking Alpha is not a licensed securities dealer, broker or US investment adviser or investment bank. Our analysts are third party authors that include both professional investors and individual investors who may not be licensed or certified by any institute or regulatory body.

New air quality data released this year shows a wide gulf between the cleanest and most polluted states in the country, with sparsely populated Western and Pacific states such as Wyoming and Hawaii consistently ranking among the healthiest for air quality, while densely populated, industrial states including California, Pennsylvania and Ohio continue to post some of the worst readings in the nation.
Two separate analyses released in early 2026, using slightly different methodologies, arrived at broadly similar conclusions about which states offer the cleanest air. An analysis published in March, based on fine particulate pollution, or PM2.5, levels averaged from 2022 through 2024, found that the U.S. average stood at 8.8 micrograms per cubic meter, well above the World Health Organization’s air quality guideline of 5 micrograms per cubic meter, meaning the average American is breathing air that falls short of internationally recognized health standards.
According to that analysis, Wyoming posted the cleanest air in the country, a result researchers attributed largely to the state’s vast, sparsely populated landscape and minimal industrial development. Wyoming’s city of Casper recorded the lowest year-round particle pollution of any metro area tracked in the report, while the state capital, Cheyenne, ranked eighth overall among individual cities nationwide. Hawaii ranked second among states for particle pollution, posting a reading of 4.7 micrograms per cubic meter, a result researchers linked to the state’s low population density combined with strong prevailing winds and consistent rainfall that help disperse pollutants before they can accumulate.
At the opposite end of that same ranking, California posted the worst air quality of any state, with a reading of 11.7 micrograms per cubic meter, more than double the WHO’s recommended guideline. Researchers pointed to a combination of factors driving California’s poor performance, including high population density, a significant concentration of industrial facilities, heavy vehicle emissions, and a climate pattern that helps fuel frequent and severe wildfires across the state. Pennsylvania, Michigan, Illinois and Ohio rounded out the bottom five states in that same analysis. New York, despite its dense population and substantial industrial activity, posted a comparatively better reading of 7.8 micrograms per cubic meter, below the national average, a result researchers attributed to stricter state-level emission standards and geographic factors that help disperse pollution more effectively than some other major urban centers.
A separate ranking, compiled using a different methodology based on the U.S. News Best States framework, produced a notably different picture at the bottom of the list, though it largely agreed on the cleanest states at the top. That analysis found Hawaii posting the best average air quality index in the country, at 21.2, comfortably within the “good” range on the standard AQI scale. Honolulu was cited as one of just six U.S. cities to rank on all three of the American Lung Association’s cleanest-cities lists, covering ozone pollution, year-round particle pollution and short-term particle pollution. Alaska ranked second-best under this methodology, with an index of 29.1, despite localized particle pollution problems in areas like Anchorage and the Matanuska-Susitna Borough tied to wood-burning home heating systems, both of which have reportedly seen air quality improvements in recent years. Washington state ranked third-best, with an index of 33.5, though the analysis noted that some residents in the state still experience unhealthy air linked to emissions from power plants.
Under this second ranking system, Utah posted the worst average air quality index in the country, at 51.2, placing it in the “moderate” category on the AQI scale rather than “good.” Researchers attributed much of Utah’s poor performance to its mountainous topography, which tends to trap pollution near the surface rather than allowing it to disperse, a phenomenon sometimes referred to as a temperature inversion. The report noted that Utah has taken active steps in recent years to address the issue, including expanding solar energy use and enacting roughly 30 new regulatory rules aimed at reducing emissions from various pollution sources. Ohio and Georgia tied for the second-worst air quality under this ranking, each posting an index of 48.2, with Ohio’s reading sitting just barely within the “good” range despite the tie.
At the city level, separate rankings drawing on real-time EPA AirNow monitoring data have continued to highlight California’s Central Valley as home to some of the most consistently polluted urban areas in the country. Bakersfield has repeatedly ranked as the most polluted city in the United States in 2026 tracking, a result researchers tied to the city’s geography within the southern San Joaquin Valley, where surrounding mountains on three sides trap agricultural dust, oil refining emissions and vehicle exhaust close to the ground. Fresno, located roughly 110 miles north of Bakersfield within the same valley, faces nearly identical geographic and pollution challenges, with winter temperature inversions frequently trapping wood smoke and vehicle exhaust and pushing air quality readings above 150 on the standard index, a level considered unhealthy for the general public.
Notably, one analysis pointed out that California’s poor air quality rankings are not primarily a reflection of weak environmental regulation. The report specifically noted that California maintains the strictest air quality laws in the nation, but that the state’s unique combination of Central Valley geography, massive population size, extensive agricultural activity and wildfire exposure continues to overwhelm those regulatory efforts in terms of measurable pollution outcomes.
Beyond the state and city-level rankings, researchers have continued to emphasize the tangible health implications tied to these disparities. According to analysis comparing the cleanest and most polluted metro areas in the country, residents of the worst-ranking cities breathe air with PM2.5 concentrations three to five times higher than those living in the cleanest cities, a gap researchers say translates into measurable differences in respiratory disease rates, cardiovascular health outcomes and even overall life expectancy between regions.
With wildfire smoke, industrial emissions and regional geography continuing to shape which states and cities post the best and worst air quality readings each year, researchers say the underlying rankings are likely to remain relatively consistent from year to year, even as individual pollution events, such as this summer’s wildfire smoke drifting south from Canada, continue to produce short-term spikes in unhealthy air quality readings across parts of the country that otherwise post comparatively clean averages.

CFM International wins approval for jet engine durability boost
Two US service members in Jordan killed in Iranian attack, US says

The Salary Required To Buy A Home (Money Guy vs Ramsey)

Argentina vs England LIVE: Rugby score and latest updates from Nations Championship
Wall Street Raises Expectations for Goldman, Other Banks After Strong Earnings


-
 NewsBeat2 days ago
London Mayor Sadiq Khan handed a peerage by Keir Starmer alongside 15 other Labour figures… just days before the PM leaves No10
-

 Fashion1 day ago
Weekend Open Thread – Corporette.com
-

 Politics8 hours ago
The House | The City of London can help the new chancellor deliver growth in every postcode
-

 Crypto World3 days ago
CFTC blocks Kalshi from unwinding Michigan trades after court order
-

 Politics3 days ago
Young campaigners urge incoming PM to act on outdoor junk food ads
-

 Business3 days ago
Nvidia Stock Slips After Big Tuesday Rally as Huang Confirms Vera Rubin Chip Is Now in Production Today
-
 Crypto World8 hours ago
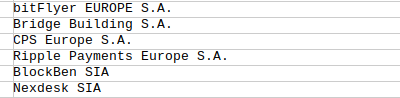
Ripple Payments Joins MiCA With 14 Firms, Does It Mean Anything For XRP?
-
 Entertainment3 days ago
Disney’s Most Ambitious Failed Star Wars Attraction Is Coming to SDCC
-

 Crypto World21 hours ago
Ripple wins EU-wide access as ESMA adds it to MiCA register
-

 Business3 days ago
Palantir Shares Rise After Expanded Nvidia Partnership and Fresh Analyst Upgrades Ahead of Earnings Day
-

 Tech5 days ago
Get Your ESP32 Sunny Side Up With This Solar Dev Board
-

 News Videos4 days ago
XRP BOMBSHELL… XRP OMBOARDED FOR TRANSACTIONS!!!
-

 Crypto World2 days ago
Injective Submits SEC Transfer-Agent Registration to Onchain Ownership Records
-

 Tech4 days ago
Dark Secrets Emerge When Jailbreaking LLMs
-

 NewsBeat1 day ago
Registration is now open for March for Men with Kev 2026
-
 Sports3 days ago
New Cornerback Enters Vikings Trade Rumor Mill
-

 News Videos2 days ago
Money | Class 12 Economics | CBSE Board Exam 2026-27
-

 Business2 days ago
Banco Bilbao Vizcaya Argentaria, S.A. (BBVA) Discusses Global Macro Environment and Economic Outlook for Core Markets Transcript
-
 Tech5 days ago
Cloudflare Precursor Watches Your Mouse and Keyboard To Decide If You Are Human
-

 NewsBeat14 hours ago
Durham County Council to send out electoral registration emails
You must be logged in to post a comment Login