

Crypto World
Trump aide sparks insider trading probe with $90K Kalshi profit



A White House teleprompter operator has been placed on paid leave after allegedly earning more than $90,000 from Kalshi bets tied to words President Donald Trump would use in his speeches.
Summary
- The CFTC is investigating Gabriel Perez over more than $90,000 in reported Kalshi profits.
- Kalshi froze most of the gains after flagging bets tied to Trump’s speeches as suspicious.
- The case comes as Trump Media begins selling real-time Truth Social data to financial firms.
According to an ABC News report, the Commodity Futures Trading Commission is investigating Gabriel Perez over trades placed in Kalshi’s “mentions” markets, where users bet on whether Trump will use certain words or discuss specific topics during public appearances.
Perez has reportedly worked on Trump’s speeches since the 2016 presidential campaign, giving him direct access to prepared remarks before they were delivered. Sources familiar with the investigation told ABC News that the CFTC identified bets linked to Trump’s State of the Union address.
Over three months, Perez allegedly traded contracts connected to more than a dozen presidential appearances. ABC News reported that the events included a December prime-time address, Trump’s January speech at the World Economic Forum in Davos and his March remarks at a Medal of Honor ceremony.
Kalshi froze most of the disputed profits
Kalshi flagged the activity as suspicious, froze most of Perez’s reported gains and referred the matter to the CFTC, according to ABC News. The report said Perez has acknowledged some of the trades and is cooperating with the regulator’s inquiry.
Federal prosecutors, however, declined to open a criminal investigation into the betting activity, ABC News reported. The CFTC’s review remains focused on whether Perez used nonpublic information while trading event contracts on the regulated prediction market.
White House Press Secretary Karoline Leavitt confirmed the investigation during a press briefing and said President Trump knew about the case. Describing the president’s reaction, Leavitt said he “believes it’s deeply unfortunate and, frankly, a disgrace.”
Leavitt also confirmed that Perez had been placed on paid administrative leave while cooperating with the CFTC. According to the press secretary, another operator would handle the teleprompter for Trump’s scheduled address that evening.
Prediction markets have faced another case involving alleged access to restricted government information. In April, the Department of Justice charged a U.S. soldier with using classified material to trade Polymarket contracts linked to the capture of former Venezuelan President Nicolás Maduro.
Political posts are gaining value as trading data
Trump’s scheduled remarks already had mentions of markets available, including contracts linked to whether he would reference China. Leavitt said the address would cover the administration’s findings on alleged foreign interference in the 2020 election, adding that Trump’s statements would be supported by evidence.
The investigation has emerged as political statements become a paid source of market data. As previously reported by crypto.news, Trump Media & Technology Group has introduced the Truth API, a licensed service that will send real-time Truth Social posts from high-ranking accounts to financial firms, data providers and news organizations.
Trump Media said subscribers would receive immediate access to public posts that could contain time-sensitive political, policy or market information. Interim CEO Kevin McGurn described the product as an alternative to unauthorized data scraping and said trading firms could use it to monitor influential accounts.
“Markets already move on Truth Social posts,” McGurn said.
While Trump Media expects the API to produce recurring revenue, the Perez investigation concerns a separate issue: whether someone with advance access to presidential remarks used that information to profit from Kalshi contracts.



South Korean retail investors have reportedly lost about 2.15 trillion won, or roughly $1.45 billion, from leveraged trading over the past month as sharp market swings triggered widespread margin calls.
Summary
- South Korean retail investors reportedly lost $1.45 billion as leveraged positions unraveled during market volatility.
- Traders in their 20s and 30s represented 62% of accounts facing forced liquidation, reports estimate.
- Korea’s stock leverage unwind follows a retail shift from crypto into equities during the rally.
According to market reports, more than 1.2 million retail leverage accounts had reached margin-call thresholds by July 13. Estimates placed the number of accounts fully liquidated by brokerages between 320,000 and 460,000, although the broader account figures have not been independently confirmed by regulators.
Young investors bear the largest share of liquidations
Investors in their 20s and 30s reportedly accounted for 62% of accounts hit by full forced liquidations. Many retail traders had built leveraged positions during South Korea’s strong equity rally, increasing their exposure to losses when prices reversed.
The losses followed months of heavy borrowing by retail investors. Reuters reported in June that borrowed investment in South Korean equities had reached a record 60 trillion won by the end of May. Regulators were already reviewing safeguards around leveraged exchange-traded funds after acknowledging concerns about their rapid growth.
Forced sales accelerate during volatile market swings
The Korea Financial Investment Association has recorded a sharp increase in forced stock sales linked to unpaid brokerage balances. Market reports put actual forced sales from unsettled trades at 451.9 billion won between July 1 and July 13.
The pressure had already been building before July. According to Seoul Economic Daily, forced sales reached 1.12 trillion won in June, the highest monthly total of 2026. The figure rose from 707.6 billion won in May as sharp KOSPI swings repeatedly caught leveraged investors on the wrong side of the market.
When investors use short-term brokerage credit, they must provide additional funds if their positions fall below required levels. Brokers can sell the shares when clients fail to cover the shortfall, locking in losses during periods of falling prices.
Retail money had shifted from crypto into stocks
The leverage rout follows a major change in how South Korean retail investors allocated their money. As previously reported by crypto.news, crypto holdings on the country’s major exchanges fell from $83.3 billion in January 2025 to $41.4 billion by February 2026 as investors increasingly moved toward equities.
Crypto trading activity also weakened as the stock market gained momentum. A later crypto.news report found that won-based crypto trading volume fell 71% between August 2025 and May 2026, while KOSPI trading volume rose 243%.
The current equity-market losses therefore affect a retail investor base that had already moved substantial capital away from digital assets and into stocks.
Tighter financial conditions add another pressure point
The deleveraging comes as South Korea also shifts toward tighter monetary policy. The Bank of Korea raised its benchmark interest rate by 25 basis points to 2.75% on July 16, its first increase since January 2023.
Higher borrowing costs could place additional pressure on leveraged trading while making investors more cautious toward risk assets. The effect may extend beyond equities because South Korea remains an active crypto market where retail trading can influence global volumes, particularly for altcoins such as XRP. As previously reported, Korean trading activity remains an important source of liquidity for several major digital assets.


Bitget has launched a Cross-Asset Unified Account that combines cryptocurrency and tokenized U.S. equities within one margin system.
Summary
- Bitget combines 370+ eligible assets and 100 tokenized U.S. stocks within a single margin pool.
- Eligible rTokens can support trading, borrowing and margin use while preserving exposure to underlying equities.
- Reality’s rToken ecosystem has now surpassed $100 million in assets under management, according to Bitget.
The exchange said the new structure supports more than 370 eligible assets, including 100 US stock tokens known as rTokens.
According to the official Bitget announcement, users can hold eligible stock tokens while also using them as margin for futures and margin trading. They can also pledge supported rTokens as collateral to borrow stablecoins rather than selling their positions.
Bitget expands unified margin beyond crypto
Traditional exchange accounts often separate collateral across individual products and positions. Bitget’s Unified Trading Account already allowed several cryptocurrencies to contribute toward one collateral pool. The latest update extends that model to tokenized equities and other eligible real-world assets.
The initial list includes tokens linked to Apple, Amazon, Tesla, Nvidia, Microsoft, Meta, JPMorgan, Walmart, Strategy, the S&P 500 ETF and the Nasdaq-100 ETF. Bitget applies collateral discount rates of up to 95%, depending on the asset and the amount held. Borrowing rates change hourly based on market supply and demand.
Bitget CEO Gracy Chen said “the real breakthrough” comes when tokenized stocks can work with the same flexibility as crypto. She said a stock position should be able to support another trade or provide liquidity instead of remaining isolated within an account.
rTokens gain a wider role across trading products
The launch expands an earlier rollout that covered a smaller group of tokenized assets. Bitget enabled 15 tokenized stocks and ETFs as collateral for USDT-margined futures in June. The list included assets linked to Apple, Tesla, Nvidia, Microsoft, Amazon, SPY and QQQ.
The new account raises that number to 100 stock tokens and adds broader uses for the assets. Eligible rTokens can now contribute to margin requirements, support borrowing and provide exposure to their linked equities. Bitget also says holders can receive cash dividend distributions where applicable.
The company warns that using tokenized assets as collateral can increase overall account leverage. A fall in collateral value can lead to margin calls or liquidation, while borrowed funds also carry interest costs.
Reality platform supports Bitget’s tokenized stock push
The Cross-Asset Unified Account builds on Bitget’s Reality platform, which launched in May. As reported by crypto.news, Reality offers rTokens linked to publicly traded US stocks and ETFs, with Bitget saying the assets are backed 1:1 through regulated brokerage arrangements.
Bitget now says Reality-linked rTokens have passed $100 million in assets under management during their first month and generated more than $671 million in cumulative trading volume. Those figures come from the company and have not been independently verified in the announcement.
The exchange has also reported stronger liquidity across some tokenized markets. As previously reported, a Bitget and Block Scholes study found that its Nvidia-linked perpetual market reached about 75% of the liquidity depth of its Bitcoin spot market.
Exchanges push tokenized assets toward broader utility
Bitget’s latest rollout comes as crypto platforms move tokenized stocks beyond simple price exposure. The company is positioning rTokens as assets that can serve several purposes inside a single account instead of functioning only as instruments that track equity prices.
The broader trend is also extending into wallets and trading infrastructure. Bitget Wallet upgraded its trading infrastructure in June to support direct transactions involving tokenized real-world assets.
Bitget plans to add more assets to its Cross-Asset Unified Account. The launch expands its earlier collateral framework while placing tokenized stocks, crypto assets and borrowing functions inside the same capital pool.


ORANGE JUICE has raised $40 million to launch a permanent capital company that plans to acquire American businesses and build a Bitcoin treasury from their cash flow.
Summary
- ORANGE JUICE raised $40 million to acquire profitable businesses while building a long-term Bitcoin treasury.
- The company plans permanent ownership, avoiding traditional private equity fund cycles and forced portfolio exits.
- Cash flow from acquired companies may fund new deals or future Bitcoin purchases over time.
According to the company’s July 15 announcement, the Connecticut-based firm will initially target companies generating between $1 million and $10 million in annual cash flow across different industries.
Permanent capital model targets long-term ownership
ORANGE JUICE plans to permanently own the companies it acquires rather than operate under a traditional private equity structure that often requires portfolio businesses to be sold after several years. The firm said acquired companies will keep their existing identities and continue operating as separate businesses.
Founders will have the option to retire, remain involved or gradually hand over management. Sellers will also receive part of their compensation in ORANGE JUICE equity, allowing them to retain exposure to the wider company after completing a transaction.
Founding partner Nico Lechuga said “building a business takes decades,” arguing that owners should have more than one option when deciding how to transfer control. The company has not yet named its first acquisition target or disclosed how much of its $40 million raise will go directly toward Bitcoin.
Bitcoin treasury will draw from business cash flow
ORANGE JUICE said cash generated by its portfolio companies can fund further acquisitions or additions to its Bitcoin treasury. The firm plans to use leverage and capital markets conservatively as it expands.
The model links Bitcoin accumulation to operating businesses rather than depending entirely on repeated stock or debt issuance. A similar cash-flow approach has appeared elsewhere. As previously reported by crypto.news, Cardone Capital has directed rental income from selected real estate assets toward long-term Bitcoin purchases.
Ricardo Salinas, founder and chairman of Grupo Salinas, joined the raise as an anchor investor. Salinas said “cash flow is king” and backed the company’s combination of operating businesses and a Bitcoin reserve.
Jeff Booth and Lyn Alden join founding group
The company was founded by several figures linked to Bitcoin-focused venture firm ego death capital. The founding group includes Jeff Booth, Lyn Alden, Nico Lechuga and Andi Pitt, alongside Adrian Steckel. Ruben Zweiban will serve as operating partner.
ORANGE JUICE is also building an internal operating team to help acquired companies improve their businesses and adopt artificial intelligence tools. The company said operational development will remain part of its strategy alongside acquisitions and Bitcoin accumulation.
The firm also intends to pursue a public listing in the future. Management said access to public markets could provide additional capital and create liquid equity that may support future acquisitions. No timetable or planned exchange has been announced.
Bitcoin treasury models face a changing market
ORANGE JUICE enters the market as corporate Bitcoin treasury strategies face closer scrutiny following the 2026 crypto downturn. Some companies have relied heavily on securities issuance to finance Bitcoin purchases, creating ongoing obligations alongside their digital asset holdings.
As reported by crypto.news, Strategy recently sold Bitcoin after building a large system of preferred securities carrying dividend obligations. The episode showed how treasury structures that rely on external financing can face different pressures when capital markets weaken.
ORANGE JUICE is proposing a different structure built around cash-generating operating companies that it plans to own permanently. Its ability to expand the Bitcoin treasury will depend on acquisition performance, business cash flow and future capital decisions.
The company has not disclosed a Bitcoin purchase target or a timetable for its first treasury acquisition. For now, the $40 million raise provides the initial capital for its plan to combine permanent business ownership with a long-term Bitcoin strategy.
Open interest counts how many derivative positions are alive right now, not how many changed hands. It is the closest thing crypto has to a leverage gauge, and reading it alongside price tells you whether a move is built on new conviction or on people being forced out.
Summary
- Open interest is the total number of derivative contracts currently open and unsettled. It measures live positions, not activity, which is what separates it from volume.
- A trade only increases open interest when both sides are opening new positions. If either side is closing, the number stays flat or falls.
- Read alongside price, open interest tells you what kind of move you are watching: rising price with rising open interest means new money, while rising price with falling open interest usually means shorts being squeezed out.
- Open interest matters more in crypto than in traditional markets because perpetual futures dominate trading here, and the aggregate figure functions as a rough gauge of how much leverage sits in the system.
- The number has real limits. It is venue-specific, dollar-denominated figures move with price even when positions do not, and a high reading tells you leverage exists without telling you which direction it will break.
Every derivatives trader eventually runs into a number that sounds like it should be obvious and is not. Volume is easy: it counts how much traded. Price is easy: it is what people paid. Open interest is the third figure on every dashboard, quoted constantly in market commentary, and routinely misunderstood, because it measures something neither of the other two does. It counts what is still alive. Not what traded today, not what it cost, but how many bets remain open right now, waiting to be closed or liquidated. In a market where perpetual futures are the most heavily traded instrument in existence, that number is the closest thing available to a measure of how much risk is loaded into the system at any moment. This guide explains what open interest counts, how a single trade moves it, what the four price-and-open-interest combinations mean, and where the signal breaks down.
What open interest actually counts
Open interest is the total number of derivative contracts that have been opened and not yet closed, settled, or liquidated. Each contract represents an agreement between two parties, one long and one short, and it stays in the count until one of them exits. If a thousand Bitcoin perpetual contracts are open across a venue, that means a thousand live agreements are sitting there, each with someone on both sides who has money at stake.
The critical word is outstanding. Open interest is a snapshot of positions that exist at this instant, which makes it a stock measure instead of a flow measure. Your account balance is a stock. Your monthly spending is a flow. Volume is a flow: it counts trades over a period and resets. Open interest is a stock: it carries forward, rising and falling as positions are opened and closed, and it does not reset at the end of the day.
This has a consequence people miss. Open interest is not cumulative. It does not grow forever the way total historical volume does. It can rise for weeks as traders pile into a trend and then collapse in an hour when a price move liquidates thousands of positions at once. Watching it fall by a third in a single session tells you something important happened, and that something is almost always forced.
Open interest gets quoted two ways, and the difference matters. Some venues report it in contracts, meaning a raw count of units. Others report it in notional dollars, meaning the count multiplied by the current price of the underlying asset. The second version is more intuitive and more misleading, for reasons covered later.
Open interest versus volume
The cleanest way to separate the two is to notice that they answer different questions.
Volume asks how busy the market was. Open interest asks how much of that activity left something behind.
Picture a market where two traders spend all day passing the same contract back and forth. Each transfer adds to volume. By the close, volume looks enormous. But no new positions were created, because each trade had one party opening and one party closing. Open interest never moved. Enormous volume, unchanged open interest, and nothing about the market’s underlying risk changed at all.
Now picture the opposite. Ten new traders open long positions and ten new traders take the other side. That is a modest amount of volume and a direct increase in open interest of ten contracts. Small activity, real change in exposure.
Real markets mix both constantly, which is why the two figures move independently and why reading them together is more informative than reading either alone. High volume with flat open interest describes churn: the same positions rotating between hands, common during choppy sideways action. High volume with sharply rising open interest describes new participation: fresh capital committing to a view. High volume with sharply falling open interest describes an exit: people closing, willingly or otherwise, and that last case is what a liquidation cascade looks like on a chart.
How one trade moves the number
The mechanics reward a worked example, because the rule is not intuitive until you see it.
Every derivatives trade has a buyer and a seller. Each of them is doing one of two things: opening a new position, or closing one they already had. That gives four combinations, and the combination determines what happens to open interest.
Start with a market where open interest is 100 contracts.
Case one: both sides open. Alice wants to go long and has no position. Bob wants to go short and has no position. They trade one contract with each other. A new agreement now exists that did not exist before. Open interest rises to 101. Volume for the session records one contract.
Case two: both sides close. Alice already holds a long and wants out. Bob already holds a short and wants out. They trade with each other, and both positions are extinguished at once. The agreement is gone. Open interest falls to 99. Volume still records one contract.
Case three: one opens, one closes. Alice holds a long and wants out. Carol has no position and wants to go long. Carol takes Alice’s position over. The contract still exists; only the name on one side changed. Open interest stays at 100. Volume records one contract.
Case four: the mirror of case three. A short holder exits and a new short takes their place. Same result. Open interest unchanged at 100.
Notice that volume recorded one contract in every case while open interest did three different things. That is the whole distinction in a single table. Volume counts the transaction; open interest counts whether the transaction created or destroyed a live position. And notice that open interest only ever rises when both parties are new to the trade, which means an increase always signals fresh capital entering, never rotation.
One more detail that trips people up: open interest counts contracts, not participants, and it counts each contract once, not twice. A single agreement between one long and one short is one unit of open interest, not two. The long side and the short side of the market are always exactly equal in size, because every contract has both. Anyone claiming that open interest shows more longs than shorts has misunderstood the instrument. What they mean is that positioning or funding leans one way, which is a different measurement entirely.
Reading price and open interest together
On its own, open interest is close to meaningless. A reading of $20 billion tells you nothing without knowing whether it was $10 billion or $30 billion yesterday, and what price did in the meantime. Paired with price direction, it produces four readings that traders use constantly.
Price up, open interest up. New money is opening positions into strength. Fresh longs are entering and someone is willing to take the short side. This is the combination most often read as a healthy trend, because the move is supported by new commitment instead of by people unwinding. It also means leverage is accumulating, which is the setup for a violent reversal later.
Price up, open interest down. Positions are closing while price rises. The usual explanation is short covering: traders who were short are buying to exit, which pushes price up while destroying open interest. The move is real, but it is powered by people leaving instead of by people arriving, and it tends to exhaust when the shorts are done. Rallies with falling open interest have a reputation for disappointing.
Price down, open interest up. New positions are opening into weakness, typically new shorts. Fresh bearish conviction is entering the market. Like the first case, this builds leverage, and a crowded short book is exactly what a squeeze needs.
Price down, open interest down. Positions are closing as price falls. This is the signature of long liquidation: leveraged longs being forced or choosing out, which removes both the position and the price support. In its extreme form it is capitulation, and it is why the sharpest drops often come with the largest single-session collapses in open interest.
Treat these as vocabulary instead of as prophecy. They describe what has already happened in a way price alone cannot. They do not predict the next move, and every one of the four has failed plenty of times.
Why the number matters more in crypto
Open interest exists in every derivatives market. Wheat futures have open interest. It matters differently in crypto for structural reasons.
The first is dominance. In equities, derivatives sit alongside a far larger spot market. In crypto, perpetual futures are the single most heavily traded product in the entire asset class, and perp volume reached roughly $61.8 trillion in 2025 according to CryptoQuant data, up about 29% year on year. Offshore perpetual volume alone grew from around $28 trillion in 2023 to more than $90 trillion in 2025. When the derivative dwarfs the underlying, the derivative’s positioning drives the spot price instead of reflecting it, and open interest is the measure of that positioning.
The second is leverage. Perps offer leverage multiples that traditional venues do not permit, and because they never expire, positions can accumulate indefinitely. There is no quarterly settlement forcing a reset. Open interest can therefore build for months, which means the aggregate figure functions as a rough gauge of how much borrowed exposure is stacked in the system waiting for a catalyst.
The third is the liquidation engine. Because positions are leveraged and margined, a price move against a crowded book does not produce a gentle unwind. It produces automatic, forced closure, which pushes price further, which forces more closure. The October 10, 2025 event, in which roughly $19 billion of positions were liquidated across the market in a single episode, is the reference case. Elevated open interest is the fuel for that. It does not tell you when the match gets struck, but it tells you how much is stacked.
The fourth is that crypto has finally started measuring it onshore. Perps have moved from offshore venues into regulated American markets, with Coinbase cleared for perpetual futures and the CME suing the CFTC over whether a perp is legally a swap. As the product comes onshore, open interest data becomes more reliable and more consequential, because regulated venues report it consistently.
Where to find it and how it is measured
Every derivatives venue publishes its own open interest. Aggregators such as CoinGlass combine figures across exchanges to produce a market-wide number, which is the version quoted in most commentary.
Three practical measurement issues are worth carrying with you.
Aggregation is imperfect. Venues report differently, some in contracts and some in notional, some including inverse contracts and some not. Adding them produces an estimate, not a census. Different aggregators publish different totals for the same moment, and the discrepancy is normal.
Dollar-denominated open interest moves with price. This is the most common misreading in circulation. If open interest is quoted in notional dollars and the price of the asset rises 10% while every position stays exactly as it was, the dollar figure rises 10%. Nothing changed. No new positions opened. The number went up because the multiplier went up. Anyone pointing at rising dollar open interest during a rally as proof of new participation may be describing arithmetic. Contract-denominated open interest, or the ratio of open interest to market capitalization, avoids the trap.
The ratio is often more useful than the level. Open interest divided by market capitalization gives a crude but real sense of how leveraged an asset is relative to its size. A token with open interest approaching a large fraction of its market cap is carrying leverage that a token with a tiny ratio is not, and the first will move far more violently on the same news.
A worked reading of a real cascade
Abstract rules are easier to hold when attached to a sequence, so walk through the shape of a leverage unwind as open interest describes it.
Phase one is the build. Price grinds higher over several weeks. Open interest climbs steadily alongside it, in contract terms and not merely in dollars, which tells you positions are actually being added instead of the multiplier rising. Funding turns positive and stays there, meaning longs are paying shorts to hold the trade, which is the market charging rent for a crowded direction. Nothing is wrong yet. This is what a trend looks like. But each new contract is a position with a liquidation price attached, and those prices cluster, because leverage settings and entry points cluster. The book is getting heavier and the heaviness is concentrated in bands.
Phase two is the stall. Price stops advancing but open interest does not fall. This is the tell worth learning. Traders who entered late are underwater on funding and unwilling to close, so exposure stays on the books while the reason for holding it weakens. Open interest at a high level with price going sideways describes a market where a lot of people are waiting to be proven right, and the longer it persists the more of them are paying to wait.
Phase three is the trigger, and it is usually mundane. A macro print, an exchange outage, a large spot sale. Price drops into the first cluster of liquidation levels. Those positions close automatically, and automatic closure means market sell orders hitting a book that has just widened. That pushes price into the next cluster.
Phase four is the cascade, and this is where open interest earns its reputation. The number does not drift down. It falls off a cliff, because thousands of positions are being extinguished in minutes. Volume spikes to extraordinary levels at the same moment. High volume plus collapsing open interest plus falling price is the unambiguous signature of forced exit, and it is the one combination that admits almost no alternative reading. The October 10, 2025 episode, roughly $19 billion liquidated, is the canonical version.
Phase five is the aftermath, and it is the most useful part for anyone still holding. Open interest is now far lower than it was. The leverage that fueled the drop has been removed from the system, which is why sharp liquidation events are frequently followed by calmer trading: the fuel burned. A market with low open interest after a cascade is structurally different from the same price level reached with high open interest intact, because the second one still has a loaded book underneath it and the first does not. Same price, completely different risk.
Notice what open interest did and did not do across those five phases. It described the build accurately. It flagged the stall, which price alone did not. It confirmed the cascade in real time. It told you afterward that the leverage was gone. What it never did, at any point, was tell you when phase three would arrive or which direction it would run. That is the honest scorecard: a superb descriptive instrument and a poor predictive one, which is worth far more than the reverse if you know which you are holding.
The limits of the signal
Open interest deserves the attention it gets and considerably less certainty than it receives. Its limits are structural, and knowing them separates using the number from being used by it.
It is directionless. High open interest tells you leverage is present. It does not tell you which way that leverage breaks. A crowded book can unwind up or down, and the same reading precedes both. Commentary that treats elevated open interest as inherently bearish, or as inherently a sign of a healthy trend, is adding a conclusion the data does not contain.
It says nothing about position size distribution. Ten thousand contracts might be one enormous institutional hedge or ten thousand retail gamblers at maximum leverage. Those two books behave completely differently under stress: the hedge sits still, the gamblers cascade. Open interest cannot distinguish them.
It ignores what the positions are for. A short is not necessarily a bearish bet. Market makers run shorts as inventory hedges. Basis traders hold spot and short the perp to harvest the spread, with no directional view whatsoever. Miners hedge forward production. A meaningful share of any open interest figure is not speculation at all, and treating the whole number as a sentiment gauge misreads it.
It is venue-fragmented. Open interest on one exchange can rise while it falls on another as positioning migrates, which looks like a signal and is a transfer. Only the aggregate captures the system, and the aggregate is an estimate.
And it lags the thing you actually want. By the time open interest confirms a trend, the trend has been running. By the time it collapses, the liquidation already happened. Open interest is excellent at describing what occurred and poor at telling you what comes next, which is true of most indicators and rarely admitted about this one.
Used properly, it is a context tool. It answers a specific question well: is this price move backed by people arriving or by people leaving? That question is worth answering, and no other single number answers it. Just do not ask it to do more.
Disclaimer: This article is for information and educational purposes only and does not constitute financial, investment, or trading advice. Derivatives carry substantial risk of loss, and leveraged positions can be liquidated rapidly, in some cases exceeding the margin posted. Nothing here is a recommendation to trade any instrument. Always do your own research. Figures are accurate as of July 16, 2026.
Frequently Asked Questions
What is open interest in crypto?
Open interest is the total number of derivative contracts, most often perpetual futures, that are currently open and have not been closed, settled, or liquidated. It measures live positions at a point in time instead of trading activity over a period. Each contract counts once and always has a long and a short on opposite sides, so the two sides of the market are always equal in size.
What is the difference between open interest and volume?
Volume counts how many contracts traded during a period and resets each session. Open interest counts how many positions are still alive and carries forward. A market can post huge volume with no change in open interest if traders are simply passing existing positions between each other. Volume measures activity; open interest measures accumulated exposure.
Does rising open interest mean price will go up?
No. Open interest is directionless. It tells you that new positions are being opened, not which way they will resolve. Rising open interest alongside rising price suggests new money entering a trend. Rising open interest alongside falling price suggests new shorts. The same reading precedes both rallies and crashes, and treating it as a directional forecast misreads what it measures.
What does falling open interest mean?
Positions are being closed, either voluntarily or through liquidation. Falling open interest with falling price is the signature of long liquidation and, in extreme form, capitulation. Falling open interest with rising price usually indicates short covering, where traders buy to exit shorts. Either way, the move is powered by participants leaving instead of arriving, which tends to limit how far it runs.
Why does open interest matter more in crypto?
Because perpetual futures dominate crypto trading to a degree unmatched in other asset classes, with perp volume around $61.8 trillion in 2025, and because perps never expire, so leveraged positions accumulate indefinitely with no settlement date forcing a reset. The aggregate figure therefore works as a rough gauge of how much leverage sits in the system, which is the fuel for liquidation cascades.
Can open interest be higher than the spot market?
Yes, and in crypto it frequently is for individual assets. Derivatives positioning can exceed the size of the underlying market, which is one reason perps often lead spot price instead of following it. The ratio of open interest to market capitalization is a useful gauge here: a high ratio indicates an asset carrying leverage disproportionate to its size, which typically means more violent moves.
Where can I check crypto open interest?
Individual exchanges publish their own figures, and aggregators such as CoinGlass combine them into market-wide estimates. Treat aggregates as approximations, since venues report on different conventions and different aggregators disagree. Check whether the figure is quoted in contracts or in notional dollars, and check the timestamp, because open interest can change dramatically within hours.
Why does dollar open interest rise when price rises?
Because notional open interest is the contract count multiplied by the current price. If price rises 10% and not a single new position opens, the dollar figure still rises roughly 10%. This is arithmetic, not participation, and it is the most common misreading of the metric. To see whether positions are actually being added, look at contract-denominated open interest or the open-interest-to-market-cap ratio.
Zama says a lending vault that accepts only confidential USDC has grown into one of the largest USDC vaults on Morpho’s Ethereum deployment, weeks after opening to depositors.
Summary
- Zama says confidential USDC deposits reached $23.23 million, ranking eighth among Ethereum Morpho USDC vaults.
- The vault lets users earn DeFi yield while keeping individual balances and deposit positions encrypted.
- Morpho’s growing institutional use shows privacy tools are entering established onchain lending infrastructure at scale.
According to a July 16 post from Zama, the Steakhouse Confidential Prime USDC vault held $23.23 million at Ethereum block 25,544,806. The company said that placed it eighth by total deposits among Morpho V1 and V2 USDC vaults on Ethereum. The ranking and deposit figure reflect Zama’s stated snapshot and can change as users deposit or withdraw funds.
Confidential USDC moves into established DeFi infrastructure
The Steakhouse Confidential Prime USDC vault opened on June 23. Steakhouse Financial curates the strategy, Morpho provides the lending infrastructure, and Zama supplies the confidentiality technology.
Users deposit confidential USDC, or cUSDC, rather than standard USDC. Zama uses Fully Homomorphic Encryption to keep individual balances and transaction amounts encrypted while allowing the assets to interact with applications on Ethereum. Deposits ultimately enter a strategy using Morpho lending markets backed by collateral including cbBTC, WBTC and wstETH.
Zama points to $23.23M TVL as a demand signal
Zama described the vault’s growth as evidence that users are willing to place capital into confidential financial infrastructure. The company said “capital is ready to flow through confidential rails,” while acknowledging that an ongoing incentive program has also helped attract deposits.
The vault launched with a 12-week reward program on top of the yield generated by its underlying Morpho strategy. Zama said the native strategy was producing about 4% when the product launched, while additional incentives rewarded early depositors. The company had reported more than $14 million deposited by July 2, before the total reached the $23.23 million figure reported on July 16.
Morpho attracts more institutional-style vault products
The confidential vault arrives as Morpho attracts asset managers, wallets and professional curators. Bitwise launched its first onchain vault on Morpho in January, targeting stablecoin lending through a non-custodial structure.
Morpho has also expanded through consumer wallet integrations. As reported by crypto.news, Trezor added access to Steakhouse-curated USDC and USDT vaults in May. Those developments place Zama’s product within an existing lending market rather than requiring users to move liquidity to a separate blockchain.
Confidential finance still faces compliance questions
Zama’s confidential USDC system has already faced a test involving the underlying stablecoin. In May, a US court order led Circle to temporarily freeze a Zama contract holding about $12.5 million in USDC. The order was later lifted, and Zama said the funds returned to normal operation.
As previously reported, the episode prompted Zama to accelerate work on compliance and controlled disclosure tools. The company says its system encrypts transaction details rather than making users anonymous and plans tools that can respond to legal and regulatory requirements.
Zama argues that its cross-chain confidentiality model can add privacy where liquidity already exists instead of requiring a new Layer 1 or Layer 2. The $23.23 million vault provides an early test of that approach, although continued deposits after the incentive program ends will offer a clearer measure of lasting demand.


Morpho has restored its frontend and API after a temporary disruption that its engineering team linked to a possible Amazon Web Services CloudFront outage.
Summary
- Morpho restored its app and API after a suspected AWS CloudFront outage disrupted frontend access.
- The incident affected web infrastructure while Morpho’s onchain lending contracts continued operating independently during disruption.
- Recent integrations have made Morpho infrastructure increasingly important across wallets, exchanges and institutional DeFi products.
Morpho principal engineer Julien reported that app.morpho.org and api.morpho.org were partially unavailable on July 16. He said the team suspected a “potential AWS CloudFront outage” and was working on a way to restore traffic.
Morpho restores services after partial outage
Around three hours later, Julien confirmed in a follow-up update that the affected services had recovered. He said “all Morpho services are back and stable,” although performance could still experience some effects following the disruption.
The outage affected access to Morpho’s application and API rather than triggering a reported failure of its underlying lending contracts. Morpho’s API documentation describes the service as an interface that provides applications with onchain and offchain data about markets, vaults and user positions. The protocol’s lending activity operates through blockchain-based infrastructure separately from that interface.
AWS operates CloudFront as a content delivery network used to deliver websites, applications and APIs. Morpho did not confirm a final root cause in the updates and referred only to a possible CloudFront problem. AWS maintains a public service health dashboard for tracking disruptions and recovery across its infrastructure.
YEET also reports website disruption
YEET co-founder Mando separately said the project’s website had gone offline during the same reported AWS CloudFront disruption. According to the project, the website outage did not affect user assets or funds, while its team worked to restore access.
The incidents show how decentralized applications can still depend on centralized web infrastructure for interfaces and data delivery. A frontend outage can prevent users from accessing a website even when the underlying blockchain and smart contracts remain active.
For users, that distinction means a website becoming unavailable does not automatically mean assets stored in onchain contracts have disappeared. However, disruptions to interfaces and APIs can temporarily make it harder to view positions or interact with protocols through their standard websites.
Morpho’s infrastructure now supports wider DeFi access
The temporary disruption comes as Morpho has expanded its role across several large crypto platforms. As previously reported, Coinbase uses Morpho infrastructure for USDC lending products, with Steakhouse Financial managing vault allocations.
Hardware wallet provider Trezor has also integrated Morpho vaults. Users can access USDC and USDT lending strategies through Trezor Suite while signing transactions on their hardware wallets.
Morpho has attracted traditional financial firms as well. Apollo Global Management agreed to a structure that could see its affiliates acquire up to 90 million MORPHO tokens over 48 months as part of a wider relationship with the protocol.
Recovery limits the immediate disruption
Morpho’s application and API were functioning again following the engineering update. Julien warned that performance could remain affected temporarily but described the services as stable.
No loss of user funds or failure of Morpho’s onchain lending contracts was reported in connection with the event. The disruption instead affected the access layer used by users and developers to interact with protocol data.
One anonymous wallet has spent a year absorbing the supply that everyone else is selling. It is now the largest single holder of PI, nobody has claimed it, and at today’s price it is sitting on one of the worst trades in the token’s short history.
Summary
- A wallet tracked as GAS…ODM has accumulated more than 400 million PI, making it the largest single holder outside the Pi Foundation’s own reserves, built by pulling tokens off OKX, Gate.io, and MEXC over roughly a year.
- No party has claimed ownership. The two dominant theories are a Pi Core Team buyback wallet managing supply, or an exchange stockpiling inventory ahead of a listing.
- The accumulation is real support, but it has not worked: PI broke below $0.10 in July to a fresh all-time low near $0.071, down roughly 97% from its $2.99 peak.
- The uncomfortable arithmetic: a stake valued near $148.5 million when it was reported at 331 million tokens is worth a fraction of that today. Whoever the whale is, they are deeply underwater.
- The deeper story is concentration. Pi markets itself as the people’s cryptocurrency, yet 22 wallets hold over 10 million PI each and roughly 84% of accounts hold less than 10 PI.
Every crypto community has a wallet it watches. Pi Network has GAS…ODM, and the watching has become something closer to a devotional practice. For roughly a year, this single anonymous address has done the one thing almost nobody else in the Pi ecosystem has been willing to do: buy, relentlessly, into a collapsing price, pulling millions of tokens off exchanges week after week while daily unlocks poured fresh supply into a market that could not absorb it, a dynamic crypto.news examined in its coverage of the supply schedule the whale is fighting. It is now the largest single holder of PI outside the project’s own foundation wallets. Nobody knows who controls it. The community has variously called it a core team buyback, an exchange preparing a listing, and, with a straight face, the new Satoshi wallet. What the data actually shows is more interesting than any of those theories, and considerably less flattering.
What the wallet has actually done
The mechanics are unusually legible, because Pi’s block explorer makes them so. Tracking data from PiScan shows the address labelled GAS…ODM systematically withdrawing PI from centralized exchanges, principally OKX, Gate.io, and MEXC, in multimillion-token transfers over an extended period. By mid-2025 the wallet had amassed roughly 331 million PI, a position valued at approximately $148.5 million at the prices of the time. By late May 2026, on-chain data showed it had crossed 400 million tokens, with days on which it added more than 1.5 million PI in a single session, and a pattern of near-daily accumulation that had held through the spring.
Two features of the behavior distinguish it from ordinary trading. First, the direction is one-way. The wallet withdraws from exchanges into self-custody and does not send tokens back, which is the on-chain signature of an entity removing supply from circulation instead of flipping it. Second, the timing clusters around weakness. Inflows to the wallet intensified during price dips, with buying accelerating as PI slid toward support zones. That is a pattern rarely produced by a discretionary trader, because it requires either conviction that borders on indifference to drawdown, or a mandate that is not about profit at all.
The scale is what makes it consequential. At 331 million tokens the wallet was already the sixth-largest holder in the ecosystem, exceeding the balances held by exchange wallets at platforms like Bitget and MEXC. Crossing 400 million made it the largest single non-foundation holder. For context on how much supply that represents, daily unlocks currently add roughly 6.5 million PI to the float, which means the whale has absorbed something on the order of two months of continuous unlock supply in a market where finding a buyer for a single day’s worth has proven difficult.
The theories, and what each would mean
Two explanations dominate the community discussion, and they carry radically different implications. The first, and most widely held, is that GAS…ODM belongs to the Pi Core Team, functioning as a buyback wallet that repurchases tokens during unlock periods to stabilize price and manage supply. The circumstantial case is decent: the accumulation intensified exactly when supply pressure peaked, the behavior looks mandated rather than opportunistic, and a project sitting on a large treasury has both the means and the motive to defend its token during a distribution phase. The Core Team has never acknowledged any role.
The second theory holds that the wallet belongs to a major exchange quietly building inventory ahead of a listing. This gained traction because the accumulation coincided with persistent speculation about tier-one listings, and because exchanges genuinely do pre-position inventory before opening a market. The theory has weakened as time has passed, though. Kraken and OKX opened PI markets in 2026 and the accumulation continued regardless, while Binance and Coinbase have still not listed. No exchange has confirmed ownership of the address.
The implications diverge sharply. If it is the Core Team, then a substantial share of what looks like organic market demand for PI is the project buying its own token, which means the price signal is partly manufactured and would collapse further if the buying stopped. That is not illegal, and treasury management is common, but it is material information that holders do not have. If it is an exchange, the accumulation is inventory instead of conviction and says nothing about the token’s prospects. If it is neither, and the wallet belongs to a private entity making a long-horizon bet, then it is simply the largest and most patient position in the ecosystem. The honest answer is that nobody outside the wallet knows, and the ambiguity itself is the point: an unattributed entity controls a supply block large enough to move the market, and the ecosystem has decided to read that as reassurance.
The bull case: someone knows something
The optimistic interpretation, which dominates Pi community sentiment, treats the wallet as a vote of confidence expressed in the only language that cannot lie, which is money. Sustained accumulation through a brutal drawdown does suggest calculated intent instead of casual speculation. Whoever is behind it has watched PI fall through support level after support level and kept buying, which is either information or conviction, and the community has understandably preferred to believe it is the former.
There is a supply-side argument that has genuine force. Pi’s central problem is float: roughly 1.21 billion PI are scheduled to enter circulation across 2026, a daily drip averaging about 6.5 million coins, which at recent prices means the market must absorb tens of millions of dollars of new supply every month simply to hold price flat. Any entity permanently removing hundreds of millions of tokens from exchanges into self-custody is directly countering that mechanic. Tokens sitting in a cold wallet are not sell pressure. If the whale keeps buying and never sells, the effective float shrinks, and a smaller float is the precondition for any eventual repricing.
The wallet has also had a measurable psychological effect on the ecosystem, which matters for a project whose entire thesis rests on community. Sentiment tools turned positive on the accumulation narrative, and ecosystem activity has continued regardless of price: Pi App Studio brought thousands of applications online, Ecosystem Directory Staking has drawn tens of millions of PI from users spotlighting projects, and the Pi2Day product launches pushed fee-in-PI utility. A visible whale creates a feedback loop, where perceived smart-money confidence sustains builder enthusiasm, which sustains the ecosystem that any future demand would need. In that reading, GAS…ODM has been load-bearing for morale even when it failed to be load-bearing for price.
The bear case: it did not work
Now the arithmetic, and it is unkind. When the wallet’s position was reported at 331 million tokens, the stake carried a headline value near $148.5 million. PI has since broken below the $0.10 line that held through the spring, setting a fresh all-time low near $0.071 in July after a roughly 15% single-day plunge ahead of the next unlock wave. Against a peak of $2.99, the token is down roughly 97%. Run the same 400 million tokens at a price near $0.08 and the position is worth a small fraction of what it was when the accumulation made headlines. Whoever GAS…ODM is, it is one of the worst-performing large positions in the token’s history, and it is still adding.
That reframes the bull case considerably. The community reads persistent buying as insight, but persistent buying that coincides with a 97% drawdown is equally consistent with an entity that is trapped, mandated, or simply wrong. If the wallet is a Core Team buyback, then the defense has failed on its own terms: hundreds of millions of tokens were spent absorbing supply and the price broke to new lows regardless, which is the definition of an unsuccessful intervention. Buying every dip does not signal knowledge when every dip is followed by a deeper one.
The supply argument also has a rebuttal in the data. PiScan has shown tagged exchange wallets holding roughly 545 million PI in aggregate, with net inflows continuing, and inflows to exchanges typically precede selling instead of accumulation. The whale’s buying has not been enough to offset the broader movement of supply back toward trading venues. One wallet, however large, is fighting a structural release schedule that never pauses. A single buyer can absorb a discrete event. A continuous daily drip is a different opponent, because it does not stop for sentiment, news, or price, and it compounds.
The concentration problem nobody wants to discuss
The whale story points at something larger and more awkward than one address. Pi Network’s founding promise was democratic distribution: a currency anyone could mine from a phone, with no expensive hardware and no venture allocation. The on-chain reality of ownership looks nothing like that. PiScan data has shown just 22 wallets qualifying as whales holding at least 10 million PI each, alongside millions of accounts holding almost nothing. Roughly 84% of the more than 15.9 million accounts fall into the smallest category, holding less than 10 PI, worth pocket change. The Pi Foundation’s own top wallet has held tens of billions of coins.
Set that against the token’s marketing and the tension is obvious. A network built on the pitch of mass participation has produced an ownership structure where a handful of addresses, most of them associated with the foundation, dominate supply, and where the largest independent accumulator is an entity that will not identify itself. That is a decentralization question with real regulatory weight, given that market-structure legislation moving through Congress contemplates decentralization tests for classifying digital assets. Pi’s defenders point to millions of migrated wallets and a vast know-your-customer base as evidence of genuine distribution. The rich list points the other way.
None of this is unique to Pi, and every major token has concentration issues. But most of them never claimed otherwise. The gap between the people’s-cryptocurrency framing and a wallet map dominated by whales and microbes is the kind of thing that becomes a problem precisely when price stops going up, because that is when holders start reading the ledger instead of the roadmap. Fourteen million accounts holding less than four dollars each is not a distributed economy. It is a marketing funnel with a blockchain attached.
What a buyback would actually mean
It is worth taking the Core Team theory seriously for a moment and following it to its conclusion, because if it is true the implications reach well past one wallet. Token buybacks are ordinary corporate behavior in crypto. Projects with treasury reserves routinely purchase their own tokens to support price, absorb unlock supply, or retire float, and several of the largest names in the sector run formal buy-and-burn programs that they disclose openly. The mechanism is not the problem. Disclosure is.
Pi’s approach to supply management is unusual in a way that makes the whale theory more plausible. The project leans on halvings and a declining mining rate instead of burns, which means it has no mechanism for permanently destroying supply, a difference that matters when looking at why Pi has no burn valve for supply. Every coin ever mined eventually reaches circulation through migration and unlocks. A project in that position, watching roughly 6.5 million tokens hit the float daily with no burn valve to relieve pressure, has exactly one lever left if it wants to defend price, which is to buy the tokens back with treasury funds and sit on them. That is precisely the behavior GAS…ODM exhibits.
If that is what is happening, holders are entitled to know, and the silence becomes the story. A disclosed buyback is a strategy that investors can price: they know the size, the mandate, the funding source, and the conditions under which it stops. An undisclosed one is something else entirely, because market participants are reading manufactured demand as organic conviction and making decisions on that basis. The community has spent a year interpreting the wallet as smart money validating the project. If the smart money turns out to be the project validating itself, every inference drawn from that accumulation collapses at once, and it collapses fastest for the people who bought because a whale was buying.
There is a harder question underneath. A buyback funded from treasury is a transfer: the project spends reserves that belong, in some diffuse sense, to the ecosystem in order to support a price that benefits current holders, including the largest ones. When it works, nobody objects. When it fails, and PI is at a record low after a year of it, the reserves are gone and the price went down anyway. That is the worst of both outcomes, and it is the scenario the on-chain data is most consistent with. Pi’s own venture fund history is instructive here: the project announced a $100 million fund and, more than a year later, has little disclosed deployment to show for it. A pattern of large announced commitments with thin subsequent disclosure is the context in which an unattributed nine-figure wallet should be read.
None of this is proven, and it should not be presented as though it were. The Core Team has never acknowledged the wallet, and the exchange-inventory theory remains live. But the range of explanations is narrow, and every one of them is more interesting than the reading the community has settled on. Either the project is quietly spending reserves to defend a line it has already lost, or an exchange has been sitting on inventory for a listing that has not come, or an unidentified party has made an enormous and enormously bad bet. Those are the options. None of them is a reason to buy.
What to watch
The useful signals from here are narrow and specific. The first is whether GAS…ODM keeps buying below $0.10. Accumulation through the previous drawdown was notable but occurred at higher prices; continued aggressive buying into a token trading at a fresh all-time low would tighten the case that the entity is mandated instead of opportunistic, because no discretionary buyer averages down through a 97% decline without a reason external to profit.
The second is attribution. Any confirmation of ownership, whether from the Core Team acknowledging a buyback program or an exchange claiming the address, would immediately reprice the narrative in one direction or the other. Silence has served the bullish reading well, because an unattributed whale can be whatever the community needs it to be. Clarity would remove that optionality.
The third is whether the supply math changes at all. Roughly 1.21 billion PI enter circulation across 2026, with the next tranche reported above 127 million tokens, up from about 103.7 million the previous month. Absorbing that requires demand the ecosystem has not yet produced, and the Pi2Day fee-in-PI products are the project’s first real attempt to create demand that exists independent of speculation. If those products show genuine usage measured in actual fees rather than announcements, the whale’s thesis, whatever it is, gets stronger. If they do not, then one wallet is holding a position that gets larger and less valuable every month, and the most-watched address in the Pi ecosystem will end up as a case study in how supply design shapes price and how much money it takes to fail to hold a line.
Frequently asked questions
What is the GAS…ODM wallet?
It is an address on the Pi Network blockchain, tracked via the PiScan explorer, that has accumulated more than 400 million PI by systematically withdrawing tokens from centralized exchanges including OKX, Gate.io, and MEXC. It is the largest single holder of PI outside the Pi Foundation’s own wallets, and no individual, company, or exchange has publicly claimed ownership of it.
Who is behind the Pi whale wallet?
Nobody knows. The two dominant theories are that it belongs to the Pi Core Team and operates as a buyback wallet to stabilize price during unlock periods, or that it belongs to a major exchange stockpiling inventory ahead of a listing. The Core Team has not acknowledged any role and no exchange has confirmed involvement. A third possibility is a private long-horizon investor.
How much is the whale’s position worth?
Far less than it was. When the stake was reported at 331 million tokens, it carried a headline value near $148.5 million. PI has since fallen to a fresh all-time low near $0.071 after breaking below $0.10, roughly 97% beneath its $2.99 peak. At current prices the same holdings are worth a fraction of the earlier figure, meaning the position is deeply underwater.
Does whale accumulation mean PI will recover?
It has not so far. The wallet bought persistently through a drawdown that took the token to successive record lows, which means accumulation alone has failed to hold price. Removing tokens from exchanges does reduce immediate sell pressure, but roughly 1.21 billion PI enter circulation across 2026 at about 6.5 million coins per day, and one buyer has not offset a continuous release schedule.
Why does the identity of the wallet matter?
Because the implications differ completely. If it is the Core Team, then some of what appears to be organic market demand is the project buying its own token, which is material information holders lack and which would reverse if buying stopped. If it is an exchange, the accumulation is inventory and says nothing about the token’s prospects. The ambiguity lets the community read it as confidence.
How concentrated is PI ownership?
Heavily. PiScan data has shown 22 wallets holding at least 10 million PI each, while roughly 84% of more than 15.9 million accounts hold less than 10 PI. The Pi Foundation’s top wallet alone has held tens of billions of coins. That distribution sits awkwardly against Pi’s marketing as a cryptocurrency anyone can mine and own from a phone.
Why does Pi keep falling despite ecosystem growth?
Supply. Migration, second migrations, and referral rewards all enlarge the tradable float, which means the project’s most celebrated milestones are, in pure supply terms, bearish for price in the short term. The same process that turns PI into a usable asset also releases the coins that weigh on it. Product launches aim to create fee-driven demand, but that demand has not yet matched the unlock schedule.
What would change the picture?
Three things. Confirmed attribution of the whale wallet, which would reprice the narrative immediately. Evidence that the fee-in-PI products generate real recurring demand measured in usage rather than announcements. And any structural change to the unlock schedule that slows the daily drip. Absent those, the token faces a continuous supply stream that a single large buyer has already failed to absorb.
This article is for information and educational purposes only and does not constitute financial or investment advice. On-chain wallet attribution is speculative, ownership of the address discussed here is unconfirmed, and the theories described are community interpretations instead of verified facts. Nothing here is a recommendation to buy or sell any asset. Always do your own research. Prices and on-chain figures are accurate as of July 16, 2026, and move quickly.
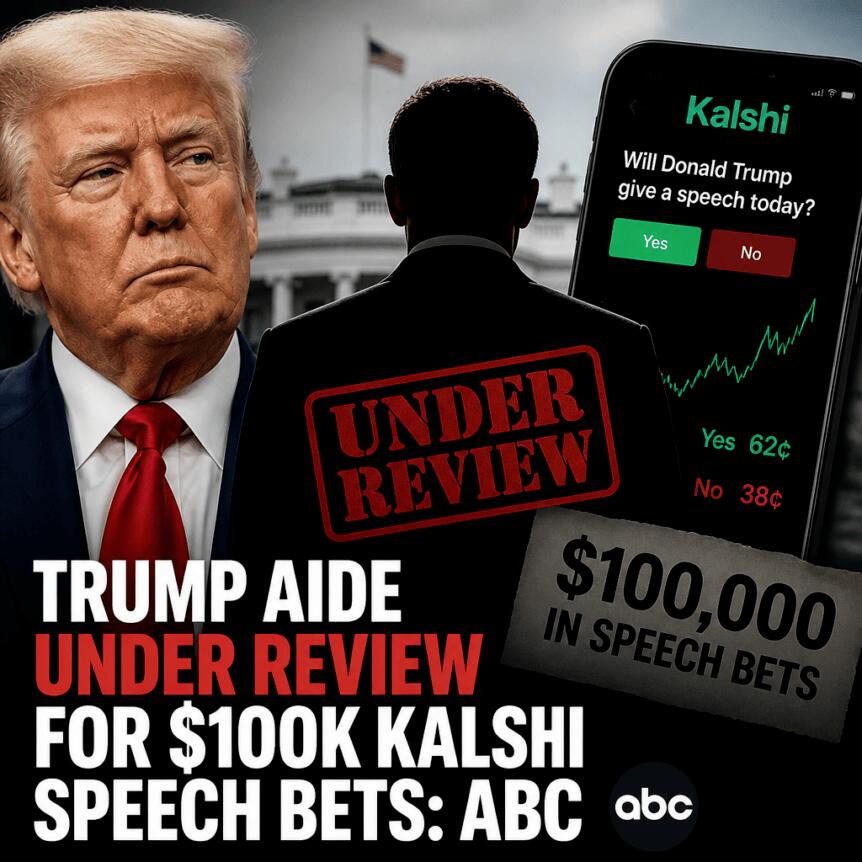
Prediction markets are facing renewed insider-trading scrutiny after a U.S. White House staffer, long involved with President Donald Trump’s teleprompter, was reportedly in talks with federal regulators over allegations that he profited from bets tied to the president’s speeches. ABC News reported Thursday that the matter centers on whether Gabriel Perez—who has served as a technical assistant operating the teleprompter since 2016—used nonpublic information to place wagers on Kalshi markets linked to specific remarks.
According to ABC News, Perez allegedly bet on more than a dozen Kalshi “Mentions” contracts—products that let users wager whether certain words, phrases, or topics will appear in public speeches—earning over $100,000 in profits. The report adds that Kalshi’s surveillance flagged the activity and referred it to the Commodity Futures Trading Commission (CFTC).
Key takeaways
- ABC News says teleprompter operator Gabriel Perez placed Kalshi “Mentions” bets tied to Trump speeches and earned more than $100,000.
- Kalshi reportedly detected the trades through its monitoring systems and referred them to the CFTC.
- Federal scrutiny of prediction markets appears to be intensifying as lawmakers and regulators focus on potential access to nonpublic information.
- Recent high-profile Polymarket-related allegations and wallet-pattern investigations have already heightened compliance concerns across the sector.
How the Kalshi “Mentions” markets came under scrutiny
Kalshi’s “Mentions” markets are designed around verifiable speech outcomes: users wager on whether particular words, phrases, or topics will appear when a public figure delivers a prepared message. ABC News reports that Perez allegedly used this structure to place bets on language expected to be included in Trump’s remarks.
The ABC report further claims that investigators found evidence suggesting Perez sometimes exited positions mid-speech when Trump reportedly skipped prepared passages that contained words he had wagered would be mentioned. If accurate, the timing detail points to a key question at the center of insider-trading concerns: whether the trades were based solely on public expectation and market pricing, or on knowledge obtained before the speech content became public.
ABC News said regulators uncovered bets connected to more than a dozen speeches over roughly a three-month span, including Trump’s State of the Union address and remarks made at the World Economic Forum.
Regulatory escalation and the CFTC referral
ABC News attributes the discovery process to Kalshi’s surveillance systems. The exchange’s monitoring reportedly detected the betting pattern and prompted a referral to the Commodity Futures Trading Commission. That referral matters because it indicates the activity was treated not just as a compliance question for a private platform, but as a potential issue for federal oversight.
The report also says the White House placed Perez on unpaid administrative leave following publication of the allegations. White House press secretary Karoline Leavitt stated that Trump called the alleged conduct a “disgrace.”
While the ABC News account describes negotiations with federal regulators to settle the matter, it does not provide details about the specific allegations’ legal theory, possible violations, or whether an agreement has been reached. Readers should watch for official regulatory filings or enforcement action that clarifies what conduct regulators believe occurred and what standard they applied.
Why this is a broader warning for prediction markets
The Kalshi teleprompter story arrives at a time when prediction markets have seen both rapid growth and increasing concern about market integrity. In recent months, multiple incidents have raised questions about whether traders may sometimes benefit from information that is not available to the general public.
In March, Cointelegraph previously reported on concerns surrounding Polymarket traders who earned roughly $1 million after correctly betting the United States would strike Iran before the end of February. That episode drew attention after Bloomberg, citing analytics firm Bubblemaps, reported that some wallets placed bets only hours before explosions were first reported in Tehran.
Cointelegraph also reported separate allegations involving traders making more than $1.2 million by betting on an onchain investigation into DeFi platform Axiom shortly before investigator ZachXBT published accusations related to insider activity. Another example highlighted by Cointelegraph involved a trader who reportedly made about $400,000 by wagering on the capture of Venezuelan President Nicolás Maduro shortly before that news became public.
Across these cases, the common thread is not simply that traders were right—it’s that the timing of certain trades appeared unusual relative to public knowledge. Investigators and lawmakers are increasingly focused on whether that timing could reflect nonpublic access rather than genuine forecasting skill.
Lawmakers push for tighter rules around political outcome trading
Beyond platform-level surveillance, U.S. lawmakers have also signaled they want clearer guardrails for prediction markets tied to political or public-policy outcomes. Last month, Republican Representative Bryan Steil, who chairs the House subcommittee on digital assets, introduced legislation aimed at restricting members of Congress and their immediate families from trading prediction market contracts connected to public policy and political events, according to Cointelegraph’s earlier coverage.
That kind of proposal aligns with the concern surfaced by the teleprompter operator case: prediction markets can involve content that effectively becomes “public” only when a speech is delivered, an official announcement is made, or an event is confirmed. If insiders—whether due to their job duties or privileged access— can anticipate specific wording or developments, markets built on public outcomes can drift toward information asymmetry.
Even when the underlying platform uses monitoring tools, enforcement depends on whether regulators believe the trades reflect actionable misconduct under existing market rules or analogous legal frameworks. The direction of travel in U.S. policy suggests more scrutiny is likely, particularly for markets that depend on politically sensitive disclosures.
What to watch next
For investors, traders, and builders, the key unknown is how regulators frame and prove the alleged information advantage in the Kalshi case. Watch for official regulatory statements or filings from the CFTC that clarify the scope of the conduct, the standard being applied to speech-linked contracts, and whether this becomes a template for future enforcement against other prediction market participants.
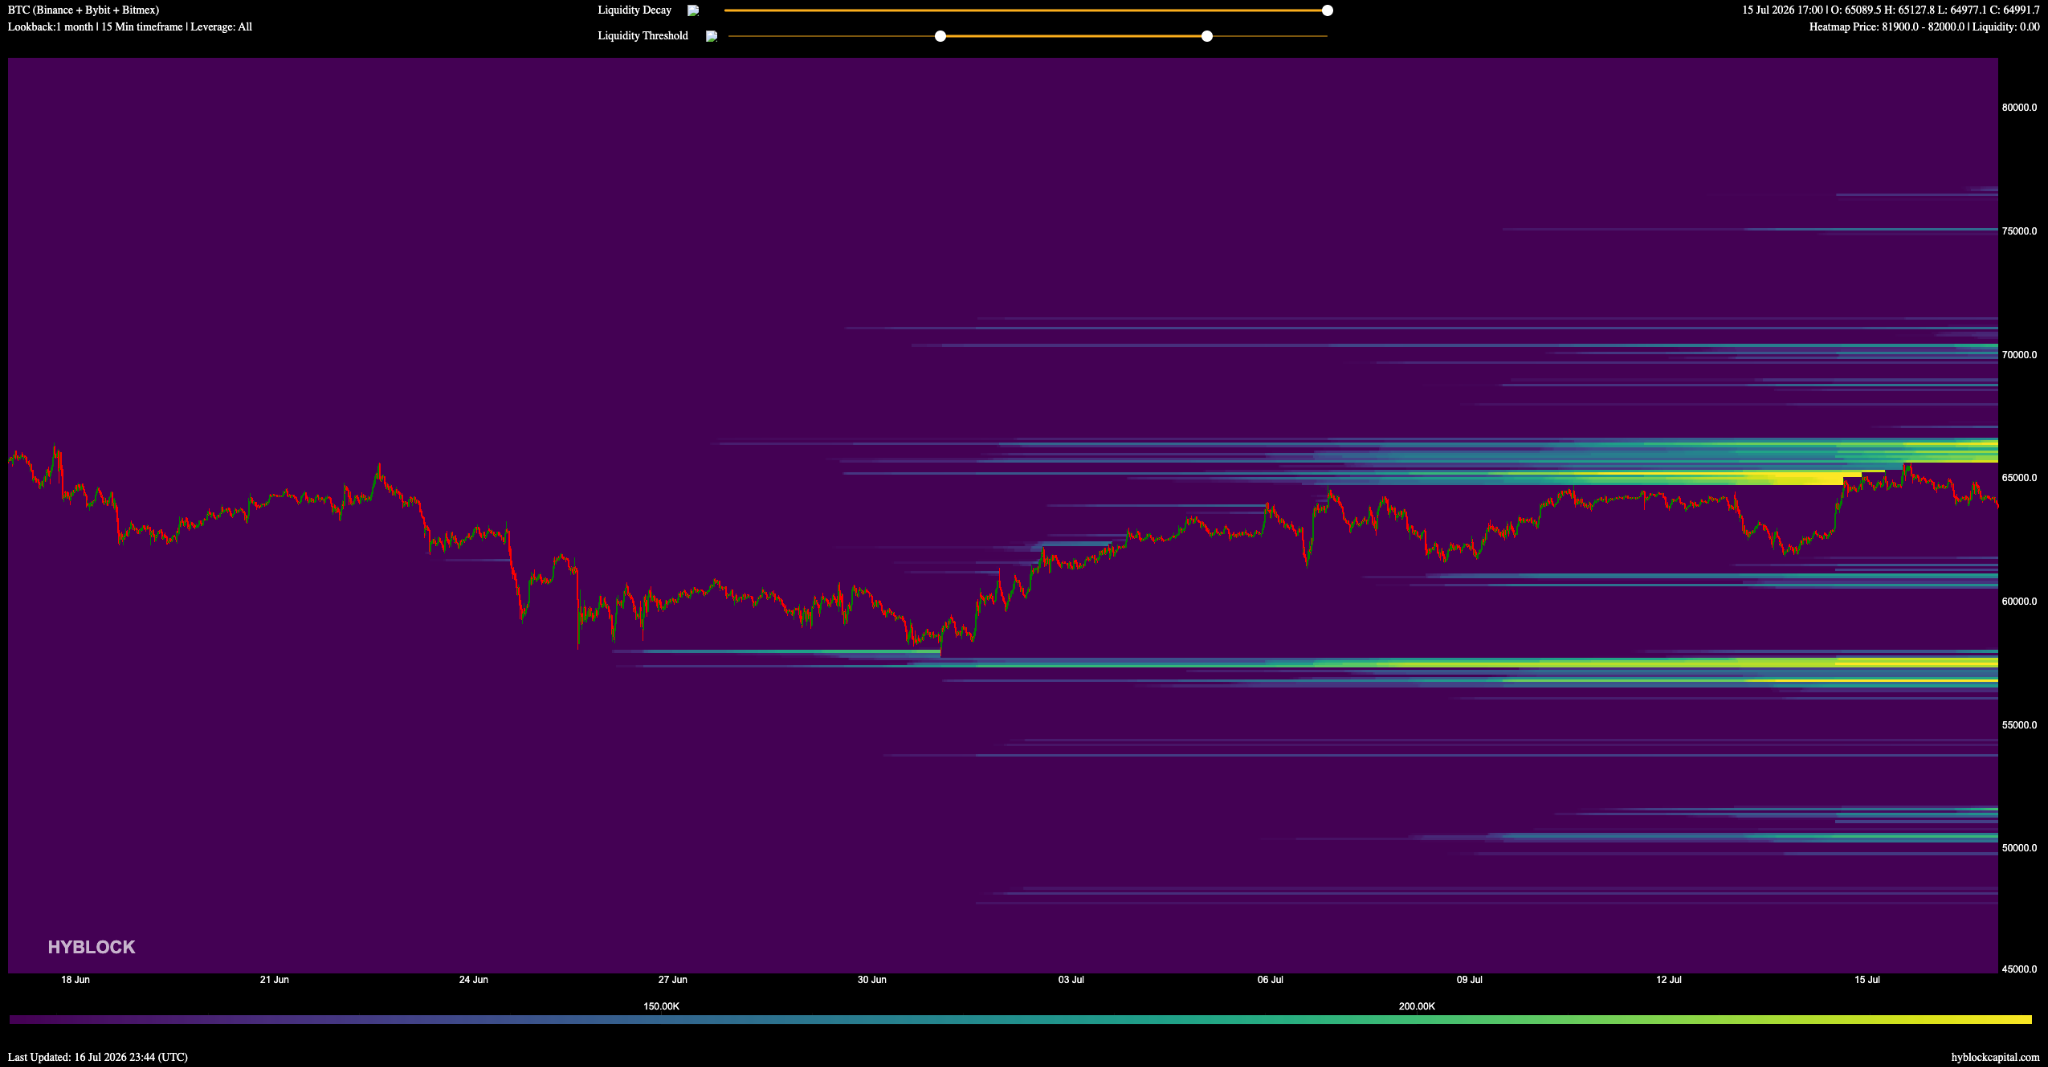
Increased activity across Bitcoin’s (BTC) futures markets is playing the dominant role in its short-term price action, which keeps tracing back to where leveraged positions are stacked. Prices tend to gravitate toward where liquidity is most concentrated, and as Bitcoin battles to hold above $64,000, reviewing current liquidation scenarios may provide insight into BTC’s next move.
Liquidation heatmap data shows a cluster of short positions concentrated between $65,500 and $66,000, roughly 3% away from current market pricing. A push through $65,600 may put that shelf in play and could accelerate a larger rally toward $67,000.
Below market pricing, support is layered in the $63,500 to $63,750 range, with the closest cluster 1% away, and larger liquidity pools are found at $63,000-$63,250 (about 1.5% down) and $62,500-$62,750 (about 2.3% down).
Combined, long-side liquidity across the tracked window outweighs short-side liquidity by nearly two to one, potentially signaling that the bulk of a leverage built up over the past month hasn’t fully closed out.
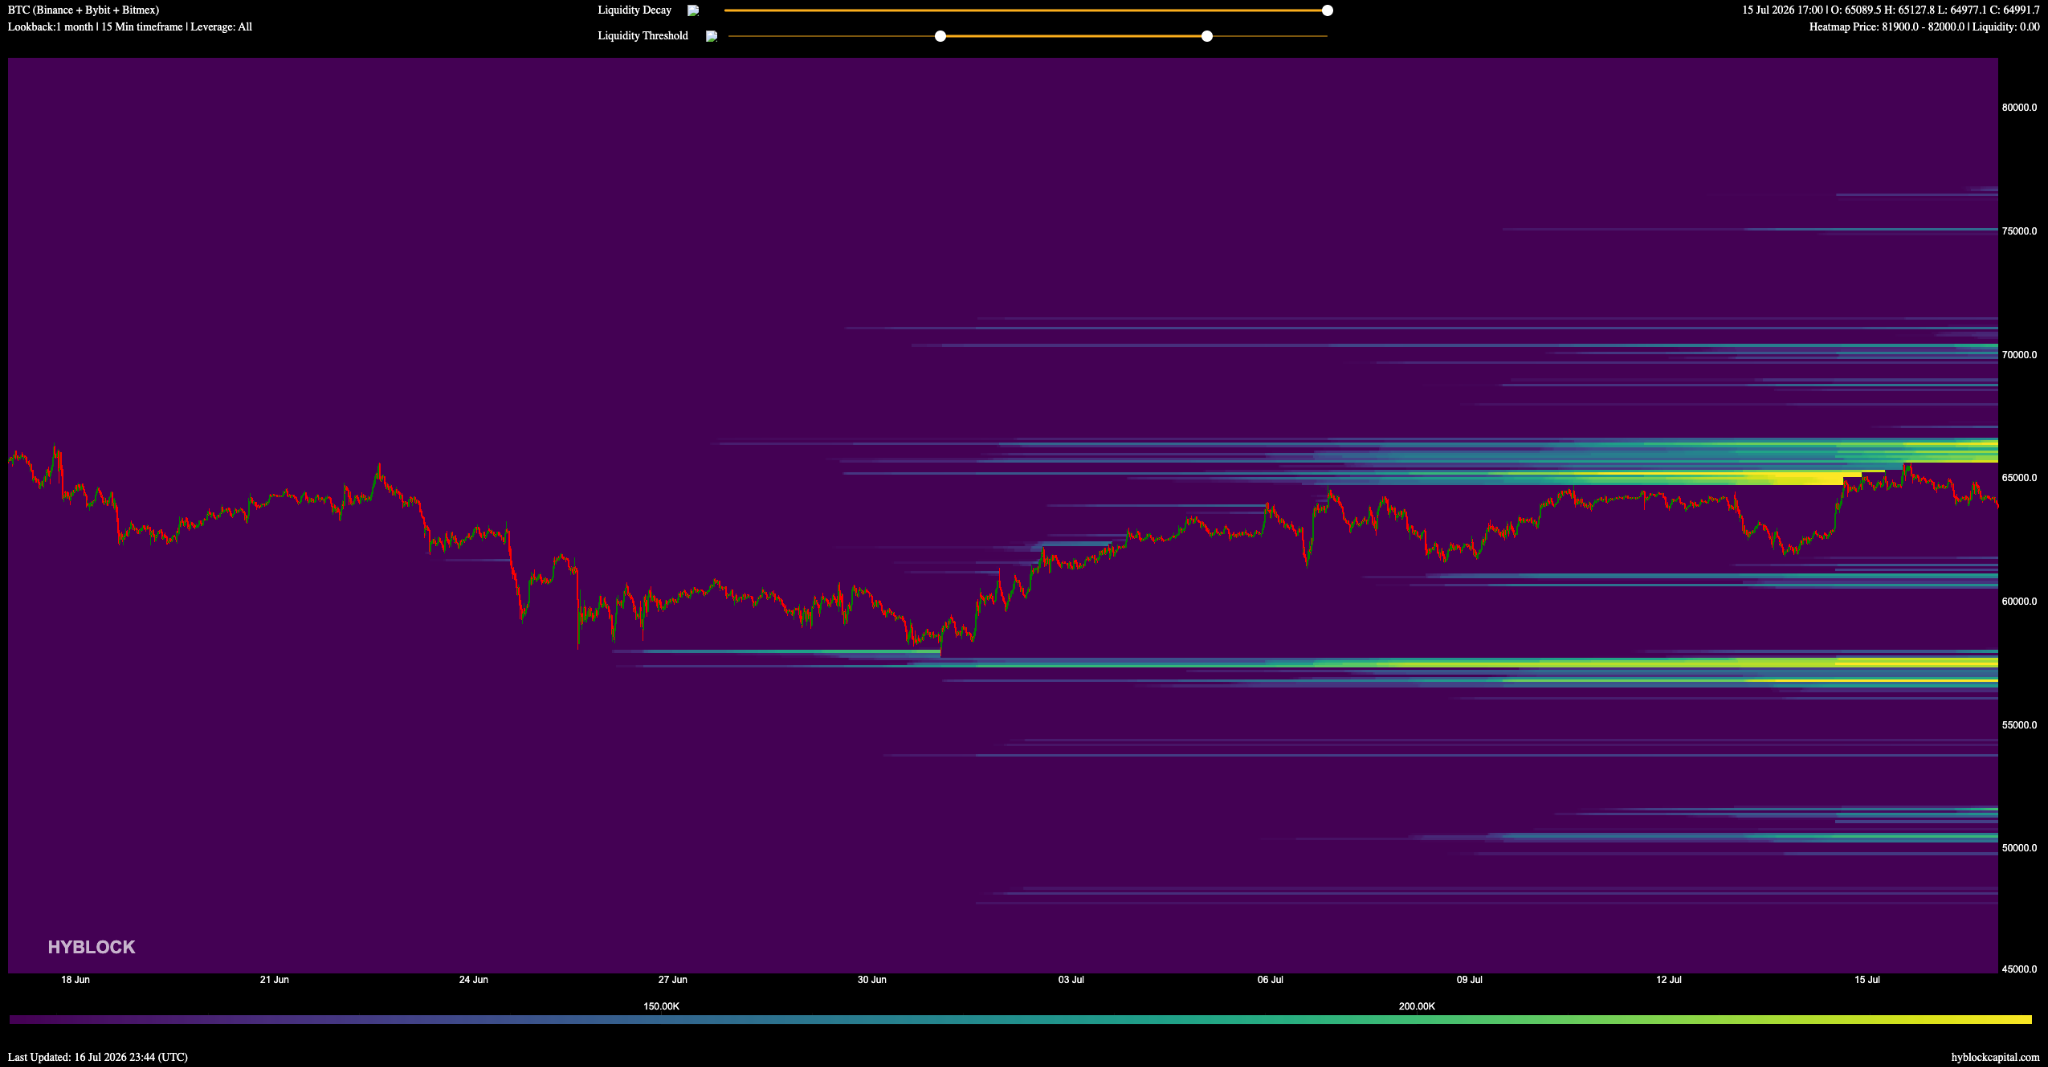
BTC liquidation heatmap, 1-month lookback. Source: Hyblock
In the most bearish scenario, a wide liquidation band near $55,000 (which has built up over the full month lookback) is visible and stands out more than almost anything else on the chart. This magnet could exert its pull on price if support in the $62,500 to $63,750 were to give way.
The last few weeks of price action suggest that Bitcoin may remain rangebound between $60,000 and $67,000, and BTC’s aggregate open interest and funding rate back this view.
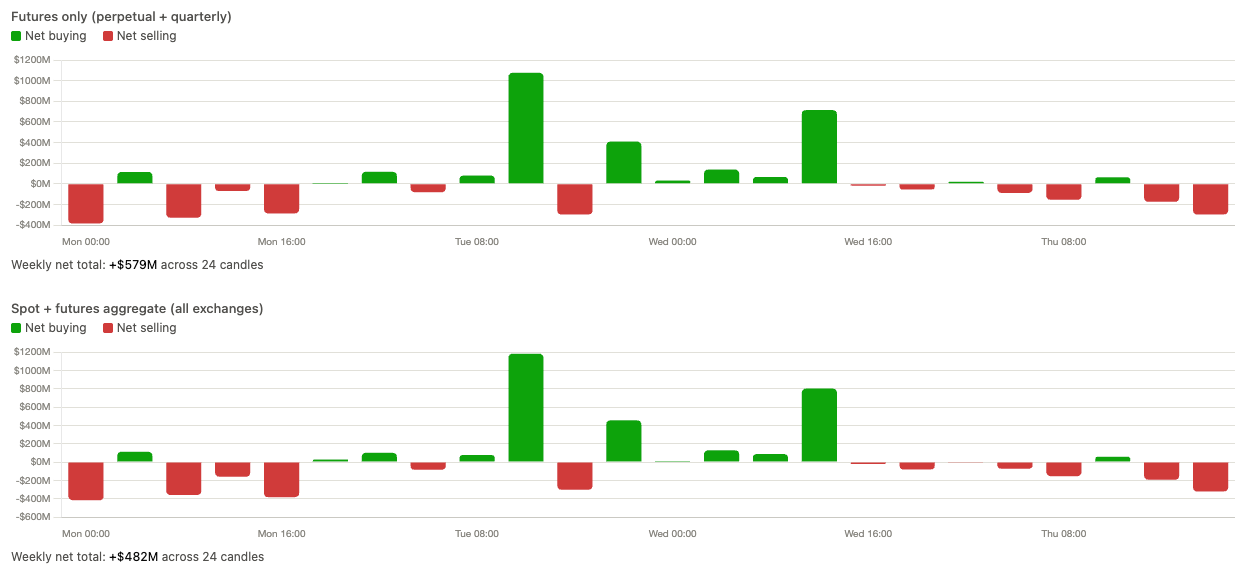
BTC spot and cumulative volume flows. Source: Hyblock
While OI has come down more than 3% from Tuesday’s peak, BTC price has barely moved, and as funding cooled toward neutral, spot and futures flows have favored the buy side over the past week.
Ethereum price has retreated from a two-month high after traders locked in profits, though analysts still expect a push toward $2,000 while key support holds.
Summary
- Ethereum price pulled back after a 5% CPI-driven rally as traders booked profits near $1,930.
- Strong support around $1,850 keeps the technical outlook intact, with $2,000 remaining the next key target.
- Liquidation clusters, ETF flows, and Fed expectations will likely determine Ethereum’s next move.
The June U.S. CPI and PPI data initially fueled a risk-on move across crypto markets, lifting ETH more than 5% before sellers emerged near a major resistance area. The rally briefly pushed Ethereum above a multi-month descending trendline, but momentum faded around $1,930 as short-term traders adopted a classic sell-the-news strategy.
The pullback drove Ethereum (ETH) price as low as $1,878 before buyers returned around the $1,880 region, which now serves as the first line of support after the breakout attempt.
Derivatives activity accelerated the reversal. Funding rates climbed as leveraged longs entered the market during the move above $1,900, leaving positions vulnerable once upside momentum stalled. The retreat triggered a wave of long liquidations across major exchanges, adding forced market-selling pressure to an already weakening spot market.
Macro markets also turned less supportive as the trading session progressed. Oil prices rebounded sharply after the inflation data, reviving concerns that energy costs could complicate the Federal Reserve’s path on interest rates.
Treasury yields moved higher alongside the U.S. Dollar Index, reducing appetite for risk assets and encouraging some investors to rotate capital toward traditional fixed-income markets instead of cryptocurrencies.
Technical structure continues to favor another test of $2,000
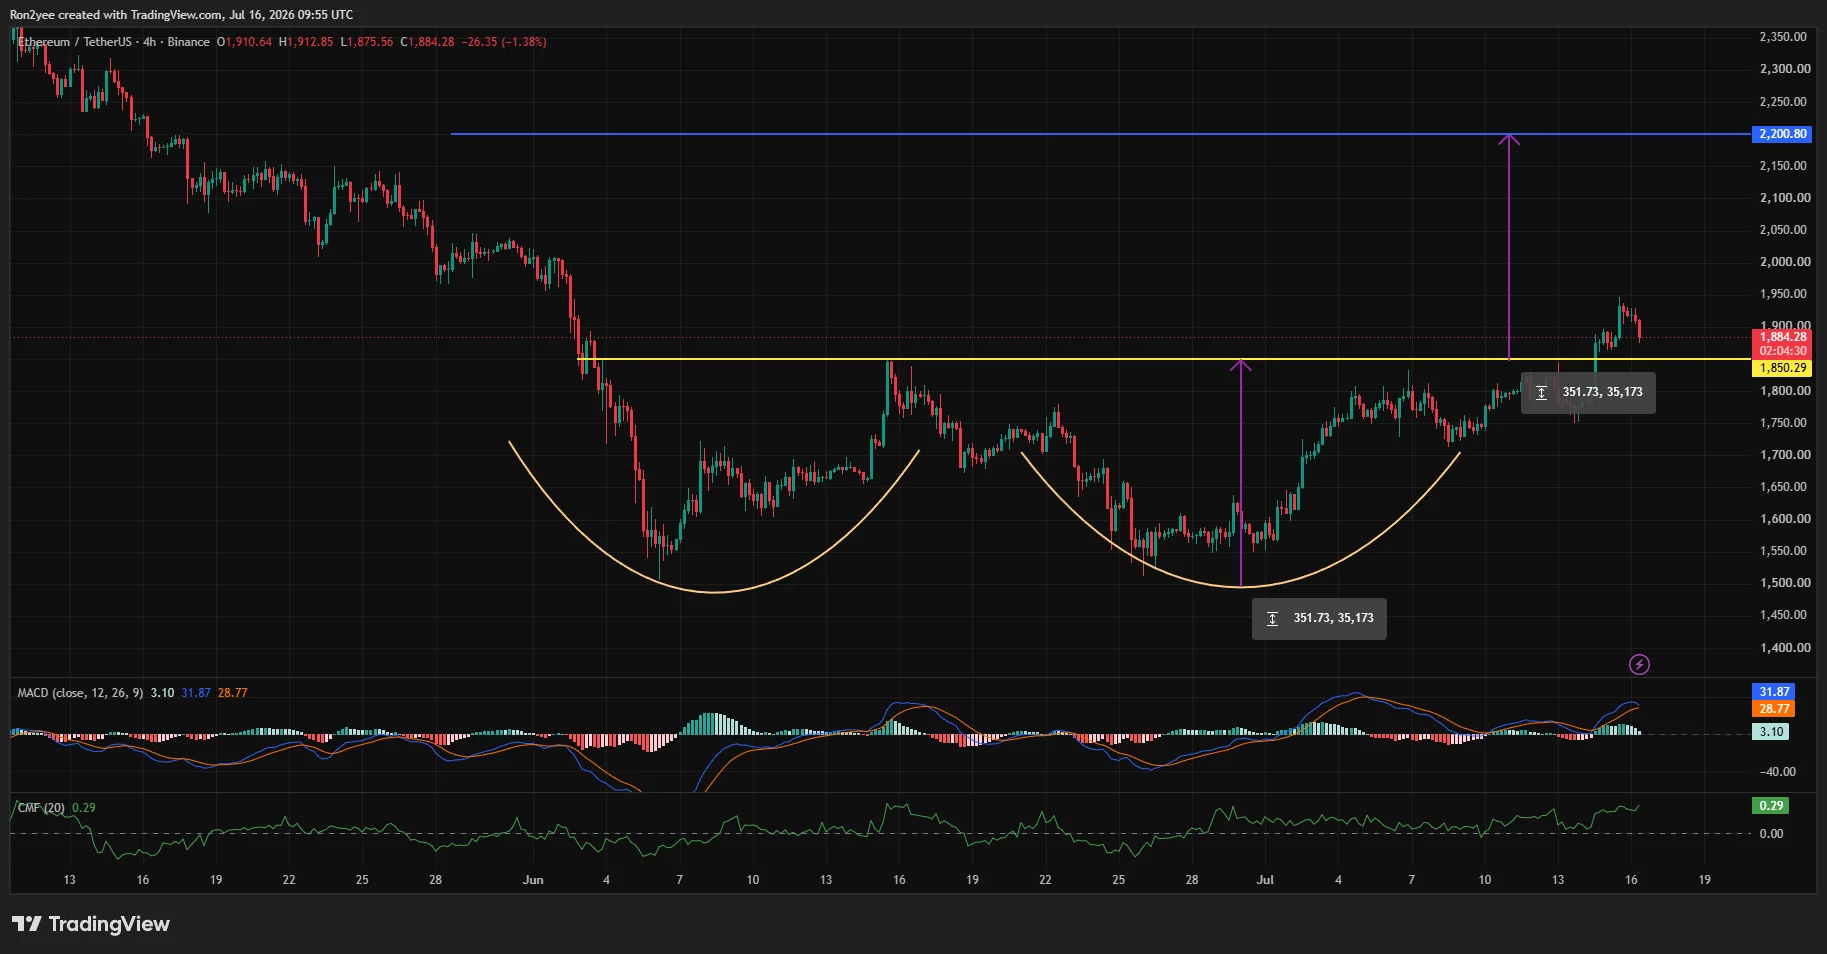
Ethereum’s 4-hour chart still presents a constructive technical picture despite the latest rejection. Price has completed a second rounded-bottom formation after rebounding from the June lows near $1,500 and recently reclaimed the horizontal resistance around $1,850.
This former ceiling now represents the primary support level, while the measured move from the pattern projects an upside target near $2,200 if buyers regain control above the recent highs.
Momentum indicators continue to lean positive. The MACD remains above the zero line with its signal line intact despite a modest slowdown after the rejection, while the Chaikin Money Flow holds around 0.29, showing capital has continued entering Ethereum over recent weeks instead of exiting the market. Together, those indicators suggest the recent decline has so far resembled profit-taking rather than a complete trend reversal.
Liquidation data also identifies the next battleground. CoinGlass’ 3-day ETH liquidation heatmap shows one of the largest clusters of leveraged positions concentrated between roughly $1,840 and $1,860, reinforcing the importance of that support zone.
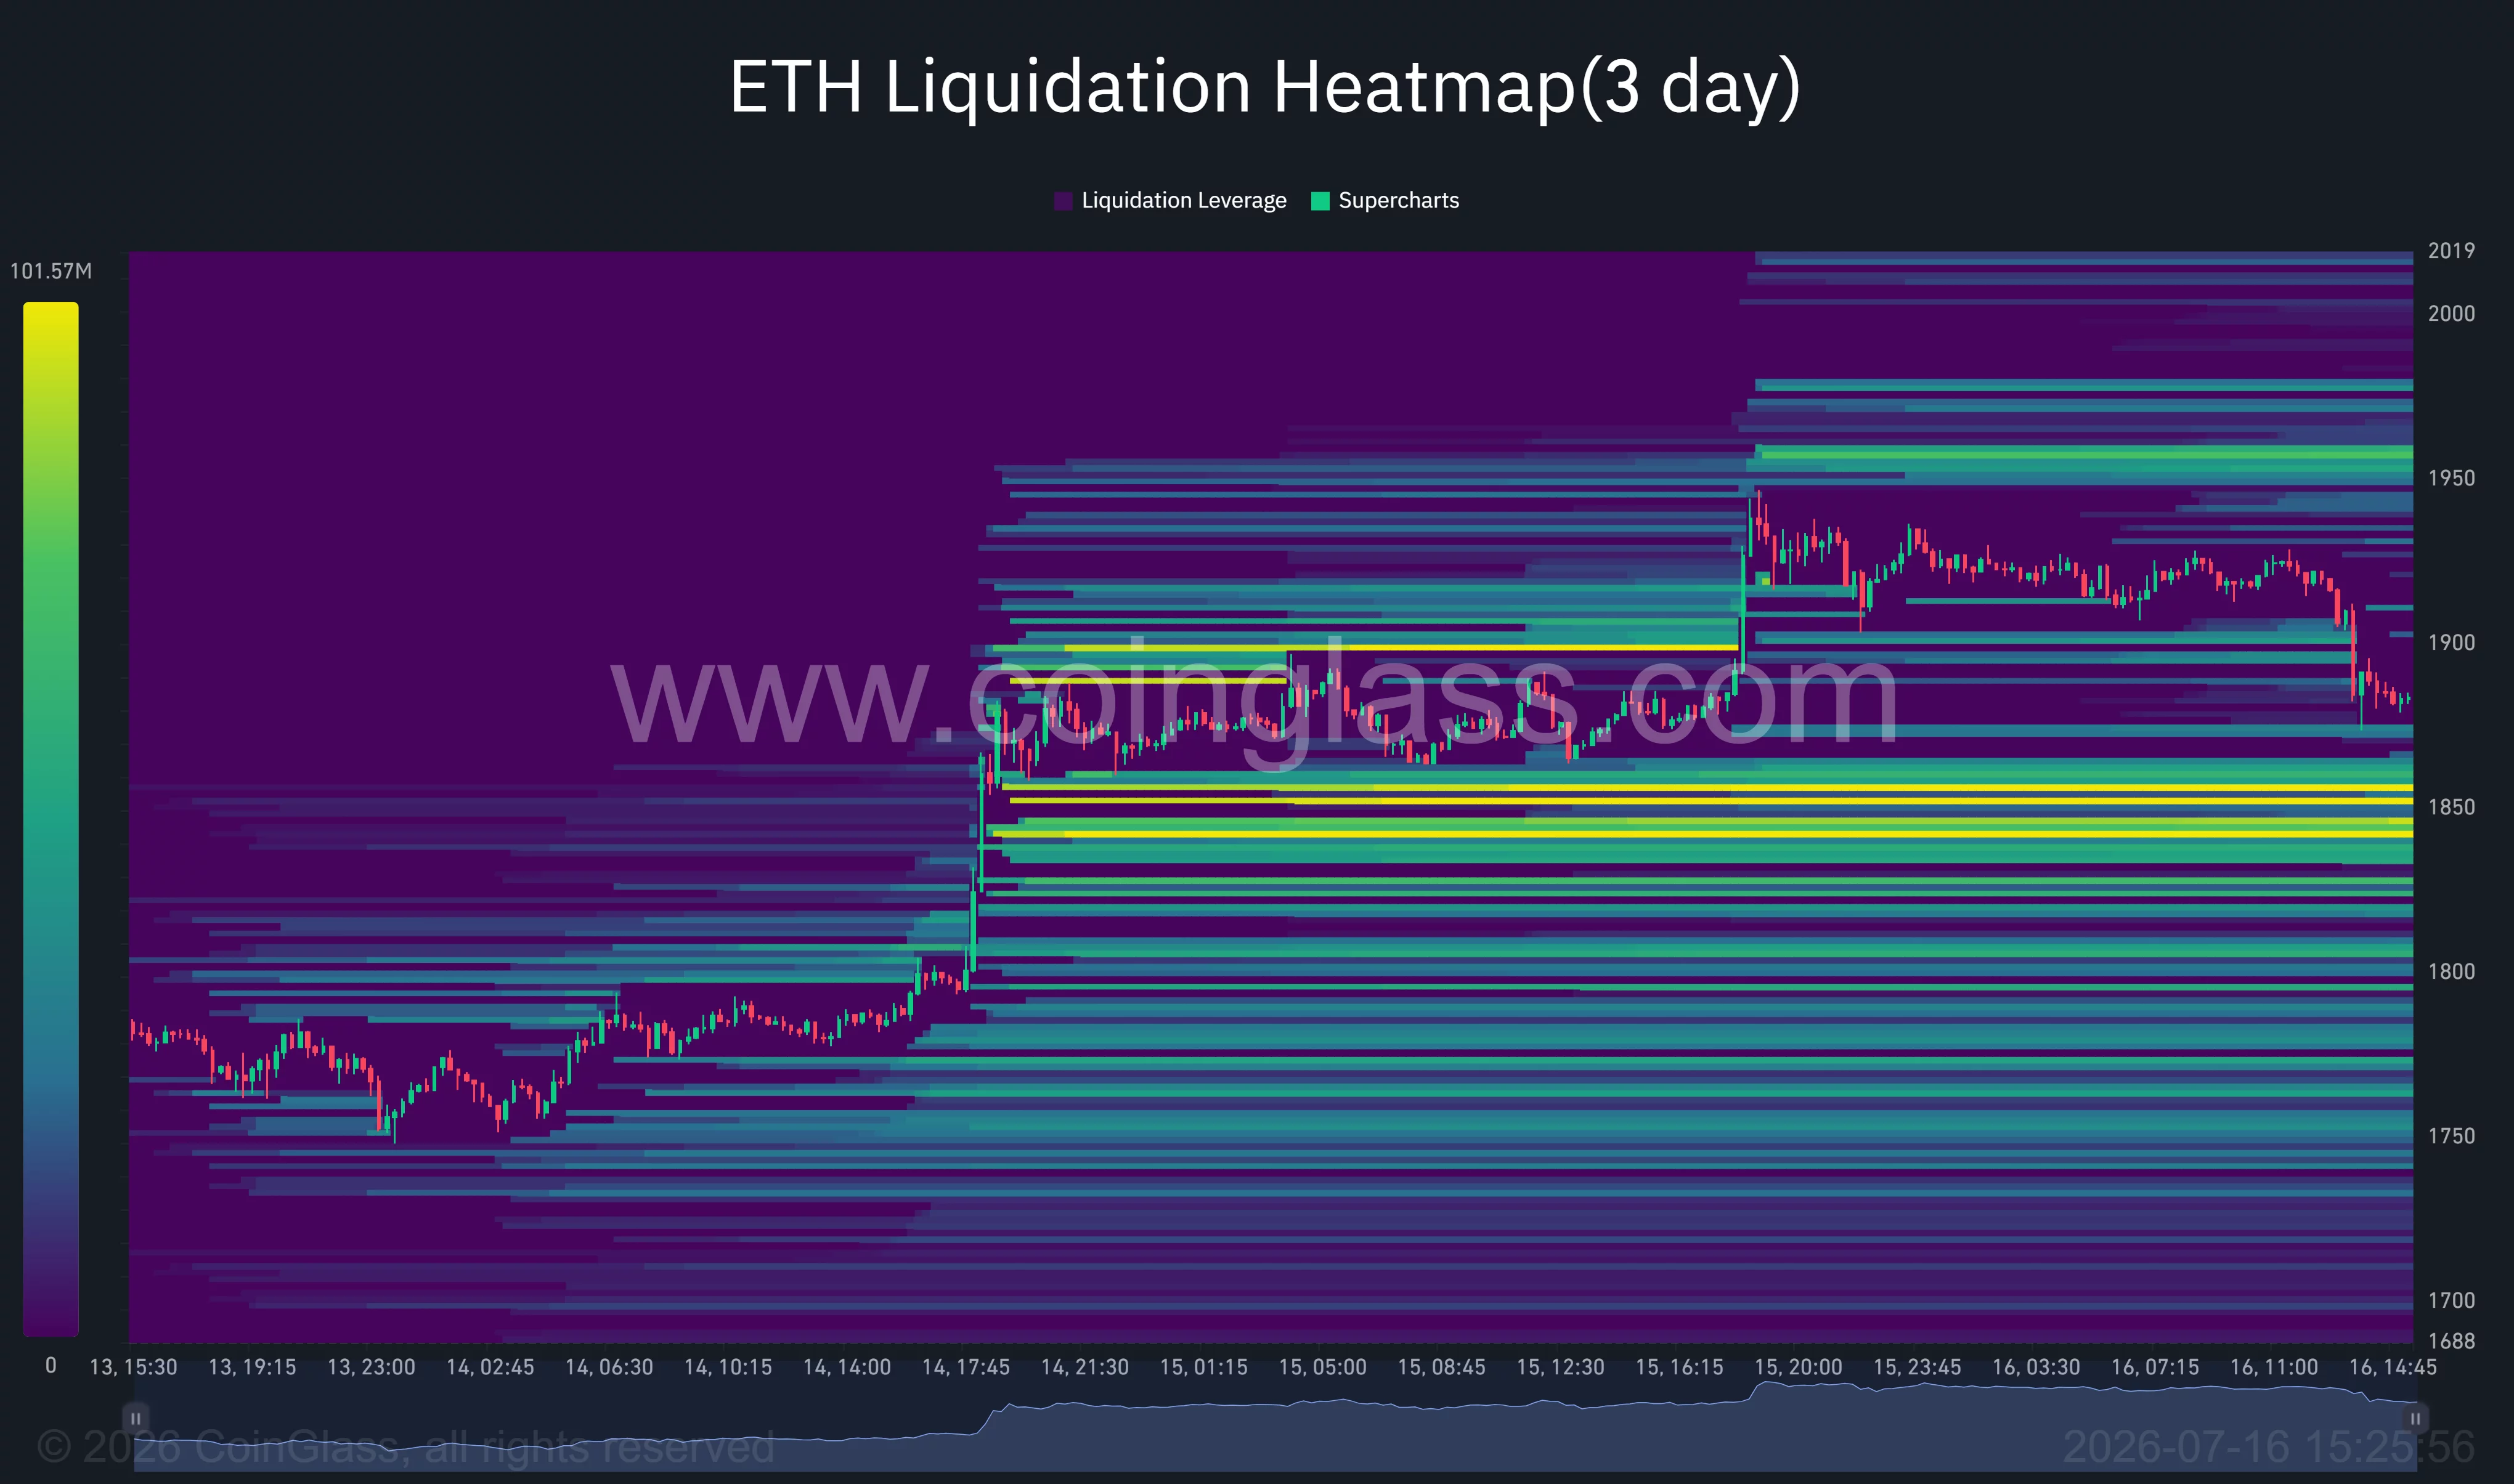
A successful defense there could allow Ethereum to target liquidity around $1,950 before challenging the psychological $2,000 level, where another large concentration of short liquidations sits waiting above price.
Commenting on the move, analyst Ted Pillows noted the recent decline remains a healthy pause rather than the start of a larger correction.
“As long as Ethereum holds above the $1,850 level, the next move will be towards $2,000.”
Separately, according to Michaël van de Poppe, the current environment remains a buy-the-dip market, adding, “There’s a lot more upside going to come on this one.”
Loss of $1,850 could delay the bullish breakout
Several risks could still invalidate Ethereum’s recovery. A decisive break below the $1,850 support would negate the recent breakout and expose the asset to a deeper retracement toward the $1,750-$1,800 region, where another concentration of liquidity has formed. Failure to hold that area would shift attention back toward the June base near $1,500.
Outside the charts, macro developments remain an important variable. Renewed strength in the U.S. dollar, higher Treasury yields, persistent spot ETF outflows, or fresh geopolitical tensions that lift energy prices could reduce demand for crypto assets again.
Exchange inflows from larger holders and continued capital rotation into AI and technology equities also present headwinds, making sustained spot buying essential if Ethereum is to convert its recent breakout into a move above $2,000.
Disclosure: This article does not represent investment advice. The content and materials featured on this page are for educational purposes only.

Rumors Point to Warriors, Cavaliers or Heat as Decision Nears at NBA Event

South Korea’s $1.45B leverage wipeout hits young traders hardest

White Sox out to continue stellar play vs. up-and-down Blue Jays


-

 Fashion6 days ago
Weekend Open Thread: Nutriplenish Leave-In Conditioner
-
 NewsBeat9 hours ago
London Mayor Sadiq Khan handed a peerage by Keir Starmer alongside 15 other Labour figures… just days before the PM leaves No10
-

 Sports7 days ago
Super Eagles star Moses Simon opens up on Liverpool transfer regret
-

 Crypto World1 day ago
CFTC blocks Kalshi from unwinding Michigan trades after court order
-

 Business22 hours ago
Nvidia Stock Slips After Big Tuesday Rally as Huang Confirms Vera Rubin Chip Is Now in Production Today
-

 Politics2 days ago
Young campaigners urge incoming PM to act on outdoor junk food ads
-

 News Videos2 days ago
XRP BOMBSHELL… XRP OMBOARDED FOR TRANSACTIONS!!!
-
 Tech3 days ago
Get Your ESP32 Sunny Side Up With This Solar Dev Board
-
 Entertainment1 day ago
Disney’s Most Ambitious Failed Star Wars Attraction Is Coming to SDCC
-

 Tech2 days ago
Dark Secrets Emerge When Jailbreaking LLMs
-

 Crypto World4 hours ago
Injective Submits SEC Transfer-Agent Registration to Onchain Ownership Records
-
 Sports1 day ago
New Cornerback Enters Vikings Trade Rumor Mill
-
 Tech3 days ago
Cloudflare Precursor Watches Your Mouse and Keyboard To Decide If You Are Human
-

 News Videos3 days ago
how to make coin bank box with cardboard #scienceproject #money #diy #shorts
-
 Entertainment1 day ago
Vicki Gunvalson Defends Discussing Heather Dubrow’s Money
-
 Crypto World3 hours ago
Claude Fable 5 Slips to Second in AI Coding Leaderboard
-
Crypto World2 days ago
Ripple, Coinbase, Circle Join Linux x402 Foundation to Help Shape AI Payments
-

 Business2 days ago
ACCC warns AI could lift insurance costs in risk-prone areas
-

 NewsBeat1 day ago
Watch: Is Donald Trump facing a popular backlash on immigration?
-

 Sports1 day ago
Michigan officials not expected to discuss AD Warde Manuel at Thursday meeting
You must be logged in to post a comment Login