

Crypto World
Allbridge Core Halts Cross-Chain Bridge After $1.65M Exploit

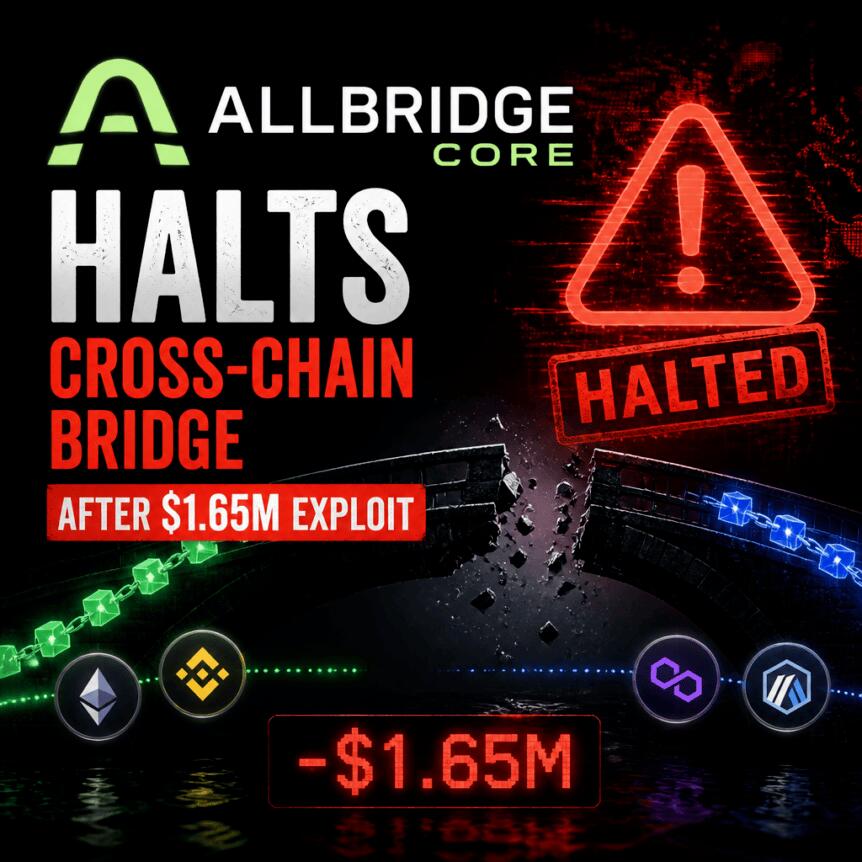
Allbridge, the firm behind the cross-chain stablecoin bridge Allbridge Core, has paused its protocol after a reported security incident on Sunday that investigators and on-chain analysts say resulted in roughly $1.65 million being drained. The company said the pause is a precaution while it investigates, and it urged users with liquidity in impacted pools to withdraw.
According to Allbridge Core’s own announcement on X, the exploit affected Allbridge Core’s deployment on Solana. Monitoring accounts cited in the incident also claim the attacker moved funds from Solana to Ethereum and then funneled proceeds into privacy-related pools, illustrating how quickly bridge exploits can turn into multi-chain extraction events.
Key takeaways
- Allbridge Core has paused its protocol following a reported cross-chain stablecoin bridge incident affecting its Solana deployment.
- The incident reportedly involved ~$1.65 million drained, with on-chain monitoring suggesting the attacker bridged funds from Solana to Ethereum.
- Liquidity providers were urged to withdraw from affected pools to limit exposure while the team investigates.
- On-chain analysis points to a flash-loan and rate-manipulation pattern that allowed the attacker to profit from a temporary pool imbalance.
- Bridge exploits are recurring: multiple reported attacks have hit different bridge systems since May, highlighting structural risk across the sector.
Allbridge Core pauses after Sunday incident
Allbridge said in a Sunday post on X that Allbridge Core was “experiencing a security incident” and that it had paused the protocol while it investigates. The firm added a direct instruction to users: if they have liquidity in affected pools, they should withdraw immediately.
The breach was reported to involve Allbridge Core’s Solana deployment. CertiKAlert later posted that the stolen funds had already been bridged from Solana to Ethereum before moving into privacy pools, according to the monitoring thread referenced by reporting shared on social media.
While the company did not provide additional technical details in the initial communication, the operational response—pausing the protocol and prompting LP withdrawals—suggests that Allbridge recognized ongoing risk rather than treating the event as a fully contained, already-resolved failure.
What on-chain reports say happened
On-chain analytics highlighted a specific mechanism consistent with recent DeFi bridge exploitation patterns. According to Onchain Lens, the attacker made a $1.12 million USDC flash loan from Kamino. The attacker then used rapid USDC/USDT swaps to distort the exchange rate inside the Allbridge Core stablecoin pool.
The same reporting indicates the attacker took advantage of the manipulated pricing by withdrawing liquidity at unfavorable-to-others rates. After extracting the difference created by the temporary imbalance, the attacker reportedly repaid the flash loan and retained the profit from the rate disruption.
Allbridge Core’s own follow-up language, as reflected in the incident discussion, referenced a “pool imbalance” that created a “temporary positive arbitrage window.” The company also suggested that if anyone took advantage of the window, they should consider returning funds, with any returned amounts intended to support compensation for affected liquidity providers.
Why this kind of bridge attack keeps repeating
This incident did not occur in isolation. The reporting notes that it is at least the sixth attack targeting a cross-chain bridge since May. Bridges are frequently attacked because they manage large pools of assets across networks—assets that back bridged tokens on the destination chain. If an attacker can manipulate pricing, liquidity, or settlement logic, the bridge’s pooled reserves can amplify losses.
In practice, these attacks often combine speed (to exploit temporary state changes) with cross-chain movement (to break the attacker’s funds away from any single environment). Sunday’s event appears to align with that playbook: on-chain monitoring suggested stolen value moved from Solana to Ethereum before being moved into privacy pools, underscoring the challenge for recovery once funds change hands across chains.
The case also highlights a persistent tension for investors and LPs: even when bridge designs rely on liquidity pools and token accounting rather than direct custodian control, attackers can still reach profit by exploiting assumptions around swap paths, price discovery, and pool invariants—especially when flash loans are available.
Allbridge Core isn’t new to flash-loan style exploits
Allbridge Core’s Sunday incident is not the company’s first exposure to flash-loan-driven manipulation. Earlier coverage and related documentation indicate that in April 2023 Allbridge was exploited for about $573,000 through a flash loan attack on Allbridge’s pool on BNB Chain.
That earlier event, as described in an analysis of the hack, involved an attacker acting as both liquidity provider and swapper, exploiting a flaw in smart contract logic that allowed them to manipulate swap prices. The outcome included drains denominated in BUSD and USDt, totaling roughly $573,000 based on the figures cited in the underlying analysis.
With Sunday’s report pointing to a similar exploitation pattern—flash loan funding, fast swaps, pool imbalance, then liquidity withdrawals—the renewed incident raises a practical question for LPs: even if a team responds by pausing the protocol, what controls exist to prevent the same class of risk from reappearing under different market conditions or on different deployments?
Cross-chain bridge attacks remain a sector-wide problem
Broader reporting shows that cross-chain bridges have faced repeated pressure from exploits across multiple ecosystems in recent months. In June, for example, Taiko urged users to withdraw assets from its bridges after a $1.7 million exploit, later reopening its bridge 11 days after completing a recovery plan. Weeks earlier, Secret Network was reportedly exploited through an “infinite mint” bug that created unbacked versions of Axelar-wrapped assets, resulting in a $4.67 million incident. Other widely reported bridge failures included Gravity Bridge, Verus Bridge, and Butter Network.
Together, these cases reinforce an important takeaway for anyone using or providing liquidity to bridge-related systems: cross-chain infrastructure concentrates both technical complexity and financial value, and the attack surface expands as protocols integrate multiple chains, wallets, swap venues, and liquidity mechanisms.
Readers should watch closely for two things next: whether Allbridge Core can determine the full scope of the impacted liquidity pools on Solana and any related deployments, and whether the team’s investigation leads to specific changes that reduce the likelihood of similar flash-loan-driven pool imbalances recurring.


Crypto asset manager Grayscale has filed with the United States Securities and Exchange Commission (SEC) to launch a Worldcoin exchange-traded fund (ETF). The ETF will list on Nasdaq under the ticker GWLD.
The WLD token registered a substantial increase following the filing, rising 4.5% to break above a descending channel on the four-hour chart.
Details Of The Filing
Grayscale filed an S-1 registration statement for the Worldcoin ETF on Monday, offering investors exposure to the WLD token. BitGo Bank & Trust will be responsible for custodying the WLD token, while BNY Mellon will act as the administrator and transfer agent, and the CSC Delaware Trust Company will be a trustee. However, the filing does not disclose liquidity providers, management fees, seed investment, or authorized participants. If approved, GWLD will hold the WLD token as its principal asset. The filing states that the trust will only hold the WLD token and process share creations and redemptions.
ETF Structure
GWLD will allow the creation or redemption of shares in blocks of 10,000. The transactions can be completed by delivering WLD tokens or cash orders using liquidity providers. According to Grayscale, the fund allows holders to gain exposure to WLD through traditional brokerage accounts, helping investors skip complexities like crypto wallets, private keys, and trading on an exchange.
However, it is unclear if the SEC will approve Grayscale’s filing or whether Nasdaq will list its shares, and Grayscale may be required to submit more amendments to secure regulatory approval.
Regulatory Pushback Against Worldcoin
Grayscale’s filing acknowledges regulatory pushback against Worldcoin, which has faced scrutiny in several jurisdictions including Spain, Portugal, Germany, Hong Kong, Brazil, Kenya, and Indonesia. WLD is the native token of the World Network, a company founded by Sam Altman and Alex Blania. The network includes several projects, including World ID, World App, World Chain, and Orb.
The crypto asset manager noted that World Network’s biometric data collection could be a product risk. It also highlighted other risks, including WLD volatility, World Chain’s centralized sequencer, and possible securities-law treatment.
Disclaimer: This article is provided for informational purposes only. It is not offered or intended to be used as legal, tax, investment, financial, or other advice.
Silver continues to balance between its dual role as an industrial metal and so-called refuge asset, and this combination largely explains the lack of a clear trend in recent weeks. Shifting expectations for central bank interest rates can influence the appeal of a non-yielding asset such as silver, while the structural supply deficit remains supported by growing investment demand, offsetting more subdued industrial consumption. These opposing forces help explain why silver prices continue to trade within a broad range, with the market still lacking a decisive catalyst for a sustained directional move.
XAG/USD: Technical Picture
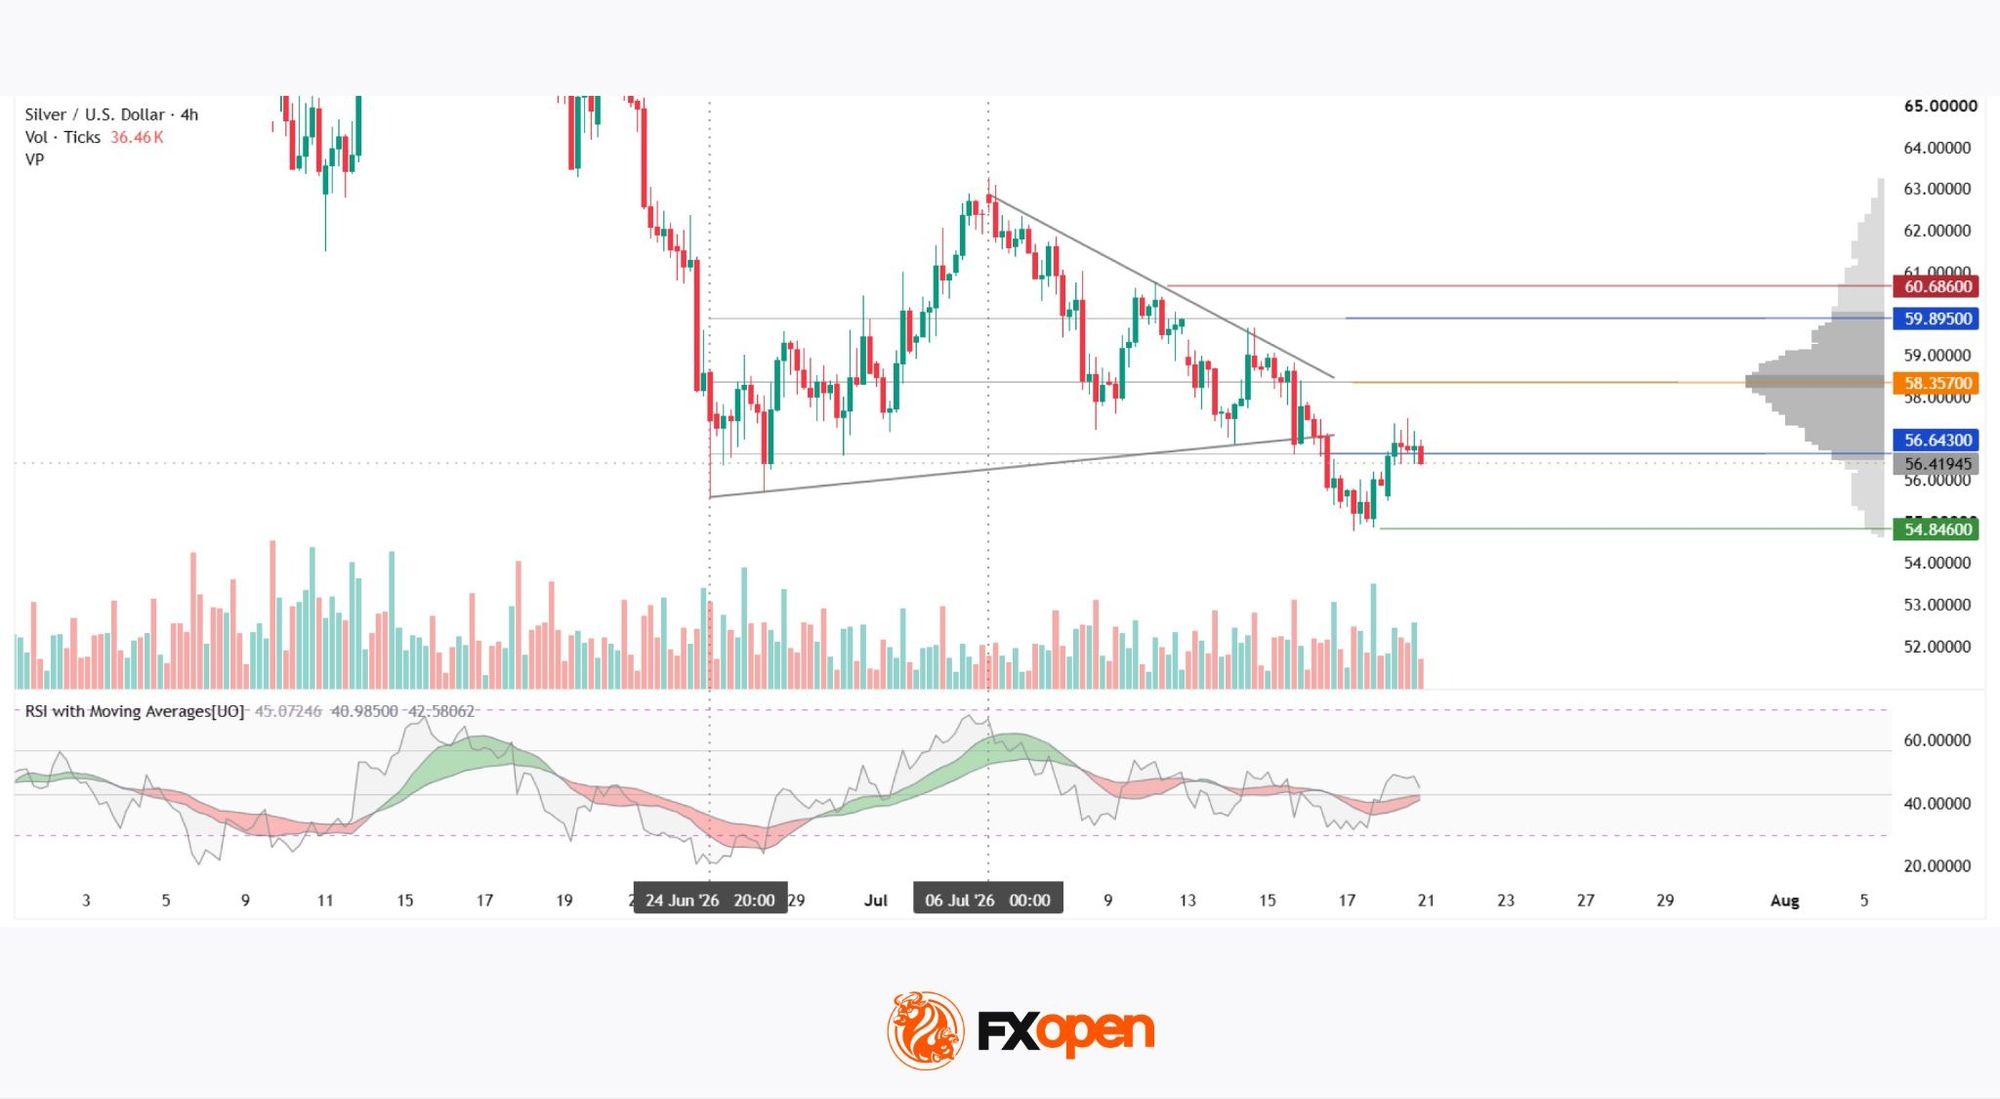
On the four-hour chart, silver (XAG/USD) is trading within a structure resembling a triangle. The descending trendline connects the swing highs formed after the peak near $63.000, while the ascending trendline links the series of higher lows from the $56 area. Their convergence coincides with the current high-volume area of the market profile.
Following an attempted breakout, the price is now testing the lower boundary of the profile at $56.643 from below. If this level continues to act as resistance, the next notable support could be found near $54.846.
Should the price move back into the range, the Point of Control (POC) at $58.357 and the upper boundary of the profile at $59.895 could become the primary upside reference levels, followed by the red resistance level at $60.686.
At the same time, vertical volume has not shown the decline in trading activity that is typically associated with a triangle pattern as the range narrows. The RSI + MAs indicator currently shows readings of 45, 40, and 42. The moving averages remain red, are pointing higher, and are positioned just below the neutral zone, while the RSI line itself has yet to break out of that neutral range.
Summary
The attempted breakout from the triangle has so far failed to gain momentum, with the price returning to the market profile boundary. Meanwhile, the RSI + MAs indicator does not yet confirm either a bullish or bearish scenario. The Federal Reserve meeting on 28–29 July could become the next major catalyst, potentially determining the market’s next directional move.
Start trading commodity CFDs with tight spreads (additional fees may apply). Open your trading account now or learn more about trading commodity CFDs with FXOpen.
This article represents the opinion of the Companies operating under the FXOpen brand only. It is not to be construed as an offer, solicitation, or recommendation with respect to products and services provided by the Companies operating under the FXOpen brand, nor is it to be considered financial advice.
Crypto World
Reserve Transparency Built Through Continuous Operation: Matrixdock Marks Two Years of Independent Verification
If tokenized reserve assets are going to serve as collateral and support lending, treasury management, and settlement across on-chain finance, their backing must remain continuously verifiable.
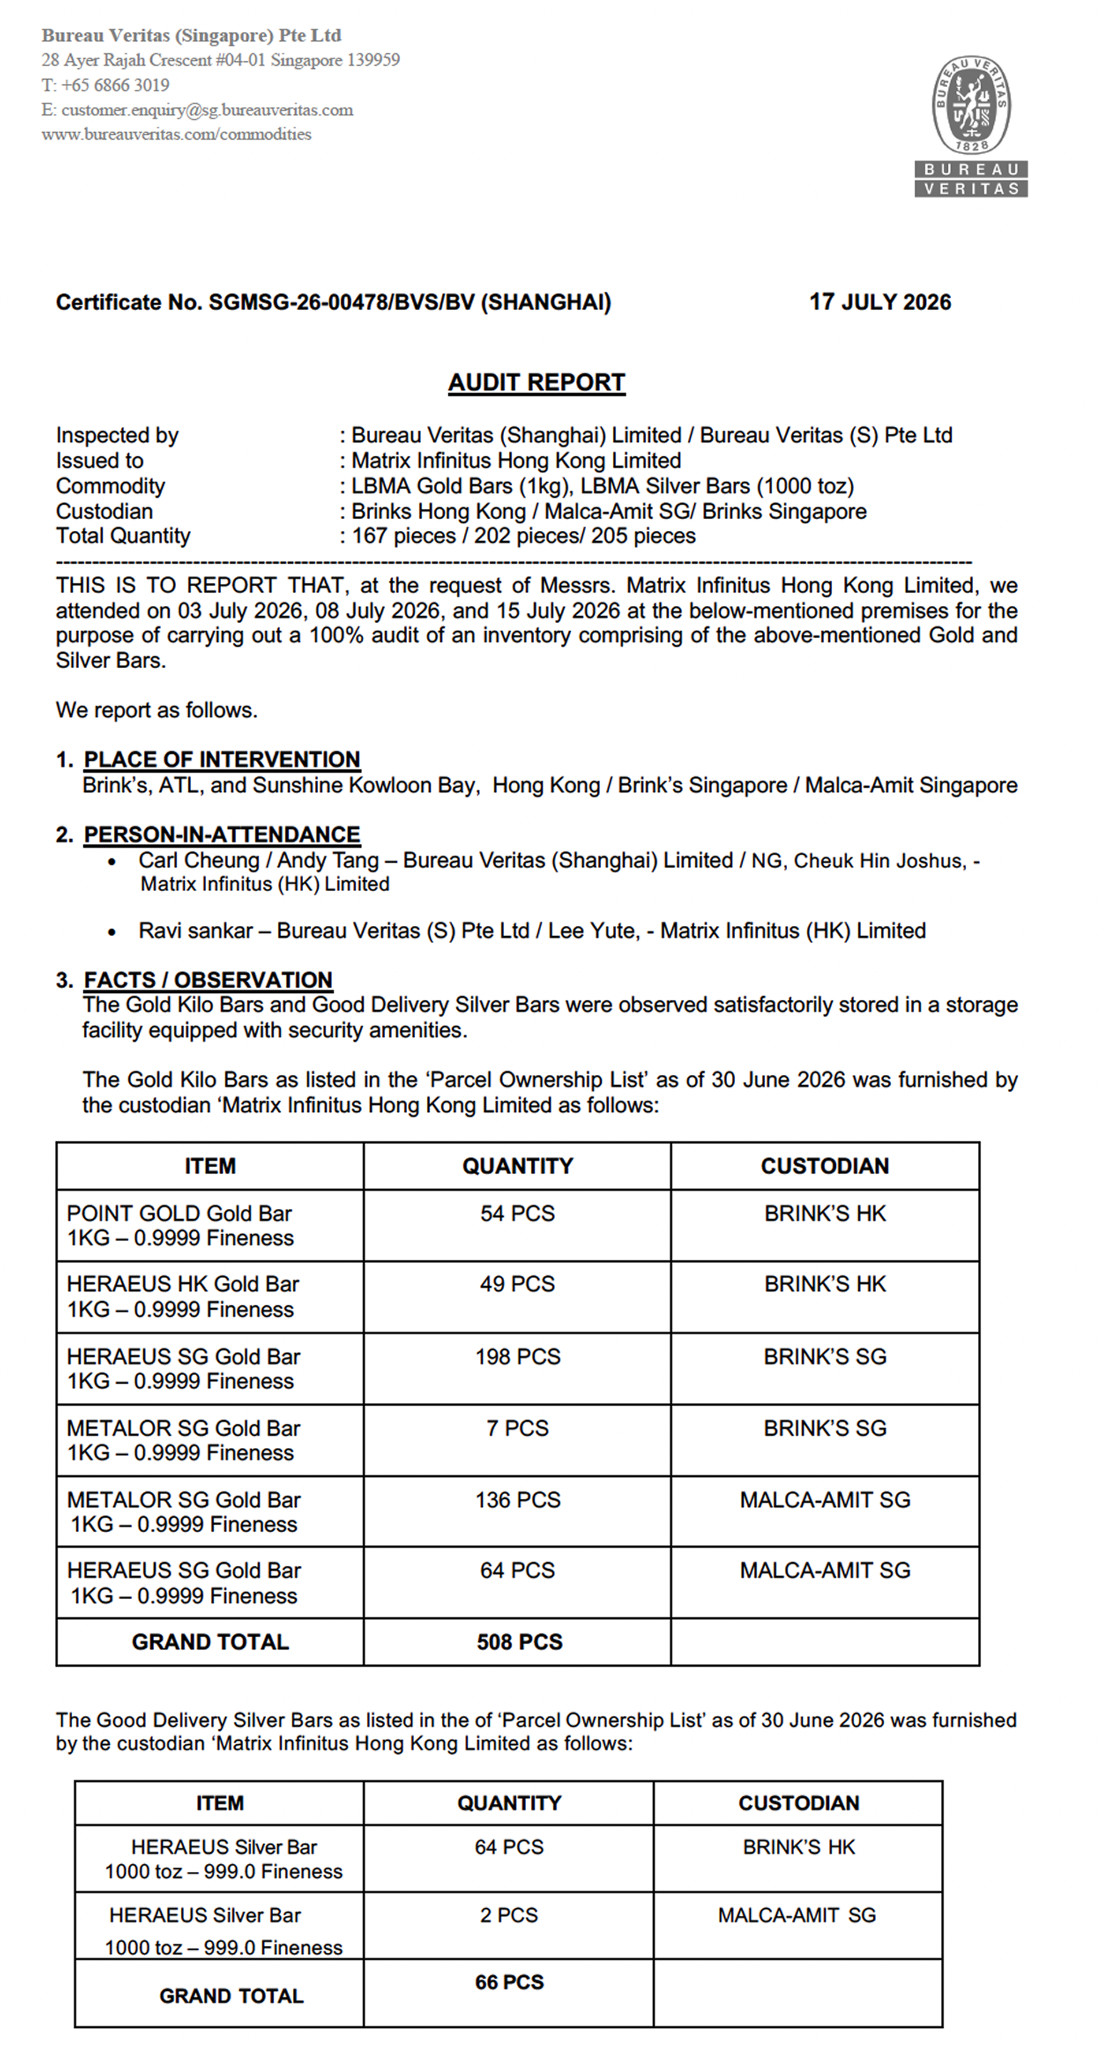
Today, Matrixdock has completed its fourth consecutive semi-annual independent reserve audit with Bureau Veritas. For the first time, the audit extends beyond Matrixdock’s tokenized gold product (XAUm) to include its tokenized silver product (XAGm). More than another audit milestone, this reflects Matrixdock’s broader commitment: building reserve assets that institutions, ecosystem partners, and builders can use with confidence.
Two Years of Continuous Verification. One Operating Standard.
By completing two years of reserve audits with the same independent auditor, Matrixdock has established a consistent verification process. That continuity gives Bureau Veritas a deeper understanding of Matrixdock’s reserve structure and positions them to better identify inconsistencies should they arise. Recurring audits are a form of proof: a verification process that operates consistently over time.
As tokenized assets become increasingly integrated into financial infrastructure, long-term trust is built through continuous operation.
The Reserve Transparency Stack
Reserve transparency at Matrixdock is built in layers of verification that together give holders ongoing visibility into the assets backing each token. Matrixdock calls this the Reserve Transparency Stack.
Independent Verification: Inside the July Audit
Bureau Veritas physically verified the underlying precious metal reserves, confirming that reserve holdings remain consistent with Matrixdock’s records.
As in previous audit cycles, the inspection was conducted bar by bar covering 574 gold and silver bars from LBMA-accredited refiners across three institutional vault facilities:
- Malca-Amit Singapore (conducted on 3 July 2026)
- Brink’s Hong Kong (conducted on 8 July 2026)
- Brink’s Singapore (conducted on 15 July 2026)
Each bar was individually weighed and measured. 26 gold bars have been added since the H2 2025 audit, and 66 silver bars are included for the first time this cycle.

Gold (XAUm)
- Total gold audited: 508 bars
- Equivalent weight: 16331.184 troy ounces
- XAUm circulating supply: 16331.179 tokens
- EVM chains (Dune): 11242.657 tokens
- Sui network (Suiscan): 2677.413 tokens
- Solana network (Solscan): 1575.248 tokens
- Stellar network (Stellar expert): 771.552 tokens
- Approximate market value: USD $66.09 million, based on gold at $4,046.86 per troy ounce
Silver (XAGm) – new to this audit
- Total silver audited: 66 bars
- Equivalent weight: 65,934.000 troy ounces
- XAGm circulating supply: 65998.551 tokens
- Ethereum network (Etherscan): 33004.219 tokens
- Sui network (Suiscan): 32990 tokens
- Current ozPerToken value: 0.999021918
- Approximate market value: USD $4.04 million, based on silver at $61.24 per troy ounce
Each bar was reconciled against the relevant vault records with no discrepancies identified. As of the audit date, XAUm reserves were consistent with the circulating token supply, and XAGm reserves were consistent with the circulating token supply when applying the applicable ozPerToken value.
Ongoing Transparency
A semi-annual reserve audit is one layer of verification. Between audits, holders can check monthly reserve asset statements, on-chain proof-of-reserves for the precious metals products, and the Gold Allocation Lookup tool, which maps specific gold bars to tokens so holders can verify the backing directly. Together, these provide a running record rather than periodic snapshots.
Building the Reserve Layer requires continuous improvement. Looking ahead, Matrixdock is evaluating opportunities to work with global third-party service providers that could strengthen asset-level verification for off-chain reserves while preserving client-level privacy.
Continuous Transparency as the Reserve Layer Discipline
Reserve transparency is the foundation that makes reserve assets trusted enough to participate confidently across on-chain finance.
When reserve backing can be verified at any time, a reserve asset can move deeper into on-chain finance: held in treasuries, integrated into financial applications, and used as collateral in lending markets. By reducing uncertainty around backing, verification expands what a reserve asset can do. That is why reserve transparency is a product feature at Matrixdock.
This is the work of building the Reserve Layer for on-chain finance. As tokenized assets evolve from simple representations into financial infrastructure, their quality will be defined by how well their backing holds up to verification, cycle after cycle. The fourth consecutive semi-annual reserve audit reflects Matrixdock’s long-term commitment to building the Reserve Layer.
Read the full Bureau Veritas audit report here.
The post Reserve Transparency Built Through Continuous Operation: Matrixdock Marks Two Years of Independent Verification appeared first on BeInCrypto.

Bitcoin mining stocks jumped Monday as Hut 8 and IREN announced large-scale moves into AI infrastructure and cloud services, renewing investor interest in the sector’s ongoing pivot away from pure mining economics.
According to the early trading data cited in the report, shares of IREN, Cipher Digital, CleanSpark, Hut 8 and MARA Holdings each rose at least 11% on Monday. The catalyst came from two major announcements: Hut 8’s disclosure of a 15-year, $9.8 billion lease for its AI data center campus and IREN’s filing detailing $2.8 billion in cloud services contracts with AI developers (as stated in IREN’s SEC disclosure, https://www.sec.gov/Archives/edgar/data/1878848/000114036126028871/ef20078253_ex99-1.htm).
Key takeaways
- Hut 8’s $9.8 billion, 15-year AI campus lease and IREN’s $2.8 billion cloud contract disclosure helped drive broad gains across mining-related stocks.
- IREN expects its AI cloud business to exceed $4 billion in annual recurring revenue by the end of 2026.
- The rally tracked improvements in broader tech sentiment, including gains in Nasdaq and the Philadelphia Semiconductor Index.
- Industry momentum remains complicated by funding needs and investor scrutiny around insider selling.
AI infrastructure deals spark a sector-wide rerating
The Monday move wasn’t isolated to a single name. The report ties the rally to two specific, capital-intensive developments that place miners closer to demand centers tied to AI computing: large data center capacity and contracted cloud services.
Hut 8’s planned AI data center expansion is anchored by a long-term lease for a campus that, if executed as described, would materially increase its ability to host high-performance workloads. IREN’s SEC filing, meanwhile, highlights cloud services contracts with AI developers totaling $2.8 billion—an important distinction because it points not just to infrastructure buildout, but to service demand lined up in advance.
These developments build on the broader theme that has defined the sector over the past year: miners increasingly market themselves as energy and compute providers for AI-era workloads, not only as facilitators of bitcoin production. The report also notes that these companies began as bitcoin miners before accelerating that pivot as mining profitability faced sustained pressure.
Financial outlook and the AI infrastructure index
IREN’s disclosure included a forward-looking revenue target for its AI cloud unit. The report states that IREN expects the business to generate more than $4 billion in annual recurring revenue by the end of 2026. While such targets are inherently dependent on execution, contracting, and customer adoption, recurring revenue projections are typically more attractive to investors than purely speculative growth narratives—particularly for companies spending heavily to expand computing capacity.
The rally also showed up in a sector indicator maintained by The Energy Mag. The report references the TEM AI Infrastructure Growth Index, which tracks 20 companies spanning bitcoin mining, “neocloud,” and AI infrastructure. It rose 1.4% on Monday and is up more than 12% over the past week, suggesting that market optimism extended beyond a handful of headlines into a broader “AI infrastructure” trade.
Broader tech markets lift semiconductors and risk appetite
Mining stocks did not rise in a vacuum. The report links the move to a wider rebound in technology-related equities, noting that the Nasdaq Composite Index added 0.9% by midday. It also points to strength in the Philadelphia Semiconductor Index, which climbed 2% after having entered a technical bear market the prior week.
For investors positioning for AI growth, semiconductor demand is often viewed as a key upstream signal. The report defines a technical bear market as a decline of 20% or more from a recent high, underscoring that semiconductors were already in a stress phase before the bounce. Monday’s rebound in chip-related equities may have helped create a more favorable risk environment for companies perceived as beneficiaries of AI buildouts.
Volatility, funding gaps, and insider-selling scrutiny
Despite Monday’s positive reaction, the report emphasizes that the mining-to-AI transition remains a source of volatility. It highlights that bitcoin mining stocks have moved sharply this year as companies struggle with a weaker mining environment while trying to finance expensive AI and cloud initiatives.
According to the report’s reference to Blocksbridge Consulting, the AI pivot has driven a “re-rating” across the sector—but the change in narrative has also increased scrutiny, particularly around insider stock sales. The report points to a Blocksbridge-linked analysis in a Miner Weekly newsletter that flagged insider sales at TeraWulf, Riot Platforms, Core Scientific and Cipher Mining. The transactions were described as being executed under prearranged trading plans, but the concern among investors is essentially strategic: whether enthusiasm for AI growth has pushed share prices to levels that make executive selling look opportunistic.
On top of market optics, funding needs remain a central unresolved issue. The report cites Blocksbridge’s estimate that the industry will require another $50 billion to realize its AI ambitions, with IREN described as facing the largest funding gap at roughly $21.1 billion. That estimate frames the rally’s biggest tension: investors may be buying into AI-related growth claims, but companies still face the practical question of how quickly and efficiently they can raise capital and convert planned capacity into contracted revenue.
As the sector digests today’s announcements and broader tech sentiment, investors will likely focus on two things next: whether miners can translate AI infrastructure spending into durable, contracted recurring revenue, and whether scrutiny over insider selling and financing timelines intensifies as expectations rise.
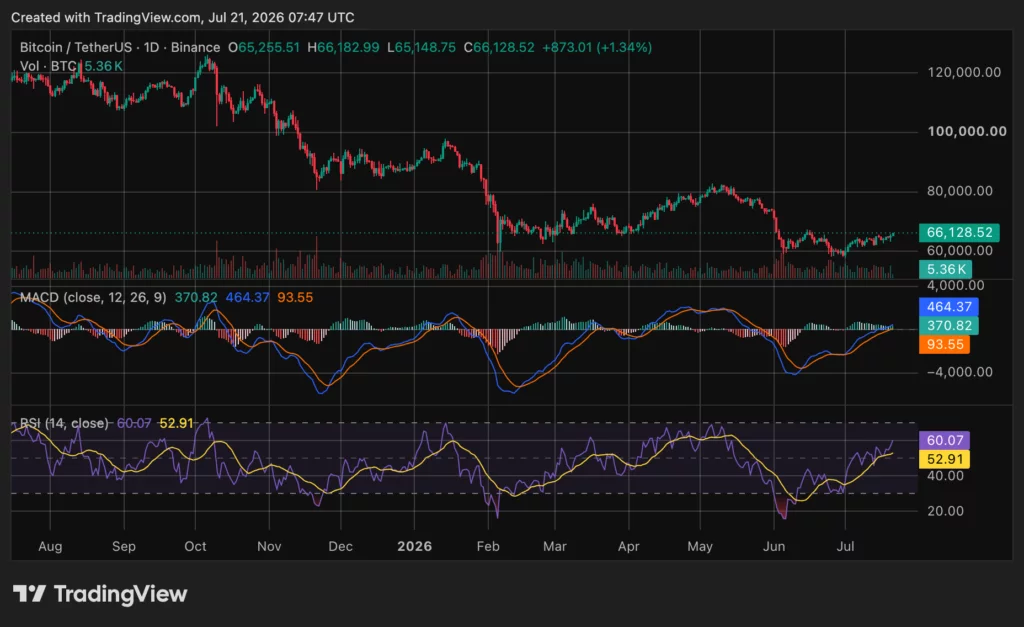
Bitcoin returned above $65,000 on Tuesday as a rebound in Asian technology stocks restored some risk appetite after last week’s semiconductor selloff.
Summary
- Bitcoin reclaimed $65,000 as Asian chip stocks rebounded and broader risk appetite strengthened across markets.
- U.S. spot Bitcoin ETFs extended inflows to five sessions, adding fresh institutional support for prices.
- MACD and RSI readings improved, while $70,000 remains BTC’s next major technical resistance level ahead.
At the time of writing, crypto.news price data showed BTC trading around $65,245, up 1.23% over 24 hours and 5.02% over seven days. Trading volume stood near $32.18 billion.
The broader crypto market also moved higher. Crypto.news showed Ethereum near $1,901, XRP around $1.11, Solana at $77.73, BNB near $571 and Hyperliquid around $62.49. Dogecoin traded near $0.073. The gains followed a sharp reversal across Asian equity markets, where South Korea’s Kospi rose 4.7%, Japan’s Nikkei gained 2.8% and Taiwan’s Taiex climbed 3.6%.
Bitcoin recovers as Asian chip stocks reverse losses
The Bitcoin rebound followed the same part of the market that drove last week’s decline. Semiconductor and artificial intelligence stocks had sold off sharply as investors questioned high valuations and reacted to new competition from China’s AI sector. Bitcoin fell below $64,000 as the technology selloff spread across global risk assets.
Buyers returned to many of those stocks on Tuesday. Samsung Electronics, SK Hynix and Taiwan Semiconductor recovered alongside broader Asian benchmarks. BTC moved with the improved market mood and briefly reached its highest level in roughly two weeks. The move continued a recovery from the June low area near $58,000 to $60,000.
Oil also offered some support to risk markets. Brent crude fell about 1% toward $88 after reports that mediators had proposed a 10-day ceasefire between the U.S. and Iran. Fighting remains active and no agreement has been confirmed, but the pullback in oil eased some pressure from the previous two sessions.
Five-day ETF inflow streak supports recovery
U.S.-listed spot Bitcoin ETFs have also turned positive after a difficult stretch of withdrawals. According to SoSoValue data, the funds attracted $226.9 million on Monday, extending net inflows to five consecutive sessions and bringing the total across the streak to about $727.3 million.
The return of ETF demand follows heavy selling earlier in the summer. More than $4 billion left U.S. spot Bitcoin ETFs during June, while a 13-session outflow streak between May and early June removed roughly $4.37 billion. The recent shift therefore marks a clear change from the sustained redemptions that weighed on the market.
Institutional flows have not been the only source of accumulation. Large Bitcoin wallets accumulated about 270,000 BTC worth roughly $16.7 billion during a period when ETFs were recording heavy withdrawals. That divergence placed more attention on whether renewed ETF buying could add another source of demand during the recovery.
Bitcoin indicators improve as $70,000 becomes next test
Bitcoin’s daily chart shows stronger short-term momentum after the recovery from its June lows. The chart data supplied with the market update places the MACD line near 464.37, above the signal line at about 93.55, while the histogram remains positive around 370.82. That structure shows that buying momentum has strengthened from the previous downside phase.
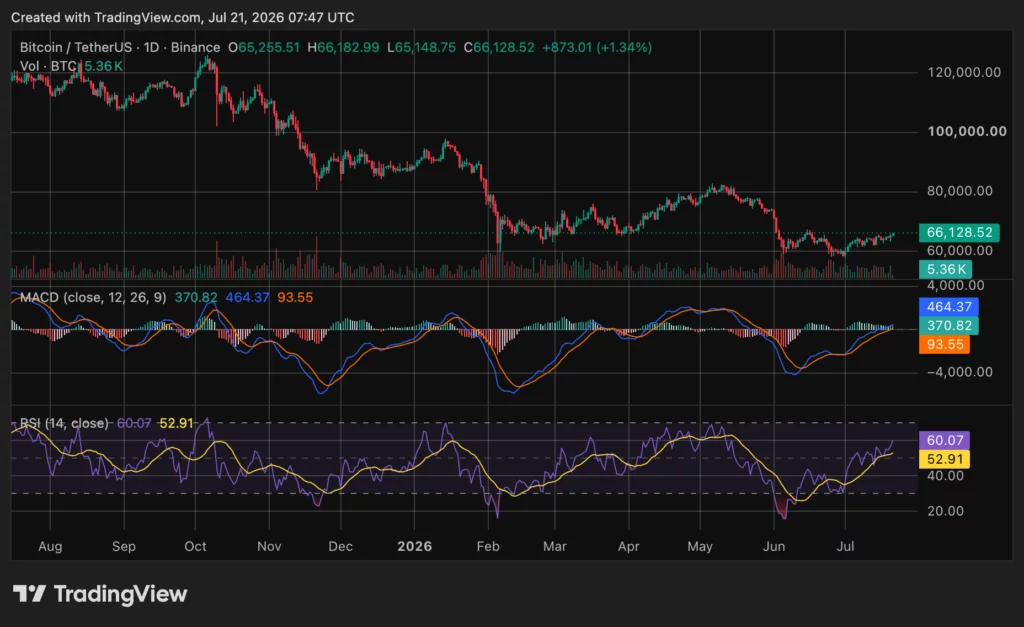
The RSI also supports the short-term recovery. It stands near 60.07, above its moving average around 52.91 and above the neutral 50 mark. However, the indicator remains below traditional overbought levels. Holding above $65,000 would keep the current recovery structure intact, while the $70,000 area represents the next closely watched test for buyers.
Onchain data offers another view of BTC’s position within its broader market cycle. According to crypto market intelligence platform Alphractal, its four-year standardized MVRV model identifies readings below a Z-score of -1 as periods of severe historical undervaluation and potentially stronger windows for dollar-cost averaging. The firm argues that MVRV can help investors measure where Bitcoin’s market value sits relative to the prices at which coins last moved onchain.
That metric does not provide a short-term price forecast, and historical patterns do not guarantee future returns. However, it adds another data point as BTC attempts to rebuild momentum after falling sharply from its 2025 record above $126,000. Crypto.news currently places BTC about 48% below that peak.
Disclosure: This article does not represent investment advice. The content and materials featured on this page are for educational purposes only.

Ethereum’s price has joined the overall market rally on Tuesday, climbing above $1,900 for the second time in the past week. Naturally, analysts have rushed to offer their insight on why they believe the token will keep surging to new local (and all-time) highs.
Meanwhile, the former CEO of BitMEX has doubled down on his recent bullish behavior toward Ethereum with a fresh purchase.
Hayes Buys Again
Data shared by Lookonchain showed earlier today that wallets linked to the famous crypto personality spent over $2.5 million to acquire 1,332.5 ETH. This is Hayes’ second multi-million-dollar Ethereum accumulation made in the past week. As reported on July 16, he bought 1,293 ETH for the same amount when the asset’s price traded above $1,900 for the first time in months.
Interestingly, that purchase came shortly after he had sold over $10 million worth of the largest altcoin at prices of just under $1,700. As such, he continues to acquire more ETH tokens when the asset rallies, but tends to dispose of them once it corrects.
Arthur Hayes(@CryptoHayes) bought another 1,332.5 $ETH($2.53M) 3 hours ago.https://t.co/gau6egd7Vmhttps://t.co/iKDlaSftbq pic.twitter.com/YKgXPCVe2Z
— Lookonchain (@lookonchain) July 20, 2026
Separately, Lookonchain added that Ethereum whales have gone on a substantial accumulation spree as well. This one purchased roughly $13.5 million worth of the asset. Another one spent $20 million to buy 10,501 ETH, and this one withdrew 12,800 ETH from Binance.
Major ETH Price Calls
As mentioned above, the second-largest cryptocurrency has jumped past $1,900, and analysts were quick to point out its potential. KALEO believes ETH will rise toward $2,300 within the next month, but it might dump even harder in September toward new multi-year lows of $1,200.
Crypto Patel noted that ETH is “trading where long-term wealth is often built.” The analyst pointed out the $1,200-$1,800 range as the accumulation zone, and outlined some massive targets between $10,000 and $20,000 for ETH during the next bull cycle.
Merlijn The Trader outlined a similar development from 2017 that drove the asset toward new highs at the time. He added that those who had given up on ETH are “about to learn why the last holders won in 2017.” His analysis focuses mostly on ETH’s movements against BTC, noting that a surge past 0.029 would solidify the setup, but a dump below 0.026 would invalidate it.
EVERYONE WHO GAVE UP ON ETHEREUM THIS CYCLE IS ABOUT TO LEARN WHY THE LAST HOLDERS WON IN 2017.
2015–2018: accumulation, then a multi-year falling wedge. The breakout went vertical to 0.14.
2018–2025: the same two phases, stretched over 8 years. Accumulation bowl. Then the… pic.twitter.com/BSi769Y0jl
— Merlijn The Trader (@MerlijnTrader) July 20, 2026
The post Arthur Hayes Buys More ETH as Analysts Eye $2.3K and Beyond appeared first on CryptoPotato.


US spot Bitcoin ETFs recorded $227 million in inflows as BTC climbed above $65,000, extending their longest winning streak since early May.

A chart analyst is warning that XRP’s recent bounce may be giving traders false confidence and has argued that the token is still in a long-term downtrend despite recovering from its recent lows.
His view challenges a growing group of traders calling for a breakout, with the next few weeks likely to determine whether the world’s sixth-largest cryptocurrency can build a stronger base or slip below $1.
Weekly Chart Still Points to Resistance
In a series of posts on X, XRP watcher ChartNerd said that traders should continue respecting the asset’s long-term trend rather than assuming a small recovery has changed the market structure.
He pointed out that bears have been in control since a 20-week and 50-week exponential moving average (EMA) death cross formed in January 2026. Further, he argued that a relief in May that stalled at the 20-week EMA before XRP fell from about $1.35 to near $1.00 confirmed that the moving average is still acting as resistance.
According to him, even if XRP rallies toward $1.29 or as high as $1.60, people should treat those levels as heavy resistance unless the price can move above them convincingly. The analyst added that in case the Ripple token hits $1.60 in late July or early August, it would strengthen the case that the recent move near $1.00 marked a local bottom.
However, if the asset doesn’t reach the 20-week EMA around $1.29 or gets rejected there, then “the drop below $1 could come sooner than expected.”
ChartNerd also pushed back against claims circulating on social media that XRP has already broken out of its downtrend dating back to July 2025. Responding to a bullish post from pseudonymous analyst Bird, who suggested that an explosive candle was due at any moment, he wrote that XRP was still inside its wedge pattern and below descending resistance.
He was equally dismissive of traders celebrating the asset’s latest move up and sarcastically questioned whether such a modest rise meant that XRP was now heading “vertical to $100 before EOY.” In another post, the market watcher argued that many of the accounts calling for a breakout today had made almost the same predictions when the token was trading around $2.40 in January, before the price eventually dropped to $1.00.
Mixed Signals Continue for XRP
XRP was trading at around $1.13 at the time of writing, up nearly 4% in the last 24 hours. It has also gained almost 6% over the past week but is still about 2% lower than where it was a month ago.
According to data from CoinGecko, the coin’s latest trading range has been between $1.08 and $1.14, showing that the price has yet to break decisively in either direction.
ChartNerd believes the charts are telling a simple story, which is that until XRP breaks above resistance levels that have contained the market for months, any rally should be looked at with caution rather than treated as confirmation that the downtrend has ended.
Still, there are quite a few beating the bullish drum, including EGRAG CRYPTO, who recently claimed that the asset could eventually move toward a $1 trillion market cap if historical patterns repeat. However, such a move would need much stronger market conditions and far greater investor demand than exists currently.
The post Relief Rally or Bull Trap? Why This Analyst Says XRP Is Heading Below $1 appeared first on CryptoPotato.


Anton Bukov, who co-founded decentralized exchange aggregator 1inch and, by his own account, led its protocol architecture and security, said the company fired him in late November and that he is now building a new infrastructure startup called Second Tier. 1inch disputes that he was fired. Bukov… Read the full story at The Defiant

Key takeaways
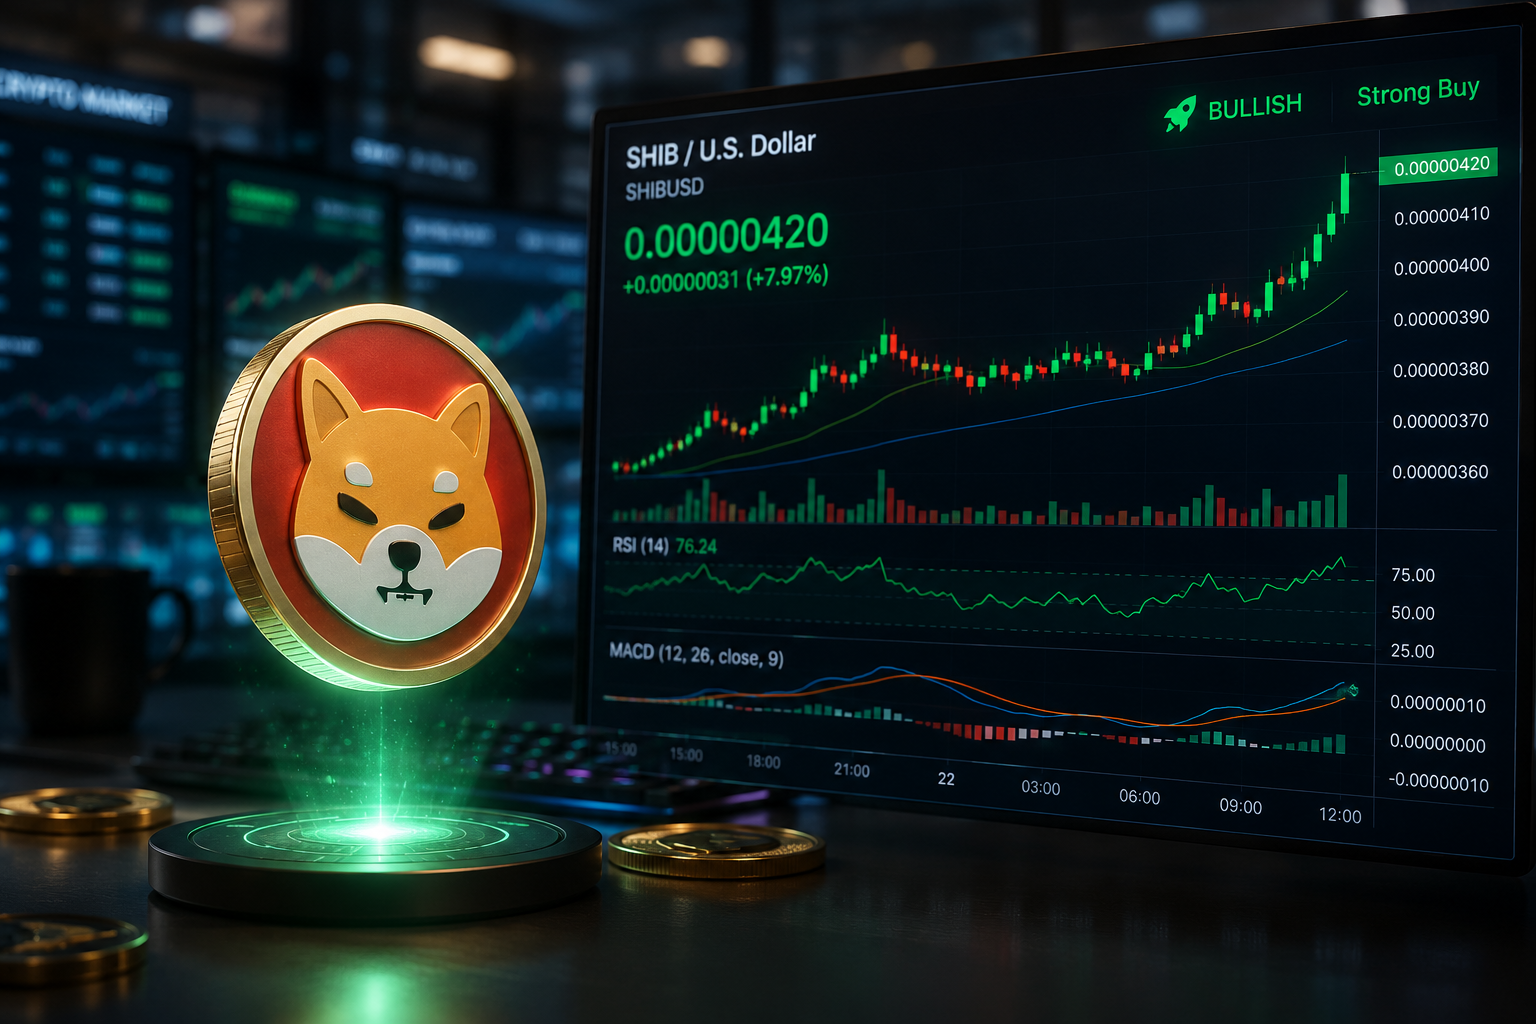
- Shiba Inu (SHIB) trades above $0.0000042 after breaking above a key descending trendline.
- Five consecutive days of exchange outflows suggest investors are moving SHIB into private wallets, reducing selling pressure.
- Derivatives data remains bullish, with positive funding rates and a long-to-short ratio favoring buyers.
Shiba Inu (SHIB) extended its recovery on Tuesday, trading above $0.0000042 after breaking above a long-standing descending trendline. Improving on-chain activity and strengthening derivatives data suggest bullish momentum is building, potentially setting the stage for further upside.
Exchange outflows point to reduced selling pressure
On-chain data from CryptoQuant indicates investors have been steadily moving SHIB off centralized exchanges, a trend often viewed as a positive signal for prices.
The platform’s exchange netflow data recorded five consecutive days of net outflows beginning on July 17, showing that more SHIB tokens are leaving exchanges than being deposited.
This pattern typically suggests investors are transferring tokens into private wallets for longer-term holding rather than preparing to sell, reducing immediate selling pressure in the market.
The continued decline in exchange balances could support SHIB’s ongoing recovery if buying demand remains steady.
Market positioning in the derivatives sector also points to improving confidence among traders.
According to CoinGlass, SHIB’s long-to-short ratio stood at 1.02 on Tuesday, indicating a slight preference for long positions over shorts and reflecting growing optimism that prices could continue moving higher.
Sentiment is further supported by funding rates. SHIB’s perpetual futures funding rate turned positive on July 17 and remained in bullish territory at 0.0103% on Tuesday.
Positive funding rates indicate that traders holding long positions are paying those with short positions, a sign that bullish bets currently outweigh bearish ones.
The combination of positive funding rates and a favorable long-to-short ratio suggests traders are increasingly positioning for additional gains.
Shiba Inu price outlook: Bulls target higher resistance
From a technical perspective, SHIB has improved its near-term outlook after breaking above a descending trendline that had capped price action since mid-May.
The breakout places the meme coin in a stronger position to extend its recovery if buying momentum continues.
The next major resistance lies around $0.0000045. A decisive close above this level could pave the way for a move toward the 50-day Exponential Moving Average (EMA), which is also positioned near $0.0000045.
Momentum indicators have also turned more constructive. The Relative Strength Index (RSI) has climbed to 54 and is moving towards the 60 level, signaling that bearish momentum is fading.

Meanwhile, the Moving Average Convergence Divergence (MACD) has produced a bullish crossover, with expanding green histogram bars reinforcing the improving technical outlook.
However, if the current recovery loses momentum and sellers regain control, SHIB could retreat toward its yearly low near $0.0000040, where buyers may attempt to defend the broader uptrend.

Mariners CF Julio Rodriguez ‘good’ after exiting vs. Reds

Protesters confront Microsoft CSO over carbon goals and AI, disrupting climate event

Sinking Fund Gr 12 Financial Maths


-
 NewsBeat5 days ago
London Mayor Sadiq Khan handed a peerage by Keir Starmer alongside 15 other Labour figures… just days before the PM leaves No10
-

 Fashion4 days ago
Weekend Open Thread – Corporette.com
-

 Politics3 days ago
The House | The City of London can help the new chancellor deliver growth in every postcode
-

 Politics6 days ago
Young campaigners urge incoming PM to act on outdoor junk food ads
-

 Crypto World5 days ago
CFTC blocks Kalshi from unwinding Michigan trades after court order
-
 Crypto World4 days ago
Two July Windows Left: The CLARITY Act’s Senate Fight and What Failure Means
-
 Crypto World3 days ago
Ripple Payments Joins MiCA With 14 Firms, Does It Mean Anything For XRP?
-

 Business5 days ago
Nvidia Stock Slips After Big Tuesday Rally as Huang Confirms Vera Rubin Chip Is Now in Production Today
-

 Politics2 days ago
Democrats look to World Cup watch parties to register thousands of voters
-
 Entertainment6 days ago
Disney’s Most Ambitious Failed Star Wars Attraction Is Coming to SDCC
-

 Crypto World3 days ago
Ripple wins EU-wide access as ESMA adds it to MiCA register
-

 Crypto World5 days ago
Injective Submits SEC Transfer-Agent Registration to Onchain Ownership Records
-

 Business5 days ago
Palantir Shares Rise After Expanded Nvidia Partnership and Fresh Analyst Upgrades Ahead of Earnings Day
-
 Tech8 hours ago
Sail Virtually Aboard The “Itanic” With IA-64 Emulator
-
 Tech6 hours ago
Turtle Beach Command Series KB7 review: a nifty screen-equipped gaming keyboard
-

 Tech7 days ago
Dark Secrets Emerge When Jailbreaking LLMs
-

 News Videos7 days ago
XRP BOMBSHELL… XRP OMBOARDED FOR TRANSACTIONS!!!
-

 NewsBeat4 days ago
Registration is now open for March for Men with Kev 2026
-

 NewsBeat22 hours ago
Unregistered fitter used Gas Safe logo on business flyers
-
 Sports5 days ago
New Cornerback Enters Vikings Trade Rumor Mill
You must be logged in to post a comment Login