

Crypto World
What next as bitcoin hits a two-week high near $65,500

Two other supports lined up behind the move. U.S. spot bitcoin ETFs have now drawn inflows for five straight sessions totaling more than $600 million, the most sustained institutional buying since mid-July and a reversal of the eight-week outflow run that ran through late June.
And oil, which had climbed for two days on the war, pulled back, with Brent falling 1% to about $88.58 as Iran said mediators were circulating proposals to ease hostilities, including a reported suggestion for a 10-day halt in strikes.
“Current bitcoin and ether prices are low but fair, given the macro uncertainties pervading markets,” said Jeff Mei, chief operating officer at BTSE, who pointed to the Fed meeting as the event traders are positioned around.
“Traders expect rates to hold steady but are looking for more signals as to what’s to come later in the year,” Mei added.
The read on that meeting is where the rally meets its limit. The Federal Reserve gathers July 28 and 29, and markets put the odds of a July rate increase at about 15%, though a September move is still live.
Spot-market volume across crypto stayed subdued even as prices rose, the sign of a tape lifted by returning risk appetite rather than fresh conviction, and higher oil and Treasury yields remain the levers that could keep the Fed hawkish and cap risk assets.

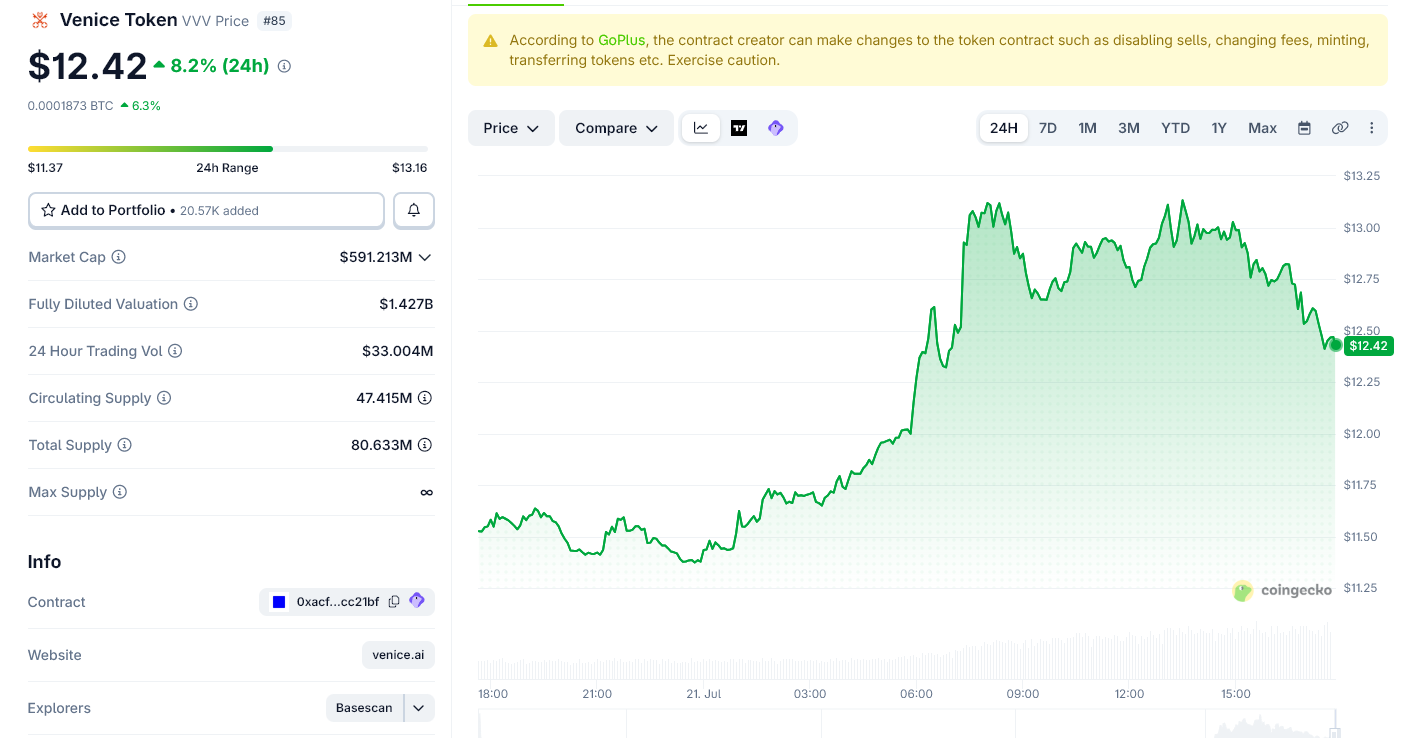
Venice Token (VVV) price rallied 11% on Tuesday to $12.84, breaking above the descending resistance line that had capped every recovery attempt since the June 3 peak at $21.47.
The move ends a six-week correction that bottomed just below $10. Momentum, volume, and Fibonacci structure now make $14 the next battleground.

Daily RSI Broke Its Downtrend Before the Price Did
Momentum turned before price action did. The daily Relative Strength Index (RSI) broke above its descending trendline several sessions ahead of the price chart. Analysts often read such leads as early confirmation of a trend change.
The indicator bottomed near 32 in early July, when the Venice Token price tested the $10 area. It has since reclaimed the 50 midline and its moving average, and it currently sits near 55.

A reading of 55 leaves room before the overbought zone above 70. However, the signal would weaken if RSI slips back below 50 during a pullback.
A previous analysis flagged bearish divergences in VVV just before the June top, and momentum has since completed a full reset.
Hourly Volume Delivers Critical Confirmation
Daily volume tells a more cautious story. It has declined steadily since May, which means the breakout still lacks confirmation on higher timeframes.
The hourly chart fills that gap. VVV traded inside a parallel channel between roughly $11.35 and $12.05 from July 18 until Tuesday morning. The break above the channel’s upper band occurred during the strongest hourly-volume spike of the entire recovery.

Hourly RSI reached 83 during the impulse and has since cooled to 70. Therefore, a retest of the $12.00 to $12.05 area would be a natural next step.
Holding that zone would confirm it as new support and echo the bullish setups that preceded the May rally.
Venice Token Price Prediction Makes $14 the Gate to $16.80
The correction from $21.47 stopped almost exactly where the Fibonacci theory said it should. The low formed just below $10, slightly above the 0.618 retracement at $9.33, and near a prior resistance area.
The current target sits at the 0.382 retracement near $13.97. That level overlaps a horizontal supply zone around $14, where VVV stalled repeatedly in May and June. A move there would add roughly 9% from current prices.
A clean break above $14 would expose the 0.236 level at $16.83, about 31% higher.
Beyond that, the record high of $22.58 from January 2025 remains the final barrier. In contrast, a rejection at $14, combined with a $12 loss, would invalidate the bullish structure and reopen the $10 support.

Fundamentals could accelerate the move. Venice AI announced on July 17 that $5 of every $100 in API credit purchases now automatically buys and burns VVV. The token also led a broader altcoin rally in May, and rising burns tighten supply while most circulating VVV remains staked.
The setup now reduces to a single question. Either buyers convert $14 into a launchpad, or the breakout stalls at the same wall that stopped them twice before.
The post Venice Token Breaks Out with 10% Rally. How Far Will This Altcoin Jump? appeared first on BeInCrypto.
Ondo Finance said it has deployed its tokenized stocks as collateral on OndoPerps, a perpetual futures venue, starting with SPYon and QQQon, in a post published Monday on X. The OndoPerps account said tokenized stock collateral is "live" and "now available for all users," letting Ondo Stocks back… Read the full story at The Defiant


Galaxy Digital (GLXY) said it set up a $5 million fund for Bitcoin developers working to protect the network from the potential future threat posed by quantum computing.
The crypto financial services company said it will begin accepting applications for the Galaxy Bitcoin Quantum Readiness Initiative immediately, with grants focusing on developing quantum-resistant signature schemes, wallet migration tools and security audits. The company said it hopes other firms will contribute funding and research to accelerate the transition to quantum-resistant cryptography.
Bitcoin secures wallets and transactions with cryptographic techniques that current computers cannot break in a meaningful timeframe. While quantum computing is still too immature to attack the blockchain, advances in the technology have accelerated efforts across government and industry to adopt quantum-resistant standards before the threat becomes a reality.
In the event that quantum computers do become capable of breaking Bitcoin’s cryptography, roughly 6.9 million bitcoin could become vulnerable to theft, according to CryptoQuant research. At today’s price of about $66,800, that comes to about $461 billion.
Telegram founder Pavel Durov said the messaging app will embed a native, non-custodial Gram wallet in every version of Telegram this summer, putting a self-custody crypto wallet in front of the platform's more than one billion users. In a post on July 21, Durov said he is "implementing a native… Read the full story at The Defiant
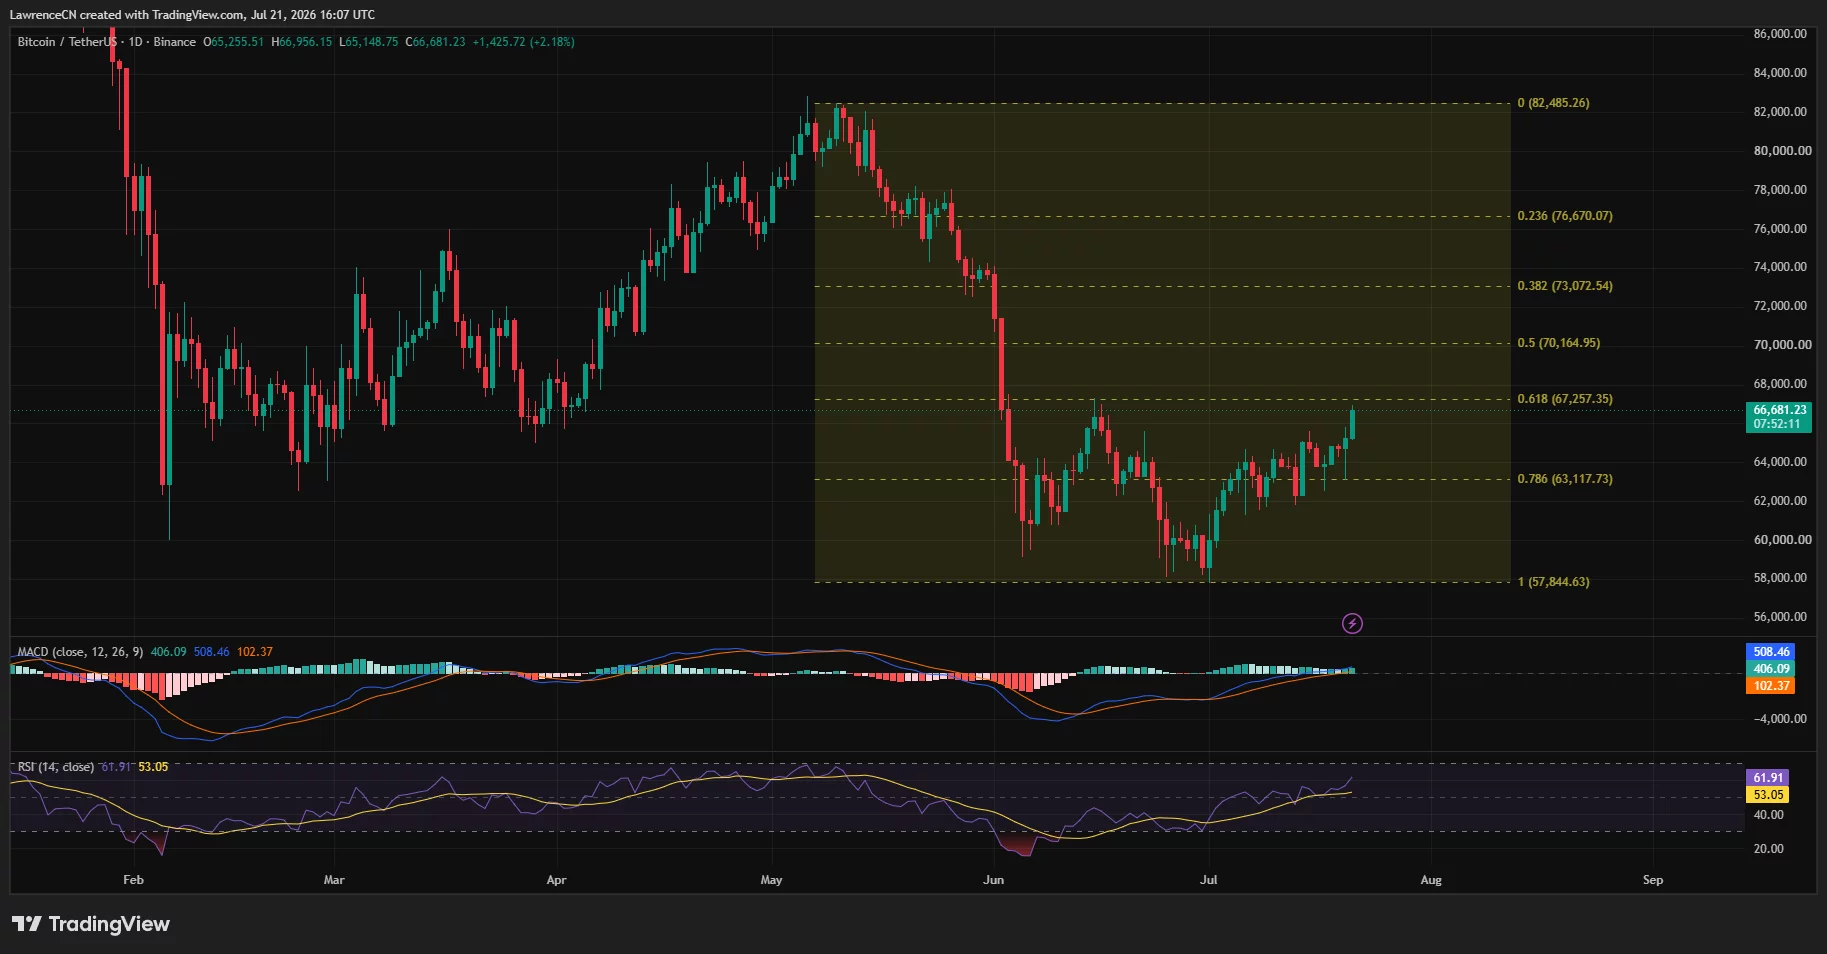
Bitcoin has risen 2.2% to $66,681, and XRP has gained 3.6% to $1.152 as both assets test chart resistance while Iran claims it struck Amazon’s data infrastructure in Bahrain.
Summary
- Bitcoin approached $67,257 Fibonacci resistance as bullish momentum strengthened on its daily chart.
- XRP broke above a symmetrical triangle, opening a possible move toward $1.30.
- Iran’s unverified Amazon strike claim added geopolitical risk to both crypto rallies.
IRNA, Iran’s state news agency, has reported that the Islamic Revolutionary Guard Corps used several cruise missiles to attack what it described as Amazon’s central data infrastructure in Bahrain on July 21. The IRGC claimed the facility was destroyed, although Amazon and Bahraini authorities had not confirmed the reported damage at the time of writing.
According to the IRGC, the operation came in response to a US attack on the construction site of Iran’s Darkhovin nuclear power plant. The Iranian force has also threatened 18 American technology companies, including Microsoft, Intel, Cisco and Google, over their alleged links to US military and intelligence activity.
Amazon Web Services facilities in Bahrain and the United Arab Emirates have already faced attacks during the conflict. In April, an Amazon cloud facility in Bahrain had sustained damage in an Iranian attack, while service interruptions affected AWS infrastructure elsewhere in the region.
Investors reacted cautiously because the latest IRGC account lacked independent confirmation. Amazon shares had closed Monday 1.12% higher at $249.99, but US stock futures later surrendered part of their earlier gains as reports of the alleged attack circulated.
Military action continued while Pakistan pursued another diplomatic effort. The US Central Command had completed a new series of attacks on Iran, extending the American campaign to a tenth consecutive night.
CENTCOM listed Iranian command centers, maritime assets, missile and drone launch sites, and air-defense systems among the targets. The US military stated that the strikes were intended to reduce Iran’s ability to attack commercial vessels passing through the Strait of Hormuz.
At the same time, the Associated Press reported that Pakistan was trying to restart ceasefire negotiations. Those efforts continued as Iran attacked targets in Bahrain, Kuwait and Jordan and fighting disrupted commercial traffic through the Strait of Hormuz.
Bitcoin recovery runs into Fibonacci resistance
Bitcoin (BTC) rose from a daily low of $65,149 to an intraday high of $66,956 on Binance, according to the supplied TradingView chart. The move placed BTC directly below the 61.8% Fibonacci retracement at $67,257, calculated from the decline between $82,485 and $57,845.
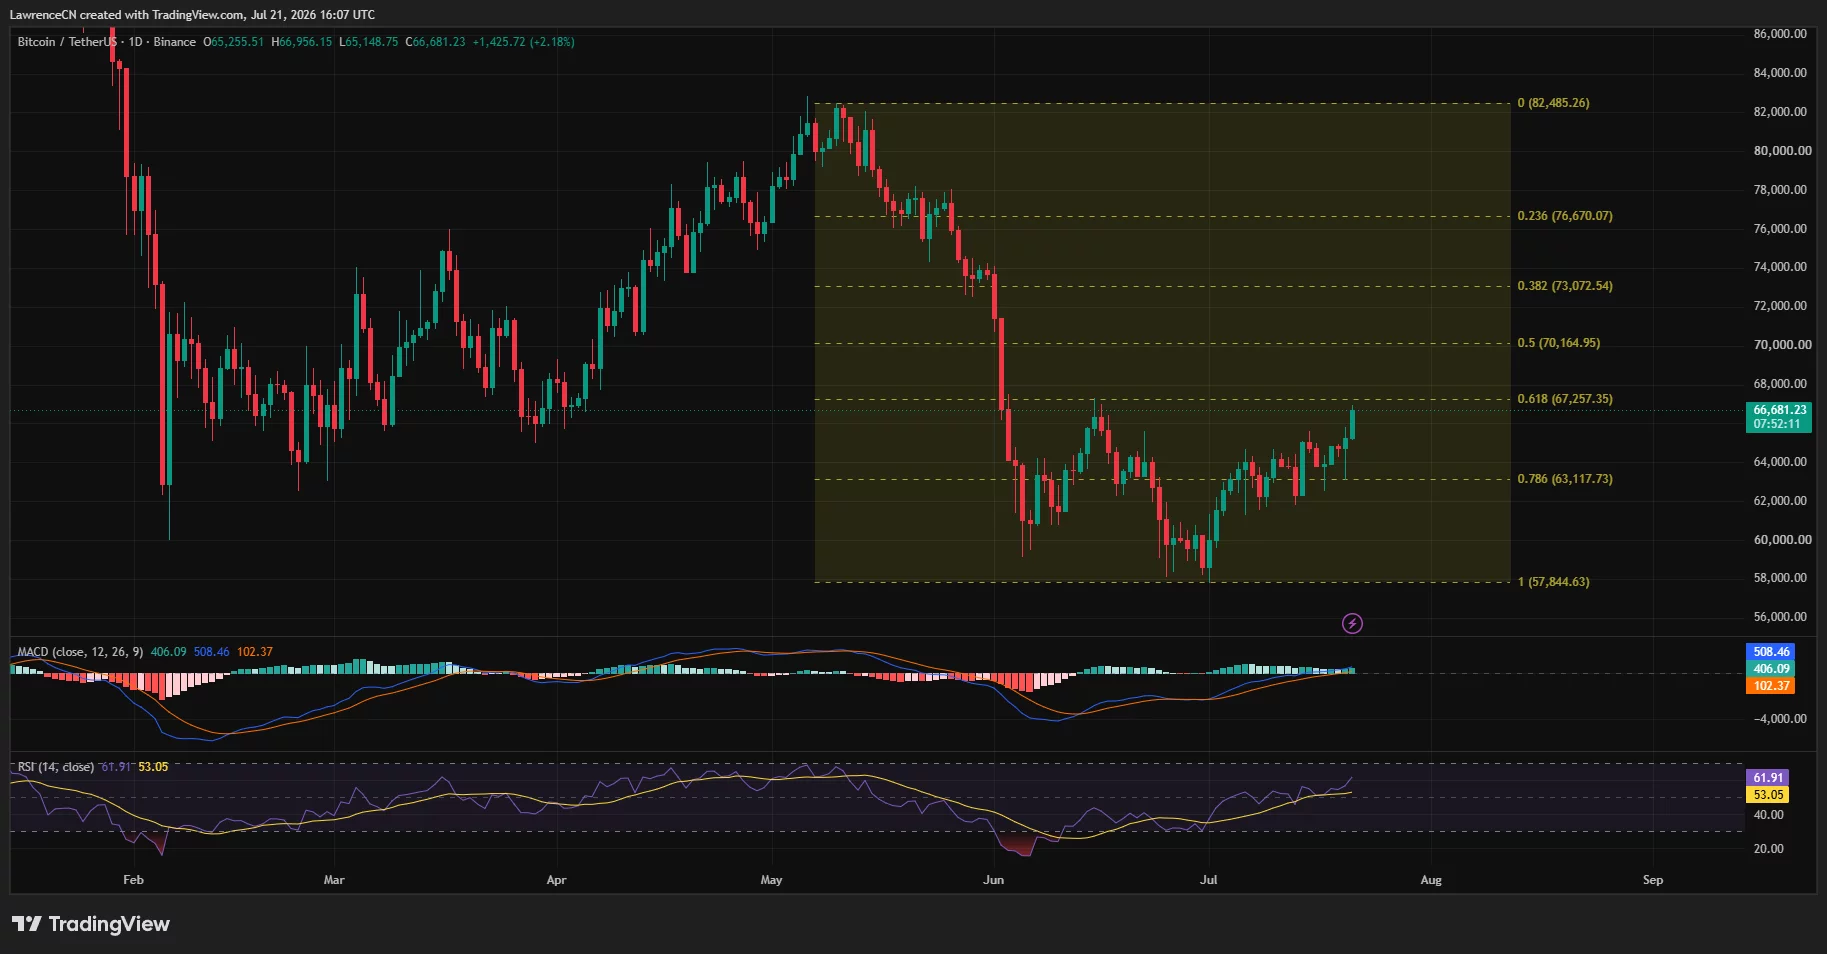
TradingView’s daily setup identifies $67,257 as the immediate technical barrier. A daily close above it would expose the 50% retracement at $70,165, while another advance could bring the 38.2% level at $73,073 into view.
Failure to clear the 61.8% line would leave Bitcoin inside the recovery range formed since its late-June low. The same chart places the closest marked downside level at $63,118, which corresponds with the 78.6% Fibonacci retracement and overlaps with recent consolidation.
Momentum has improved alongside the rebound. Bitcoin’s relative strength index stands at 61.91, above its moving average of 53.05 but still below the overbought threshold of 70, according to TradingView.
The daily MACD also remains positive, with the MACD line at 508.46, the signal line at 406.09 and the histogram at 102.37. TradingView’s readings show bullish momentum, although the small gap between the two lines means BTC still requires follow-through above $67,257 to strengthen the signal.
Bitcoin’s latest candle opened at $65,255 and remained positive when the chart was captured. However, the unfinished daily candle means the attempted break cannot be confirmed until the session closes.
XRP breakout points toward $1.30
XRP (XRP) price has moved above the descending boundary of a symmetrical triangle on its Binance daily chart. TradingView data shows the token advancing from a session low of $1.111 to an intraday high of $1.158 after several weeks of contracting price action.
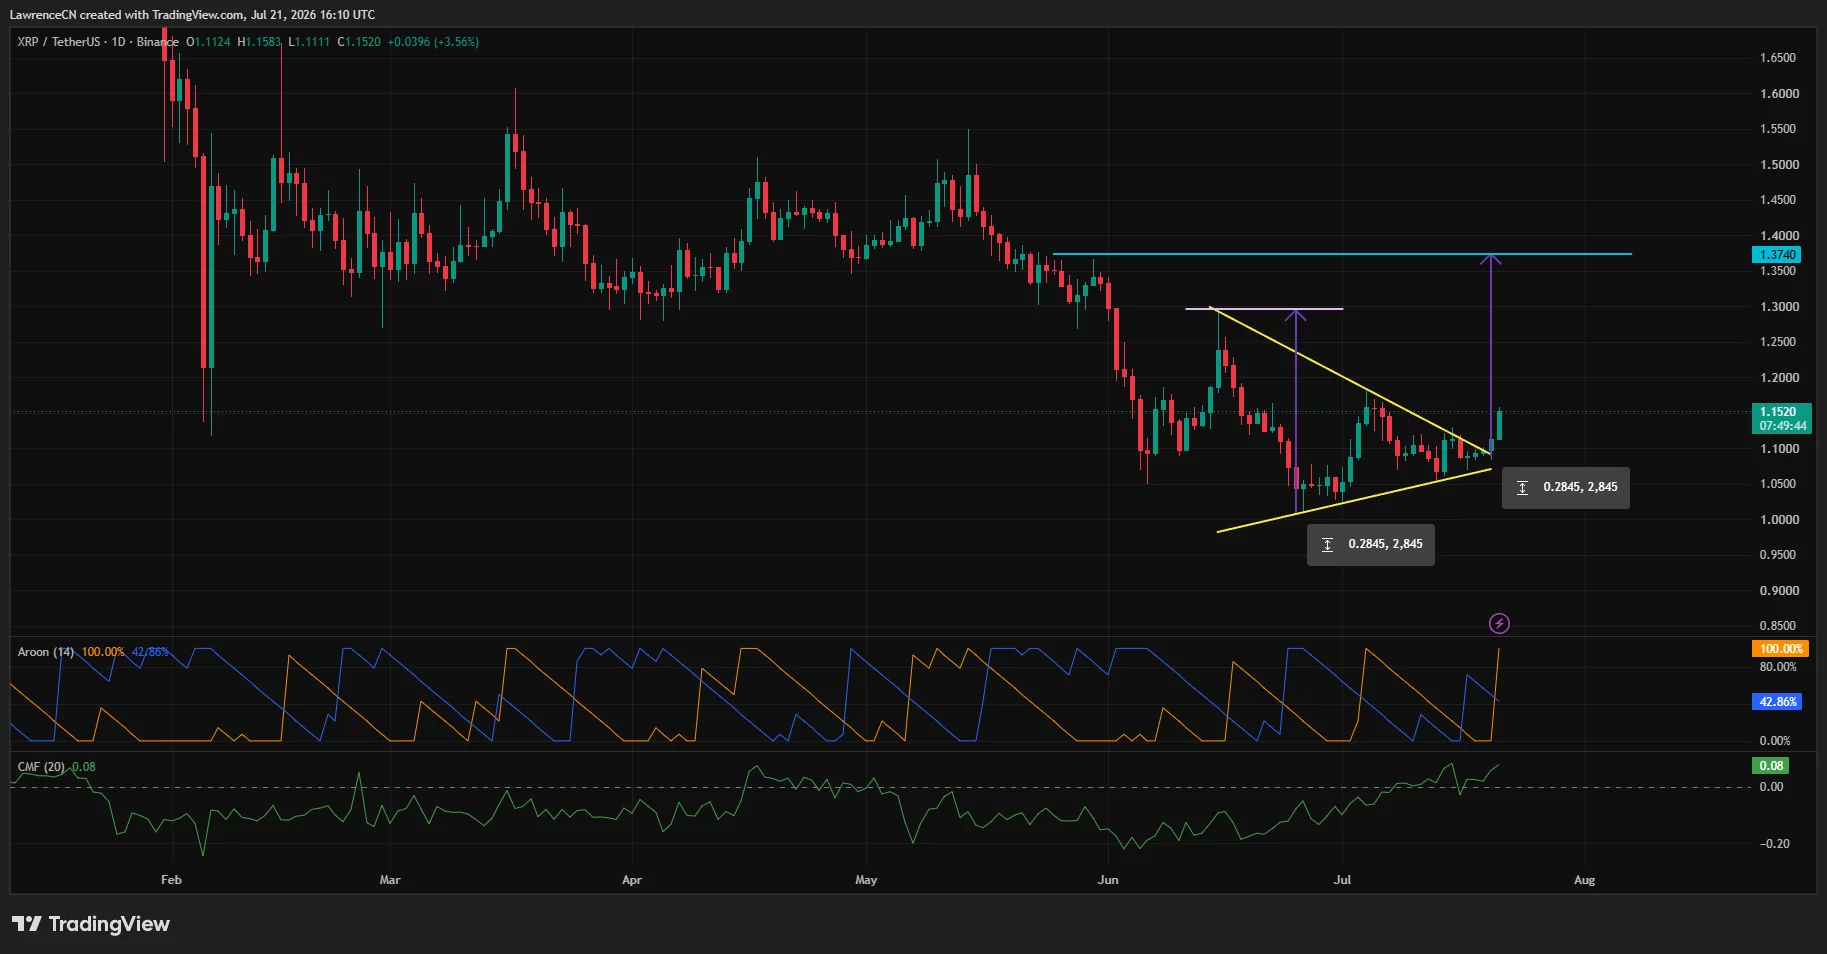
The pattern developed between falling resistance from the mid-June swing high and ascending support extending from the late-June low. XRP’s move above the upper trendline indicates a breakout attempt, although confirmation still depends on a daily close outside the formation.
Based on the measured height displayed on the supplied chart, the triangle carries a projected move of about $0.2845. Applying that distance to the breakout area places the first marked target near $1.30.
A second resistance line appears at $1.374, which acted as a trading area before XRP’s sharp decline in early June. The chart therefore shows $1.30 as the first target and $1.374 as the next barrier if buyers maintain control.
TradingView’s Aroon indicator supports the bullish attempt, with Aroon Up at 100% and Aroon Down at 42.86%. Chaikin Money Flow has also climbed to 0.08, indicating that buying pressure has returned during the breakout.
A move back below the triangle’s upper boundary near $1.10 would weaken the pattern and place its rising support at risk. Sustained trading above the breakout line would preserve the chart’s path toward $1.30, though the unverified Amazon strike claim and continued US-Iran attacks could increase volatility across both XRP and Bitcoin.
Disclosure: This article does not represent investment advice. The content and materials featured on this page are for educational purposes only.
The UK Parliament’s Crypto and Digital Assets All-Party Parliamentary Group has launched a formal inquiry into why banks refuse to open accounts and block payments for crypto businesses. Written evidence will be accepted until August 31, while the group aims to publish recommendations before the FCA’s mandatory crypto regime begins in October 2027. The move tests whether the UK’s ambition to become a global digital asset hub can survive banking restrictions.
The inquiry was announced on Tuesday by co-chairs Lord Vaizey of Didcot and Labor MP Gurinder Singh Josan CBE. It covers difficulties opening and maintaining business accounts, transfer limits, payment blocks, and whether banks apply restrictions proportionately. It will also compare the UK’s approach with the US, Hong Kong, Australia, and the European Union.
The APPG outlined its concern clearly. It said crypto and digital asset firms have consistently reported difficulty accessing UK banking services. The group added that banking access is essential for legitimate businesses, while unnecessary barriers risk slowing investment, innovation, and long-term growth.
The scale of the issue remains significant. Research from the UK Cryptoasset Business Council, published in January 2026, found roughly 40% of payments to crypto exchanges were blocked or delayed by UK banks. One platform reported almost £1 billion in rejected transactions during 2025. Meanwhile, 80% of exchanges saw customer friction increase, while 70% described banking conditions as more hostile than a year earlier.
— Crypto Banter (@crypto_banter) July 21, 2026
 UK LAWMAKERS LAUNCH INQUIRY INTO CRYPTO BANKING ACCESS!
UK parliamentarians have launched an inquiry into the challenges crypto firms face in obtaining traditional banking services.
The probe aims to address barriers that have hindered the sector’s growth and integration with… pic.twitter.com/aSqFNBRRPx
Those findings contrast with the government’s stated position. HM Treasury Economic Secretary Lucy Rigby told Parliament in March 2026 that licensed crypto firms should not face restrictions simply because they operate in the sector. As a result, the inquiry will examine why FCA-registered businesses continue facing banking hurdles despite regulatory progress.
Discover: The Best Crypto to Diversify Your Portfolio
UK Crypto and FCA Framework Sharpen the Debanking Question
The inquiry also follows the UK’s finalized FCA crypto framework. The authorization window opens in September 2026, while full compliance becomes mandatory on October 25, 2027. If licensed firms still struggle to secure banking services, confidence in the new regulatory framework could suffer.
Meanwhile, comparisons with overseas markets continue to grow. In the United States, crypto companies have compared banking restrictions to Operation Chokepoint 2.0. Kraken recently secured a $22 million settlement from an auditor it claimed abandoned the exchange during that period. In Australia, Coinbase has also criticized banks over restrictions on crypto-related services. The APPG will assess how competing jurisdictions have handled similar challenges.
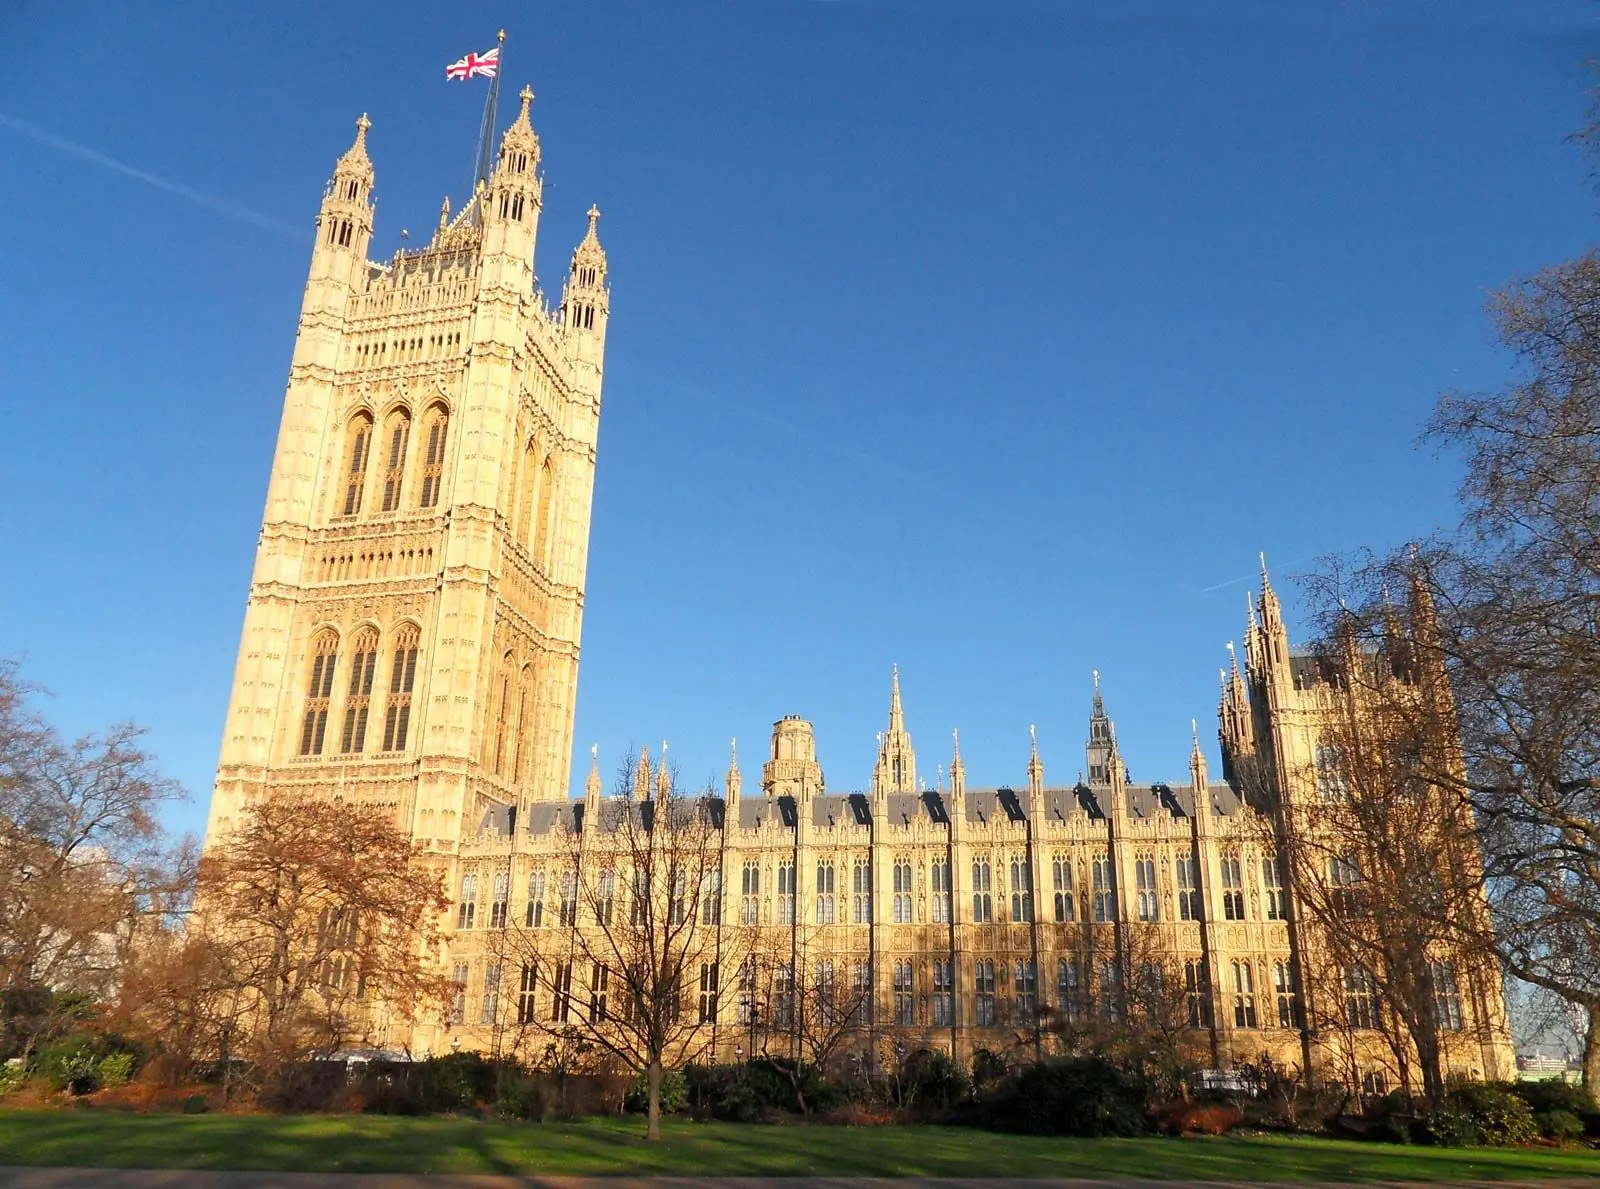
The inquiry arrives during a political transition. Andy Burnham became Prime Minister on Monday, while John Healey was appointed Chancellor of the Exchequer. Legal experts say global financial firms will closely watch whether the new government delivers a stable regulatory environment for digital assets and financial services.
Written submissions will be accepted from July 21 through August 31 across banking, payments, fintech, and crypto sectors. The APPG will then publish recommendations before the October 2027 deadline. Industry participants are expected to advocate for case-by-case risk assessments instead of blanket restrictions on FCA-registered crypto firms.
Trade on Bybit and Get a Chance to Win Our $1,000 USDT Airdrop
The post APPG Targets UK Bank Debanking of Crypto Firms Before 2027 FCA Deadline appeared first on Cryptonews.
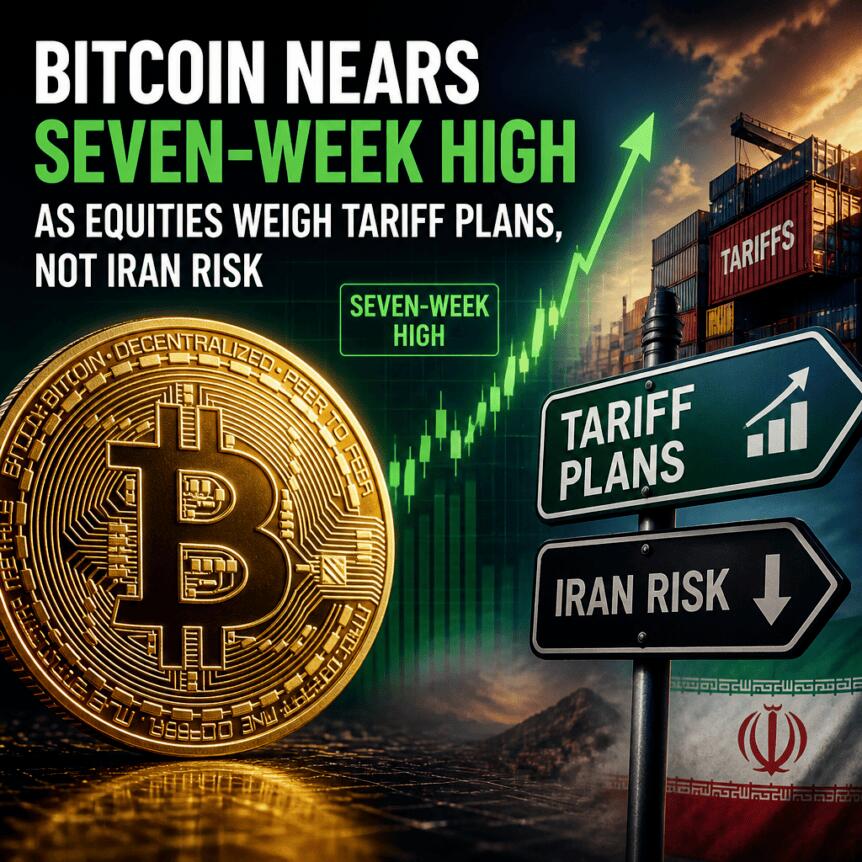
Bitcoin extended its early gains into the Wall Street open, tracking a broader buoyancy in US risk assets despite fresh geopolitical and tariff-related headlines. TradingView data showed BTC/USD pressing toward $67,000 and edging close to its seven-week highs.
What stands out for traders is that neither the latest escalation in the US–Iran situation nor renewed talk of international trade tariffs has meaningfully derailed momentum in crypto markets. Instead, price action suggests participants are leaning toward the view that any disruptions may be temporary—at least for now.
Key takeaways
- BTC moved toward $67,000 and threatened fresh multi-week highs as stocks held up into the US session.
- Escalating tensions involving Iran and the Strait of Hormuz coincided with strength in risk assets rather than a selloff.
- Reported US tariff plans could have been a headwind for speculative markets, but traders appeared to expect a resolution.
- Analysts warn Bitcoin needs to reclaim its 21-week simple moving average to credibly challenge the broader bear-market structure.
Geopolitical escalation and tariff talk fail to cool risk appetite
According to TradingView, BTC/USD approached $67,000 during the session, with momentum that began earlier appearing to persist. The cryptocurrency’s relative resilience came alongside firm trading in US equity futures.
At the same time, the day’s headlines pointed to conditions that often support “risk-off” behavior. The US–Iran conflict saw further escalation after Iran struck targets at Amazon facilities in Bahrain in response to US strikes, and reporting indicated the Strait of Hormuz oil route remained closed.
In commodity markets, the geopolitical pressure showed up in crude prices: WTI oil rose to its highest level in over a month, nearing $85 per barrel, as TradingView’s WTI CFDs chart reflected.
On the policy front, multiple outlets reported that President Donald Trump is planning to introduce new 10% international trade tariffs. The proposal is described as following 50% measures imposed on Canada earlier in the week. Historically, tariff uncertainty can weigh on broader risk sentiment, yet crypto traders did not appear to react with sustained caution.
Instead, commentary from market participants suggested expectations that the situation would ultimately resolve in favor of markets. YouTube host Crypto Rover, for example, summarized the prevailing stance in an X post, writing that “Markets are pricing in peace.”
Stocks in focus as macro risks get tested
While crypto held up, some investors remained confident about near-term equity direction. Caleb Franzen, who runs macro analysis resource Cubic Analytics, posted on X that he had “zero fear” or worry regarding S&P 500 futures, describing the setup as supportive.
Still, the optimism was not universal. Cautionary notes surfaced from senior banking leadership, including JPMorgan CEO Jamie Dimon, who warned that markets were not pricing risks aggressively enough relative to what could come next. The juxtaposition highlights the tension investors face: risk assets can keep rising even when underlying risks are real, as long as participants believe outcomes will be less severe than feared.
Technical pressure point: the 21-week trendline
For Bitcoin-specific direction, attention shifted from short-term resistance levels to a longer moving-average benchmark. Material Indicators cofounder Keith Alan offered a more guarded view of the near-term outlook, arguing that the bear market may still be intact until BTC confirms a stronger trend.
Alan pointed to a “golden cross” involving the 21-day and 50-day simple moving averages on Monday, but emphasized that such signals on lower timeframes don’t necessarily negate a broader downturn. In his X analysis, he warned that bear markets do not always look like bear markets—especially when price action is volatile but not trend-confirmed.
The key condition, according to Alan, is whether Bitcoin can reclaim its 21-week simple moving average. He wrote that the macro trend would be challenged only if BTC pushes above that level, noting that until then, “the Bear Market remains intact.”
At the time of writing, the 21-week SMA was cited at $69,720, a figure that also aligns with Bitcoin’s 2021 all-time high. The larger implication is that reclaiming this long-term trendline would signal more than just a bounce—it would suggest a shift in how the market is pricing longer-duration risk.
Alan also acknowledged that there was “no real resistance” until $67,250, which helps explain why traders were willing to press higher even amid macro uncertainty. However, the absence of immediate resistance near $67,000 does not guarantee follow-through if the move fails at the longer-term moving-average level.
What to watch next for BTC
With BTC approaching the high-$60,000 zone, traders are now likely to monitor whether price can build momentum toward the $69,720 21-week SMA area. If Bitcoin cannot reclaim that threshold, analysts like Keith Alan suggest the market may still be operating under a bear-market structure—even if rallies continue to occur in the shorter term.
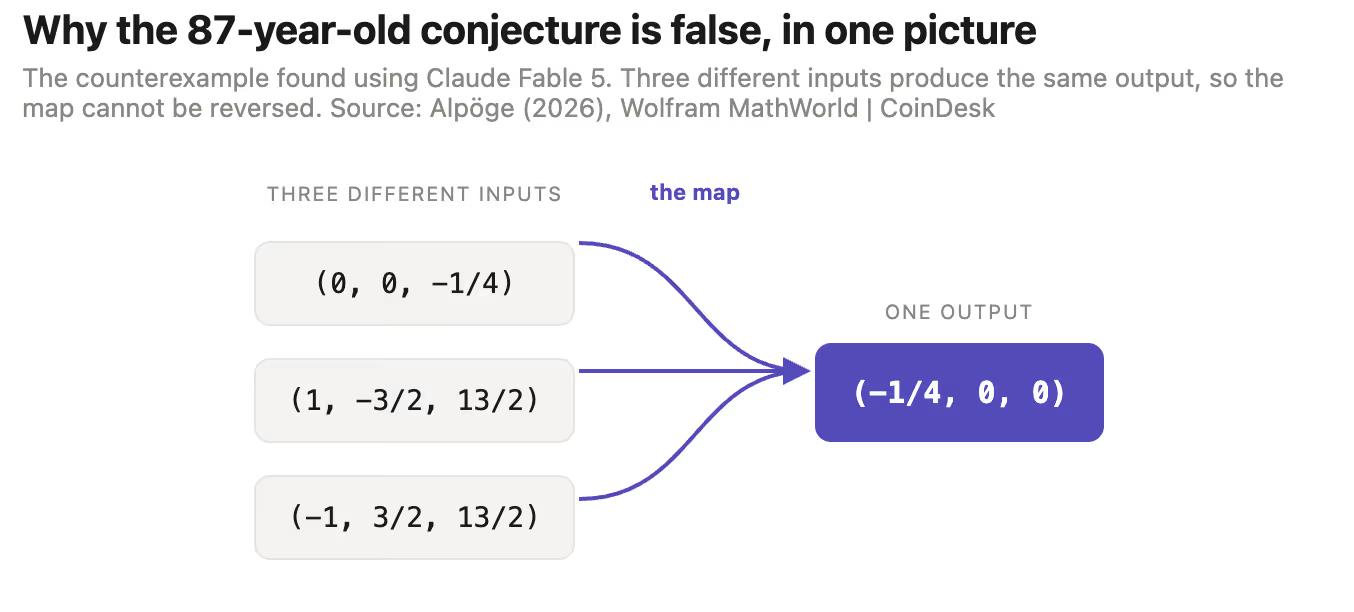
But the larger pull is simpler: AI is where the speculative money and investors’ attention are now going. The capital that once chased crypto is now chasing compute, chips and model builders, and every leap in what these systems can do widens that appeal.
Each result like Fable’s finding of the Jacobian conjecture strengthens the case for pouring capital into AI, and poses a difficult conundrum for crypto investors: Why hold a token that trades as a sidecar to the AI cycle when someone can own the vehicle itself?
AI’s capability curve is steep, and the steeper it gets, the more of the market’s risk appetite it draws away from everything else, crypto included.
What the problem actually was
Think of a machine that takes two numbers and gives back two new numbers, using only adding and multiplying. The question, first asked in 1939, was whether the machine can always be run backward: given only its answer, can the original two numbers be recovered every time?
Mathematicians had a quick way to check whether a machine looked reversible. The Jacobian conjecture said that if a machine passed that check, it should always be reversible.

For 87 years, nobody could prove it was true, and nobody could find a machine that broke the rule.
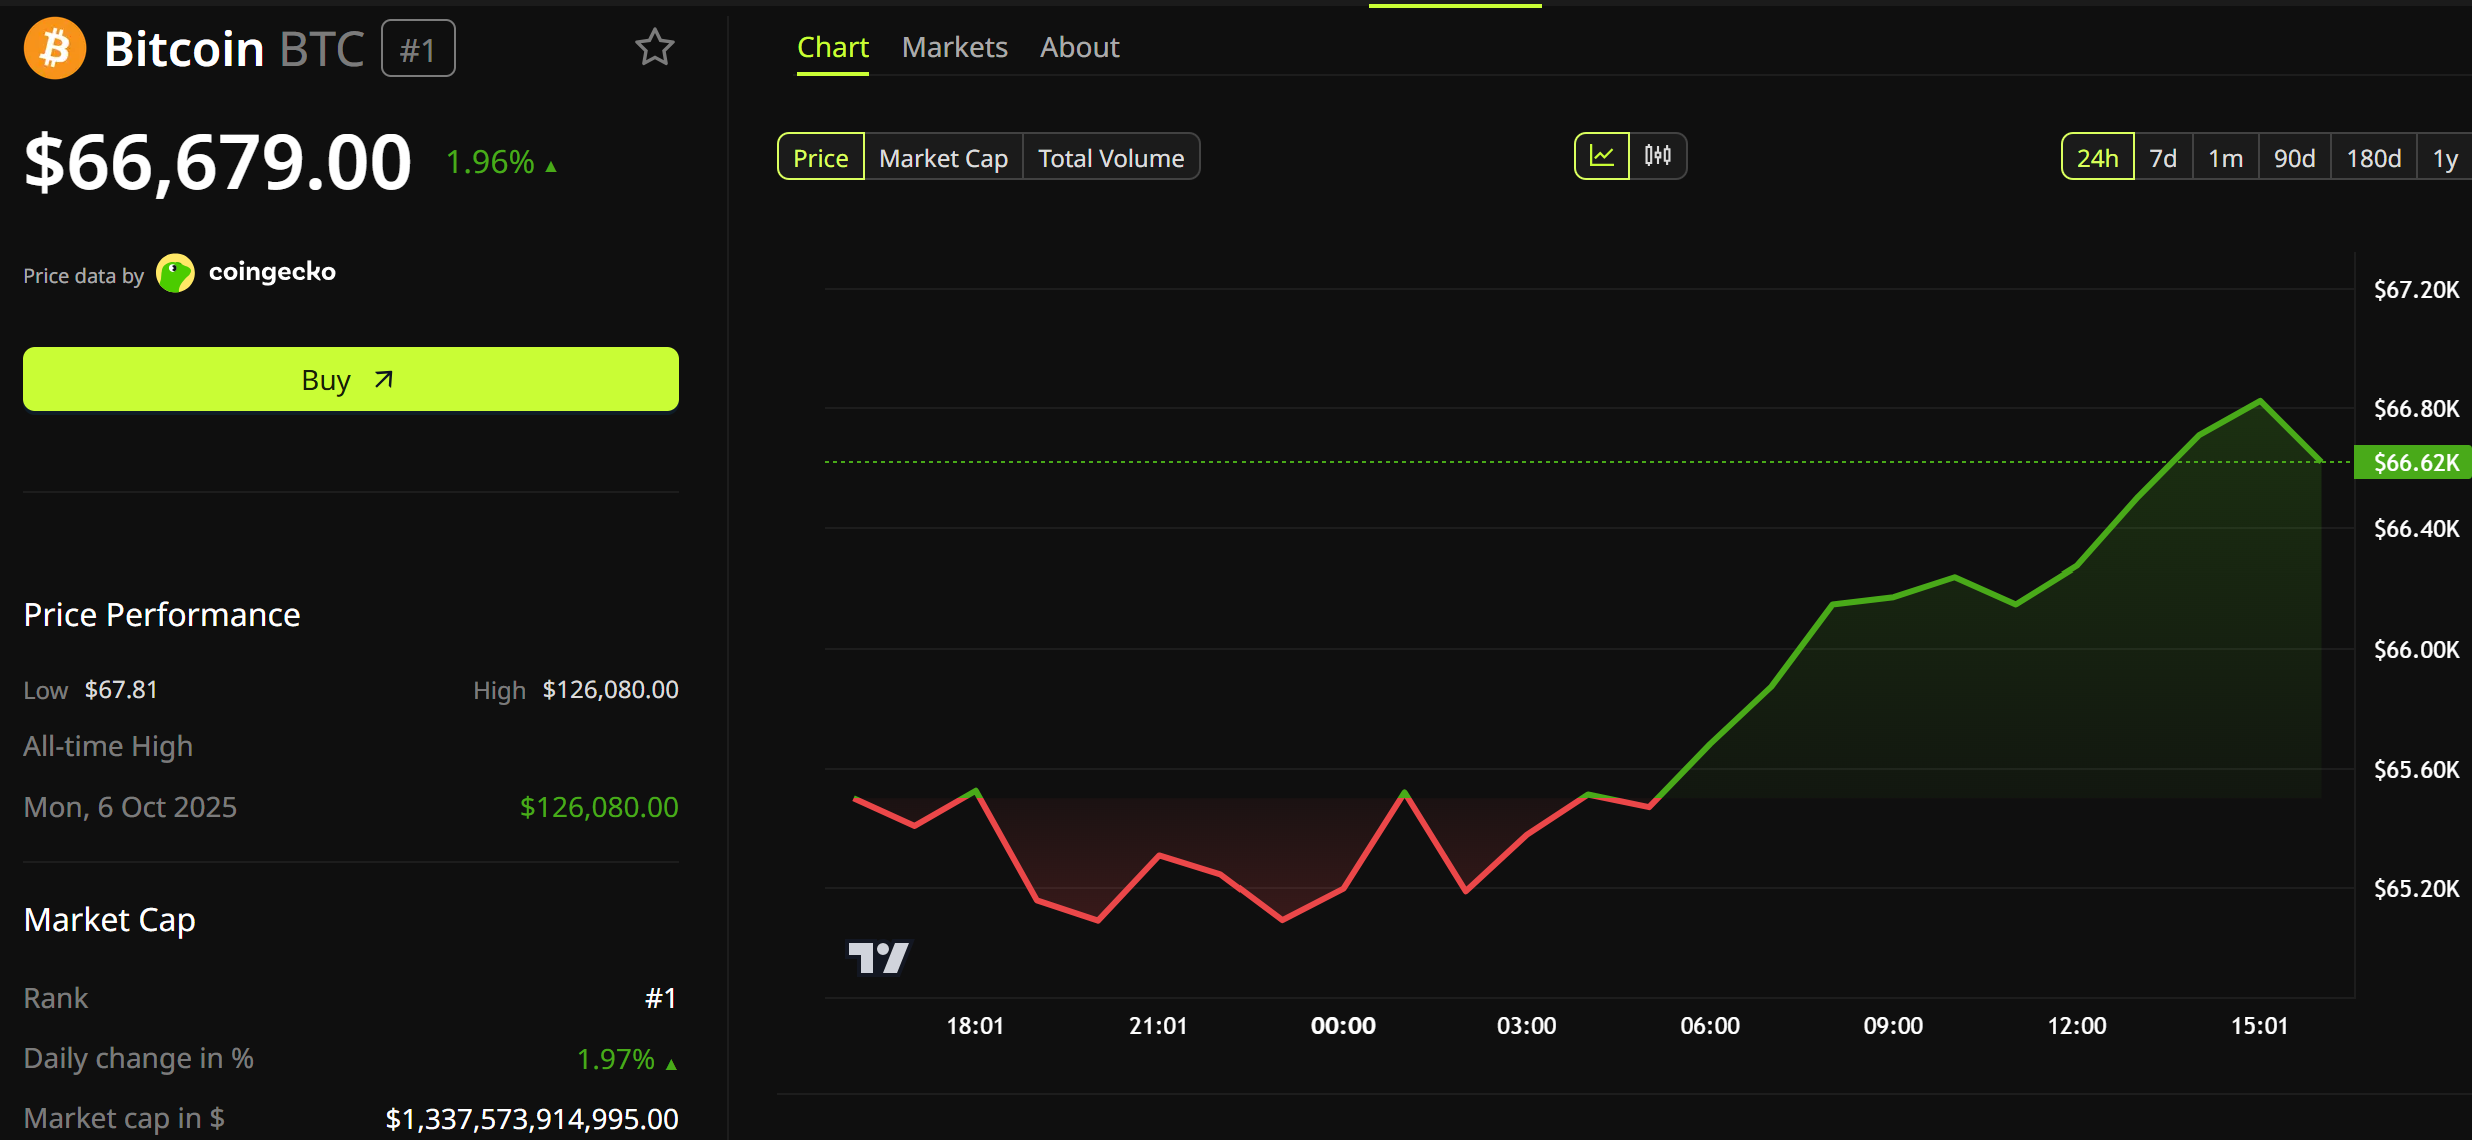
The White House has agreed to the CLARITY Act ethics package. These are the conflict-of-interest rules that froze the crypto bill for months. Treasury Secretary Scott Bessent says the Senate is now at the 1-yard line.
Bitcoin (BTC) climbed toward $67,000 on the news. Here is what the deal says, and why traders like it.

What Is the CLARITY Act Ethics Package?
Start with the bill itself. The Digital Asset Market Clarity (CLARITY) Act would give US crypto its first full federal rulebook.
The split is simple. The Commodity Futures Trading Commission (CFTC) would police digital commodities like Bitcoin. The Securities and Exchange Commission (SEC) would keep tokens that act like securities.
The House passed the bill 294-134 in a bipartisan vote on July 17, 2025. Then it hit a wall. It needs 60 Senate votes, and it stalled before the Senate floor over one clause.
That clause is the ethics package. It would stop the president, the vice president, lawmakers, and senior officials from profiting from crypto while in office.
Follow us on X to get the latest news as it happens
Why did Democrats insist on it? Trump’s money. The president’s annual disclosure listed $635 million in meme coin royalties. It showed another $515 million from World Liberty Financial token sales.
The fight is not new. In May, Senator Chris Van Hollen offered an amendment to ban officials and their families from owning or promoting crypto. Republicans blocked it. The bill cleared committee 15-9, with just two Democrats, Ruben Gallego and Angela Alsobrooks, on board.
Last week, that wall cracked. Trump met Senators Cynthia Lummis and Bernie Moreno in the Oval Office. On Monday, the White House agreed and sent the language to Senate Republicans.
Senator Kevin Cramer, a North Dakota Republican, confirmed one more change. The Department of Justice (DOJ) would enforce the rules, not individual state attorneys general.
Why the CLARITY Act Ethics Package Is Bullish for Bitcoin
The math explains the excitement. Republicans hold 53 Senate seats. At least seven Democrats must cross over. The ethics deal answers their biggest objection. Watch Senators Catherine Cortez Masto and Mark Warner, who want illicit finance safeguards first.
The administration is pushing hard. Bessent said lawmakers are at the “1-yard line,” Bloomberg reported Tuesday. He wants the bill passed before the August recess.
Markets voted fast. The $63 billion market rebound lifted total crypto value 2.8% to $2.32 trillion. Bitcoin trades near $66,604, up 2% in a day. Coinbase stock jumped as much as 12%.

The deeper case is simple. Clear rules end years of regulation by lawsuit. That lowers risk for banks, funds, and custodians. Meanwhile, the Bitcoin ETF inflow streak is back. About $727 million entered US spot funds in five days.
The chart helps too. Glassnode data shows only about 1% of Bitcoin supply last changed hands between here and $70,685. Little stands in the way.

What Could Still Go Wrong
Plenty. Van Hollen and Senator Elizabeth Warren say the draft weakens consumer protections rather than adding them.
“While the CLARITY Act may seek to do that, it not only fails to achieve those goals but also risks deregulating existing markets and opening the door to further corruption and abuse.”
Traders stay cautious too. Last week, Polymarket passage odds fell to 38% for 2026 before the breakthrough. The odds have since sprung up, however, amid recent developments.

History adds a warning. Trump signed the GENIUS Act, the stablecoin law, in July 2025. Crypto’s total value crossed $4 trillion for the first time. Yet regulators missed that law’s one-year rule deadline just last Saturday. Passage is a catalyst, not a finish line.
The clock is the last risk. Majority Leader John Thune must fit a floor vote into a tight Senate floor window before recess starts on August 7.
For now, the bill’s biggest weakness has become its momentum. Bitcoin sits about 5% below $70,000. Watch for the updated text, and for the first Democrat to say yes.
The post What is the CLARITY Act Ethics Package and Why is It Bullish for Bitcoin? appeared first on BeInCrypto.
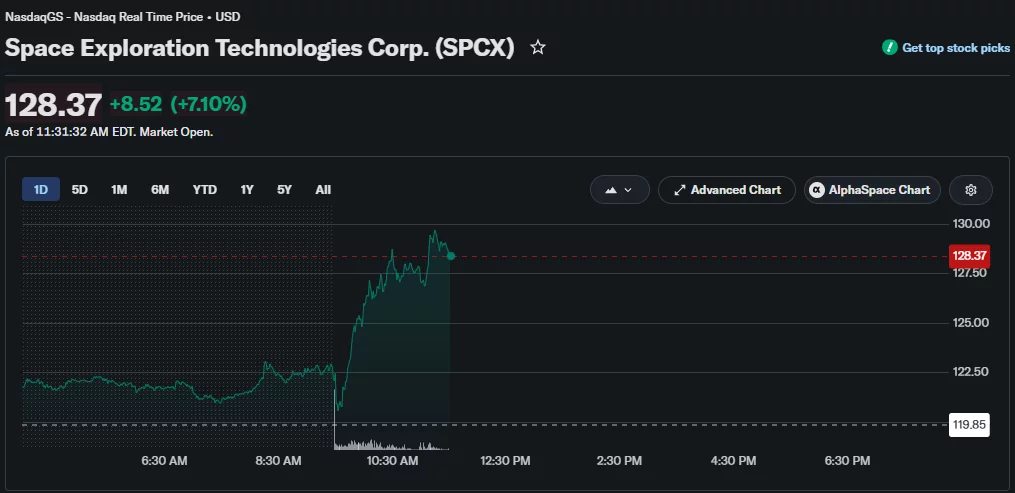
Cathie Wood’s ARK Invest has gained an early paper profit after buying $20.45 million of SpaceX stock one day before the shares jumped 7.10% to $128.37.
Summary
- ARK Invest bought 170,634 SpaceX shares worth about $20.45 million across four ETFs.
- SpaceX stock jumped 7.10% to $128.37, giving ARK an early paper gain.
- ARK’s SpaceX investment has surpassed $475 million despite heavy short selling and IPO losses.
ARK Invest’s July 20 trading disclosure shows that four of the firm’s actively managed exchange-traded funds bought a combined 170,634 SpaceX shares while the stock was trading under its $135 IPO price. Based on Monday’s closing price of $119.85, the purchases were worth about $20.45 million.
During Tuesday’s session, SpaceX shares rose $8.52 to $128.37 as of 11:31 a.m. EDT, according to Nasdaq real-time market data. Applying that increase to ARK’s latest purchase gives the position an unrealized gain of about $1.45 million, although its final value will depend on where the stock trades when the funds sell.
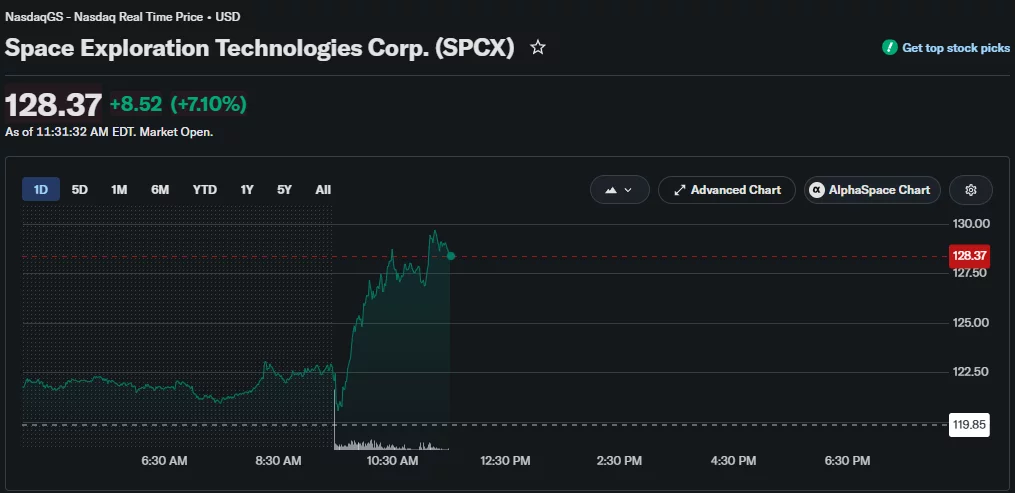
Tuesday’s advance followed a 3.34% decline on Monday, when SpaceX extended a steep retreat from its post-IPO peak. Despite the rebound, the stock remained about 4.9% below its $135 offer price and nearly 43% under its record high of $225.64.
ARK expands its SpaceX exposure
Among the four funds, the ARK Innovation ETF made the largest purchase by adding 97,664 SpaceX shares. ARK’s disclosure valued that position at roughly $11.70 million using Monday’s closing price.
The ARK Autonomous Technology & Robotics ETF purchased another 31,807 shares worth about $3.81 million. At the same time, the ARK Next Generation Internet ETF added 28,153 shares valued at approximately $3.37 million.
Completing the latest round, the ARK Space Exploration & Innovation ETF bought 13,010 shares for close to $1.56 million. ARK spread the purchase across funds with different mandates, although each portfolio gained exposure to the same SpaceX price recovery.
Monday’s transaction followed another large ARK purchase on July 17, when four funds acquired 147,623 SpaceX shares after the stock fell 5.43% to a fresh post-IPO low. According to ARK’s July 17 trading report, those shares were worth about $18.3 million at the closing price of $123.99.
ARKK led that earlier purchase with 95,129 shares valued at approximately $11.8 million. ARKQ bought 30,464 shares worth $3.78 million, while ARKX added 12,611 shares valued at $1.56 million. ARKW completed the transaction with 9,419 shares worth roughly $1.17 million.
Across the July 17 and July 20 disclosures, ARK purchased 318,257 SpaceX shares valued at about $38.75 million at the respective closing prices. The two transactions continued a series of investments that began around SpaceX’s June 12 stock-market debut.
According to Ark Invest Tracker, Wood’s firm had already invested more than $475 million in SpaceX by the week ending July 10. The tracker reported about $52.1 million of purchases during that week, following roughly $444 million of buying around the IPO.
Wall Street’s outlook remains largely positive despite SpaceX’s post-IPO decline. According to an Ark Invest Tracker post citing Reuters data from July 7, analysts had a median price target of $213.50, which implies about 66% upside from Tuesday’s $128.37 price. Raymond James held the highest target at $800, followed by Morgan Stanley at $300, while MoffettNathanson had the lowest estimate at $130.
Short sellers retain large exposure
Although Tuesday’s rally gave ARK’s latest position an early lift, S3 Partners data indicates that bearish traders have benefited from the decline that followed SpaceX’s record high. According to the financial-data firm, short sellers accumulated about $4 billion in paper profits over the previous month.
S3 Partners also estimated that investors betting against SpaceX had shorted about 30% of its freely traded shares, equal to roughly 192 million shares. A large short position can add buying pressure when the price rises because some traders may repurchase shares to close their bets, though S3 Partners had not attributed Tuesday’s gain specifically to short covering.
Operational concerns have also weighed on investor sentiment since the IPO. SpaceX called off Starship’s first planned post-listing flight after an automatic abort triggered by engine problems, according to the original launch update. The cancellation added another setback while the stock was already retreating from its June peak.
Investors are also watching the scheduled expiration of SpaceX’s post-IPO lockup on Aug. 19. According to the lockup details cited in the original report, the expiration could make an additional 900 million shares eligible for trading, potentially increasing the stock’s available supply.
For now, Tuesday’s 7.10% jump has recovered Monday’s entire decline and moved SpaceX closer to its IPO price. Nasdaq data still placed the shares $6.63 below the $135 offer level, leaving ARK’s earlier purchases with different results depending on their entry prices, even as the latest $20.45 million bet moved into profit.
Iberdrola to Take Control of Finnish Utility Caruna for $2.3 Billion

Venice Token Breaks Out with 10% Rally. How Far Will This Altcoin Jump?

Clayface Cover Story Reveals New Details on DC’s Dark R-Rated Horror Film : Coastal House Media


-
 NewsBeat5 days ago
London Mayor Sadiq Khan handed a peerage by Keir Starmer alongside 15 other Labour figures… just days before the PM leaves No10
-

 Fashion4 days ago
Weekend Open Thread – Corporette.com
-
 Politics3 days ago
The House | The City of London can help the new chancellor deliver growth in every postcode
-

 Politics6 days ago
Young campaigners urge incoming PM to act on outdoor junk food ads
-

 Crypto World6 days ago
CFTC blocks Kalshi from unwinding Michigan trades after court order
-
 Crypto World4 days ago
Two July Windows Left: The CLARITY Act’s Senate Fight and What Failure Means
-
 Crypto World3 days ago
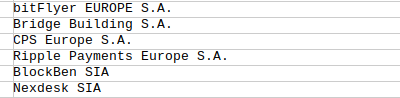
Ripple Payments Joins MiCA With 14 Firms, Does It Mean Anything For XRP?
-

 Business6 days ago
Nvidia Stock Slips After Big Tuesday Rally as Huang Confirms Vera Rubin Chip Is Now in Production Today
-

 Politics2 days ago
Democrats look to World Cup watch parties to register thousands of voters
-
 Entertainment6 days ago
Disney’s Most Ambitious Failed Star Wars Attraction Is Coming to SDCC
-

 Crypto World4 days ago
Ripple wins EU-wide access as ESMA adds it to MiCA register
-

 Crypto World9 hours ago
Grayscale Files For Worldcoin ETF, WLD Registers Sharp Rise
-

 Crypto World5 days ago
Injective Submits SEC Transfer-Agent Registration to Onchain Ownership Records
-

 Business6 days ago
Palantir Shares Rise After Expanded Nvidia Partnership and Fresh Analyst Upgrades Ahead of Earnings Day
-
 Tech17 hours ago
Sail Virtually Aboard The “Itanic” With IA-64 Emulator
-
 Tech14 hours ago
Turtle Beach Command Series KB7 review: a nifty screen-equipped gaming keyboard
-

 Tech7 days ago
Dark Secrets Emerge When Jailbreaking LLMs
-

 NewsBeat4 days ago
Registration is now open for March for Men with Kev 2026
-

 News Videos7 days ago
XRP BOMBSHELL… XRP OMBOARDED FOR TRANSACTIONS!!!
-

 NewsBeat1 day ago
Unregistered fitter used Gas Safe logo on business flyers
You must be logged in to post a comment Login