
Crypto World
XRP Dumps to 21-Month Low as BTC Price Falls to $64K: Market Watch

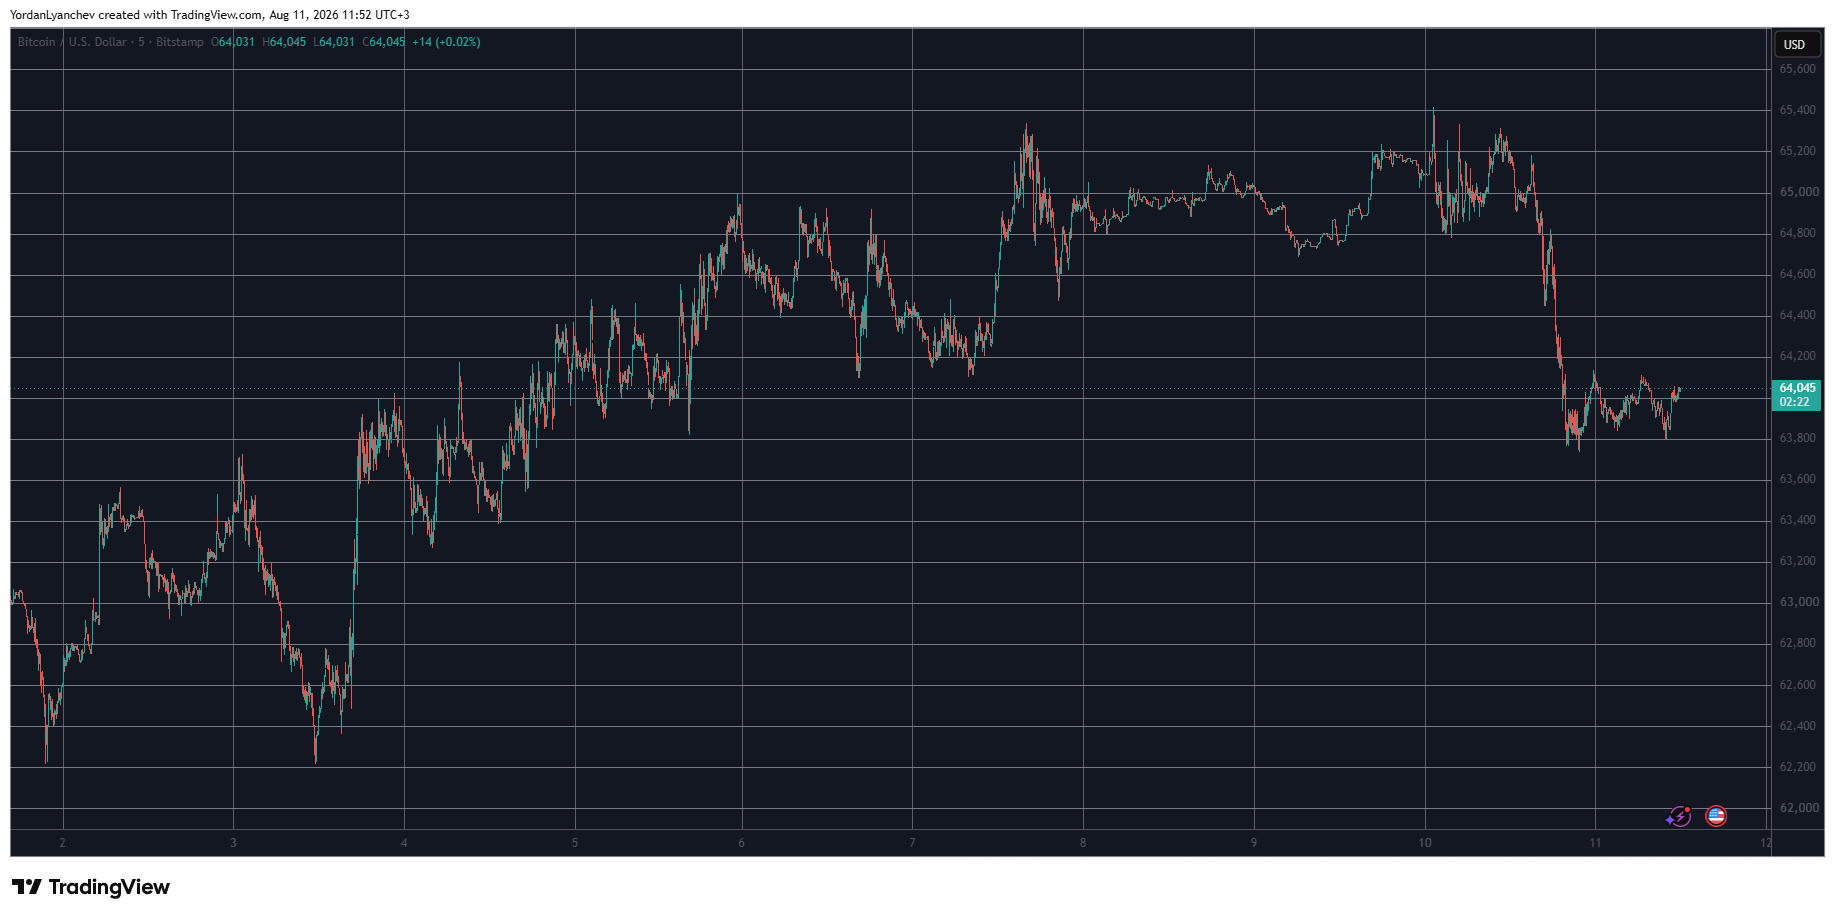
Bitcoin’s price adventure above $65,000 came to a halt yesterday evening as the asset was rejected and driven south by approximately $1,500 to under $64,000.
Several larger-cap altcoins have followed suit, including ETH, which has dropped below $1,900, and XRP, which is just inches away from slipping below $1.00 for the first time since November 2024.
BTC Halted at $65K
The primary cryptocurrency slumped at the beginning of the previous week as well, going from $63,800 to a monthly low of $62,200 within hours before it finally found some support. It erased the losses immediately and even jumped past $64,000 a day later. Its gradual ascent continued for a few days to $65,000 before the CLARITY Act’s latest setback in the US Senate sent it south toward $64,000.
However, that support held, and the weaker US jobs data on Friday resulted in another leg up to $65,400. BTC failed to overcome that level, though, and calmed at around $65,000 for the weekend. It didn’t really make a move for the next 48 hours before it tried a minor breakout on Monday, which was stopped at $65,400 once again.
This time, though, the bears were more persistent and drove the cryptocurrency south to $63,800 as Peter Schiff used the opportunity to urge investors to sell. BTC didn’t dip any further and now sits at around $64,000 once again.
Its market cap has dropped below $1.290 trillion, while its dominance over the alts sits above 57% on CG.
XRP, PI, ADA Drop
Ethereum is down by 2.5% in the past day and now struggles below $1,900. Ripple’s native token is among the poorest performers lately, and it has dipped to a 21-month low at inches above $1.00. It’s now agonizingly close to breaking below that coveted level. ZEC has dumped by almost 5% to under $490, while ADA is below $0.19 after a 4% decline.
In contrast, BNB, TRX, HYPE, DOGE, RAIN, XMR, and LINK have marked some gains within the same timeframe. MNT is up by over 6%, while WLF has gained more than 4%.
Pi Network’s native token has dropped below the $0.09 support after another near-5% daily crash.
The cumulative market cap of all crypto assets has erased around $40 billion since yesterday and is down to $2.250 trillion on CG.

The post XRP Dumps to 21-Month Low as BTC Price Falls to $64K: Market Watch appeared first on CryptoPotato.


Ambiq Micro (AMBQ) on Tuesday beat analyst estimates for the second quarter and with its guidance for the third quarter. Ambiq stock rose in early trading. The Austin, Texas-based chipmaker lost an adjusted 7 cents a share on sales of $33.9 million in the June quarter. Analysts polled by FactSet expected a loss of 26 cents a share on sales…
Copyright ©2026 Investor’s Business Daily, LLC. All rights reserved. 87990cbe856818d5eddac44c7b1cdeb8

Crypto investigators are grappling with one of the toughest loss-allocation problems in digital asset security: estimating theft from self-custody wallets, where there is no authoritative registry of affected users. The ongoing analysis of the Coldcard-related hack is now producing markedly different figures depending on how teams treat “confirmed” victim reports versus on-chain attributions.
Blockchain analytics platform CryptoQuant currently puts confirmed losses at 1,432 Bitcoin, while Galaxy Research and TRM Labs argue the broader toll is higher when tracing suggests additional victims across multiple waves. The discrepancy highlights why hardware-wallet exploits can be hard to quantify—and why investors and security watchers should treat any single number as provisional.
Key takeaways
- CryptoQuant reports 1,432 BTC as a confirmed floor, relying on victim-provided evidence before labeling funds stolen.
- Galaxy Research says it has high-confidence minimum losses of 1,730 BTC, using victim reports to validate wider attack patterns.
- TRM Labs estimates attackers drained roughly 1,816 BTC across 5,200+ addresses in four waves, with the figure expected to keep rising before stabilizing.
- All parties underscore that there is no complete list of affected self-custody accounts, so totals can only be inferred—not definitively counted.
Why Coldcard thefts are difficult to total
Self-custody incidents differ sharply from exchange hacks, where investigators can often begin with a centralized list of compromised accounts or balances. In the Coldcard case, analytics teams instead have to assemble estimates from scattered disclosures—wallet addresses and transaction identifiers shared by victims—then map those to on-chain behavior consistent with the attack.
That structure creates two competing measurement philosophies. One is conservative: count only losses that victims directly confirm, to avoid “false positives” from pattern matching. The other is investigative: use confirmed losses to identify additional wallet clusters and transactions that likely belong to other victims, even when those victims have not yet come forward publicly.
The result is a widening gap between “confirmed” and “attributed” totals—exactly the gap that matters for incident reporting, accountability, and the credibility of downstream security narratives.
Galaxy narrows a moving minimum—backed by victim corroboration
Galaxy’s approach, as explained to Cointelegraph by Alex Thorn, treats early totals as tentative until victim disclosures can corroborate suspected victims and linked on-chain activity. Thorn previously described Galaxy’s earlier estimate—up to 1,816 BTC—as a potential figure rather than a finalized tally.
By Tuesday, Galaxy reported a high-confidence minimum of 1,730 BTC. Thorn also indicated that the minimum could still increase as more victim reports align with the attack’s observed patterns.
In Thorn’s description, the key distinction is between (1) losses directly supported by victim-reported information and (2) additional losses identified through the broader pattern those reports help validate. Galaxy said it has directly confirmed 450+ BTC from victim reports, while those reports have helped uncover other victims in a wider set totaling more than 730 BTC. At the same time, Galaxy said it is still holding back BTC it suspects but cannot yet verify with sufficient corroboration.
For readers, this methodology matters because it suggests a “floor that can rise” dynamic: as the public dataset of victim evidence grows, the subset that analysts can confidently label as theft expands, improving the stability of the totals.
TRM Labs: broader tracing across multiple waves
TRM Labs told Cointelegraph that its independent tracing lands in the same general range as Galaxy. In its more detailed analysis, TRM said its work estimated that attackers drained about 1,816 BTC from more than 5,200 addresses across four waves.
TRM’s Ari Redbord, global head of policy, cautioned that investigators should expect estimates to keep moving upward before settling. That framing aligns with the reality that self-custody victims may take time to discover compromise, identify relevant addresses, and disclose the information needed for analysts to match on-chain traces.
TRM’s results also underline why the same incident can generate different “totals” depending on whether analysts use strict victim confirmations or extend attribution to clusters and transactions that look consistent with the exploit.
CryptoQuant uses victim evidence to avoid inflated claims
CryptoQuant takes a more restrictive stance. According to Cointelegraph, CryptoQuant’s Julio Moreno said the company begins with public reports from victims—including wallet addresses or transaction IDs—then checks those disclosures against known on-chain patterns associated with the Coldcard attack.
With that workflow, CryptoQuant’s current confirmed tally is 1,432 BTC, which Moreno described as a floor that may increase if additional victims publicly reveal the hacked addresses.
Moreno emphasized that CryptoQuant avoids treating on-chain pattern matching alone as a basis for identifying victims, because doing so could produce false positives and inflate the estimate. In his explanation, the fundamental issue is that the stolen Bitcoin belongs to individuals rather than a single centralized entity (like an exchange) that can provide consolidated incident data. As a result, analysts can only confirm what victims disclose.
“Knowing the total BTC stolen is difficult, and it will always be an estimation.”
CryptoQuant’s stance is a reminder that, in self-custody incidents, analytical precision is constrained by data availability. The most cautious number may not reflect the full damage—but it can be the most defensible as “confirmed” while the case is still unfolding.
What others are (and aren’t) tallying
Cointelegraph also reported that Chainalysis has not conducted an independent loss tally. Separately, blockchain investigator ZachXBT publicly stated he has no plans to monitor or trace the incident.
While the absence of a consensus total could frustrate observers seeking a single figure, it also signals that the ecosystem is converging on a shared understanding: without complete victim registries, analysts must balance completeness against verification.
For now, the main thing to watch is whether the announced figures stabilize as more victims submit corroborating wallet data. If disclosures accelerate, the “confirmed” floor should rise and estimates may converge—otherwise the spread between conservative and attributed totals may remain a persistent feature of how self-custody hacks are measured.


MoneyGram, which serves roughly 60 million active customers, views blockchain rails as a way to make cross-border transfers faster, cheaper and easier to track, without requiring customers to think about the technology powering them. Ramps fits into the vision as it connects digital assets into MoneyGram’s extensive brick-and-mortar network to help everyday customers turn tokens into local cash.
“The future of payments is built on access,” MoneyGram CEO Anthony Soohoo said in a statement. “Bringing MoneyGram Ramps to Solana is another step toward building a truly open, global payments network.”
MoneyGram has spent several years building connections between its traditional payments network and crypto. In 2022, it rolled out a service with the Stellar Development Foundation that allowed users to move between cash and Circle’s USDC stablecoin through its retail network, giving crypto wallets a physical entry and exit point for digital dollars.
The firm took that strategy further in June, announcing MGUSD, its own dollar-backed stablecoin issued by Bridge, the stablecoin infrastructure company owned by Stripe, on the Stellar network.
The company has also been deepening its ties with Solana, becoming a validator in June, helping process and secure transactions on the network.
MoneyGram was also listed as a one of the partners in Open USD, the Stripe-led stablecoin initiative that aims to share revenue with a consortium of backers.


BTC USD sits at $64,000, down -1.5% on the day, still pinned under the ceiling that’s frustrated bulls for weeks. The bigger story: a labor market miss that should have triggered a relief rally instead got shrugged off entirely. That disconnect matters more than the headline number for this week’s Bitcoin price prediction.
Employers cut 23,000 jobs in July, the first net loss since the pandemic-era recovery, badly missing the 95,000 gain economists penciled in. Markets read the miss as rate-cut fuel and Treasury yields dropped.
Risk assets were supposed to catch a bid. Bitcoin tapped its 50-day average and rolled straight back over, rejecting the level cleanly on the daily candle.
The rejection fits a pattern that’s held since the May peak near $80,000: lower highs, lower lows, a death cross that macro tailwinds can’t seem to dislodge. That’s the technical backdrop worth understanding before deciding what comes next.
Bitcoin Price Prediction: Can BTC USD Hit $65,000 This Week?
BTC is trading in a tight band, with CoinLore showing support at $63,766 and resistance at $65,000. A break above that ceiling opens room toward $67,081, and eventually $78,085, according to CoinLore’s model. The 7-day forecast lands at $63,935, essentially flat, which tells its own story.
The RSI reads 50, dead neutral. Neither camp has conviction right now. The 50-day EMA still trades below the 200-day, and bulls needed a daily close above that shorter average to even start flipping the read, they didn’t get it.
Bull case: a clean reclaim of $65,000 opens a path toward $67,000-plus.
Base case: continued consolidation between $63,766 and $65,016, chopping traders on both sides.
Bear case: a break below $62,216 (the prior swing low) confirms the downtrend has legs. For deeper technical context, this breakout analysis and this CPI-driven forecast are worth a read before positioning either direction.
LiquidChain Targets Early Mover Upside as Bitcoin Tests Key Levels
A death cross that shrugs off a jobs miss isn’t a market begging to be bought at these levels. Bitcoin at a $1.3 trillion market cap doesn’t offer the kind of asymmetric upside early-stage capital tends to chase; the coin’s most explosive growth phases are, arguably, behind it. That’s pushing more traders toward presale-stage infrastructure plays where the ceiling hasn’t been priced in yet.
LiquidChain ($LIQUID) is building a Layer 3 execution environment that fuses Bitcoin, Ethereum, and Solana liquidity into one unified layer; developers deploy once and access all three ecosystems rather than fragmenting liquidity across chains.
The presale has raised $936,891.74 at a current token price of $0.01489. Core features include Single-Step Execution and Verifiable Settlement, both aimed at solving the liquidity fragmentation problem that’s plagued cross-chain DeFi since its inception.
Visit the LiquidChain Presale Website Here.
This is not financial advice. Crypto markets are highly volatile and presale tokens carry elevated risk. Always conduct independent research before investing.
The post Bitcoin Price Prediction: Will $64K Hold Ahead of Tomorrow’s CPI Data? appeared first on Cryptonews.


The first bad block appeared at height 4,487,776 at 15:44 UTC on Aug. 7. Once the weakness had been demonstrated on the live network, others appeared to copy it and produce invalid blocks of their own. Ravencoin has since released a fix, but patching the software does not undo what is already written.
The two pools, 2Miners and RavenMiner, are building their version from block 4,487,775, the last one before the exploit. The project said it asked them to restart from a more recent point, which would put less history at risk, but they declined.
Some transactions caught in the gap may be picked up again and recorded on the replacement chain. Ravencoin further warned exchanges and other services not to assume that deposits or withdrawals wiped out this way will return on their own, and advised them to suspend both until the network settles on a single version.
Exchanges have started responding. Bitvavo suspended RVN deposits and withdrawals as a precaution, citing the exploited vulnerability. South Korea’s Upbit placed an investment warning on RVN across its won, bitcoin and tether markets and also stopped deposits.
The project stopped short of endorsing the pools’ plan, saying the details were being shared for transparency rather than as support for any particular version of the chain.


Australia’s financial crime watchdog suspended crypto ATM operator Cryptolink Pty Ltd for three months, forcing the firm to shut down 96 machines across the country.
The Australian Transaction Reports and Analysis Centre, known as AUSTRAC, said the suspension took effect Aug. 9. Cryptolink cannot provide virtual asset services while the order remains in place.
Crypto ATMs allow customers to use cash to buy cryptocurrency, serving as a bridge between fiat currency and crypto. AUSTRAC said it remains concerned about Cryptolink’s ability to manage transactions that carry a higher risk of money laundering or terrorism financing.
The regulator said Cryptolink initially met the terms of an enforceable undertaking imposed in October 2025. The company later failed to submit required threshold transaction reports and did not respond to an AUSTRAC information request.
AUSTRAC CEO Brendan Thomas said those failures made the business “too high risk to continue operating at present.”
The earlier undertaking followed an investigation by AUSTRAC’s Cryptocurrency Taskforce into alleged breaches of anti-money laundering and counter-terrorism financing rules. The regulator cited late transaction reports and weaknesses in Cryptolink’s risk assessments.
AUSTRAC also issued Cryptolink a fine of 56,340 Australian dollars ($36,600), which the company paid.
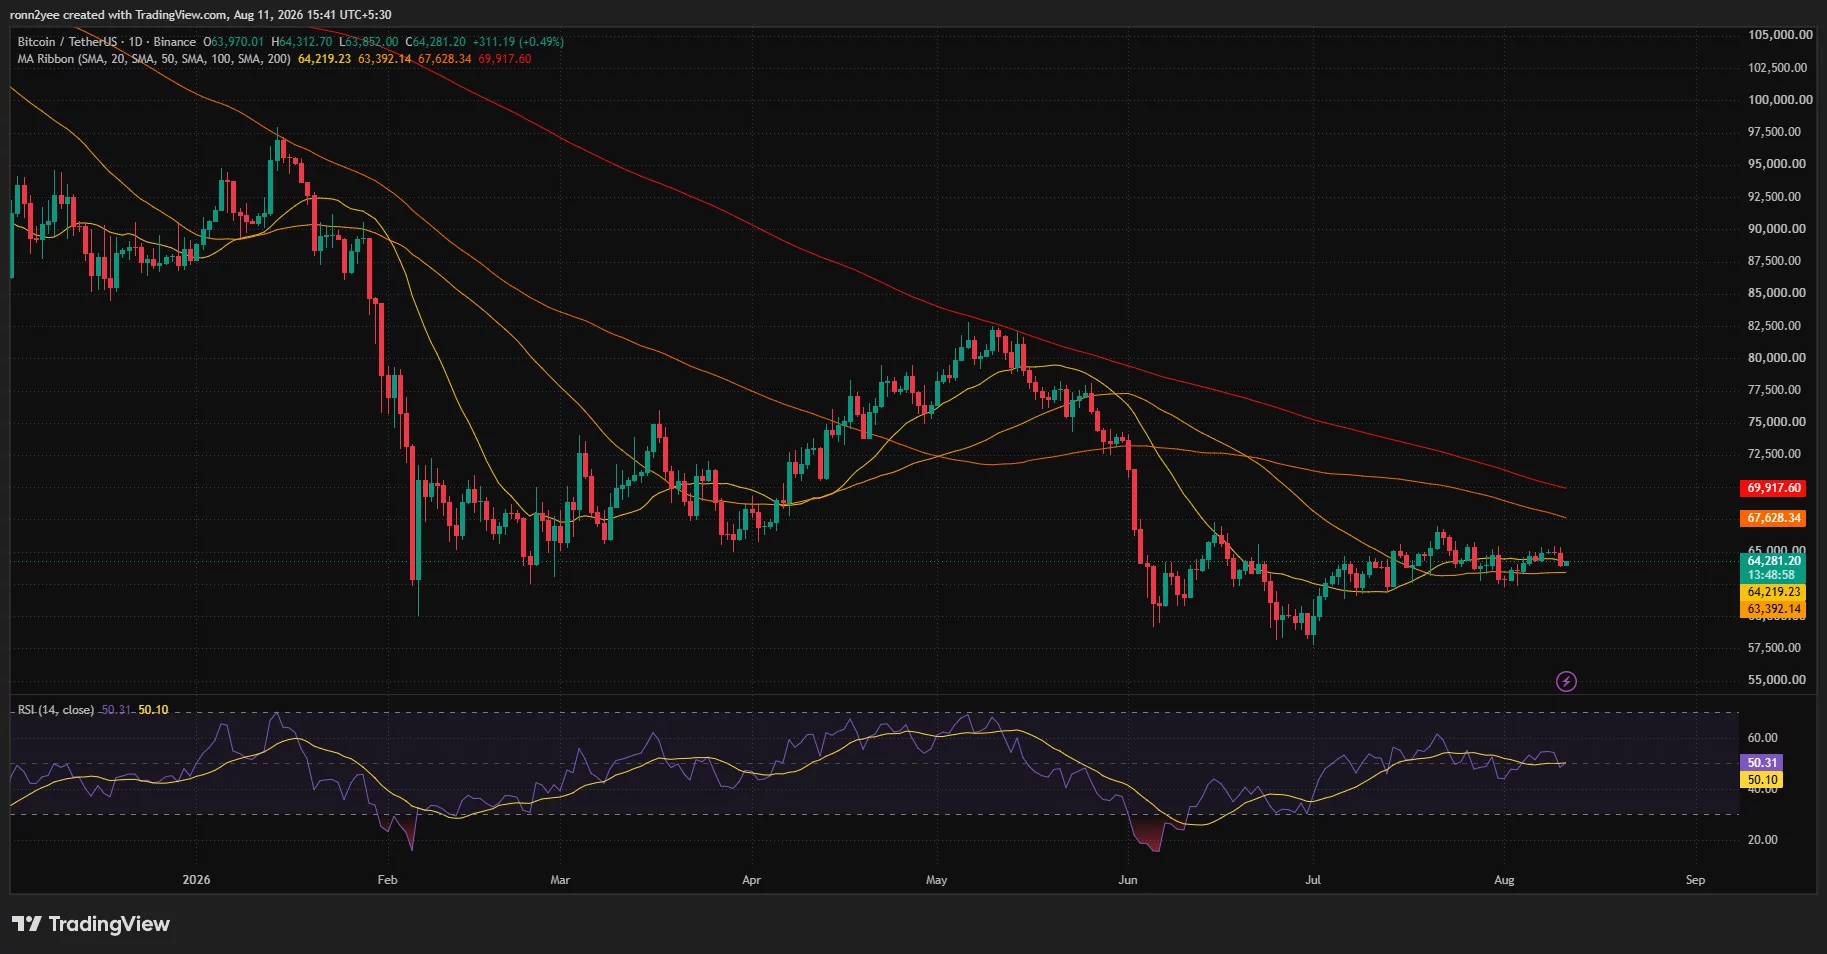
Bitcoin price fell below $64,000 on Aug. 11 as rising oil prices and uncertainty before the U.S. inflation report weakened risk appetite, leaving traders focused on whether the $63,900 support level can prevent a deeper correction.
Summary
- Bitcoin price fell about 2% to $63,780 before recovering above $64,000 during the session.
- The $63,900–$64,000 region is the main short-term pivot ahead of the July CPI report.
- Daily RSI remains neutral at 50.31, while BTC trades below its 100-day and 200-day moving averages.
- Liquidation clusters near $63,700 and $65,600 could attract price during the next volatility spike.
Bitcoin price drops below $64,000
According to data from crypto.news, Bitcoin (BTC) price traded as low as $63,852 on Binance before recovering to approximately $64,281 at the time the daily chart was captured. The intraday rebound reduced the loss, but BTC remained below the $65,000 level that buyers had attempted to establish as support over the previous four days.
The decline followed another deterioration in U.S.-Iran negotiations over reopening the Strait of Hormuz. Brent crude rose above $89 a barrel as reduced hopes for an agreement renewed concerns about energy supplies and inflation.
Higher oil prices can complicate the Federal Reserve’s inflation outlook by raising transportation and production costs. That pressure reduced demand for risk assets as U.S. traders prepared for the July Consumer Price Index report.
Broader crypto markets also weakened during the move. Ether and XRP fell more than 2%, while Bitcoin lost the $64,000 level after failing to hold above $65,000.
SoSoValue data shows that institutional demand offered limited support. U.S. spot Bitcoin exchange-traded funds recorded $144.6 million in net outflows on Aug. 10, ending five consecutive sessions of positive flows. The reversal reduced one source of spot demand as macroeconomic uncertainty increased.
Daily chart shows Bitcoin trapped in consolidation
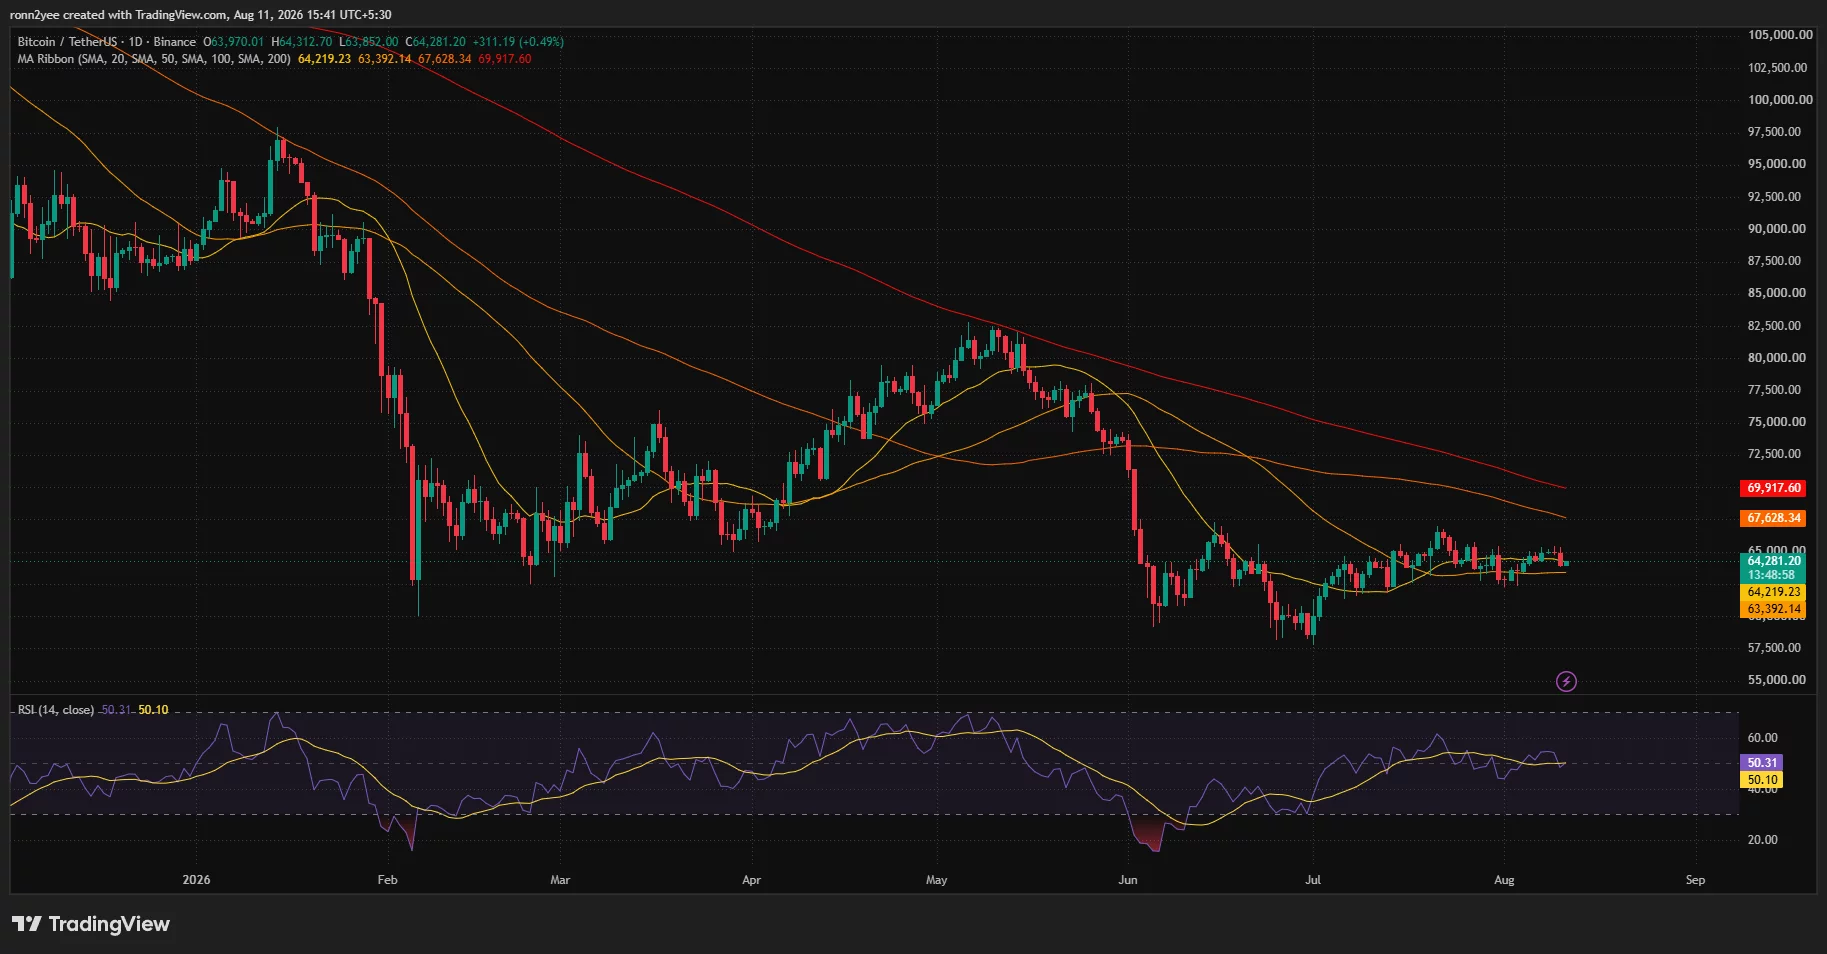
The daily chart shows that Bitcoin’s price remains locked inside the broad range formed after the June decline. BTC has repeatedly found buyers near $60,000–$63,000, but attempts to establish a sustained recovery above $65,000 have failed.
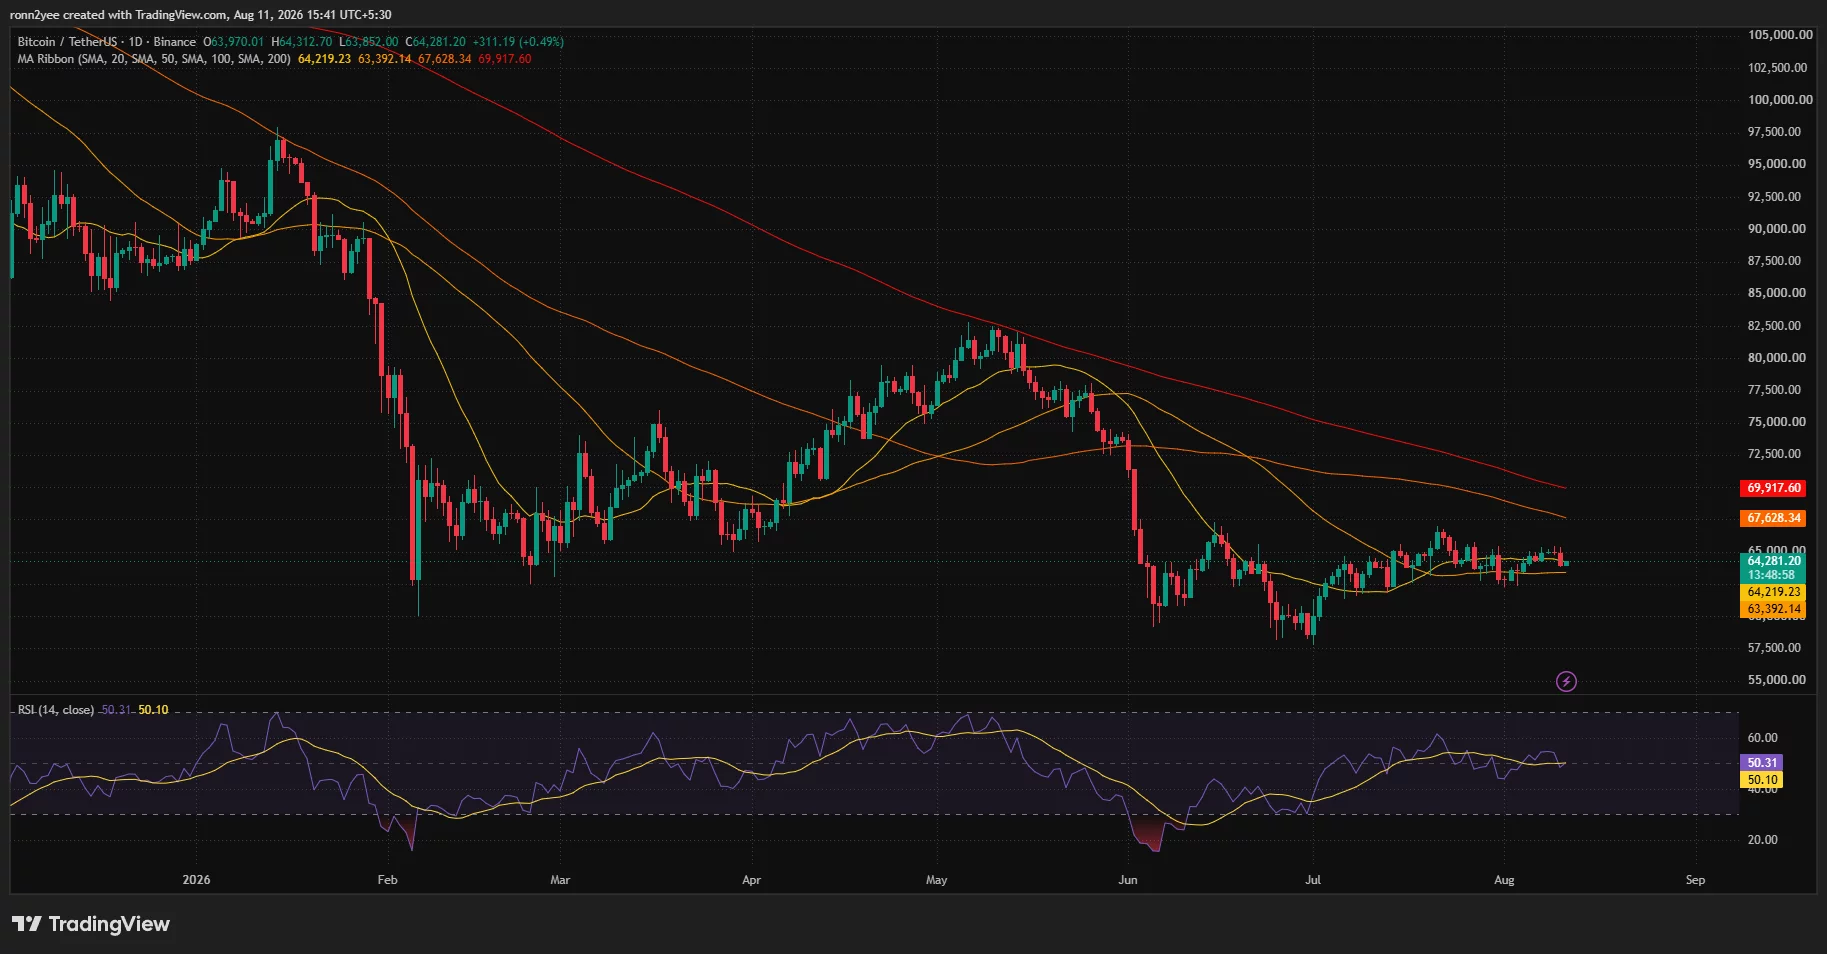
The asset was trading slightly above its 20-day simple moving average at $64,219 and its 50-day SMA at $63,392. Holding both averages would keep the short-term recovery structure intact despite the latest sell-off.
However, the wider trend remains under pressure. Bitcoin continues to trade below the 100-day SMA at $67,628 and the 200-day SMA at $69,918. Those averages are also sloping downward, creating a large resistance area between approximately $67,600 and $70,000.
The daily relative strength index stood at 50.31, almost level with its signal line at 50.10. The reading shows that neither buyers nor sellers have decisive momentum. It also supports the view that Bitcoin remains in consolidation instead of entering a confirmed directional trend.
A daily close below the 50-day SMA at $63,392 would weaken the recovery and expose $62,000, followed by the June-July demand zone between $57,500 and $60,000. Conversely, a close above $65,500 would give buyers another opportunity to challenge the 100-day SMA.
$63,900 is the key Bitcoin support
The 4-hour chart places immediate support between $63,900 and $64,000. Bitcoin briefly moved that region below during the sell-off before recovering, indicating that buyers were still active around the weekly midpoint.
Trader Lennaert Snyder described $63,900 as an important level because it represents the 50% mark of the previous weekly candle. He said holding or losing that price could determine momentum for the remainder of the week.
Under the bullish scenario, continued support near $63,900 could produce another move toward the previous weekly high around $65,500. That level rejected Bitcoin during its latest advance and remains the first major barrier above the current range.
A bearish break would become more convincing if BTC loses $63,900 and falls below the recent $63,200 low. Such a move could send BTC price toward $62,000 and allow sellers to target the lower part of the wider consolidation range.
The 4-hour Supertrend has turned bearish, placing resistance at $65,210. Bitcoin also slipped below the indicator’s former support near $64,344 during the decline. Bulls must reclaim both levels before the short-term trend can return to a stronger position.
Bull-bear power stood at negative 612, confirming that sellers had regained short-term control. However, the negative reading was smaller than the extreme levels recorded during earlier June sell-offs, suggesting that bearish momentum had not yet reached capitulation conditions.
Trader Daan Crypto Trades similarly identified $64,000 as the main pivot. He noted that BTC had closed slightly below the 4-hour 200-period moving averages but had started to stabilize, with several large-cap altcoins still showing relative strength.
Liquidation heatmap points to $63,700 and $65,600
The one-week CoinGlass liquidation heatmap shows large concentrations of leveraged positions on both sides of Bitcoin’s current price.
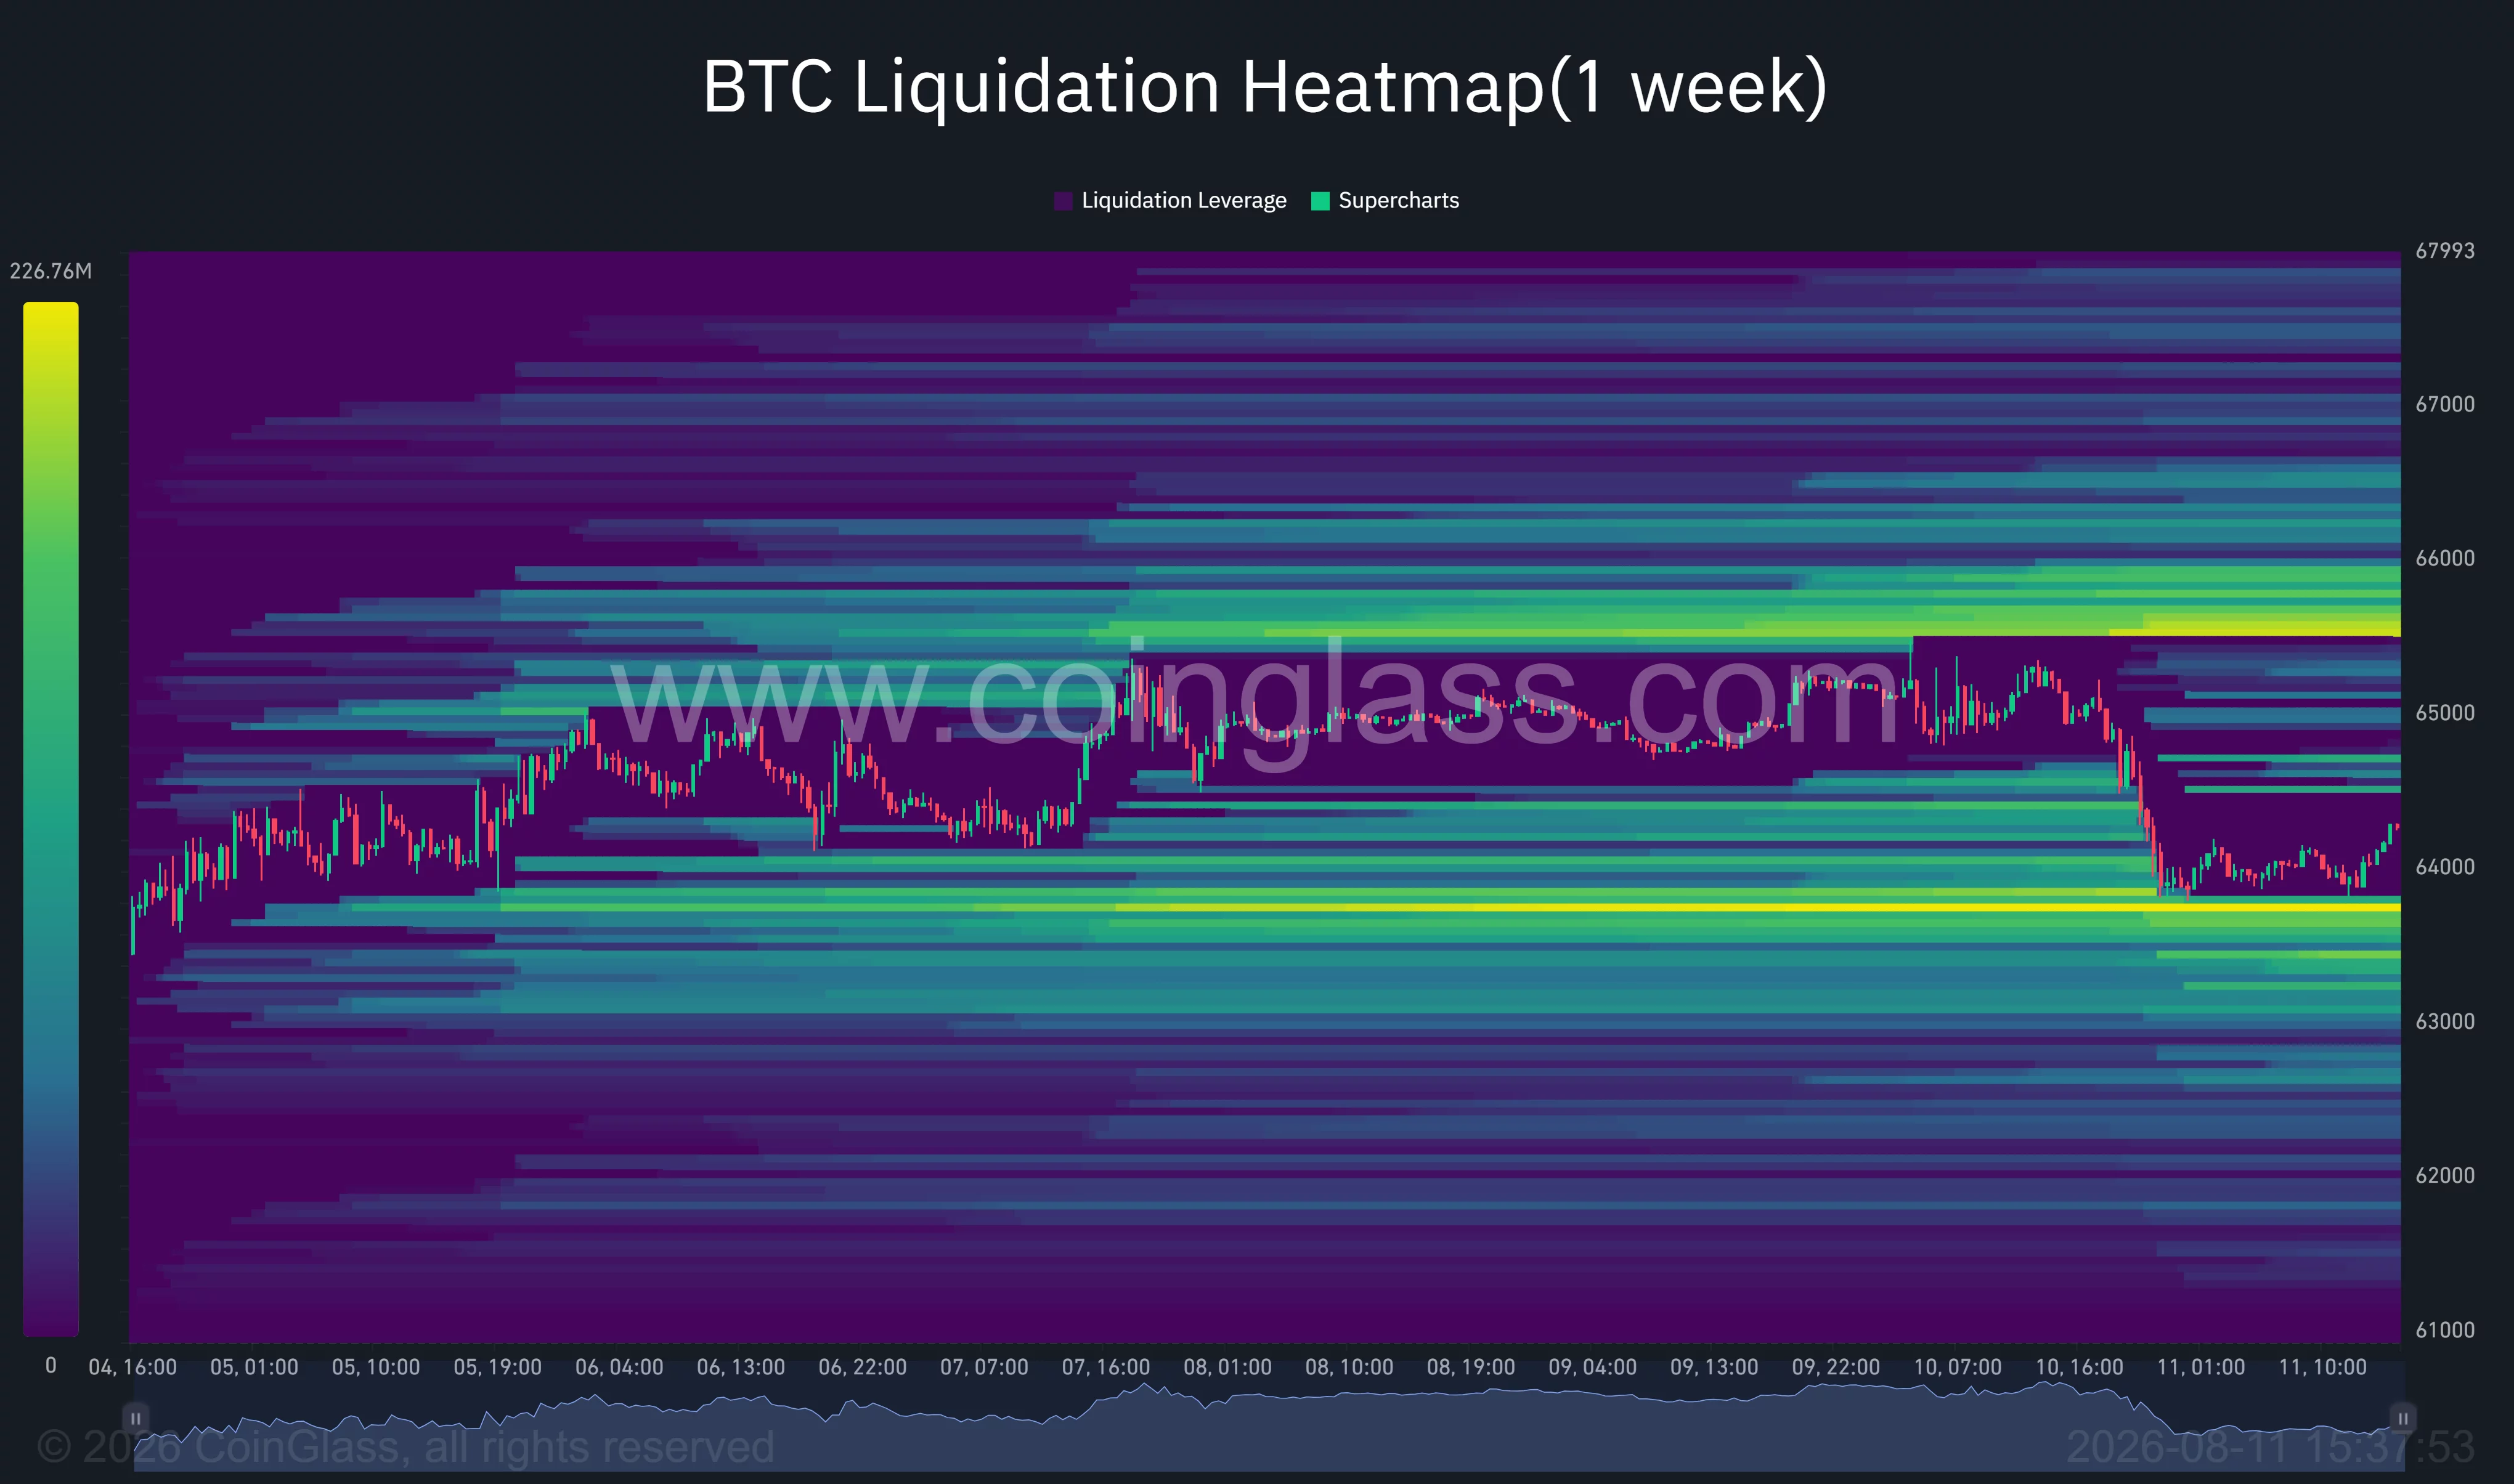
The closest downside liquidity cluster sits around $63,600–$63,800. Bitcoin tested this region during the latest decline but did not produce a sustained breakdown. A second pocket is visible between $63,200 and $63,400.
If $63,700 fails, forced selling could accelerate the move toward the lower cluster. However, the concentration of liquidity can also attract buyers looking to enter after leveraged long positions have been cleared.
The largest nearby upside band sits around $65,500–$65,700. A rebound through $65,000 could therefore trigger short liquidations and help BTC revisit the weekly high. Additional liquidity appears near $66,200 and $67,000, but those levels would require a confirmed breakout from the current range.
This positioning leaves Bitcoin vulnerable to a sharp move in either direction. Price is trading between the closest major liquidation pools, while the upcoming inflation release provides a clear catalyst for volatility.
U.S. CPI could decide Bitcoin’s next move
The U.S. Bureau of Labor Statistics will publish July CPI data on Aug. 12 at 8:30 a.m. Eastern Time. The report could influence expectations for the Federal Reserve’s September policy decision, particularly after rising oil prices renewed inflation concerns.
A cooler reading could ease pressure on Treasury yields and help Bitcoin recover $65,000. Breaking $65,500 would expose the $65,600 liquidation cluster, followed by the 100-day SMA near $67,628.
A hotter reading would strengthen the case for restrictive monetary policy and could pressure speculative assets. Under that outcome, a confirmed loss of $63,900 would shift attention toward $63,200, $62,000, and eventually the $60,000 psychological support.
Regulatory uncertainty also remains in the background. The CLARITY Act’s procedural vote was delayed until Sept. 15, removing a near-term policy catalyst that some U.S. investors had expected before the Senate recess.
For now, Bitcoin remains range-bound rather than decisively bearish. The $63,900–$64,000 zone separates a possible recovery toward $65,500 from a deeper move toward $62,000. The CPI release will likely determine which liquidity pool the market tests first.
Disclosure: This article does not represent investment advice. The content and materials featured on this page are for educational purposes only.
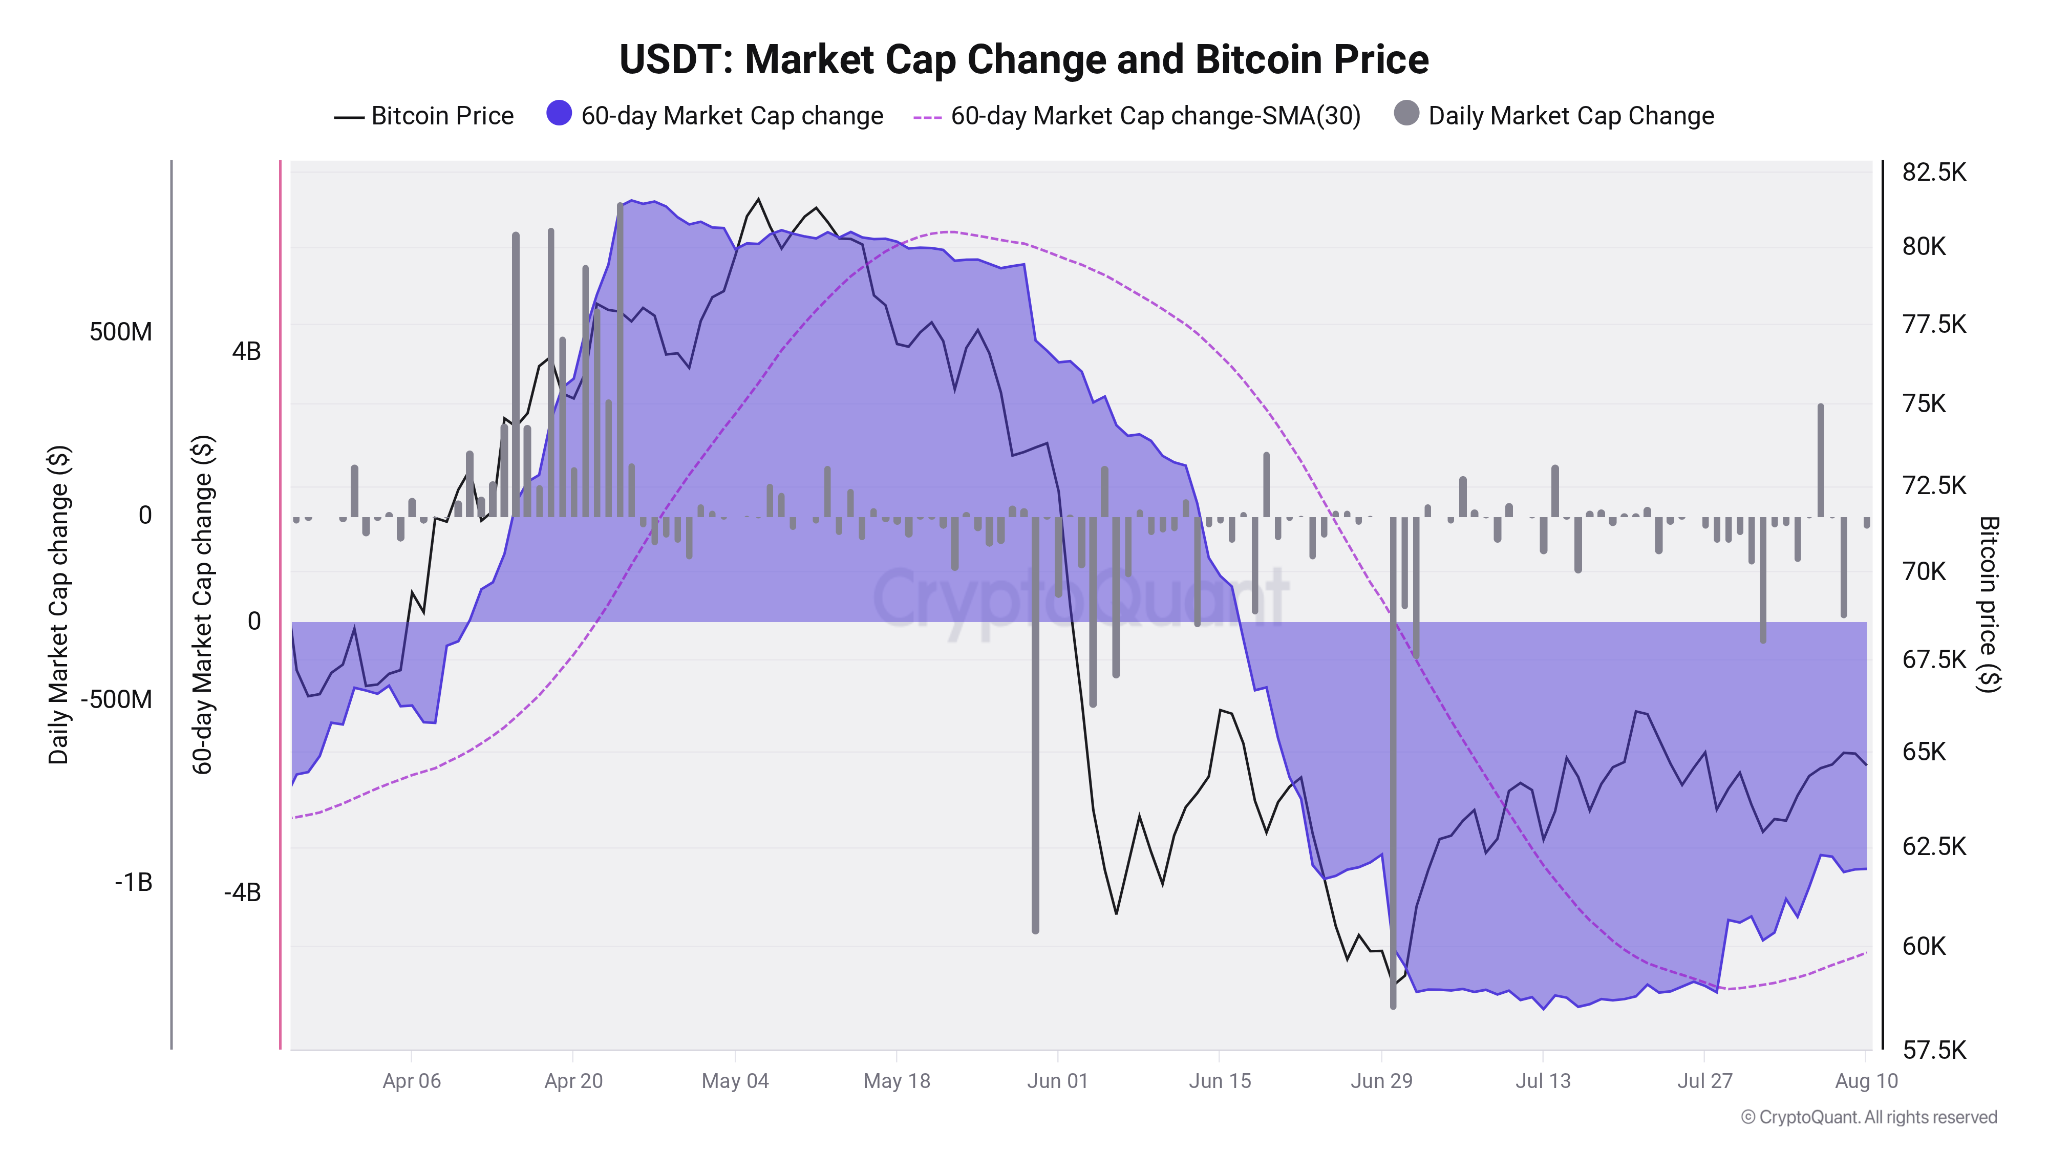
Biggest stablecoin Tether (USDT) has shed $4 billion in market cap in just two months, but history suggests that the downturn is nearly over.
Key points:
- Tether’s 60-day rolling market-cap contraction stays near $4 billion in one of its heaviest drawdowns.
- Analysis suggests that the worst of bear-market selling pressure could be over as a result.
- Comparison to 2022 bear-market highlights an ongoing RSI divergence.
USDT drawdown puts “acceleration” of Bitcoin selling in doubt
Onchain analytics platform CryptoQuant in a blog post last week flagged market cap “undergoing one of its sharpest contractions on record.”
“The deterioration has also accelerated at the margin: nearly $870 million of USDT supply disappeared over the latest 11-day period, showing that the contraction is not merely a legacy effect from earlier redemptions,” analysts wrote.
CryptoQuant data puts the 30-day simple moving average (SMA) of 60-day USDT market-cap change at minus $4.88 billion as of Aug. 10.
USDT 60-day market-cap change vs. BTC/USD. Source: CryptoQuant
The extent of the drawdown echoes crypto bear markets and rivals the largest ever seen. Its severity has implications for Bitcoin and the broader market recovery. Stablecoins provide a key source of liquidity, and when this evaporates, less capital or “dry powder” is available for deployment, showing a lack of interest among investors in stepping in at a given price.
“The caution is that correlation between USDT flows and BTC price doesn’t settle causality. Both likely respond to the same risk-off conditions, with redemptions accelerating alongside spot selling rather than strictly ahead of it,” CryptoQuant analysts said. They added:
“Periods of sustained USDT expansion have generally coincided with stronger Bitcoin price regimes, while prolonged contractions have accompanied weaker demand, deeper corrections, and deteriorating market conditions.”
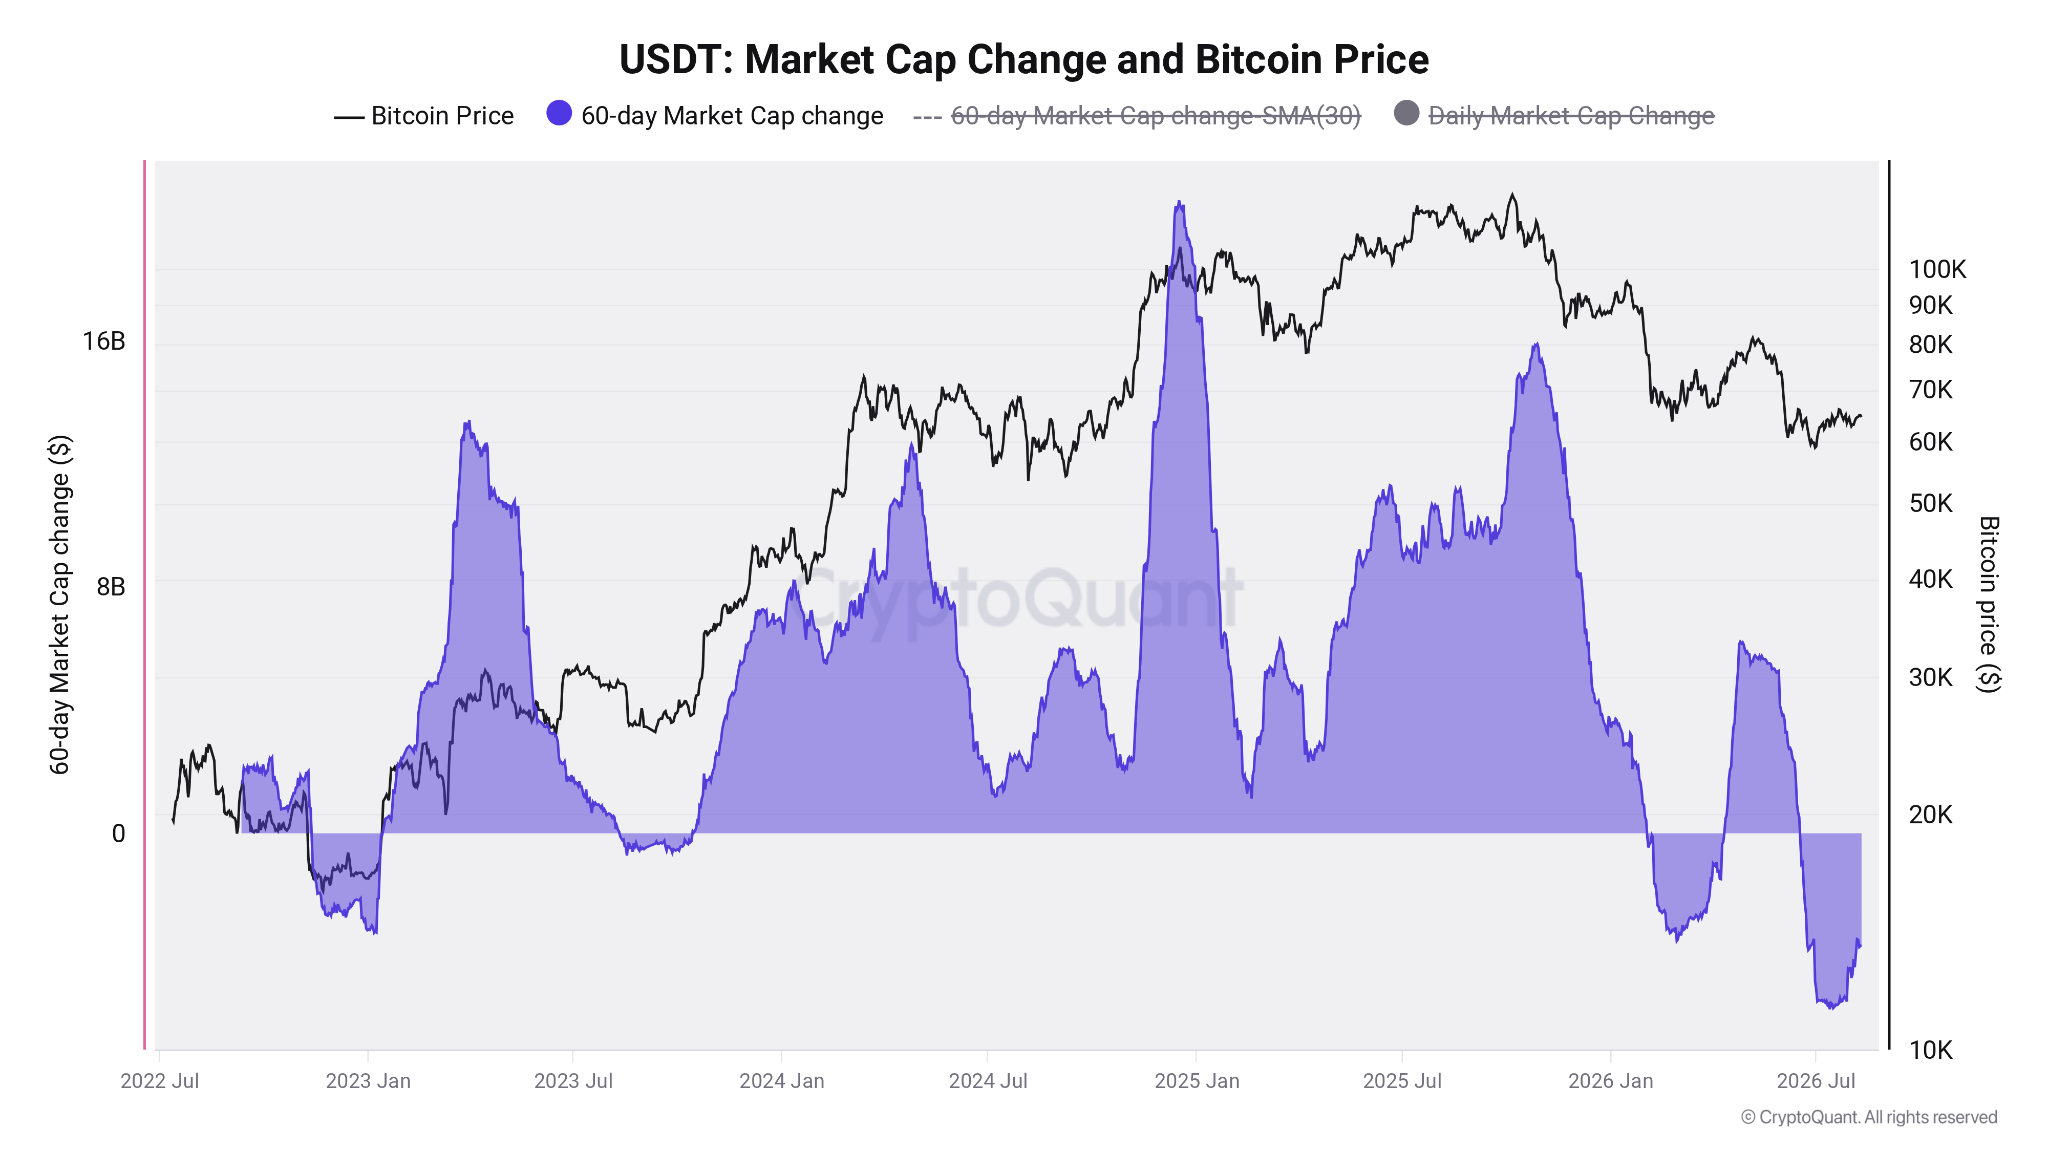
Expanded USDT 60-day market-cap change vs. BTC/USD. Source: CryptoQuant
The steepest 60-day contraction period for USDT market cap completed on July 13, when it reached minus $5.72 billion.
Zooming out, CryptoQuant notes that the most pronounced contraction phases have historically occurred in the final phases of macro market downturns.
“Historically, the market’s deepest USDT contraction phases have also marked points where selling pressure was closer to exhaustion than to further acceleration,” it added.
Weekly RSI divergence echoes 2022 reversal
The findings add to the mounting body of evidence that suggests the current bear market is in its final stages.
Related: Binance Bitcoin volume ratio hits record as futures outweigh spot eight times over
As Cointelegraph continues to report, consensus among market participants increasingly favors a new Bitcoin macro bottom forming before the end of 2026. Both comparisons to previous bear markets and onchain indicators, however, see the downturn continuing in the short term.
Independent analyst William Clemente’s Aug. 8 BTC outlook echoed the prognosis while describing the Bitcoin network as “fundamentally healthy.”
“I think Bitcoin is ‘cheap’ although we could have a leg lower at some point throughout the year,” he summarized.
Two days later, he highlighted an unfolding bullish divergence between BTC/USD and the relative strength index (RSI) on weekly time frames — a classic leading indicator for a market reversal which accompanied the end of the 2022 bear market.
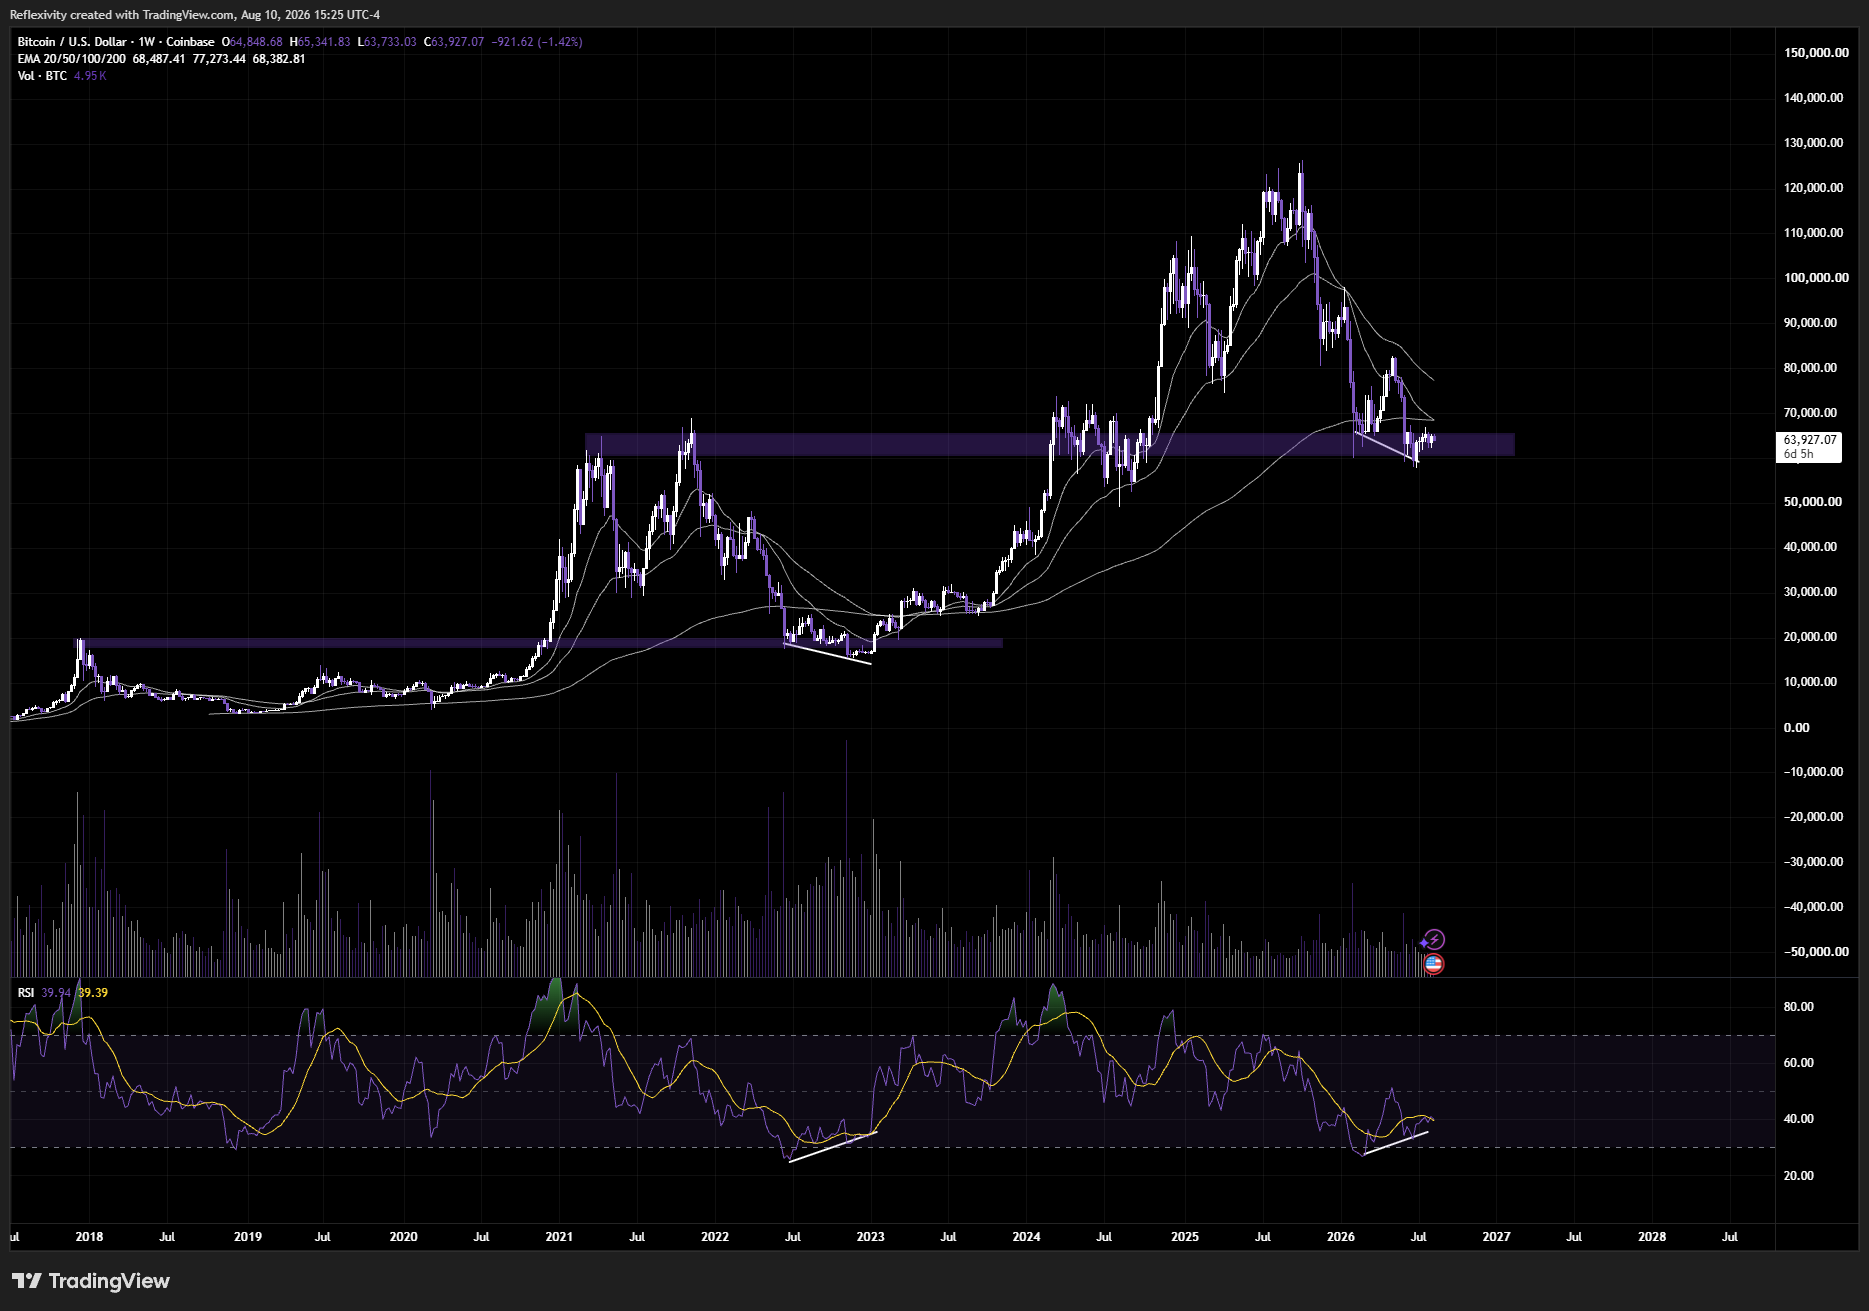
BTC/USD one-week chart with RSI divergences marked. Source: William Clemente on X.com
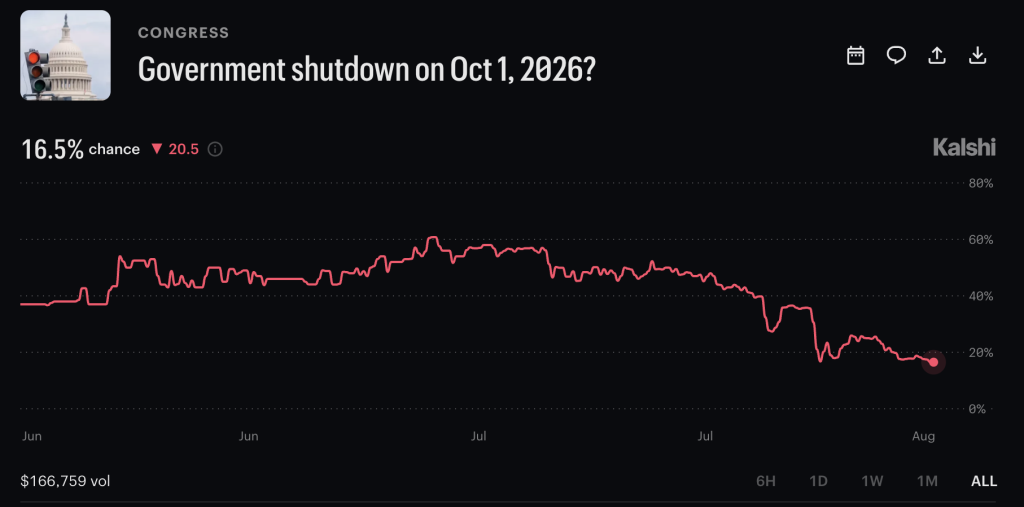
The Senate passed a short-term funding measure by a 90-6 vote, reducing the immediate odds of a US government shutdown and removing one macro overhang for risk assets heading into the fall. Bitcoin is just about managing to hold onto $64,000, with Government shutdown odds increasing.
The bill funds federal agencies at current levels through December 11, but it still needs House approval and Trump’s signature before the threat is actually removed.
That distinction matters more than the headline vote count. A Senate funding bill passing by a wide bipartisan margin is a signal of intent, not a resolved outcome, and for Bitcoin, which has spent the past year trading as a rate-and-liquidity proxy as much as a risk-on tech asset, the gap between “Senate passed it” and “it’s law” is exactly where volatility tends to live.
Discover: Everyone’s Got a Take. Join Kalshi and Get a Free $25 to Actually Trade Yours
Government Shutdown Odds and Why the House Vote Still Matters
The House has already passed its own version of a continuing resolution that funds the government only through December 4, a week earlier than the Senate’s December 11 target.
Reconciling those two bills is not a formality; the chambers will need to work out the actual funding date and any policy riders attached to it before either version reaches the president’s desk.
Senate leadership moved unusually early, nearly two months ahead of the typical eleventh-hour scramble, in part to avoid repeating a shutdown during election season.
That urgency followed a stretch of shutdown fights that have already tested market patience once this year, and traders are unlikely to fully exhale until the House sends something Trump can sign.
Discover: Your Market Calls Are Worth Something. Start With Free $25 on Kalshi
Government Shutdown Odds On Polymarket: What Reduced Shutdown Risk Actually Does for Crypto Markets
A government shutdown does two things that matter directly to crypto markets: it delays official economic data releases- CPI, jobs reports, GDP revisions- that traders use to price Fed policy, and it stalls regulatory and legislative work at agencies like the SEC and CFTC, along with congressional efforts on market-structure legislation.
Both are Bitcoin-relevant. Delayed data widens the uncertainty band around rate expectations, and stalled legislative work pushes back timelines on the kind of regulatory clarity crypto markets have been pricing in for months.
Removing near-term shutdown odds doesn’t create a bullish catalyst on its own; it removes a tail risk. That’s a meaningful but narrow distinction: Bitcoin isn’t rallying because Washington avoided a crisis; it’s simply not pricing in one additional source of macro noise for the next several weeks.
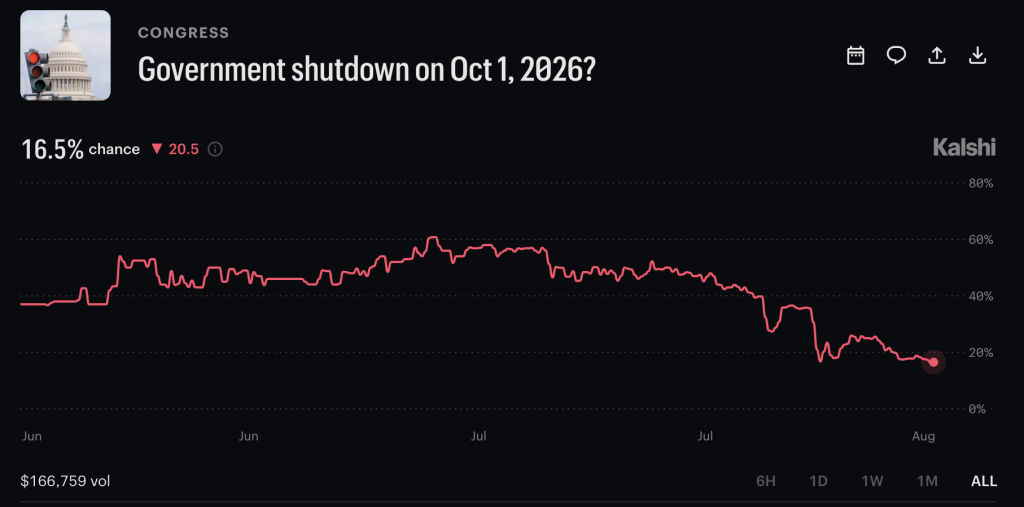
Traders watching how BTC reacts to shifting liquidity conditions should keep an eye on current key price levels for signs of whether that removed risk is actually translating into positioning.
The bigger question is whether reduced political noise changes anything about the Fed’s data dependency. If shutdown risk had escalated, delayed CPI and payrolls prints would have forced the market to trade rate expectations on stale information, a dynamic already explored in the context of upcoming CPI-driven price scenarios for BTC/USD.
With that scenario pushed back, at least temporarily, the macro calendar reasserts itself as the dominant driver over the next stretch.
The December 11 Deadline Is the Real Test
Nothing about this vote eliminates shutdown risk; it deferred it. December 11 is now the operative date, and if the House and Senate can’t reconcile their competing bills before then, the same volatility setup returns with less runway and higher stakes given year-end liquidity conditions.
This isn’t the first time this year that legislative friction has bled into crypto positioning. The pattern of Senate-level delays complicating market-structure timelines showed up recently with the CLARITY Act’s own stalled progress, another example of Capitol Hill gridlock functioning as an indirect but real headwind for digital-asset regulatory certainty.
Three scenarios are worth tracking into December. If the House adopts the Senate’s December 11 timeline cleanly, expect the shutdown discount to stay compressed and crypto markets to trade primarily on rate expectations and spot flows rather than political risk.
If negotiations drag and reconciliation slips toward the deadline itself, expect the same pre-deadline jitteriness that hit risk assets earlier this year to resurface, with Bitcoin likely to trade defensively alongside equities. And if the two chambers can’t agree at all, the shutdown clock resets entirely, pushing regulatory work, economic data, and the broader risk-on setup crypto traders have been counting on right back into limbo.
Don’t Miss Out on Our $1,000 USDT Airdrop on ByBit
The post Bitcoin Gets a Brief Reprieve as Shutdown Risk Moves to December appeared first on Cryptonews.
Crypto World
The New Race for Cross-Chain Liquidity: Why the Future of DeFi May Depend on Moving Capital Seamlessly

For years, blockchain ecosystems competed largely on one question: Which network can attract the most users, developers, and capital?
Ethereum built a massive DeFi economy. Solana became known for high-speed transactions and low fees. Layer-2 networks expanded Ethereum’s capacity, while newer chains introduced alternative approaches to scalability, interoperability, and application development.
But the competitive landscape is changing.
The next major battle may not be about which blockchain has the most liquidity locked inside its ecosystem. Instead, it may be about which networks, protocols, and infrastructure providers can move liquidity between ecosystems most efficiently, securely, and intelligently.
This is creating a new race for cross-chain liquidity.
As the number of blockchains continues to grow, liquidity becomes increasingly fragmented. Assets that once existed primarily within a single ecosystem can now move across multiple chains, creating new opportunities—but also new technical and security challenges.
The winners of the next phase of DeFi may therefore be the platforms that can make blockchain fragmentation feel invisible to users.
What Is Cross-Chain Liquidity?
Cross-chain liquidity refers to the ability to move, access, or utilize capital across different blockchain networks.
Imagine a user holding USDC on one blockchain who wants to participate in a lending protocol on another network. Without interoperability infrastructure, the user may need to:
- Move assets through a bridge.
- Convert the asset into another token.
- Pay multiple transaction fees.
- Wait for confirmations.
- Navigate different wallets or applications.
- Accept additional smart-contract and bridge risks.
Cross-chain infrastructure attempts to simplify this process.
Instead of treating every blockchain as an isolated financial island, interoperability protocols aim to connect liquidity across ecosystems.
The goal is simple:
Liquidity should be able to follow opportunity.
If lending yields are better on one chain, trading volume is higher on another, or a new application launches somewhere else, capital should ideally be able to move there efficiently.
That concept could become one of the most important foundations of mature DeFi.
Why Liquidity Fragmentation Is Becoming a Bigger Problem
The blockchain industry has evolved from a relatively small number of major networks into a highly fragmented environment.
There are Layer-1 blockchains, Ethereum Layer-2s, appchains, rollups, sidechains, modular networks, and specialized execution environments.
This creates an interesting paradox.
More blockchains create more opportunities.
But:
More blockchains can also create more fragmented liquidity.
A trader may find the best liquidity for one asset on Ethereum, the lowest transaction costs on another network, and the most attractive DeFi opportunity somewhere else.
Capital becomes scattered.
This fragmentation can produce several problems:
- Lower liquidity on individual applications
- Higher slippage
- More complicated user experiences
- Increased transaction costs
- Liquidity trapped inside isolated ecosystems
- Greater reliance on bridges and interoperability infrastructure
- More difficult capital management for DeFi users
For decentralized finance to become a truly interconnected financial system, liquidity cannot remain permanently trapped within individual chains.
The Evolution of Cross-Chain Infrastructure
Cross-chain technology has gone through several generations.
Early blockchain bridges largely focused on one objective:
Move an asset from Chain A to Chain B.
The process often involved locking an asset on one network and creating a corresponding representation on another.
For example:
Native Asset → Lock → Wrapped Asset → Destination Chain
Although this approach enabled interoperability, it also introduced additional points of failure.
The industry has since experimented with more sophisticated architectures.
Modern interoperability systems can involve:
- Cross-chain messaging
- Liquidity networks
- Intent-based systems
- Shared security models
- Decentralized verification
- Relayers
- Validators
- Proof-based verification
- Native asset transfers
- Cross-chain swaps
The broader trend is moving from simple token bridging toward programmable interoperability.
That distinction matters.
The future isn’t necessarily about simply moving tokens.
It is about allowing applications on different blockchains to communicate, coordinate, and execute financial actions across networks.
Cross-Chain Messaging Could Be More Important Than Bridging
One of the most important developments in interoperability is the shift from asset movement toward cross-chain messaging.
A bridge answers:
“How do I move this asset?”
Cross-chain messaging asks:
“How can this application communicate with another blockchain?”
That difference opens up much larger possibilities.
For example, a decentralized application could potentially:
- Trigger transactions on another chain
- Verify information from another blockchain
- Coordinate liquidity between ecosystems
- Manage cross-chain positions
- Execute governance instructions
- Automate treasury strategies
- Synchronize application states
This creates the possibility of cross-chain applications rather than simply cross-chain assets.
In such an environment, blockchains become less like isolated networks and more like interconnected components of a larger financial infrastructure.
The Rise of Intent-Based Liquidity
Another important development is the growing interest in intent-based systems.
Traditional DeFi often requires users to specify every step of a transaction.
For example:
Swap Token A → Bridge → Change network → Swap Token B → Approve transaction.
An intent-based system can instead allow the user to express the desired outcome:
“I want 1,000 USDC on this chain.”
The infrastructure can then determine how to execute the transaction.
Different liquidity providers, solvers, market makers, and routing systems can compete to fulfill that intent.
This introduces a new model for liquidity:
Users specify the destination. Infrastructure determines the route.
If this model scales successfully, cross-chain complexity could increasingly disappear behind the interface.
Users may not even need to know which blockchain is handling the transaction.
Liquidity Is Becoming Programmable
Traditional liquidity is relatively passive.
A pool contains assets, and users interact with that liquidity.
Cross-chain liquidity introduces something more dynamic.
Liquidity can potentially be:
- Routed
- Rebalanced
- Aggregated
- Optimized
- Automated
- Allocated according to demand
- Directed toward higher-value opportunities
This means liquidity itself is becoming increasingly programmable.
Imagine a system monitoring dozens of blockchains simultaneously.
If a particular market suddenly experiences high demand, the system could identify available liquidity elsewhere and route capital toward that opportunity.
The resulting architecture begins to resemble a global liquidity layer rather than a collection of isolated decentralized exchanges.
Why Stablecoins Are Central to the Cross-Chain Race
Stablecoins may become one of the most important assets in cross-chain liquidity.
Unlike highly volatile tokens, stablecoins are primarily used as:
- Trading pairs
- Settlement assets
- DeFi collateral
- Payment instruments
- Treasury assets
- Cross-border transfer mechanisms
This makes them natural candidates for interoperability.
A trader may hold stablecoins on one network but want to use them on another.
A DeFi protocol may accept stablecoins from multiple ecosystems.
A payment application may need to settle transactions across different chains.
As stablecoin usage expands, the ability to move stablecoin liquidity efficiently could become a major competitive advantage for blockchain ecosystems.
The race may therefore increasingly revolve around a simple question:
Which infrastructure can make stablecoin liquidity available wherever users need it?
The Security Problem: Liquidity Creates a Bigger Target
Cross-chain liquidity creates enormous opportunities, but it also creates enormous security risks.
Bridges have historically been among the most attractive targets for attackers because they often control significant amounts of assets or coordinate complicated cross-chain verification mechanisms.
The challenge comes from the fact that a cross-chain system must answer a difficult question:
How can one blockchain securely trust information originating from another blockchain?
If that verification process fails, the consequences can be severe.
Potential vulnerabilities include:
- Smart-contract exploits
- Validator compromise
- Private-key failures
- Malicious relayers
- Incorrect message verification
- Oracle manipulation
- Economic attacks
- Liquidity-provider exploits
- Governance attacks
- Replay attacks
- Poorly designed token representations
This means cross-chain liquidity cannot simply be optimized for speed and capital efficiency.
It must also be optimized for security and trust minimization.
The Liquidity Trilemma
Cross-chain infrastructure faces a difficult balancing act.
Users want:
1. Security
Funds should remain protected.
2. Capital Efficiency
Liquidity should not sit idle unnecessarily.
3. Speed
Transactions should settle quickly.
But improving one dimension can sometimes create trade-offs elsewhere.
For example, highly secure verification mechanisms may introduce additional latency.
Extremely fast systems may rely on additional assumptions.
Capital-efficient systems may require complex liquidity management.
The next generation of interoperability protocols will therefore compete not simply on the number of supported chains, but on how effectively they balance these three objectives.
The Battle for Liquidity Providers
Cross-chain infrastructure also creates a new competitive environment for liquidity providers.
Liquidity providers are the capital behind many decentralized markets.
They can earn fees by supplying assets to:
- Automated market makers
- Cross-chain pools
- Lending markets
- Liquidity networks
- Settlement systems
- Intent-based trading systems
But cross-chain liquidity introduces additional considerations.
A liquidity provider must evaluate:
- Yield
- Trading volume
- Impermanent loss
- Bridge risk
- Smart-contract risk
- Chain-specific risk
- Liquidity utilization
- Withdrawal conditions
- Token volatility
Higher yields may compensate for higher risk—but not always.
This means sophisticated liquidity providers will increasingly evaluate risk-adjusted returns, rather than simply chasing the highest advertised APY.
Cross-Chain DEX Aggregation
Decentralized exchanges are another major battleground.
Instead of searching for liquidity on a single chain, cross-chain aggregators can potentially search across multiple liquidity sources.
Consider a user wanting to exchange Asset A for Asset B.
The optimal route might involve:
Chain A → Liquidity Pool → Cross-Chain Network → Chain B → DEX
The user may not need to manually execute each step.
Routing infrastructure can compare:
- Liquidity depth
- Price impact
- Fees
- Gas costs
- Execution speed
- Available routes
- Bridge costs
The result is potentially better execution for users and more efficient utilization of fragmented liquidity.
Why Developers Care About Cross-Chain Liquidity
Cross-chain liquidity isn’t only a user problem.
It is also a developer problem.
A new DeFi application launching on a smaller blockchain may have excellent technology but insufficient liquidity.
Without enough capital, users experience:
- High slippage
- Low borrowing capacity
- Poor trading execution
- Limited market depth
Cross-chain infrastructure can potentially help applications access liquidity beyond their native ecosystem.
This creates a powerful network effect.
More liquidity attracts users.
More users create more volume.
More volume attracts liquidity providers.
More liquidity attracts more developers.
This cycle can accelerate ecosystem growth.
Cross-Chain Liquidity Could Change Blockchain Competition
For years, blockchain ecosystems competed by trying to retain users inside their own environments.
But interoperability creates a different competitive model.
Instead of asking:
“How do we keep liquidity inside our chain?”
Networks may increasingly ask:
“How do we become an attractive destination within a larger liquidity network?”
This is a significant philosophical shift.
A blockchain does not necessarily need to own all liquidity.
It may simply need to become the best place for liquidity to operate.
For example, a chain could specialize in:
- Derivatives
- Gaming
- Stablecoin payments
- Institutional settlement
- Real-world assets
- Lending
- Trading
- AI applications
Cross-chain infrastructure can then connect that specialized economy to the rest of Web3.
The Institutional Opportunity
Cross-chain liquidity could also become increasingly important as institutional capital enters blockchain markets.
If institutions eventually interact with multiple blockchain ecosystems, they will need infrastructure capable of managing liquidity across networks without requiring manual processes for every chain.
This could create demand for sophisticated cross-chain treasury and liquidity-management systems.
Instead of managing isolated wallets across dozens of networks, institutions could potentially use unified infrastructure to monitor and allocate capital across multiple blockchain environments.
Real-World Assets Add Another Layer
The growth of tokenized real-world assets could make interoperability even more important.
Tokenized:
- Treasury products
- Bonds
- Funds
- Credit instruments
- Commodities
- Real estate
- Other financial assets
may eventually exist across different blockchain environments.
If these assets become fragmented across networks, interoperability becomes essential.
Imagine a tokenized financial asset issued on one blockchain while investors use another network for trading, collateralization, or settlement.
Without efficient interoperability, the market becomes fragmented.
With strong interoperability, these assets could potentially participate in a broader digital financial ecosystem.
The Future May Be Chain-Agnostic
One of the most interesting possibilities is that users eventually stop caring which blockchain they are using.
Today, crypto users often think about:
- Which chain?
- Which wallet?
- Which bridge?
- Which DEX?
- Which gas token?
- Which network fee?
For mainstream adoption, that complexity may need to disappear.
The ideal experience could look more like traditional internet applications.
Users simply choose what they want to accomplish.
The infrastructure handles:
Chain selection → Liquidity discovery → Routing → Execution → Settlement
Behind the scenes, multiple blockchains may be involved.
But from the user’s perspective, there is simply one application.
That is the promise of chain abstraction.
Chain Abstraction: The Next Step
Chain abstraction aims to hide blockchain-specific complexity from users and applications.
Instead of forcing users to understand individual networks, applications can provide a unified experience.
This could involve:
- Unified balances
- Automated gas management
- Cross-chain transactions
- Smart routing
- Intent-based execution
- Unified liquidity
- Account abstraction
- Cross-chain messaging
If successful, chain abstraction could transform how people interact with Web3.
Users would no longer think:
“I need to bridge my assets to another chain.”
They would simply think:
“I want to trade, borrow, pay, invest, or transfer.”
The underlying infrastructure would handle the complexity.
What Will Determine the Winners?
The race for cross-chain liquidity will likely not be won by the project supporting the largest number of chains alone.
Several factors will matter.
Security
A cross-chain system managing billions in liquidity must have robust security assumptions.
Capital Efficiency
Idle liquidity is expensive.
The best systems will find ways to maximize the productive use of capital.
Execution Quality
Users care about the final result: price, fees, speed, and reliability.
Liquidity Depth
Deep liquidity reduces slippage and improves execution.
Developer Experience
Infrastructure needs to be easy for applications to integrate.
Composability
Cross-chain systems should allow applications to interact with other protocols rather than operating as isolated services.
Decentralization
Users and institutions may increasingly demand systems that reduce dependence on centralized intermediaries.
Scalability
As more chains and applications connect, interoperability infrastructure must handle increasing transaction and messaging volumes.
The New Competitive Moat: Liquidity Connectivity
In traditional finance, liquidity is a competitive advantage.
The same principle applies to DeFi.
But in a multi-chain environment, simply possessing liquidity may not be enough.
The more important advantage may be liquidity connectivity.
A protocol with access to multiple liquidity sources can potentially offer:
- Better execution
- More trading pairs
- Greater capital efficiency
- More opportunities
- Lower slippage
- Better user experiences
This creates a new kind of network effect.
The more chains connected to a liquidity network, the more valuable that network can become.
And the more users and applications use it, the more attractive it becomes to liquidity providers.
The emerging cross-chain economy could create a powerful flywheel:
More Chains Connected
↓
More Liquidity Available
↓
Better Execution
↓
More Users
↓
More Transaction Volume
↓
More Fees and Opportunities
↓
More Liquidity Providers
↓
Even Deeper Liquidity
This flywheel could become one of the defining economic mechanisms of the next generation of DeFi infrastructure.
What Could Go Wrong?
Despite the enormous potential, cross-chain liquidity is not guaranteed to become a seamless global system.
Several challenges remain.
Fragmented Standards
Different chains may use different architectures, messaging systems, and security models.
Security Failures
One major exploit could undermine confidence in an interoperability network.
Liquidity Fragmentation
Ironically, adding more interoperability systems could create even more fragmentation.
Economic Attacks
Protocols must defend against attackers exploiting incentives rather than traditional software vulnerabilities.
Regulatory Uncertainty
Cross-border digital asset movement may attract increasing regulatory attention.
Complexity
Even if infrastructure becomes sophisticated, poor user interfaces could keep cross-chain applications difficult to use.
The industry therefore needs to solve not only the technical problem of interoperability, but also the economic, security, governance, and user-experience problems surrounding it.
The Bigger Picture
The race for cross-chain liquidity is ultimately about something bigger than bridges.
It is about whether blockchain networks remain isolated economies or evolve into an interconnected financial system.
If interoperability succeeds, liquidity could become increasingly mobile.
Capital could move toward the applications, markets, and opportunities offering the best combination of risk and return.
Developers could build applications without worrying that their users are trapped on a single chain.
Liquidity providers could access markets across multiple ecosystems.
Institutions could manage blockchain-based assets through unified infrastructure.
And users could interact with Web3 without needing to understand every technical layer underneath the application.
Conclusion: Liquidity Wants to Move
Blockchain ecosystems are no longer competing in isolation.
Ethereum, Layer-2 networks, Solana, and other chains are increasingly becoming pieces of a much larger digital economy.
The next stage of DeFi may therefore be defined not by how much liquidity a chain can attract, but by how efficiently that liquidity can connect to the rest of the ecosystem.
The winners of this race will likely be the networks and infrastructure providers that can combine:
Security + Liquidity + Speed + Capital Efficiency + Interoperability + User Simplicity.
Cross-chain liquidity could ultimately transform blockchain from a collection of separate financial networks into a connected global liquidity layer.
And when that happens, the most valuable blockchain may not be the one that keeps liquidity trapped inside its walls.
It may be the one that makes liquidity flow everywhere.
REQUEST AN ARTICLE

Baby products company Frida is expanding into kids’ personal care

Ambiq Micro Stock Rises On Chipmaker’s Beat-And-Raise Report

Ben Crump, Al Sharpton “Too Soft” In Nolan Wells Case

Renter of Home in Anne Heche Crash Denies Settlement With Son

No Jackpot Winner as $257 Million Prize Rolls Over to $269 Million Monday Draw

Weekend Open Thread: Staud – Corporette.com

Banking Financial Awareness Terms 2026 | Important Banking Terms for IBPS PO, SBI PO & Clerk

Whether you’re completely new to crypto, Subscribe and let’s make crypto simple.

6 Habits That Can Attract Wealth and Financial Success #youtubeshorts #trending #facts
-

 Fashion4 days ago
Weekend Open Thread: Mattifying Sunscreen
-

 Fashion4 days ago
Frugal Friday’s Workwear Report: Cap-Sleeve Pointelle Crewneck Sweater
-

 Sports5 days ago
Jordan Coyle & Cordiamo take Laya Arena Stakes at RDS
-

 News Videos3 days ago
Can Astrology Help Find Gold and Silver Trends? A Financial Astrology Guide
-
 Business6 days ago
US stocks: Dow closes at record on Mideast optimism; SpaceX, AMD drag Nasdaq
-

 Politics5 days ago
Reform UK And Greens Sink To Lowest Favourability Ratings To Date
-

 Business7 days ago
Nvidia Stock Climbs 2.5% as Chip Sector Rally Builds Ahead of AMD Earnings, Nvidia’s Own Report Looms
-

 Tech6 days ago
OpenAI, Anthropic AI agents targeted real people and systems in cyber tests
-

 Crypto World7 days ago
Polymarket targets $20 billion valuation as competition heats up in prediction market sector
-

 Business6 days ago
Supply chain issues impact Ingredion
-

 Tech4 days ago
Rinn Pharma & Biopharma to join NordicPharmaTrain network
-

 Business2 days ago
How to Start a Cleaning Business: A Step-by-Step Guide
-
 Crypto World6 days ago
Dow and S&P 500 Hit Records on AI Earnings: When Will the Bubble Burst?
-

 Business2 days ago
Datadog: Best Of Breed For Multiple Reasons
-

 Business2 days ago
BDC Weekly Review: Private BDC Q2 Numbers Are Strong
-
 Crypto World7 days ago
Dollar Index Trapped at 100 as Hawkish Fed Meets Official Selling
-

 Business6 days ago
McDonald’s (MCD) Q2 2026 earnings
-

 Fashion6 days ago
The Bright Side of Black and White
-

 Fashion6 days ago
Suit of the Week: Me + Em
-

 Business6 days ago
Apple UK encryption challenge filed against Home Office
You must be logged in to post a comment Login