
Crypto World
Polygon Flips Ethereum in Daily Fees as Polymarket Oscar Betting Hits $15M
Polygon just pulled off something no one saw coming. It flipped Ethereum in daily transaction fees. For the first time ever.
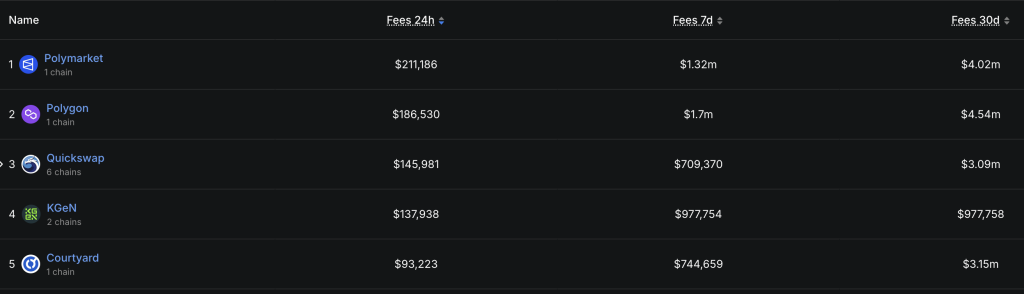
On Friday alone, Polygon brought in about $407,100 in fees. Ethereum? Around $211,700. That is almost double.
Activity on Polymarket has exploded, and prediction markets are suddenly turning into serious revenue engines.
- Polygon generated $407,100 in daily fees, surpassing Ethereum’s $211,700 for the first time.
- Polymarket drove the surge with $15 million wagered on a single Oscars betting category.
- The platform accounted for over $1 million in generated fees on the Layer 2 network in just seven days.
What Is Driving the Fee Flip?
The reason is simple, Polymarket. Oscars pulled in serious retail flow, with more than $15 million wagered on a single category over the weekend.

Polygon did not climb the fee charts by accident. Almost all of the recent growth came from Polymarket activity, which generated over $1 million in network fees in just a week.
Compared to Polymarket, the next biggest app on Polygon barely made a dent.
Polygon vs Ethereum: The Numbers Behind the Shift
Over the weekend, Polygon briefly pulled ahead in daily fees before the gap tightened again, with both chains trading blows within a narrow range.
Polygon just hit an all-time high in daily USDC transactions
And it's not even close.
12M+ daily USDC txs on Polygon
Every other chain? Below 3MBase, Arbitrum, Ethereum Mainnet barely register pic.twitter.com/SVlf5ci2xm
— Leon Waidmann (@LeonWaidmann) February 17, 2026
The reason is practical. Cost. Polygon transactions average around $0.0026. On Ethereum, you are looking at roughly $1.68. If you are placing multiple small bets or making quick moves, that difference matters. A lot.
Lower fees mean more volume. More volume means more revenue. It is that simple.
At the same time, Ethereum is dealing with its own narrative pressure after large whale movements added volatility concerns. So while Ethereum remains dominant structurally, Polygon is proving that consumer driven activity can shift revenue flows quickly.
The post Polygon Flips Ethereum in Daily Fees as Polymarket Oscar Betting Hits $15M appeared first on Cryptonews.


TLDR:
- Strategy holds 762,099 BTC valued near $50.9B, maintaining one of the largest corporate Bitcoin positions globally.
- The firm reports an average entry price of $75,694 per BTC, with a current unrealized loss nearing $6.9B.
- Over 100 purchase events show a consistent accumulation strategy across multiple Bitcoin market cycles.
- Saylor’s recent post signals continued buying interest as market prices fluctuate within the $80K–$90K range.
Michael Saylor signaled renewed Bitcoin activity through a brief social media post and updated portfolio data from his firm.
The update presents a clear view of holdings, purchase history, and current performance during ongoing market fluctuations.
Bitcoin Holdings Show Ongoing Accumulation Strategy
Michael Saylor posted on X stating, “Back to Work,” alongside a dashboard tracking his firm’s Bitcoin reserves. He shared the update less than an hour before it gained rapid traction among market participants.
The dashboard shows total holdings of 762,099 BTC, valued at about $50.90 billion at current market prices. The firm holds an average acquisition cost of $75,694 per Bitcoin. Based on current pricing, the position shows an unrealized loss of nearly $6.9 billion, or about 12%.
The data also shows that the firm executed 104 separate purchase events over several years. It spread these acquisitions across different market cycles, including periods of volatility and recovery. The visual chart plots Bitcoin’s price movements alongside each purchase point.
A white line tracks Bitcoin’s price trend from 2020 through 2025. Orange markers show purchase entries, while a green dashed line marks the average cost basis. This layered view presents a structured accumulation approach instead of sporadic buying.
Crypto Patel stated that the firm could execute another Bitcoin purchase soon. The post referenced the firm’s 13th strategy tracker update in 2026.
Market Response and Current Performance
Saylor’s post drew strong engagement and sustained attention from market participants. Within the first hour, users posted hundreds of comments and reposts, while likes crossed several thousand. Views also exceeded 100,000, showing strong visibility.
At the same time, the dashboard shows that the portfolio remains below its total cost basis. The current valuation stands lower than the total investment of $57.69 billion. This gap reflects recent price movement within the $80,000 to $90,000 range.
The chart also captures earlier phases of Bitcoin’s market cycle. Prices moved sharply between 2020 and 2022, then climbed steadily into 2024 and 2025. Recent data points show a pullback from higher levels.
Despite the current gap, the firm continues its steady accumulation pattern. It placed purchase markers across both market highs and lows. This pattern aligns with a structured buying method instead of reactive trading.
Saylor paired his brief caption with a detailed dashboard to present a clear message of continued activity. The timing of the update, along with mentions of a possible new purchase, keeps attention on the firm’s next move.
The dataset reflects a long-term positioning strategy focused on Bitcoin. While current figures show a temporary shortfall, the firm continues its consistent purchase record. Market participants now watch closely for further updates.

TLDR:
- Dogecoin trades near $0.09 support, with price action showing tight consolidation and reduced volatility
- A break above $0.12–$0.15 could signal renewed bullish momentum if supported by strong volume
- Continued weakness below $0.09 may push DOGE toward lower targets near $0.07 or even $0.05
- Historical data shows DOGE remains below prior yearly levels, reflecting a prolonged cooling phase
Dogecoin continues to trade near a critical support level, with recent market activity showing a balance between weakening bearish pressure and early signs of potential recovery. Price action remains compressed, keeping traders focused on the next decisive move.
Price Structure Signals Ongoing Consolidation
Recent chart data shared by Bitcoinsensus shows that Dogecoin has maintained a broad logarithmic uptrend channel since 2023.
The asset previously recorded strong upward moves of nearly 290% and 440% within this structure. However, the current price has returned to the lower boundary, where support is being tested again.
From late 2024, Dogecoin entered a clear downtrend after peaking near $0.45. The rally phase, which began around October 2024, saw rapid gains driven by strong speculative activity. Large bullish candles dominated this period, reflecting high volatility and increased market participation.
As momentum faded, the market shifted into a distribution phase between December 2024 and early 2025. During this period, price struggled to maintain higher levels and formed repeated rejection points. This eventually led to a breakdown, confirming the end of the prior bullish cycle.
Throughout 2025, the asset continued forming lower highs and lower lows. Temporary recoveries occurred, yet each rally failed to break above previous resistance levels. A sharp drop around October 2025 added further pressure, likely triggered by rapid liquidations or external market factors.
Since late 2025, price action has tightened within a narrow range between $0.09 and $0.10. Smaller candles now reflect reduced volatility and a lack of strong directional momentum. This phase suggests either accumulation or a pause before another move lower.
Market Awaits Breakout Confirmation
Another market perspective shared by Jonathan Carter points to a potential breakout from a descending channel pattern. According to his analysis, bullish pressure has been gradually increasing, which may lead to a move above current resistance levels.
Key resistance zones remain at $0.12 to $0.15, followed by higher targets extending toward $0.20. A sustained move above these levels would require stronger volume and consistent demand. Without that, the broader structure remains weak.
On the downside, the $0.09 level continues to act as immediate support. A breakdown below this range may expose lower targets near $0.07 and potentially $0.05. These levels are viewed as psychological zones where buyers may attempt to re-enter the market.
Additional context from KrissPax shows how current price levels compare historically during easter. Dogecoin trades significantly below its levels from the past two years, including $0.1614 in 2025 and $0.1823 in 2024. This comparison reflects the broader cooling phase following earlier market enthusiasm.
For now, Dogecoin remains in a neutral-to-bearish position. Price stability at support offers some balance, yet the absence of higher highs keeps upside expectations limited. Traders continue to monitor volume and structure for confirmation of the next trend direction.
TLDR:
- Tesla delivered 358,023 vehicles in Q1 2026, missing expectations and adding pressure on stock performance.
- Rising inventory above 50,000 units signals demand concerns amid continued high production levels.
- RSI below 50 and weak MACD confirm bearish momentum with no clear reversal signal yet forming.
- Price remains below key resistance levels, keeping the broader downtrend intact in the near term.
Tesla Inc. shares declined after first-quarter delivery data fell short of expectations, adding pressure to an already weakening chart structure. The latest figures showed rising inventory levels, while analysts adjusted price targets amid ongoing market caution.
Delivery Miss and Analyst Reactions Weigh on Sentiment
A recent tweet from Coin Bureau reported that Tesla delivered 358,023 vehicles in Q1 2026. This figure came in below expectations by 7,600 units. Meanwhile, production reached 408,386 vehicles, leaving inventory elevated by more than 50,000 units.
As a result, sentiment weakened across the market. Goldman Sachs and Truist Financial both reduced their price targets on TSLA. However, they maintained Hold ratings, signaling a cautious stance rather than a fully negative outlook.
The delivery miss added pressure to an already fragile technical setup. Market participants have been closely watching Tesla’s ability to sustain demand levels. The inventory build raised concerns about near-term balance between production and sales.
At the same time, the broader structure of the stock has shifted. Price action no longer reflects the strong momentum seen in late 2025. Instead, it shows a gradual transition into a weaker phase.
Technical Indicators Show Ongoing Downtrend
The daily chart for Tesla reflects a clear directional shift. The stock peaked near the $480–500 range before entering a consistent decline. Since January 2026, the pattern of lower highs and lower lows has remained intact.
Currently trading around $360, the price sits close to recent lows. There is no clear bounce formation, which suggests sellers remain in control. For any structural change, the price would need to break above the $400–420 range.
Momentum indicators also point to weakness. The Relative Strength Index is near 39, staying below the neutral 50 level. This position reflects bearish momentum without entering deeply oversold territory.
Repeated attempts to push above 50 have failed. This pattern indicates limited buying pressure. As a result, downside movement may continue without a strong reversal signal.
The Moving Average Convergence Divergence indicator also supports the trend. Both MACD lines remain below zero, confirming bearish conditions. The histogram has stayed mostly negative, although recent bars show slight flattening.
This flattening suggests selling pressure may be slowing. However, it does not confirm a reversal. A bullish crossover has not yet appeared, leaving the broader trend unchanged.
Key levels remain critical for short-term direction. Support is seen near $350, where recent reactions have occurred. A break below this level could open the path for further declines.
Resistance stands between $380 and $400, marking a recent consolidation zone. A move above this range would be needed to test the larger resistance near $420.
For now, the structure reflects stabilization within a downtrend rather than a confirmed bottom. Price behavior, combined with weak momentum, continues to favor cautious positioning.
Crypto World
Xrp Price Prediction: XRP Hits Record Usage While Price Drops but Pepeto Crosses $8.68M and the Early Wallets Know Why
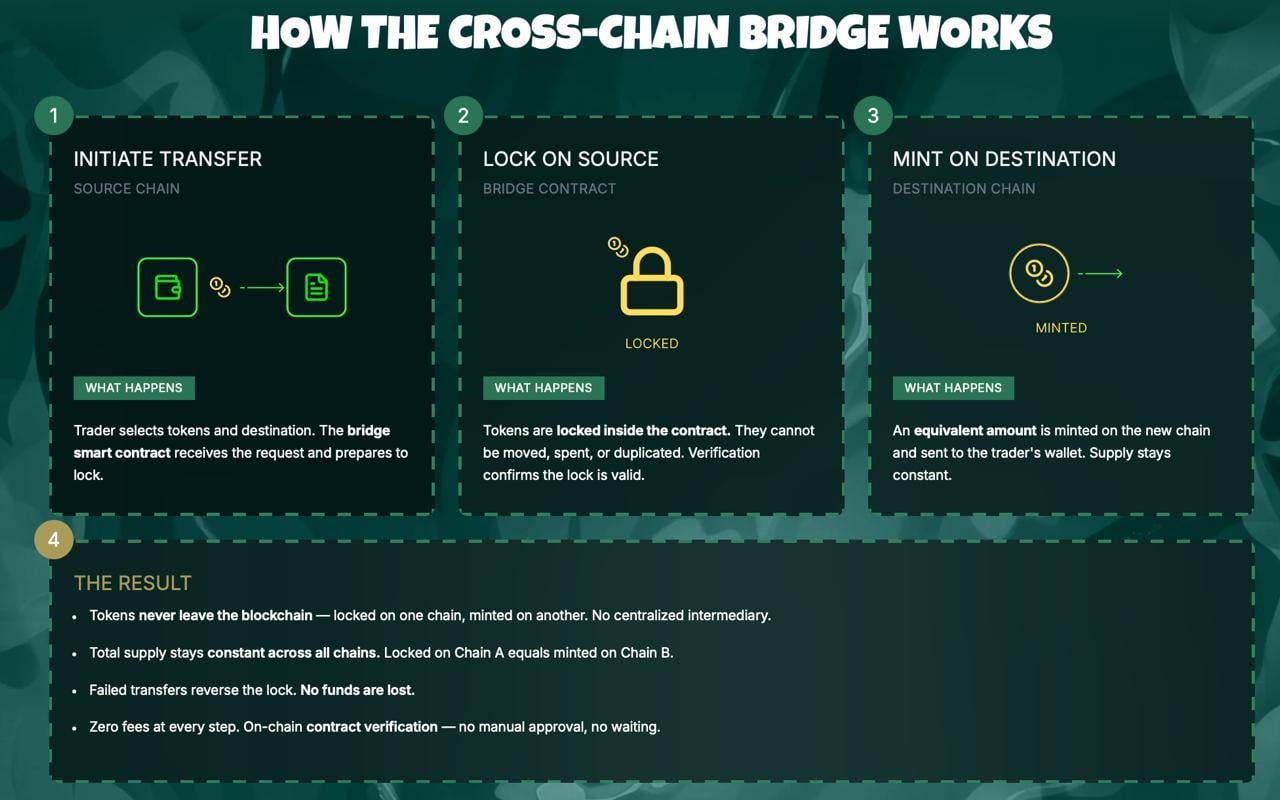
The XRP Ledger just processed a record 4.49 million transactions in a single day while active addresses topped 200,000 and total wallets crossed 7.7 million, all-time highs for the network. Yet XRP still sits at $1.29, down 30% this year.
That gap between what the chain does and what your portfolio shows makes you question where the actual gains are hiding.
Pepeto finished its exchange build with $8.68 million raised at the fastest clip any meme project has posted in 2026, and the xrp price prediction numbers make clear why capital keeps flowing into this presale instead.
The XRP Ledger hit 4.49 million daily transactions this week, a first in over two years, while total wallets crossed 7.7 million for an all-time high, per CoinMarketCap. The network is busier than ever, but the price has not followed.
XRP ETFs pulled over $1 billion in inflows since launching in November, yet weekly flows have dried up and the token trades 64% below its $3.65 cycle high, per CoinDesk. The institutions bought the utility. The chart has not caught up.
Where the XRP Outlook and the Pepeto Presale Tell Opposite Stories
Pepeto: The Play XRP’s Market Cap Can No Longer Offer
The xrp price prediction conversation keeps holders focused on whether $1.30 holds or cracks, but Pepeto is where the wallets hunting real multiples are placing their money right now, and the tools behind this presale show why.
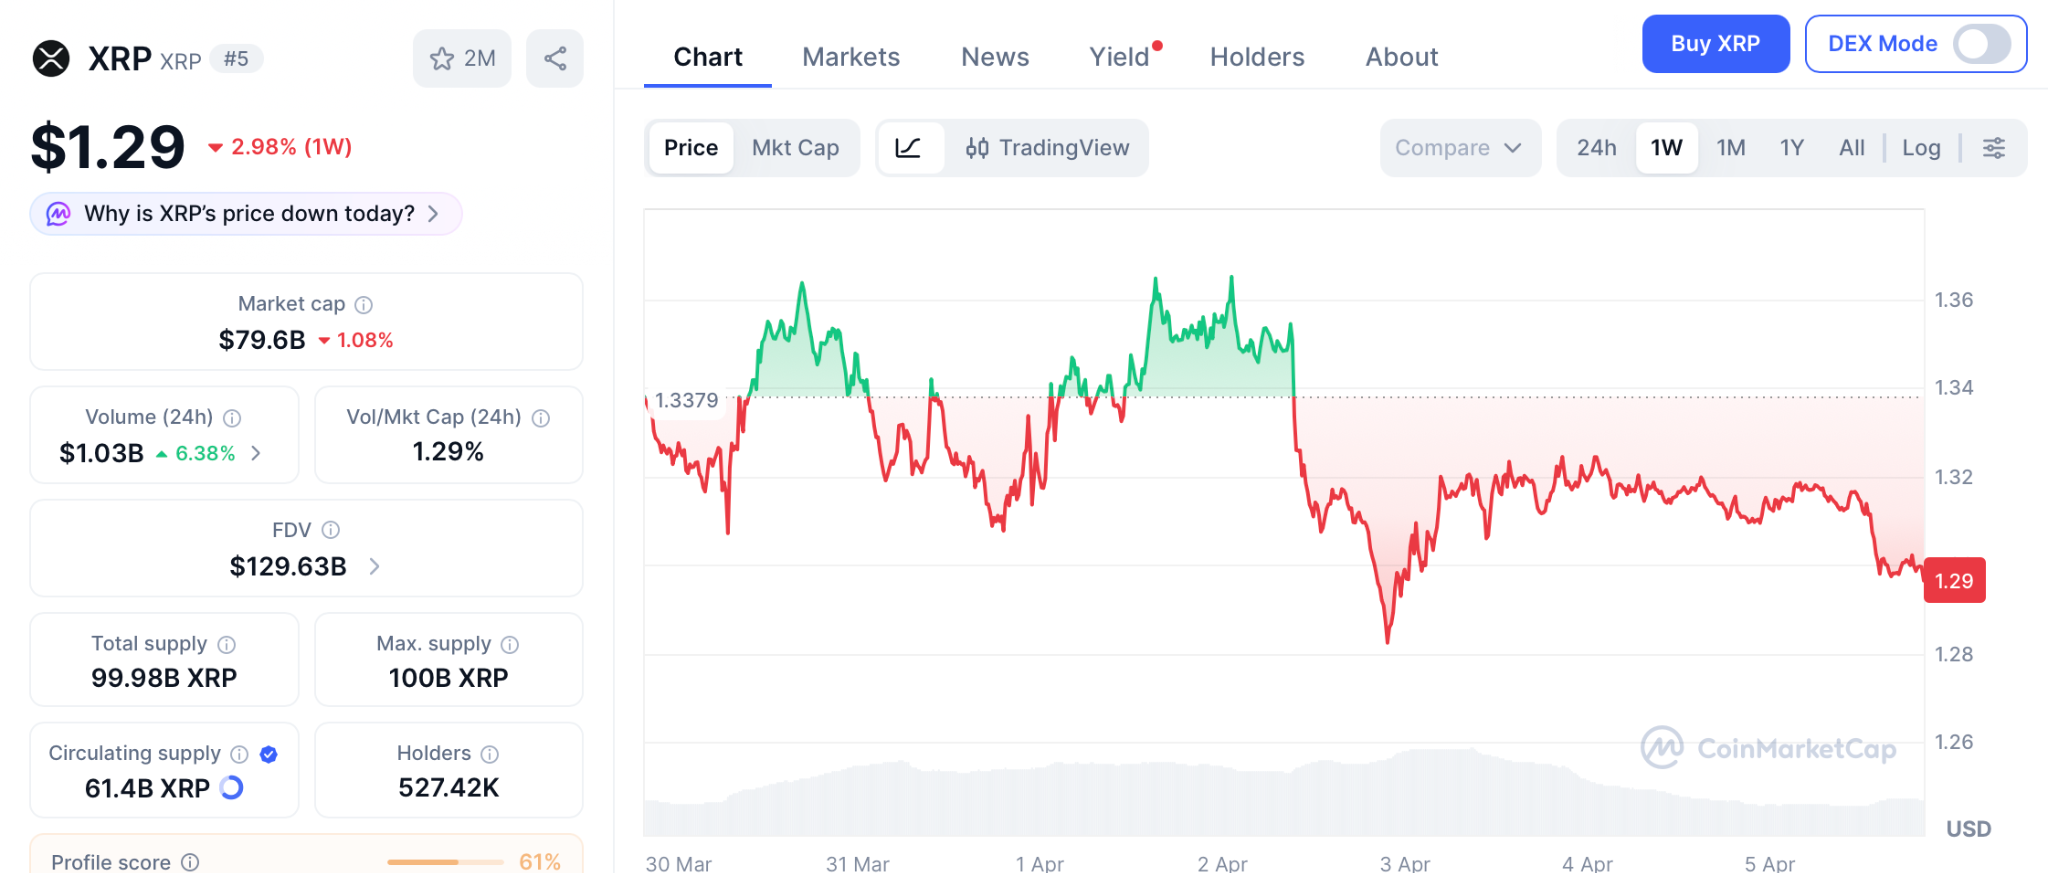
What would XRP look like if zero-fee trading lived inside the token itself instead of relying on outside partners to set every cost? Pepeto fills that space. PepetoSwap runs every swap at zero cost so your cost stays clean from the start, and the contract scanner reads each token before you commit so the danger shows on your screen instead of in your balance.
Think about holding XRP before the SEC case ended in 2025, when it traded under $0.50 and most people had given up on the case. The wallets that loaded positions during that fear turned modest bets into a 7x within five months, and every holder who caught that wave says the same thing: they nearly missed it and they wish they had gone bigger.
Pepeto sits in that same type of window today. More than $8.68 million raised at $0.0000001862 during a Fear Index of 9, built by the founder behind the original Pepe token together with a former Binance executive who designed the platform, and verified clean by SolidProof before a single dollar came in. Staking at 188% APY adds to positions while the listing gets closer. The cross-chain bridge moves tokens between ETH, BNB, and Solana at zero gas.
The presale entries that created millionaires in past cycles all shared one pattern: a working product, extreme fear, and a crowd too scared to move, and Pepeto checks every box at $0.0000001862 before the Binance listing shuts the window.
Xrp Price Prediction: Where Does XRP Go From $1.29?
XRP trades at $1.29 on April 5, down 64% from its $3.65 cycle high despite record network usage, according to CoinMarketCap.
Standard Chartered holds a $2.80 target under current conditions, with the number jumping to $8 if the CLARITY Act clears the Senate after April 13. Support at $1.30 has held every test, and the 50-day moving average at $1.42 acts as the first ceiling. Above that opens $1.60 and then $2.80.
The xrp price prediction math from an $81 billion cap means even a 3x needs the kind of fresh capital that arrives over quarters, and that cap is why wallets keep moving into presale plays where a single listing produces what XRP needs a full year to reach.
Conclusion
Record network activity and falling prices both confirm the same truth: an $81 billion token where every bounce meets selling will not produce returns that reshape your future, and Pepeto is where that math still works.
The XRP holders who loaded below $0.50 before the SEC ruling all say the same thing: they nearly skipped it and wish they had gone all in. That same signal now points toward Pepeto with $8.68 million committed during a Fear Index of 9 and a Binance listing confirmed.
The Pepeto official website still shows presale pricing, and entering while fear keeps others frozen is how those early XRP wallets built everything they have. Missing this entry could be the one call you carry for the rest of this cycle.
Click To Visit Pepeto Website To Enter The Presale

FAQs
What xrp price prediction levels matter with record network activity?
Support holds at $1.30, resistance at $1.42 and $1.60 above. Pepeto’s presale with Binance listing targets 100x at Pepeto.
Can XRP match the returns Pepeto presale holders target?
XRP needs years for a 3x from its $81 billion cap. Pepeto targets those multiples from a single listing event.
Is now the right time to enter while the xrp price prediction stays bearish?
$8.68 million raised during extreme fear proves smart money already moved. Presale stages fill faster each week before the Binance listing.
Disclaimer: This is a Press Release provided by a third party who is responsible for the content. Please conduct your own research before taking any action based on the content.
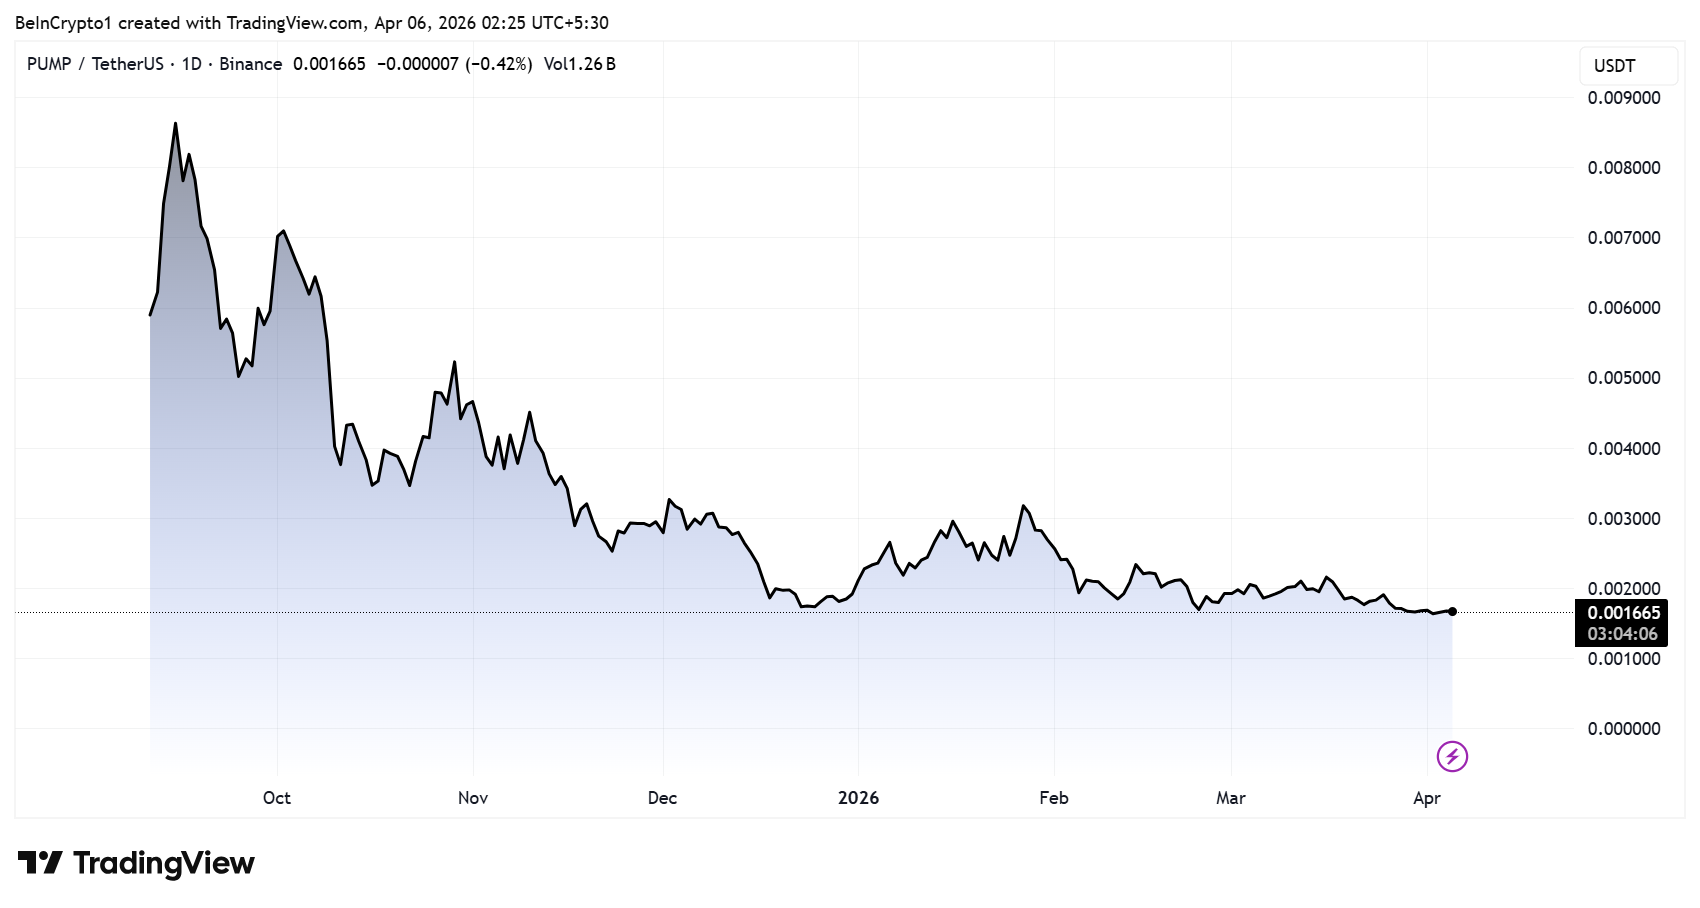
Pump.fun (PUMP) has spent $350 million buying back its own token since July 2025, yet the price sits 81% below its September all-time high and recently hit record lows.
The Solana-based meme coin launchpad now faces growing community backlash over what critics call a tokenomics structure designed for extraction rather than growth.
Why $350 Million in Buybacks Haven’t Moved the Needle
Pump.fun’s official dashboard confirms cumulative purchases of $350 million in PUMP, removing roughly 116 billion tokens from circulation.
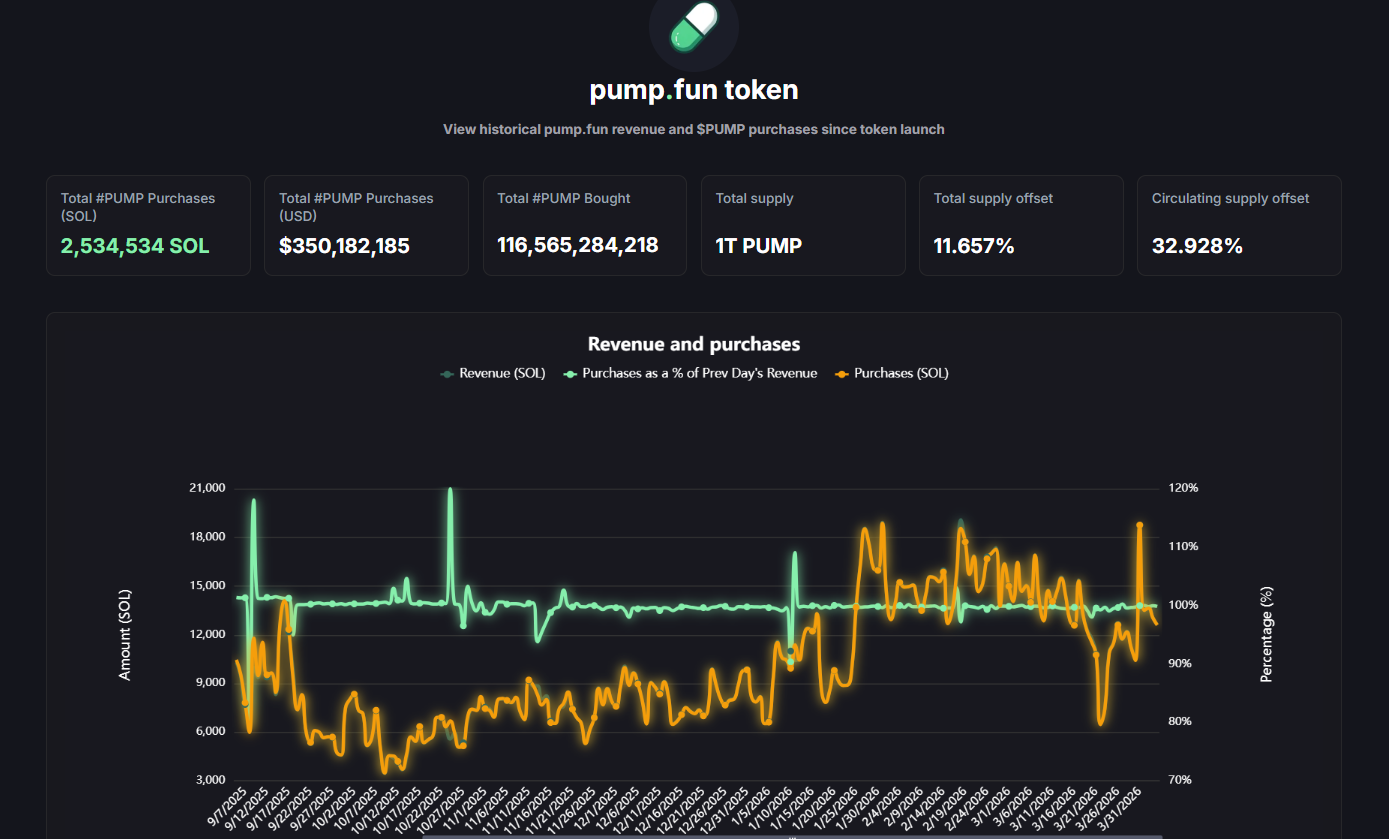
That equals about 32.9% of the circulating supply. The protocol directs nearly all daily revenue toward repurchases, averaging around $1 million per day.
Despite this aggressive strategy, PUMP trades near $0.00165, well below its $0.004 ICO price and far from its $0.0088 peak.
Users argue that insiders hold roughly half the supply and sell into each buyback for exit liquidity.
“They own 50% of the $PUMP supply they could have easily sold into every buyback as exit liquidity… Probably one of the worst tokenomic structures in the industry,” wrote 0xSweep.
Supply Pressure and the July Cliff
Only 59% of the one trillion PUMP supply currently circulates. A major unlock scheduled for July 12, 2026, will make 41% of the locked supply tradable. Founders and early investors acquired tokens at negligible cost.
On-chain data from March showed a team-linked wallet transferring 1.75 billion PUMP to Bitget, reinforcing sell-off concerns.
Meanwhile, cumulative protocol revenue has surpassed $1 billion according to DefiLlama, yet none of it has translated into sustained token appreciation.
Whether the buyback program represents genuine value return or a liquidity exit ramp for insiders will depend on what happens when those locked tokens hit the open market this summer.
The post Pump.fun $350 Million PUMP Buybacks Fail To Lift Token Price appeared first on BeInCrypto.
Crypto World
Aave V4 Explained: How Hubs, Spokes, and Credit Lines Redefine DeFi Liquidity Management
TLDR:
- Aave V4 uses immutable Liquidity Hubs to hold assets and track supplied and borrowed balances across markets.
- Spokes handle all user-facing functions like supplying and borrowing, and can be upgraded without changing Hub code.
- Credit lines connect each Spoke to a Hub on a per-asset basis, with draw caps enforced on every transaction.
- Governance controls liquidity access by adjusting draw caps per asset, giving the Aave DAO precise risk management tools.
Aave V4 brings a restructured liquidity model built around three core components: Hubs, Spokes, and credit lines. Understanding how these three parts connect explains how liquidity moves across the protocol.
It also shows how risk is managed across different markets. This architecture marks a clear shift from previous Aave versions.
For anyone following DeFi closely, the design choices behind V4 reflect a more deliberate approach to building modular, upgradeable lending infrastructure.
What Liquidity Hubs and Spokes Are Designed to Do
A Liquidity Hub in Aave V4 is a smart contract that holds deposited assets. When a user supplies USDC, those tokens are stored directly inside a Hub.
Each Hub tracks how much of every asset has been supplied and how much has been borrowed across all connected markets.
As crypto researcher @0xKolten explained, Hubs are intentionally immutable, meaning their underlying code cannot be modified after deployment.
This keeps the liquidity layer stable over time, reducing the risk of bugs introduced through upgrades. New assets can still be registered through governance, since adding an asset is treated as a state change, not a code change.
A single blockchain network can support multiple Hubs, each running its own independent balance sheet. The current Ethereum deployment launched with three: Core Hub, Prime Hub, and Plus Hub. None of these Hubs share accounting with one another.
Spokes are the contracts users interact with directly. Supplying, borrowing, repaying, and withdrawing all happen through a Spoke.
Each Spoke carries its own market logic, including collateral factors, price feeds, and liquidation rules. Because Spokes are upgradeable, governance can adjust risk parameters without affecting the Hub layer.
How Credit Lines Tie the Entire System Together
Every connection between a Spoke and a Hub is a credit line, and each one is defined per asset. A Spoke borrowing USDC from a Hub and that same Spoke borrowing USDT from the same Hub are two entirely separate credit lines. Each carries its own draw cap, which the Hub enforces before any transaction is processed.
The draw cap works similarly to a borrow cap in Aave V3. Governance can raise it to open more access or lower it to reduce the Spoke’s exposure. Setting a cap to zero stops new borrowing entirely while keeping all existing positions intact.
A Spoke can hold credit lines to more than one Hub simultaneously. The Bluechip Spoke on Prime Hub demonstrates this.
Users supply WETH, wstETH, WBTC, and cbBTC as collateral into Prime Hub, while that same Spoke holds separate credit lines to Core Hub for stablecoins like USDC, USDT, and EURC.
When a borrower draws stablecoins through the Bluechip Spoke, the liquidity comes from Core Hub up to each asset’s authorized cap.
The tokens received are the actual underlying assets, not synthetic versions. This structure gives Aave governance a direct, asset-level tool to control how much of any Hub’s liquidity a Spoke can access at any given time.
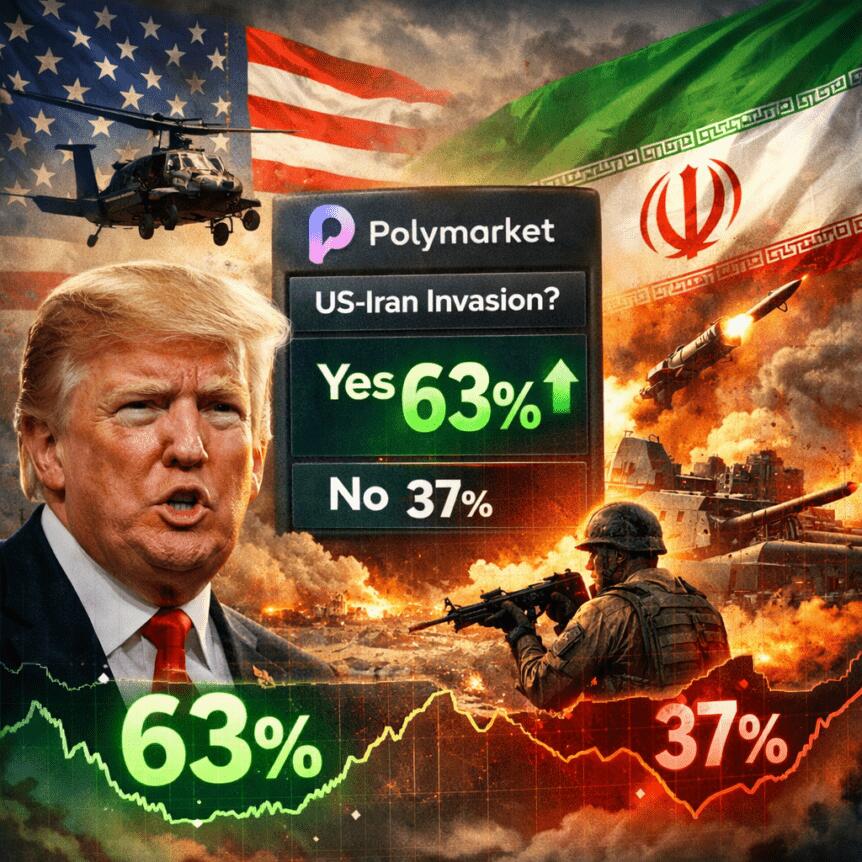
The odds of a potential U.S. invasion of Iran spiked on the Polymarket prediction market to 63% on Sunday, driven by recent remarks from President Donald Trump and ongoing regional tensions. Polymarket data show the odds rising to this level as volume on the contract reached roughly $3.74 million at the time of publication. The market had previously touched a high near 68% on March 29, a level that reflected elevated risk in the region amid a U.S. troop buildup and chatter about potential moves against Kharg Island, a key Iranian oil shipping hub.
Markets also reacted to political signals in the shorter term. On Tuesday, after Trump suggested the U.S. might withdraw from Iran within two to three weeks, Bitcoin climbed about 2.6% and the S&P 500 index gained around 2.9%. Yet the latest tweet from Trump on Sunday presented a sharper and more aggressive stance, which some traders and analysts described as a reversal that injected renewed uncertainty into risk assets. Bitcoin, by the time of observation, hovered near the $67,500 area, with price action showing little sustained upside beyond that initial knee-jerk move.
“There will be nothing like it! Open the fuckin’ strait, you crazy bastards, or you’ll be living in hell,”
That was Trump’s late-week post on Truth Social, which the market quickly digested alongside the broader geopolitical backdrop. The exchange between flaring rhetoric and cautious downside risk has left traders trying to parse what comes next for a market that remains highly sensitive to geopolitical headlines and policy signals. Brent crude oil, a closely watched barometer of energy risk and sanction dynamics, remained elevated, closing the week above $109 per barrel as markets prepared to resume trading after the Easter break.
The episode also drew a chorus of commentary from economists and market observers about the risks of escalating conflict. Economist Peter Schiff criticized the tone of the rhetoric, arguing that threatening civilian infrastructure is counterproductive and risks undermining credibility in negotiations. “I wish Trump would stop threatening Iranian civilian infrastructure. It’s a lose-lose for us: backing down hurts his negotiating credibility,” Schiff said, noting that escalation could intensify regional tensions and complicate U.S. relations. Peter McCormack, a Bitcoin-focused podcaster, echoed the sense of alarm, calling the development “wild” in response to the latest exchange.
The broader market backdrop remains fragile as investors weigh the odds of conflict against potential economic backlash, including energy flows and sanctions dynamics. On the price front, Bitcoin’s response to political headlines has become a focal point for risk assets, with traders tracking both reactionary moves and longer-term narrative shifts around crypto as a hedging or speculative instrument in times of geopolitical stress. Data from TradingView indicated BTC’s price hovered around the $67,500 level in the immediate aftermath of the latest developments, signaling a cautious stance rather than a decisive breakout.
Key takeaways
- The Polymarket odds of a U.S. invasion of Iran before 2027 rose to 63% on Sunday, with roughly $3.74 million in volume, reflecting elevated political risk pricing in crypto markets.
- Bitcoin briefly surged about 2.6% in reaction to a possible withdrawal timeline for Iran, while the S&P 500 climbed around 2.9% on the same backdrop before later stabilizing.
- The latest Trump post on Truth Social injected renewed uncertainty, illustrating how mixed signals from political leadership can keep risk assets tethered to headlines rather than fundamentals.
- Oil markets remain tense, with Brent crude trading above $109 per barrel as markets digest the potential for sanctions, supply disruptions, and broader geopolitical spillovers.
- Market commentary from economists and crypto voices underscores the risk: rhetoric can move prices in the near term, but the sustainability of moves depends on policy actions and actual conflict dynamics.
Polymarket, risk pricing and the geopolitical lens
At the heart of the episode is how prediction markets like Polymarket are used as a barometer for risk appetite. The 63% odds figure, while not a forecast of certainty, signals that a non-trivial share of participants assign a meaningful probability to a U.S. military scenario in the coming years. The volume around $3.7 million demonstrates substantial speculative activity tied to a geopolitical event with potentially outsized macro consequences. Historically, such markets can swing in response to rapid-fire news, but they also tend to reflect the evolving balance sheets of risk: the more uncertain the horizon, the higher the premium on hedges and bets that mirror that probability spectrum.
Crucially, the odds move alongside the broader narrative around U.S. policy toward Iran, including troop positioning and statements about potential targets. The March 29 peak around 68% is a reminder that even among risk-averse investors, spikes can occur when the threat of escalation appears tangible. For traders in crypto markets, these predictions are less about a direct exposure to geopolitical conflict and more about the spillover effects on risk sentiment, liquidity, and demand for assets perceived as hedges or risk-on plays depending on the narrative driving headlines.
Markets in motion: crypto, equities and energy under the same stress test
The immediate price response in Bitcoin and equities underscored a familiar pattern: time-sensitive headlines can trigger quick moves in risk assets, followed by a reversion as events unfold or as clarity improves. The Tuesday move—BTC up around 2.6% and the S&P 500 rising roughly 2.9%—illustrates how a potential de-escalation signal can momentarily ease risk concerns. But the subsequent Sunday post, with a more aggressive stance, reintroduced volatility into the system, highlighting the fragility of market positioning in periods of mixed signals.
On the energy front, Brent crude’s endurance above $109 per barrel points to a global energy backdrop that could compound macro risk if the Iran situation intensifies. In a market where oil, sanctions policy, and military postures are intertwining factors, investors are left weighing how any disruption to Iranian oil flows could ripple through inflation expectations, central-bank policy assumptions, and risk asset valuations.
Beyond headlines, observers have underscored a broader narrative: geopolitical risk remains a dominant variable in crypto market discourse. While Bitcoin has shown resilience as a non-sovereign asset with a potential appeal as a hedge in turbulent times, the asset’s price dynamics in relation to conflict-related risk are far from straightforward. The current episode reinforces the need for readers to monitor not just the price channel of BTC, but the evolving policy environment, sanctions posture, and the timing of any real military or diplomatic moves that could alter the market’s risk calculus.
Related reading: Polymarket backlash and market adjustments, and earlier coverage of Trump signals on withdrawal. For readers interested in the energy angle, a look at the Iranian mining sector’s regulatory climate provides additional context to how policy shifts can ripple through both crypto and traditional markets.
As the situation unfolds, investors should watch how the administration frames its next steps and how markets price in both the probability of conflict and the likelihood of de-escalation. The coming days will be telling for whether risk appetite recovers on any signs of restraint or remains subdued on the prospect of renewed tensions.
What remains uncertain is how much of the current price action reflects genuine strategic shifts versus the amplification of narratives on social and prediction markets. Readers should stay tuned to official policy updates, macro data releases, and ongoing market commentary to gauge whether the current episode marks a temporary disturbance or the beginning of a longer, more consequential cycle for crypto, equities, and energy markets.
TLDR:
- ETH open interest has recovered to 6.4 million ETH, approaching the all-time high of 7.8 million ETH set in July 2025.
- Binance controls roughly 36% of the ETH derivatives market, holding 2.3 million ETH in total open interest alone.
- The spot-to-futures ratio on Binance dropped to 0.13, the lowest annual level ever recorded for Ethereum trading activity.
- Heavy leverage across ETH futures markets raises volatility risks, as large position unwinds can trigger rapid liquidation cascades.
ETH futures volumes are running roughly seven times higher than spot trading on Binance. Open interest on Ethereum derivatives has climbed to 6.4 million ETH, approaching the all-time high of 7.8 million ETH set in July 2025.
The spot-to-futures volume ratio has now dropped to 0.13, marking the lowest annual level ever recorded for the asset.
Broader market uncertainty continues to push many investors toward caution, drawing a visible divide between conservative holders and more speculative participants.
Open Interest Nears Previous All-Time High After October Decline
Ethereum’s derivatives market has shown a steady and gradual recovery following a notable dip recorded in October 2024.
Open interest on ETH futures fell as low as 5 million ETH before turning higher once again. Since then, it has climbed steadily back toward levels approaching the prior peak of 7.8 million ETH reached in July 2025.
Crypto analyst Darkfost flagged this trend, noting that speculative traders remain unusually active despite broader market uncertainty.
His observations point to a growing divergence between more cautious mainstream investors and those drawn to derivatives. That divide is becoming clearer as open interest continues to build.
Binance remains the dominant force within the ETH derivatives market. The exchange currently holds 2.3 million ETH in open interest, representing around 36% of the total market share.
That concentration gives Binance considerable influence over Ethereum’s price movements on any given trading day.
Such dominance from a single platform also adds a layer of risk to the overall market structure. Any sharp shift in activity on Binance could quickly spread to the broader Ethereum ecosystem. Analysts and traders tracking ETH futures flows should, therefore, watch Binance’s figures closely.
Record Low Spot-to-Futures Ratio Reflects Heavy Leverage Across ETH Market
The spot-to-futures volume ratio on Binance has reached its lowest annual level ever recorded for ETH. At 0.13, this means that for every $1 traded on the spot market, roughly $7 moves through futures contracts. This figure illustrates the extent to which derivatives now dominate ETH trading activity entirely.
As Darkfost noted, this pattern suggests that speculation is currently the primary driver behind Ethereum’s price action.
When futures volume outpaces spot by this margin, price movements are more likely to reflect trader positioning than actual demand. That makes market direction more difficult to interpret with confidence.
Heavy reliance on leverage also makes the broader market more vulnerable to sudden swings. When large leveraged positions begin to unwind, a chain of liquidations can follow quickly. These events tend to sharpen volatility in both directions and within a short time frame.
For those actively participating in the ETH market, this setup warrants careful attention to risk management. Monitoring open interest levels and funding rates alongside price action can help traders gauge how stretched positions have become.
Markets driven primarily by futures activity tend to shift direction more sharply and suddenly than those grounded in steady spot demand.

The National Bank of Rwanda (BNR) publicly warned citizens against using the Rwandan Franc (FRW) for crypto transactions, two days after global exchange Bybit listed FRW on its peer-to-peer (P2P) platform without regulatory clearance.
The BNR highlighted Bybit’s promotional announcement, stating that crypto-assets remain unauthorized for payments, FRW conversion, or P2P trading under current law.
Why Bybit’s Timing Could Not Have Been Worse
Rwanda has maintained a restrictive stance on private crypto since 2018, when the BNR first declared cryptocurrencies illegal for domestic use.
That position has shifted gradually. In March 2025, the BNR and the Capital Markets Authority (CMA) released a draft framework to regulate Virtual Asset Service Providers (VASPs).
The bill explicitly prohibits crypto as legal tender, bans crypto mining and mixers, and bars tokens pegged to the FRW.
On March 4, 2026, Rwanda’s Cabinet approved a comprehensive version of that bill. The Chamber of Deputies passed its general principles on March 31. Committee review continues.
Bybit launched its FRW P2P feature on April 2, just two days later, offering new-user rewards and bi-weekly merchant commissions.
Its announcement made no mention of local regulatory approval. Community members also flagged that promotional materials featured an outdated Rwandan national emblem.
A Direct Challenge to Rwanda’s CBDC Plans
The BNR is piloting its own Central Bank Digital Currency (CBDC), the e-FRW, following a proof-of-concept completed in February 2026. A 12-month domestic pilot is underway before international cross-border testing begins.
Unregulated foreign platforms attaching the FRW to crypto markets risk undermining that effort and eroding public trust in the currency.
The CMA has also cited pressure from the Financial Action Task Force (FATF) over crypto-linked money laundering as a core reason for formal regulation.
What Comes Next
Under the draft law, unlicensed VASP operators in Rwanda face fines up to 30 million FRW, roughly $21,000, and up to five years in prison.
Bybit has not publicly responded to the BNR’s warning. Binance and Remitano have offered FRW P2P pairs for years without triggering comparable pushback, suggesting Bybit’s loud promotional approach crossed a regulatory threshold.
Whether Bybit removes FRW voluntarily or waits for formal enforcement may set a precedent for every foreign exchange eyeing East Africa.
The post Bybit Crosses a Line in Rwanda That Binance Has Walked for Years Without Consequence appeared first on BeInCrypto.

This week, Google published a paper describing how a quantum computer could theoretically derive a bitcoin private key in 9 minutes, with ramifications that stretch to Ethereum, other tokens, private banking, and potentially everything in the world.
Quantum computing is easy to mistake for a faster version of a regular computer. But it is not a more powerful chip or a bigger server farm. It is a fundamentally different kind of machine, different at the level of the atom itself.
A quantum computer starts with a very cold, very small loop of metal where particles begin to behave in ways they do not behave under normal conditions on Earth, ways that alter what we think of as the basic rules of physics.
Understanding what that means, physically, is the difference between reading about the quantum threat and actually grasping it.
How computers and quantum computers actually work
Regular computers store information as bits — each is either a 0 or a 1. A bit is a tiny switch. Physically, it’s a transistor on a “chip” — a microscopic gate that either lets electricity through (1) or doesn’t (0).
Every photo, every bitcoin transaction, every word you’ve ever typed is stored as patterns of these switches being on or off. There is nothing mysterious about a bit; it is a physical object in one of the two definite states.
Every calculation is just shuffling these 0s and 1s around really fast. A modern chip can do billions of these per second, but it still does them one at a time, in sequence.
Quantum computers use something known as qubits instead of bits. A qubit can be 0, 1, or — and this is the weird part — both at the same time!
This is possible as a qubit is a completely different kind of physical object. The most common version, and the one Google uses, is a tiny loop of superconducting metal cooled to about 0.015 degrees above absolute zero, colder than outer space but here on Earth.
At that temperature, electricity flows through the loop without any resistance, and the current is said to exist in a quantum state.
In the superconducting loop, current can flow clockwise (call that 0) or counterclockwise (call that 1). But at quantum scales, the current does not have to pick one direction and actually flows in both directions simultaneously.
Don’t mistake it for switching between the two really fast. The current is measurably, experimentally and verifiably in both states simultaneously.

Mind-bending physics
With us so far? Great, because here’s where it gets genuinely strange, because the physics behind how it works isn’t immediately intuitive, and it is not supposed to be.
Everything someone interacts with in daily life obeys classical physics, which assumes that things are in one place at one time. But particles do not behave this way at the subatomic scale.
An electron does not have a definite position until you look at it. A photon does not have a definite polarization until you measure it. A current in a superconducting loop does not flow in a definite direction until you force it to pick.
The reason we don’t experience this in everyday life is decoherence. When a quantum system interacts with its environment, air molecules, heat, vibrations and light, the superposition collapses almost instantly.
A football cannot be in two places at once because it is interacting with trillions of air molecules, dust, sound, heat, gravity, etc., every nanosecond. But isolate a tiny current in a near-absolute-zero vacuum, shield it from every possible disturbance, and the quantum behavior survives long enough to compute with.
That’s why quantum computers are so hard to build. People are engineering physical environments where the laws of physics that normally prevent this stuff from happening are held at bay for just long enough to run a calculation.
Google’s machines operate in dilution refrigerators the size of huge rooms, colder than anything in the natural universe, surrounded by layers of shielding against electromagnetic noise, vibration, and thermal radiation.
And the qubits are fragile even then. They lose their quantum state constantly, which is why “error correction” dominates every conversation about scaling up.
So quantum computing is not a faster version of classical computing. It is exploiting a different set of physical laws that only apply at extremely small scales, extremely low temperatures, and extremely short timeframes.

Now stack that up.
Two regular bits can be in one of four states (00, 01, 10, 11), but only one at a time (since current flows in only one direction). Two qubits can represent all four states at once, as the current is flowing in all directions at the same time.
Three qubits represent eight states. Ten qubits represent 1,024. Fifty qubits represent over a quadrillion. The number doubles with every qubit that is added, which is why the scaling is so exponential.
The second trick is something called entanglement. When two qubits are entangled, measuring one instantly tells an observer something about the other, no matter how far apart they are. This lets a quantum computer coordinate across all those simultaneous states in a way that regular parallel computing cannot.
And these quantum computers are set up so that wrong answers cancel each other out (like overlapping waves that flatten) and right answers reinforce each other (like waves that stack higher). By the end of the computation, the correct answer has the highest probability of being measured.
So it’s not brute-force speed. It’s a fundamentally different approach to calculation — one that lets nature explore an exponentially large space of possibilities and then collapses to the right answer through physics rather than logic.
A monumental threat to cryptography
This mind-bending physics is why it is terrifying for encryption.
The math protecting bitcoin relies on the assumption that checking every possible key would take longer than the age of the universe.
But a quantum computer doesn’t check every key. It explores all of them simultaneously and uses interference to surface the right one.
That is where it ties into Bitcoin. Going one direction, from private key to public key, takes milliseconds. Going the other direction, from public key back to private key, would take a classical computer a million years, or even longer than the age of the universe. That asymmetry is the only thing proving that a person is holding their coins.

A quantum computer running an algorithm called Shor’s can go through that trapdoor in reverse. Google’s paper this week showed it could do so with far fewer resources than anyone previously estimated, and within a timeframe that races against bitcoin’s own block confirmations.
This is why the threat of quantum computers breaking blockchain encryption is genuinely making everyone very worried.
How that attack works step by step, what Google’s paper specifically changed, and what it means for the 6.9 million bitcoin already exposed, is the subject of the next piece in this series.
Michael Saylor Signals New Bitcoin Move as Strategy Holdings Face Short-Term Loss
RCB vs CSK: Tim David goes ballistic, equals AB de Villiers record to … | Cricket News

Sony’s PS5 Price Hikes Prove This Console Generation Is Far From Over. Good.


-

 NewsBeat3 days ago
Steven Gerrard disagrees with Gary Neville over ‘shock’ Chelsea and Arsenal claim | Football
-

 Business3 days ago
No Jackpot Winner and $194 Million Prize Rolls Over
-

 Fashion2 days ago
Weekend Open Thread: Spanx – Corporette.com
-
Entertainment6 days ago
Fans slam 'heartbreaking' Barbie Dream Fest convention debacle with 'cardboard cutout' experience
-

 Crypto World4 days ago
Gold Price Prediction: Worst Month in 17 Years fo Save Haven Rock
-

 Tech7 days ago
The Pixel 10a doesn’t have a camera bump, and it’s great
-

 Tech7 days ago
Avatar Legends: The Fighting Game comes out in July and it looks pretty slick
-
Crypto World5 days ago
Dems press CFTC, ethics board on prediction-market insider trades
-

 Sports1 day ago
India men’s 4x400m and mixed 4x100m relay teams register big progress | Other Sports News
-

 Business4 days ago
Login and Checkout Issues Spark Merchant Frustration
-

 Tech6 days ago
Apple will hide your email address from apps and websites, but not cops
-

 Tech6 days ago
EE TV is using AI to help you find something to watch
-

 Sports5 days ago
Tallest college basketball player ever, standing at 7-foot-9, entering transfer portal
-

 Politics6 days ago
Should Trump Be Scared Strait?
-

 Tech6 days ago
Flipsnack and the shift toward motion-first business content with living visuals
-

 Fashion6 days ago
The Best Spring Trends of 2026
-

 Sports6 days ago
Women’s hockey camp eyes fitness boost, tactics ahead of WC 2026 campaign | Other Sports News
-
Tech6 days ago
Daily Deal: StackSkills Premium Annual Pass
-

 Crypto World6 days ago
U.S. rule change may open trillions in 401(k) funds to crypto
-

 Tech5 days ago
How to back up your iPhone & iPad to your Mac before something goes wrong
You must be logged in to post a comment Login