
Crypto World
American Outdoors Soars 35% After Recovering From Tariff Losses


The great outdoors is leading to a great stock rally. On Friday, shares of American Outdoor Brands (AOUT) shot up roughly 35% after a blowout earnings call, as it recovered from a tariff-stricken fiscal year. American Outdoor Brands sells hunting and fishing equipment, gun accessories and camping gear under a variety of different brands. It had formerly been the parent…
Copyright ©2026 Investor’s Business Daily, LLC. All rights reserved. 87990cbe856818d5eddac44c7b1cdeb8

The Dow Jones Industrial Average fell with the Nasdaq reversing direction and slipping into the red in late-morning trade Friday after a stronger-than-expected August jobs report. Several chip names bucked the broader weakness as Nvidia (NVDA) headed higher in a buy zone but Ambarella (AMBA) proved an exception as it stumbled on the stock market today. In morning trade Friday,…
Copyright ©2026 Investor’s Business Daily, LLC. All rights reserved. 87990cbe856818d5eddac44c7b1cdeb8
Crypto World
BTC Stopped at $82K as Strong US Jobs Report Shakes Markets, Strategy Resumes Buying: Weekly Recap
It was another eventful week in the cryptocurrency markets as August closed, with BTC ending in the green for the first time during a bear market, further signaling a major shift in sentiment. However, Friday’s jobs report flipped the script again.
Before we dive into all of that, let’s rewind the clock by a week and see what the landscape was last Friday. Despite briefly surging past $81,000 on a couple of occasions, BTC was quickly halted and driven south to just under $80,000. Most altcoins, though, produced major weekly gains.
The rejection at the time came after the hawkish stance taken by Fed Chair Kevin Warsh, and the leg down drove BTC to just under $77,000 on Saturday morning. However, the asset rebounded swiftly and tapped $79,000 on Sunday. Another leg down to $77,000 took place on Monday morning as the US and Iran initiated new attacks against each other.
The primary cryptocurrency remained volatile in the following few days, but was contained in a relatively tight range between $76,400 and $79,000. It last tested the upper boundary on Wednesday morning, and the bulls managed to defend it. The subsequent leg up came on Thursday and was significantly more successful.
Bitcoin broke out of its $79,000 barrier and surged past $80,000. It kept going during the early hours on Friday and jumped to $82,400 for the first time since mid-May. Although it was stopped there, it remained above $81,000 until earlier today, when the much stronger-than-expected US jobs report came out.
BTC slumped immediately by two grand as the general assumption is that the Fed will be more inclined to raise the hikes at the end of the month. The weekly performance shows a few clear winners – ZEC has gained 20%, and it even surpassed $1,000 earlier today, XMR is up by 10%, while UNI has rocketed by almost 40%.
Market Data

Market Cap: $2.775T | 24H Vol: $121B | BTC Dominance: 57.6%
BTC: $79,270 (-0.35%) | ETH: $2,450 (-2.5%) | XRP: $1.39 (-1.5%)
This Week’s Crypto Headlines You Can’t Miss
Strategy Is Buying Bitcoin Again After 2-Month Pause: Here’s How Much. Monday began with a bang as the world’s largest corporate holder of BTC resumed its purchases for the first time in over two months, accumulating 4,603 BTC for $370 million. The problem for the company is that it sold at low prices only to buy back at much higher levels.
Gold Just Erased All Its August Gains – Bitcoin Is Holding Up Better at $77K. The precious metal exploded alongside BTC in the middle of August, hitting $4,700 for the first time in months. However, it lost all gains, even dipping below its starting price of $4,360 earlier this week. In contrast, BTC is up by roughly 25% even after today’s correction.
Arthur Hayes Says Ignore Warsh and Watch EUR/JPY for Bitcoin’s Next Move. BitMEX’s former CEO believes the Fed and Kevin Warsh are not the most important factors to determine BTC’s next move. Instead, he urged investors to pay more attention to the euro-yen exchange rate.
Trezor Breach Is Much Bigger Than Initially Thought: Another 67,000 Customers Exposed. The hardware wallet manufacturer admitted today that the ShipMonk breach was significantly more worrisome than initially believed. Its latest update showed that the actual number of affected US customers from the data leaks is over 80,000, not 13,689.
Bitcoin Makes History With First-Ever Green August During a Bear Market. As mentioned above, bitcoin ended August in a highly unexpected manner. History suggested that the asset wouldn’t enjoy the eighth month of the year, but reality was much different. BTC closed with a near-25% surge for the first time in bear market years.
Bitcoin Is Back Above $80,000, But Fidelity Says the Bear Market May Not Be Over Yet. The flagship digital asset surged past $80,000, as explained earlier, but analysts at Fidelity weren’t convinced BTC is out of the woods. They outlined some historical references and determined that the bear market might not be over yet.
Charts
This week, we have a chart analysis of Ethereum, Ripple, Cardano, Binance Coin, and Hyperliquid – click here for the complete price analysis.
The post BTC Stopped at $82K as Strong US Jobs Report Shakes Markets, Strategy Resumes Buying: Weekly Recap appeared first on CryptoPotato.
Brokerage giant Charles Schwab (SCHW), along with Robinhood Markets (HOOD), Ameriprise Financial (AMP) and LPL Financial (LPLA) are among the best stocks to watch in the ongoing stock market volatility. Charles Schwab stock and Robinhood are in or near buy zones, but a recent Interactive Brokers (IBKR) breakout has failed. All of the stock picks come from Investor’s Business Daily’s…
Copyright ©2026 Investor’s Business Daily, LLC. All rights reserved. 87990cbe856818d5eddac44c7b1cdeb8


Adam Aron said synthetic AMC shares could divert demand from the actual stock and strip investors of shareholder rights, drawing support from some tokenization executives.
Today’s jobs report showed a surprisingly large payroll gain and steady unemployment rate. Although the focus is on inflation and next week’s key reports, August labor market data could be a tie-breaker influencing the outcome of the Federal Reserve’s Sept. 16 policy update. The S&P 500 fell moderately after the jobs report. That follows Thursday’s rally for stocks and bonds…
Copyright ©2026 Investor’s Business Daily, LLC. All rights reserved. 87990cbe856818d5eddac44c7b1cdeb8


Disclosure: This content is provided by a third party. Neither crypto.news nor the author of this article endorses any product mentioned on this page. Users should conduct their own research before taking any action related to the company.
Summary
- XRP rose 9.4% to $1.46 after holding $1.36 support and breaking above a short-term downtrend.
- Resistance between $1.50 and $1.80 remains the main barrier to further gains.
- September catalysts include an XRPL upgrade, a CLARITY Act vote and the Federal Reserve’s rate decision.
- ASDeFi promotes fixed-return cloud-mining contracts, but its earnings and operational claims require independent verification.
XRP rebounds strongly after holding key support level
On Sep. 4, 2026, XRP was trading at $1.46, up 9.4% over the past 24 hours. After breaking through the downtrend line that had been capping XRP for several days, the price surged from $1.33 to $1.46, marking one of the largest single-day gains in recent memory.
XRP’s next target price is $1.54. However, it has yet to break through the long-term resistance zone between $1.50 and $1.80, which has been holding back its upward momentum for several months. A breakout from this zone, accompanied by strong follow-through buying pressure, is necessary to confirm that this rally is not a fleeting phenomenon but rather the beginning of a larger uptrend.
Today’s price rebound is not merely a technical reaction. XRP’s fundamentals have been steadily strengthening throughout 2026.
On Aug. 11, 2026, Ripple received a full Crypto-Asset Service Provider (CASP) license from the Luxembourg Financial Supervisory Commission (CSSF) under the EU’s MiCA framework. This means Ripple can provide compliant payment services in all 30 countries and regions of the European Economic Area.
Three key catalysts in September
If you’re an XRP investor, be sure to keep these three dates in September in mind:
· Sep. 11 | XRPL 3.3.0 version upgrade activated
· Sep. 15 | Senate vote on the CLARITY Act
· Sep. 16 | U.S. Federal Open Market Committee (FOMC) interest rate decision
For retail investors, betting on the outcome of a specific date is a very difficult decision. If you buy XRP at $1.46 and the bill is rejected on September 15, you could incur an immediate loss.
And this is precisely why ASDeFi’s Bitcoin cloud mining becomes a viable alternative.
ASDeFi: Earn Bitcoin every day, no matter the outcome
ASDeFi is a Bitcoin cloud mining platform founded in 2020, with over 5 million users across more than 170 countries and regions. It is powered by Bitmain, the world’s largest ASIC manufacturer. ASDeFi accounts for more than 1% of global Bitcoin hash rate and currently operates a record-breaking 16.7 million TH of hash rate.
ASDeFi four-step getting started guide:
Step 1: Visit the Cloud Mining official website
Enter your email address and password to create an account. You’ll receive a $15 bonus upon registration and a $0.60 bonus for logging in every day.
Step 2: Deposit cryptocurrency assets
Go to the platform’s deposit page to deposit major cryptocurrencies, including: BTC, USDT, ETH, LTC, USDC, XRP, BCH, and others.
Step 3: Purchase a mining contract
Go to the Contracts page and purchase a $15 check-in contract. Choose the appropriate hashrate contract based on your budget and investment plan.
Examples of common contracts:
Check-in Contract: $15 — 1-day cycle — Total profit of approximately $15.60
Introductory Contract: $100 — 2-day cycle — Total profit of approximately $108
Basic Contract: $1,500 — 10-day cycle — Total profit of approximately $1,717.50
Stable Contract: $6,000 — 20-day cycle — Total profit approximately $8,040
Stable Contract: $30,000 — 30-day cycle — Total profit approximately $47,100
(For more contract details, please visit the official website)
Step 4: Start mining and earn rewards
Once you’ve completed the contract purchase, the platform automatically allocates computing power resources, and the system begins running. You can view your earnings in real time on your phone and withdraw them to your wallet at any time.
Conclusion
XRP is currently trading at $1.46, up 9.4% today, having successfully held the key support level of $1.36 and broken above the downtrend line. However, the September 15 vote on the CLARITY Act still poses a risk. If the bill passes, the price of XRP could surge to $2. If it fails to pass, it could fall back to $1.27. No one can be certain of the final outcome.
ASDeFi eliminates this uncertainty. Whether XRPL 3.3.0 is activated on September 11, the Senate votes on September 15, or the Federal Reserve decides on interest rates on September 16—ASDeFi users’ Bitcoin accumulation will not stop. Earn passive income every day, unaffected by any of these outcomes.
App download: https://asdefi.com/xml/index.html#/app
Customer service email: [email protected]
Disclosure: This content is provided by a third party. Neither crypto.news nor the author of this article endorses any product mentioned on this page. Users should conduct their own research before taking any action related to the company.
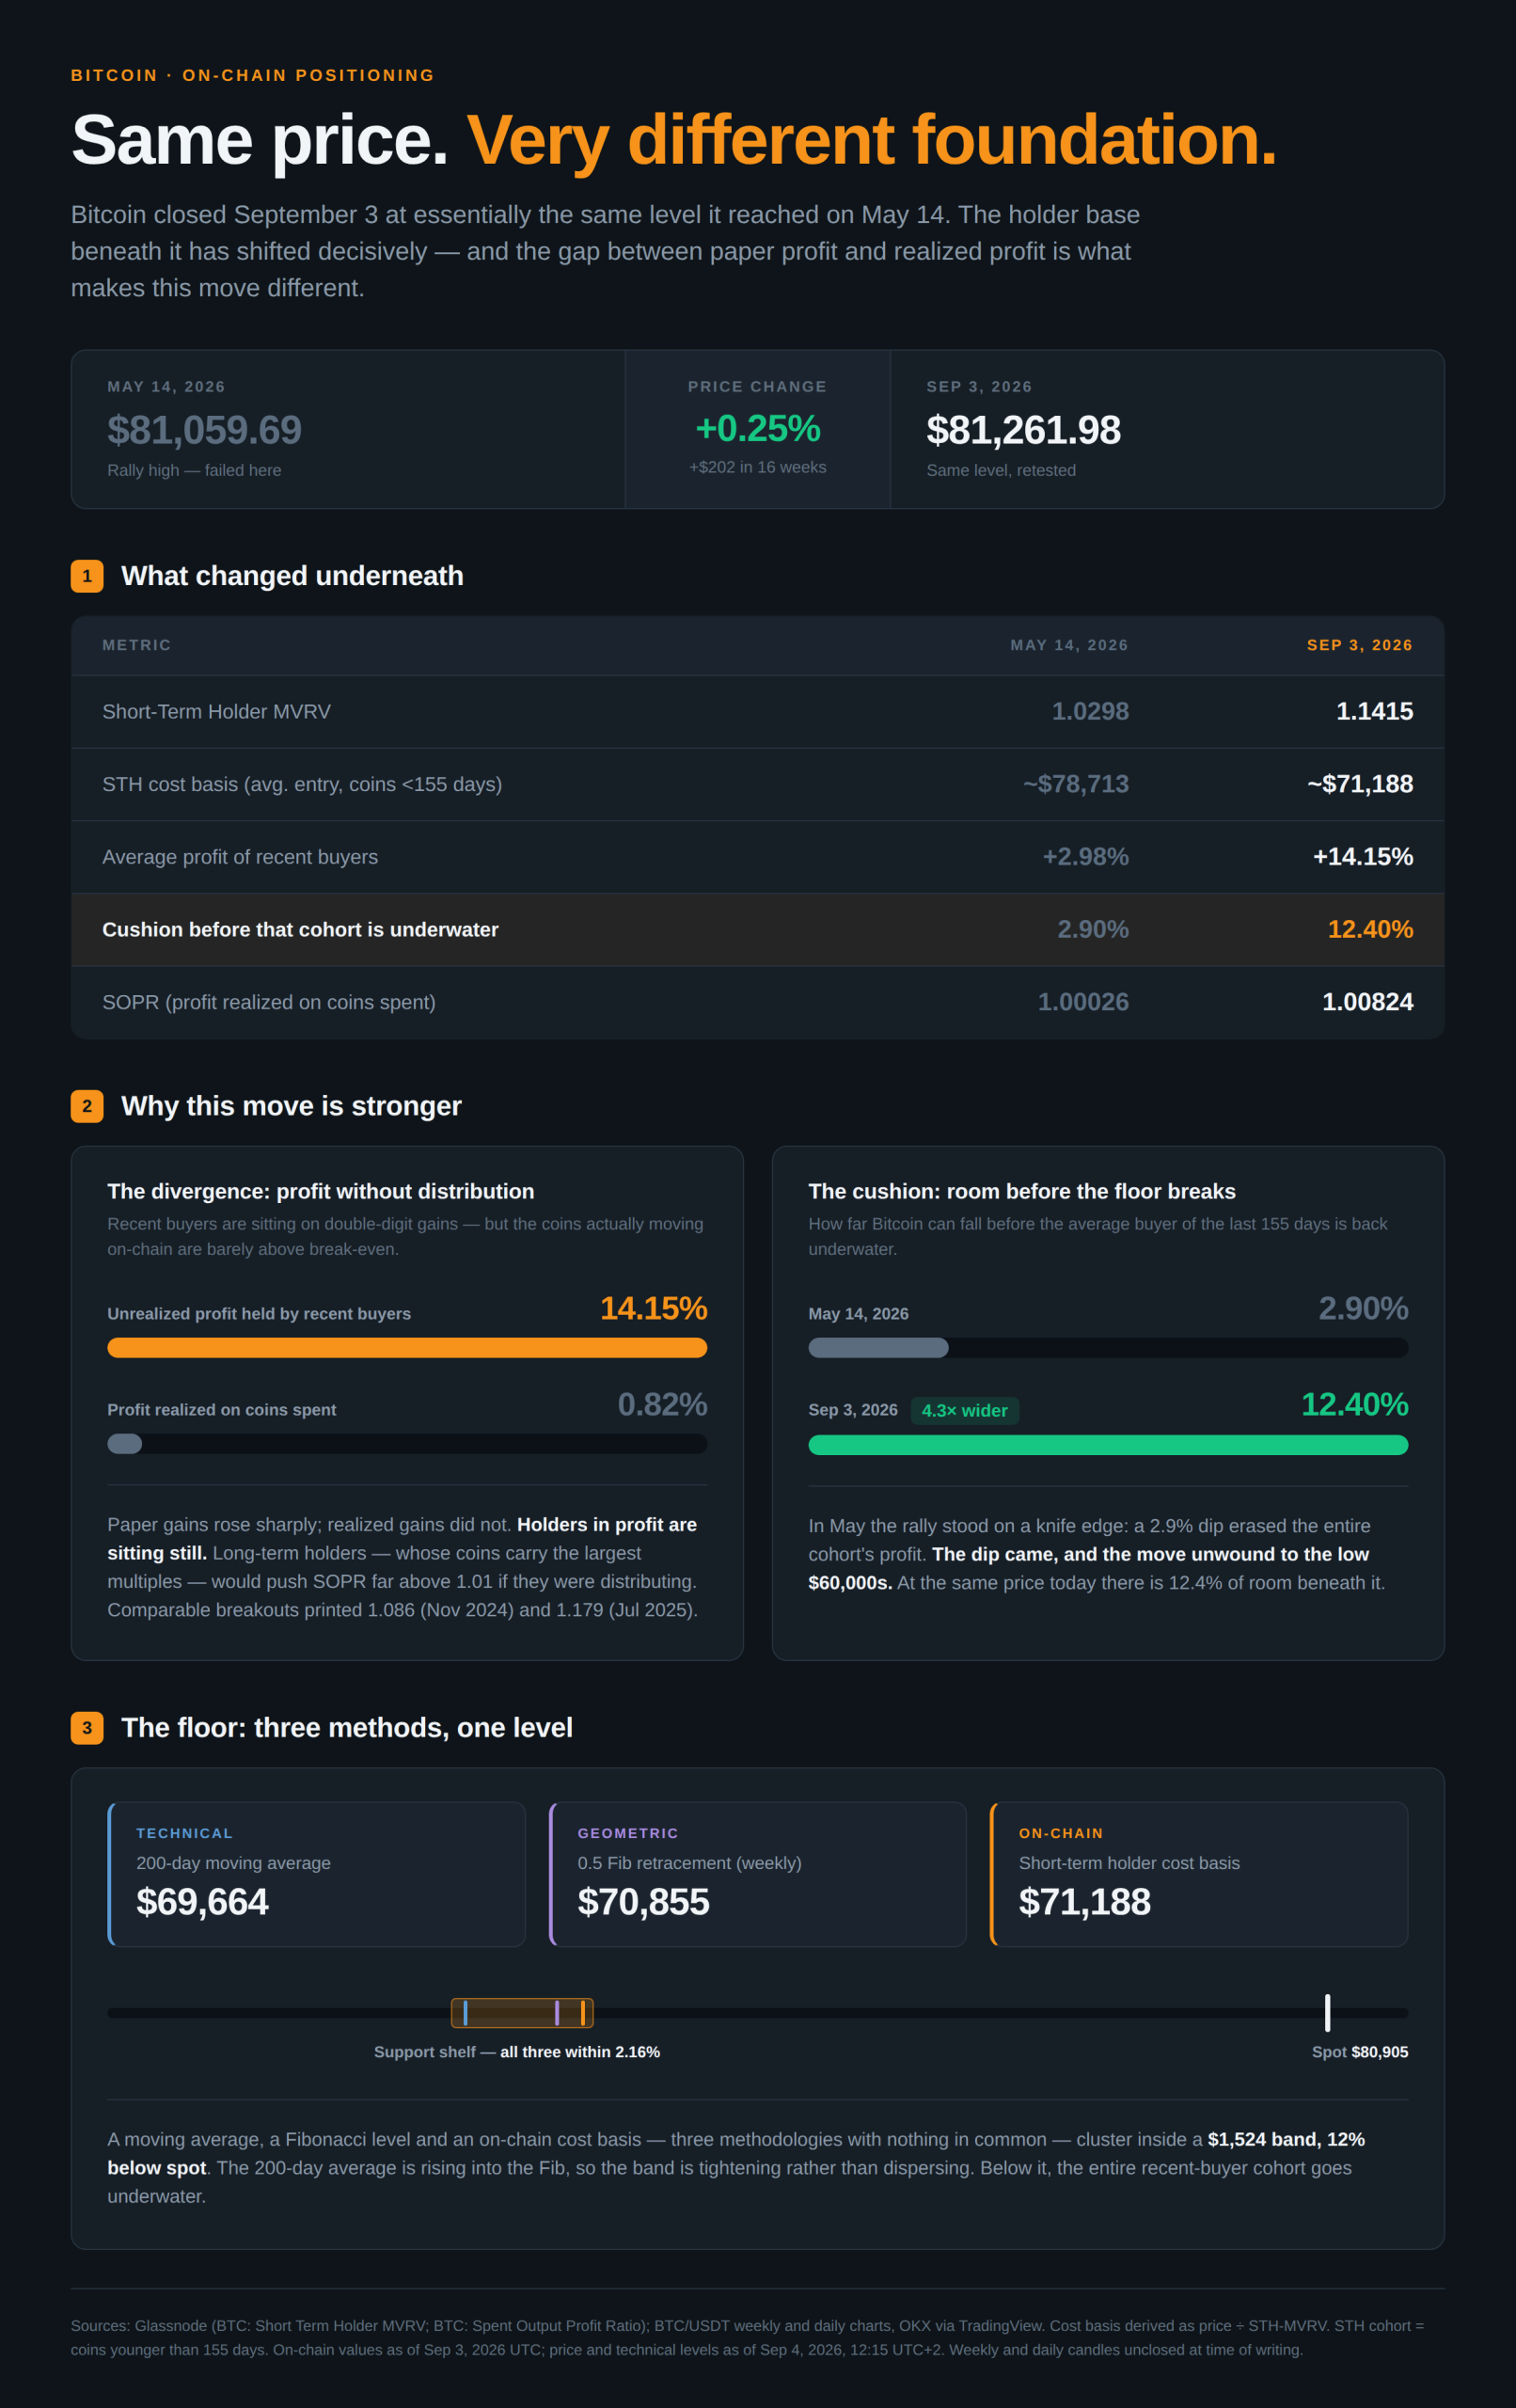
Bitcoin (BTC) price climbed to $81,050 on Friday, returning to the level it last touched on May 14. Recent buyers now sit far further from breakeven than they did then.
Glassnode data shows the average entry price for coins younger than 155 days has dropped sharply. Bitcoin, meanwhile, trades at almost the same level as in May.

Short-Term Holder Cost Basis Reset Almost $7,500 Lower
Short-Term Holder MVRV measures how far recent buyers sit above or below their average entry. The reading closed at 1.1415 on September 3, against 1.0298 on May 14.
Both dates share nearly the same price. May 14 closed at $81,059.69, while September 3 closed at $81,261.98, a difference of just 0.25%.

The implied cost basis, in contrast, tells a different story. It stood near $78,713 in May and sits near $71,188 today, a reset of roughly $7,500.
That changes the margin for error. In May, a 2.9% dip would have pushed the whole cohort back underwater. The dip arrived, and the rally unwound toward the low $60,000s.
Today the same cohort holds a 12.4% buffer, more than four times wider. Historically, that buffer has decided whether recoveries hold or fail.
SOPR Shows Profit Without Distribution
The cushion looks encouraging. Spent Output Profit Ratio, however, complicates the picture.
SOPR printed 1.0082 on September 3. Coins moving on-chain therefore changed hands at less than 1% average profit.
Comparable breakouts produced far hotter readings. SOPR reached 1.086 in November 2024 and 1.179 in July 2025.

Long-term holders appear inactive. Their coins carry the largest multiples, so meaningful selling would lift the ratio well above current levels.
Yet the same reading cuts both ways. Weekly volume keeps declining, and the spike behind last week’s breakout has not repeated. Thin participation may indicate tight supply among holders, or a move driven by derivatives rather than spot buyers.
Bitcoin Price Prediction and the $82,842 Trigger
The weekly chart shows a sequence of lower highs and lower lows since the $126,200 record. That sequence is now breaking. Bitcoin has printed a higher low and trades 35.8% below its all-time high.
A weekly close above $82,842 would confirm the first higher high since the record. The current weekly high reached $82,285, roughly $557 short.

Resistance sits immediately above at the 0.382 Fibonacci retracement near $83,917. A break of the trigger that stalls there would leave the reversal unconfirmed.
Support looks unusually well defined. The 200-day moving average sits at $69,664 and the 0.5 Fibonacci level at $70,855. The on-chain cost basis at $71,188 completes a band just 2.16% wide.
Bitcoin last tested that moving average as resistance on May 14. It now trades 16.3% above it.

Momentum warns against chasing. Daily RSI sits near 72 after touching 78 in late August, an early bearish divergence. Weekly RSI near 60, by contrast, still leaves room. A volume expansion would settle the argument.
Above $83,917 the reversal gains confirmation. Below $71,188 the buyers behind this move lose their profit.
The post Bitcoin Tests May Highs: Why Is This Time Different for Recent Buyers? appeared first on BeInCrypto.


Cointelegraph is committed to providing independent, high-quality journalism across the crypto, blockchain, AI, and fintech industries.
All news, reviews, and analyses are produced with full journalistic independence and integrity. For more details on our standards and processes, please read our Editorial Policy.
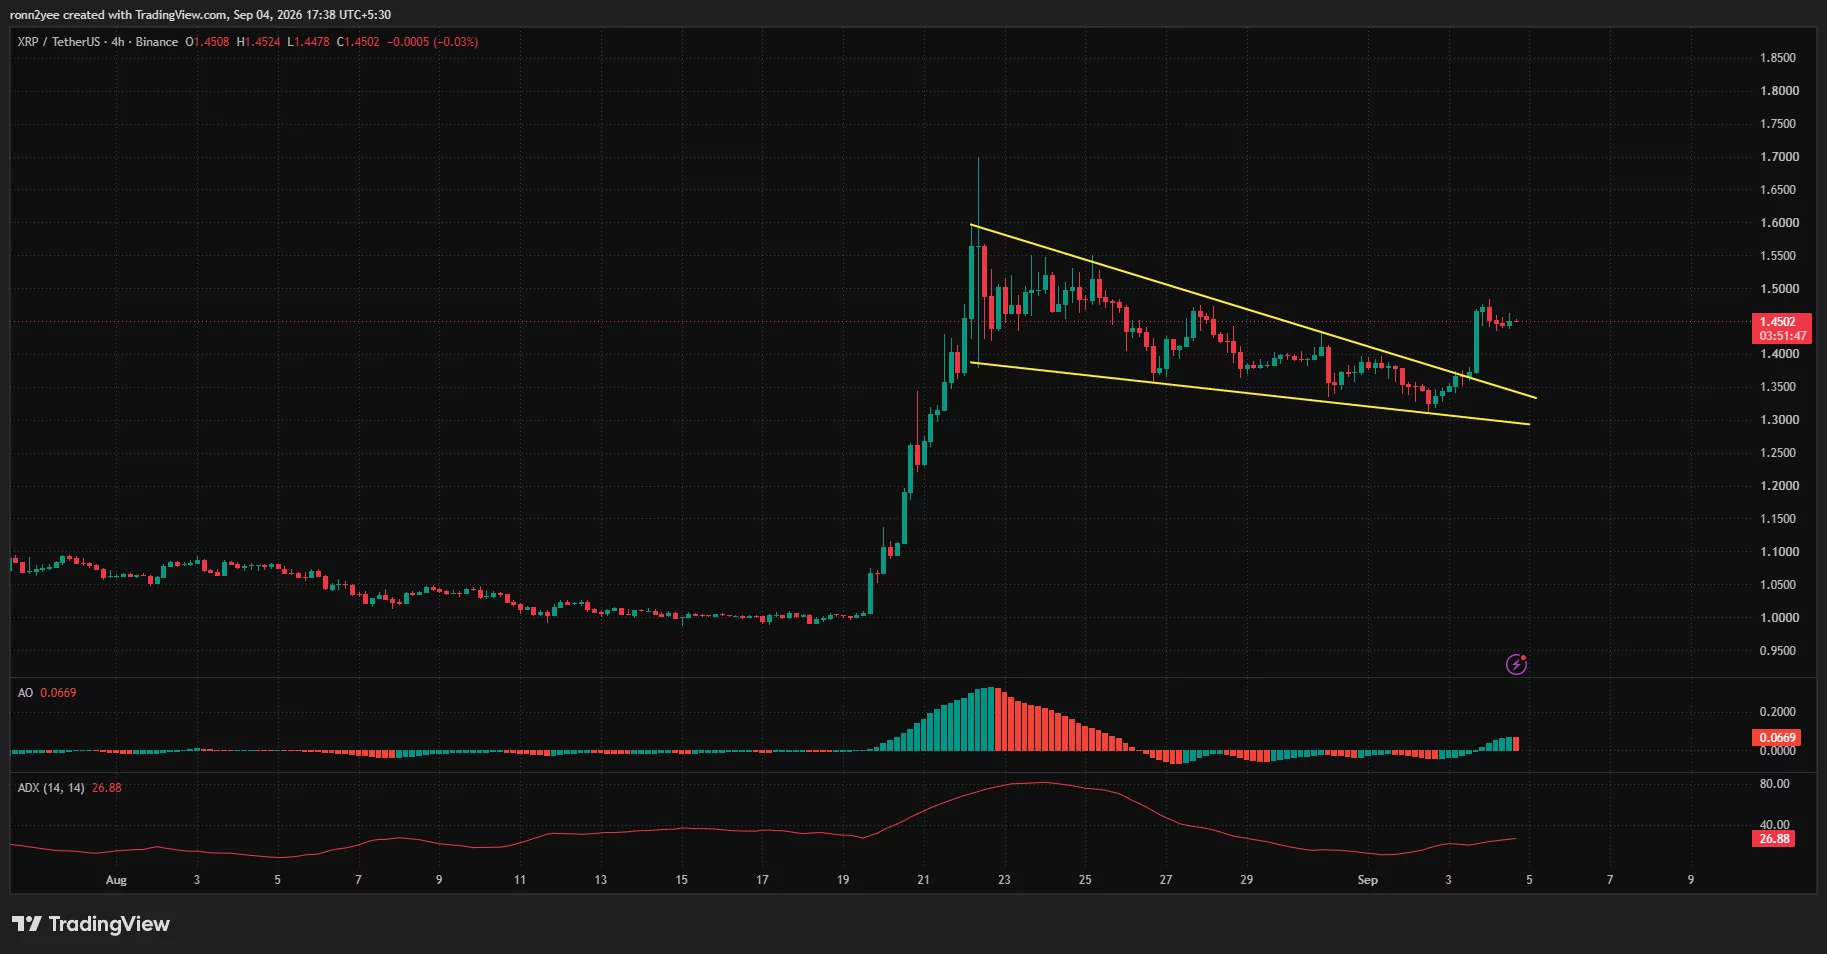
XRP price traded near $1.45 on Sept. 4 after breaking above a falling 4-hour channel, but resistance between $1.50 and $1.53 remains the next test for buyers.
Summary
- XRP price broke above a descending 4-hour channel after rebounding from support near $1.33.
- Daily RSI stands at 66.22, showing strong momentum without reaching the 70 overbought level.
- Liquidation clusters sit near $1.43 below price and between $1.48 and $1.53 above it.
- The Sept. 15 CLARITY Act vote and US inflation data could determine the next move.
XRP price action today
According to data from crypto.news, XRP (XRP) price was changing hands near $1.45 on Friday, consolidating after a sharp recovery from its early September low near $1.33.
The token briefly reached approximately $1.47 during the latest advance before losing some momentum. Even so, the pullback has remained shallow compared with the size of the breakout.
XRP’s 4-hour chart shows that price has moved above the upper boundary of a descending channel that had guided the market lower since its Aug. 22 rally. The channel formed after XRP spiked to a local high near $1.70 and then recorded a series of lower highs and lower lows.
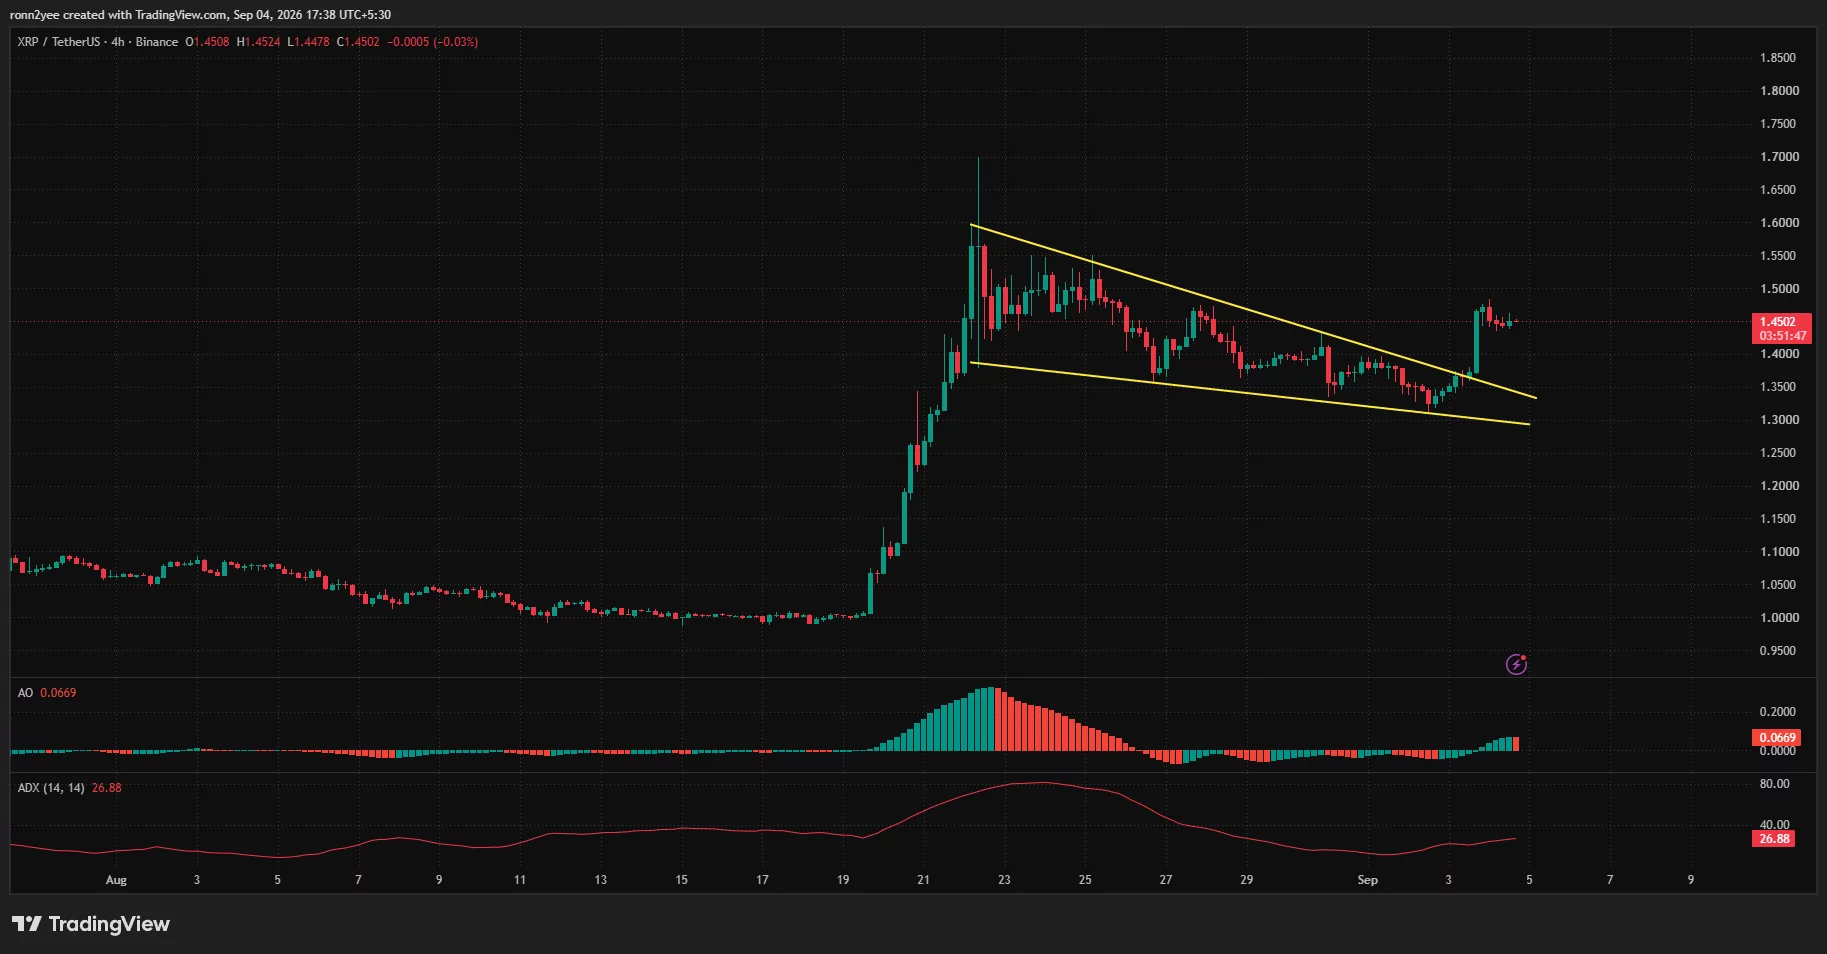
The breakout occurred near $1.37 and was followed by a rapid move above $1.45. XRP is now holding above the former channel resistance, leaving the short-term bullish structure intact while that level remains defended.
The Awesome Oscillator stands at 0.0669 and continues to print positive bars. The reading indicates that short-term momentum remains stronger than longer-term momentum, although the latest bars show that the initial acceleration may be slowing.
The Average Directional Index has climbed to 26.88. An ADX reading above 25 normally points to a developing directional trend, giving the channel breakout more weight than a move occurring under weak trend conditions.
XRP faces resistance at $1.50 and $1.53
The first major barrier sits between $1.48 and $1.50, where XRP repeatedly struggled to hold gains following its August surge. A 4-hour close above the zone could allow buyers to challenge the descending channel’s starting area near $1.55.
The daily chart places additional resistance at $1.53. Crypto analyst ChartNerd identified that level as XRP’s 50-week exponential moving average, while the 20-week EMA sits much lower at approximately $1.28.
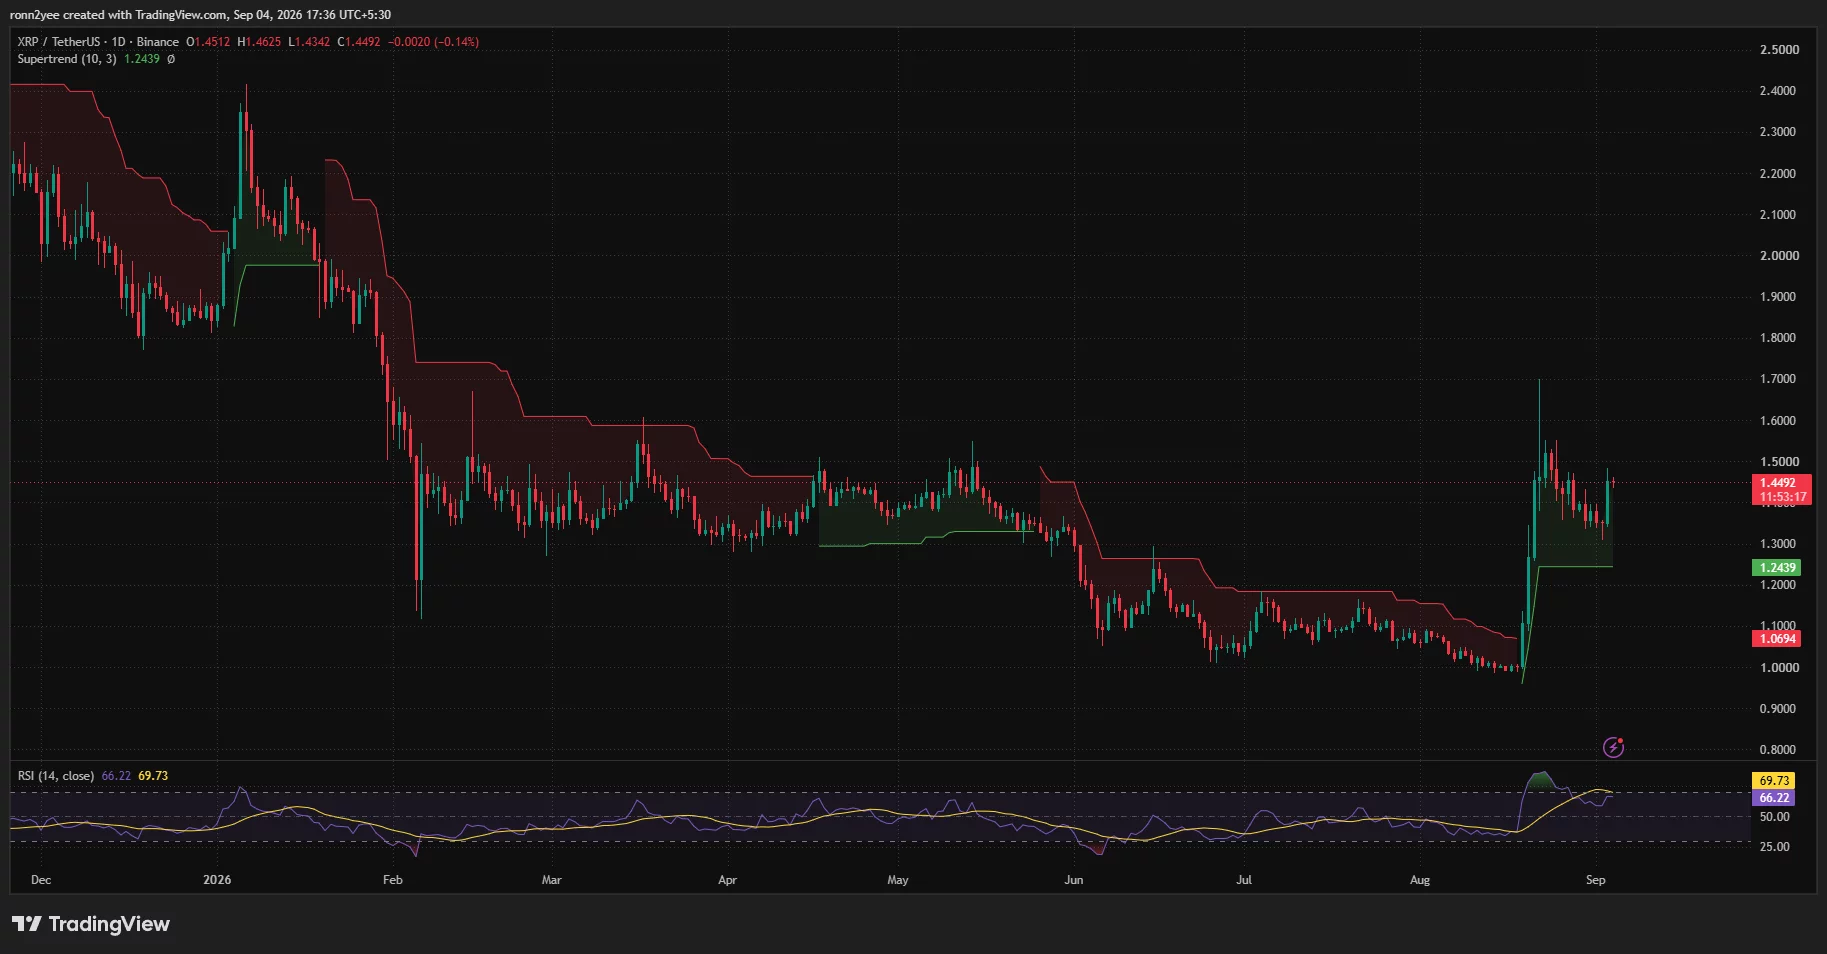
According to ChartNerd, XRP remains inside a large weekly compression range between the two averages. The analyst said a convincing move above the 50-week EMA could open the way toward $1.80, while repeated weekly closes below it would raise the risk of a deeper retracement.
Daily momentum supports another resistance test but also calls for some caution. XRP’s 14-day Relative Strength Index is at 66.22, below its signal average of 69.73 and just under the conventional overbought threshold of 70.
The reading shows that buyers still control the broader move, although momentum has cooled since XRP reached $1.70. A push above 70 alongside a price close over $1.53 would provide stronger confirmation that the recovery is extending.
Liquidation map puts $1.43 support in focus
CoinGlass’ three-day XRP liquidation heatmap shows the nearest large concentration of leveraged positions around $1.425 to $1.435. That liquidity sits just below the current market price and could attract a short-term sweep if XRP fails to hold $1.45.
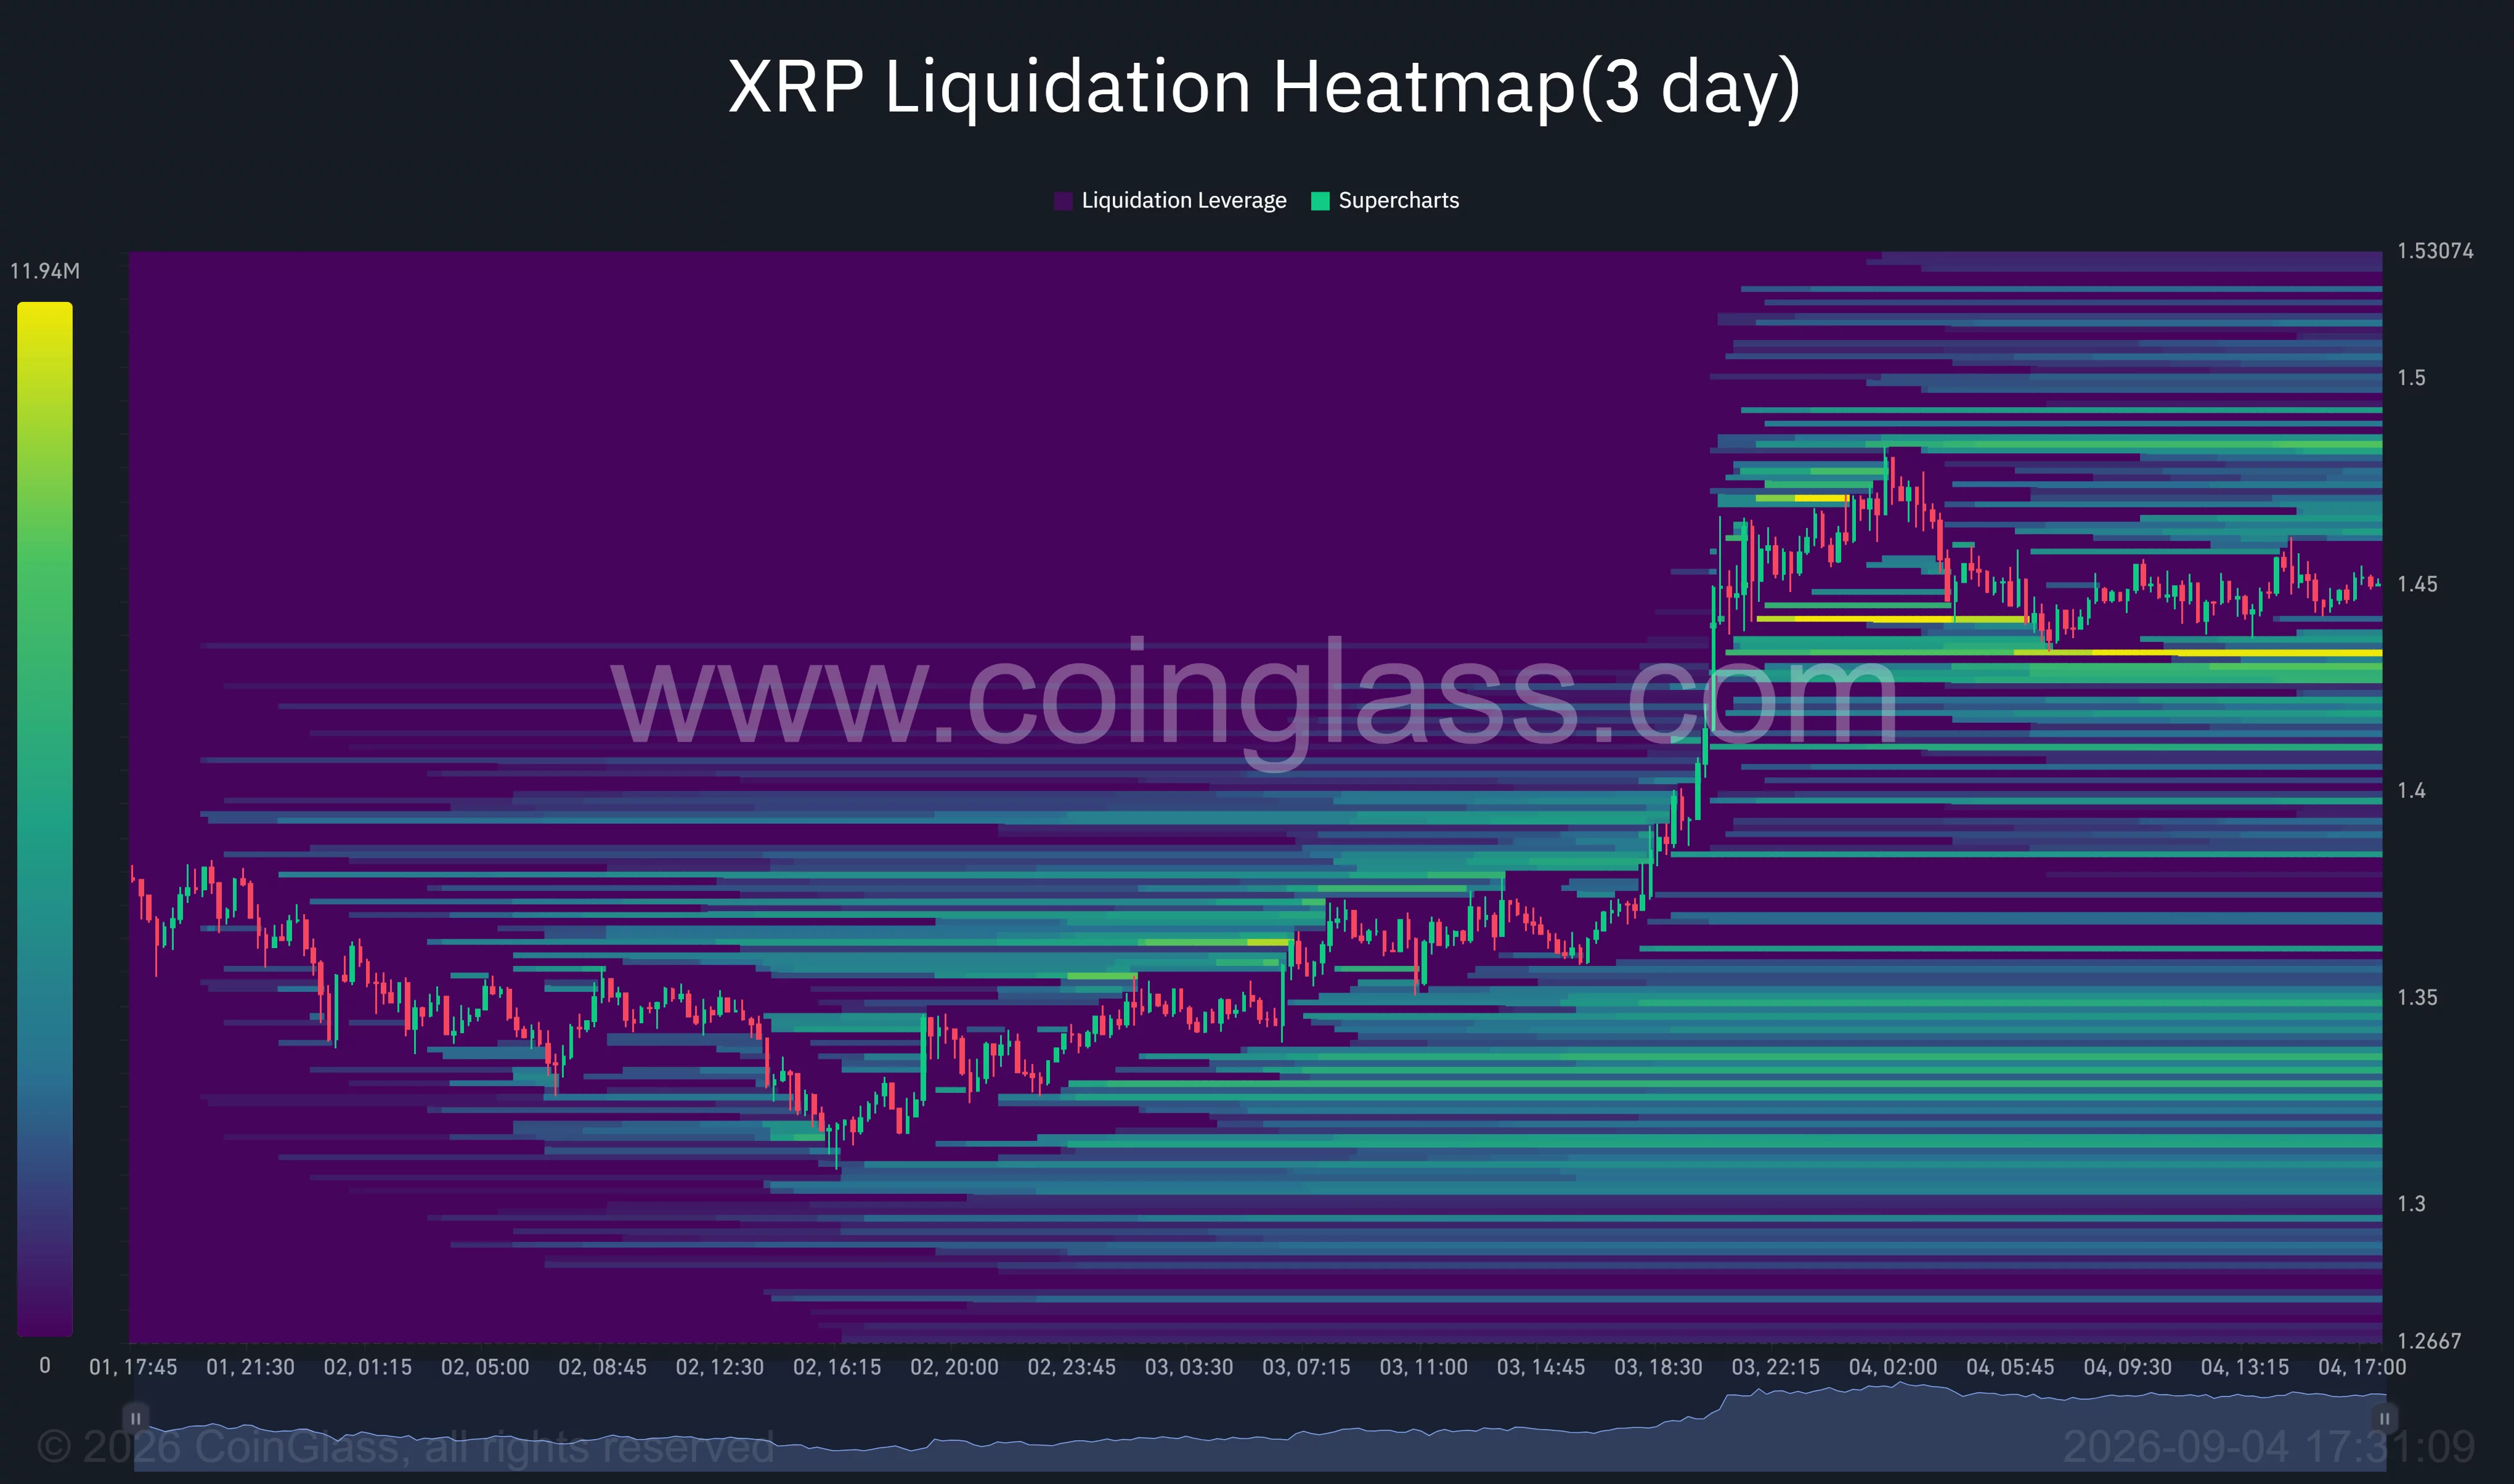
Further downside liquidity is spread across $1.40 and $1.37. The latter level is especially important because it overlaps with the former 4-hour channel resistance. A retest that holds above $1.37 would preserve the breakout structure.
A move below $1.37, however, would place the lower end of the former channel near $1.30 back in play. The daily Supertrend provides a wider structural support level at $1.2439, close to ChartNerd’s 20-week EMA near $1.28.
Above the market, liquidation positions are concentrated from approximately $1.48 to $1.53. A break into that zone could force short sellers to close their positions, adding market buy orders and potentially accelerating the move.
The heatmap does not guarantee that the price will reach either pool. It instead identifies areas where leveraged positions may be vulnerable if volatility increases.
Analysts see higher targets if the breakout holds
A separate analysis published by trader CW said XRP’s previous correction ended near the 0.5 Fibonacci retracement level. The token has since recovered above the 0.618 retracement, according to the analyst’s chart.
CW placed the next extended target at approximately $2.135, corresponding to the 1.618 Fibonacci extension. Reaching it would require XRP to clear several nearer barriers, including $1.50, $1.53, the August high near $1.70, and ChartNerd’s $1.80 target.
The nearer levels carry more importance for the current setup. A sustained move above $1.53 would complete the next stage of the breakout, while rejection could keep XRP confined between roughly $1.37 and $1.50.
US catalysts could raise XRP volatility
US-listed spot XRP exchange-traded funds recorded $110.49 million in net inflows during the week ending Aug. 28, their strongest weekly result of 2026. The figure followed an earlier increase in XRP ETF activity, with cumulative inflows reaching approximately $1.6 billion.
Traders are also watching the Senate’s Sept. 15 procedural vote on the CLARITY Act. The cloture motion requires 60 votes to advance and would end debate on the motion to proceed rather than pass the bill itself. The legislation could affect how US regulators divide oversight of digital assets.
Federal Reserve policy represents another near-term risk. Fed Governor Christopher Waller said on Sept. 3 that three-month core inflation had fallen from 4.76% in February to 3.05% through July.
Waller said he would support leaving rates unchanged if incoming inflation data confirms the cooling trend, but he did not rule out a hike if price pressures return. The August inflation report and the Fed’s Sept. 15–16 meeting could therefore influence liquidity across XRP and the wider crypto market.
For now, XRP’s 4-hour breakout favors buyers above $1.37. A close over $1.53 would strengthen the case for $1.70 and $1.80, while a loss of $1.37 would expose the $1.30–$1.24 support region.
Disclosure: This article does not represent investment advice. The content and materials featured on this page are for educational purposes only.
Crypto World
From warning to listing: UK’s largest retail investment platform opens access to crypto ETNs


The U.K.’s largest retail investment platform, Hargreaves Lansdown, has reversed course following the FCA’s decision to lift its retail ban on crypto ETPs in October.

Birmingham school pays tribute to ‘exceptional’ teen, 16, killed cycling home from prayers

Welsh retailers report a fall in shopping numbers

Stock Market Today: Dow Slides On Surprise Jobs Report; Nvidia Rises In Buy Zone





-

 Fashion7 days ago
Weekend Open Thread: Maeve – Corporette.com
-

 Crypto World6 hours ago
IMF Says El Salvador’s Post-Review Bitcoin Purchases Used No Public Funds
-

 Crypto World2 days ago
CLARITY Act could advance within weeks, Atkins says
-

 Politics8 hours ago
A new European chapter for Gibraltar
-

 Tech6 hours ago
JLab goes big on new headphones at IFA 2026
-

 Politics6 hours ago
33 Cosy Autumn Home Decor Ideas: Blankets, Pumpkin Decorations, And Candles
-

 Sports7 hours ago
Commanders’ Chig Okonkwo is a top breakout fantasy football candidate
-

 Sports6 hours ago
Alexandre Pato consortium’s Northampton Town investment approved
-

 Crypto World6 hours ago
IMF Says El Salvador’s Bitcoin Buying After Audit Used No Public Funds
-

 Business7 days ago
Onto Innovation Stock: AI’s Next Bottleneck Is Yield (NYSE:ONTO)
-
 Crypto World6 hours ago
Bitcoin News: BTC to Gold Ratio Hits 18 as Both Assets Rally
-

 Sports10 hours ago
Devon Dampier throws for 3 TDs as No. 21 Utah demolishes Idaho
-
Crypto World9 hours ago
XRP Trading Activity Hits Highest Level Since February as Price Jumps 8%
-

 Tech6 hours ago
Project Tube Shot Features Spark II Rocket and the Five-Foot Pipe That Gave a B Motor Extra Sky
-

 Crypto World2 days ago
Elon Musk Says Grok 4.7 Lands in 10 Days and Will Beat Every Model
-

 Politics6 hours ago
The House Article | When Nigel Farage enters No 10, he will not fall into Whitehall’s trap
-

 Tech6 hours ago
US law firm accuses UK AI software firm of unwanted contract renewal when it tried to leave
-

 Sports7 hours ago
Seven wickets in 21 balls: Sri Lanka’s Chamari Athapaththu scripts history with record-breaking spell
-

 Crypto World7 days ago
Bitcoin price tests $82K resistance as Brandt stays long
-
 Tech6 days ago
Hugging Face built a $4.5 billion empire on free AI models. Now Nvidia is buying it for $12.9 billion
You must be logged in to post a comment Login