
Crypto World
Putin Pauses Strikes on Kyiv as Trump Envoys Visit Russia and Ukraine


Trump attempts to revive stalled Ukraine-Russia peace talks
Trump has repeatedly stated that ending the Russia-Ukraine war is a major priority of his Administration, but the reality of that aim has proven difficult.
In August 2025, the U.S. President met his Russian counterpart in Anchorage, Alaska, to pursue a ceasefire agreement. The talks proved unsuccessful, and Trump left empty-handed.
In October 2025, Trump and Putin planned to meet in Budapest in hopes of furthering peace talks. But the summit was canceled just a few days after the summit was announced after Russia indicated that its hard-line stance on the war had not shifted.
“It just didn’t feel right to me,” Trump said at the time. “It didn’t feel like we were going to get to the place we have to get. So I canceled it.”
Strain between Trump and Zelensky also impeded progress. In February 2025, Oval Office talks collapsed within minutes when the U.S. President accused Zelensky of being “ungrateful” for U.S. aid and refusing to agree to a ceasefire without security assurances. In the 18 months since, however, that tension has largely dissipated, with Trump saying at this year’s NATO summit that the two had “actually developed a good relationship.”

Crypto World
Why crypto experts say buying and holding bitcoin easily beats trying to time the market
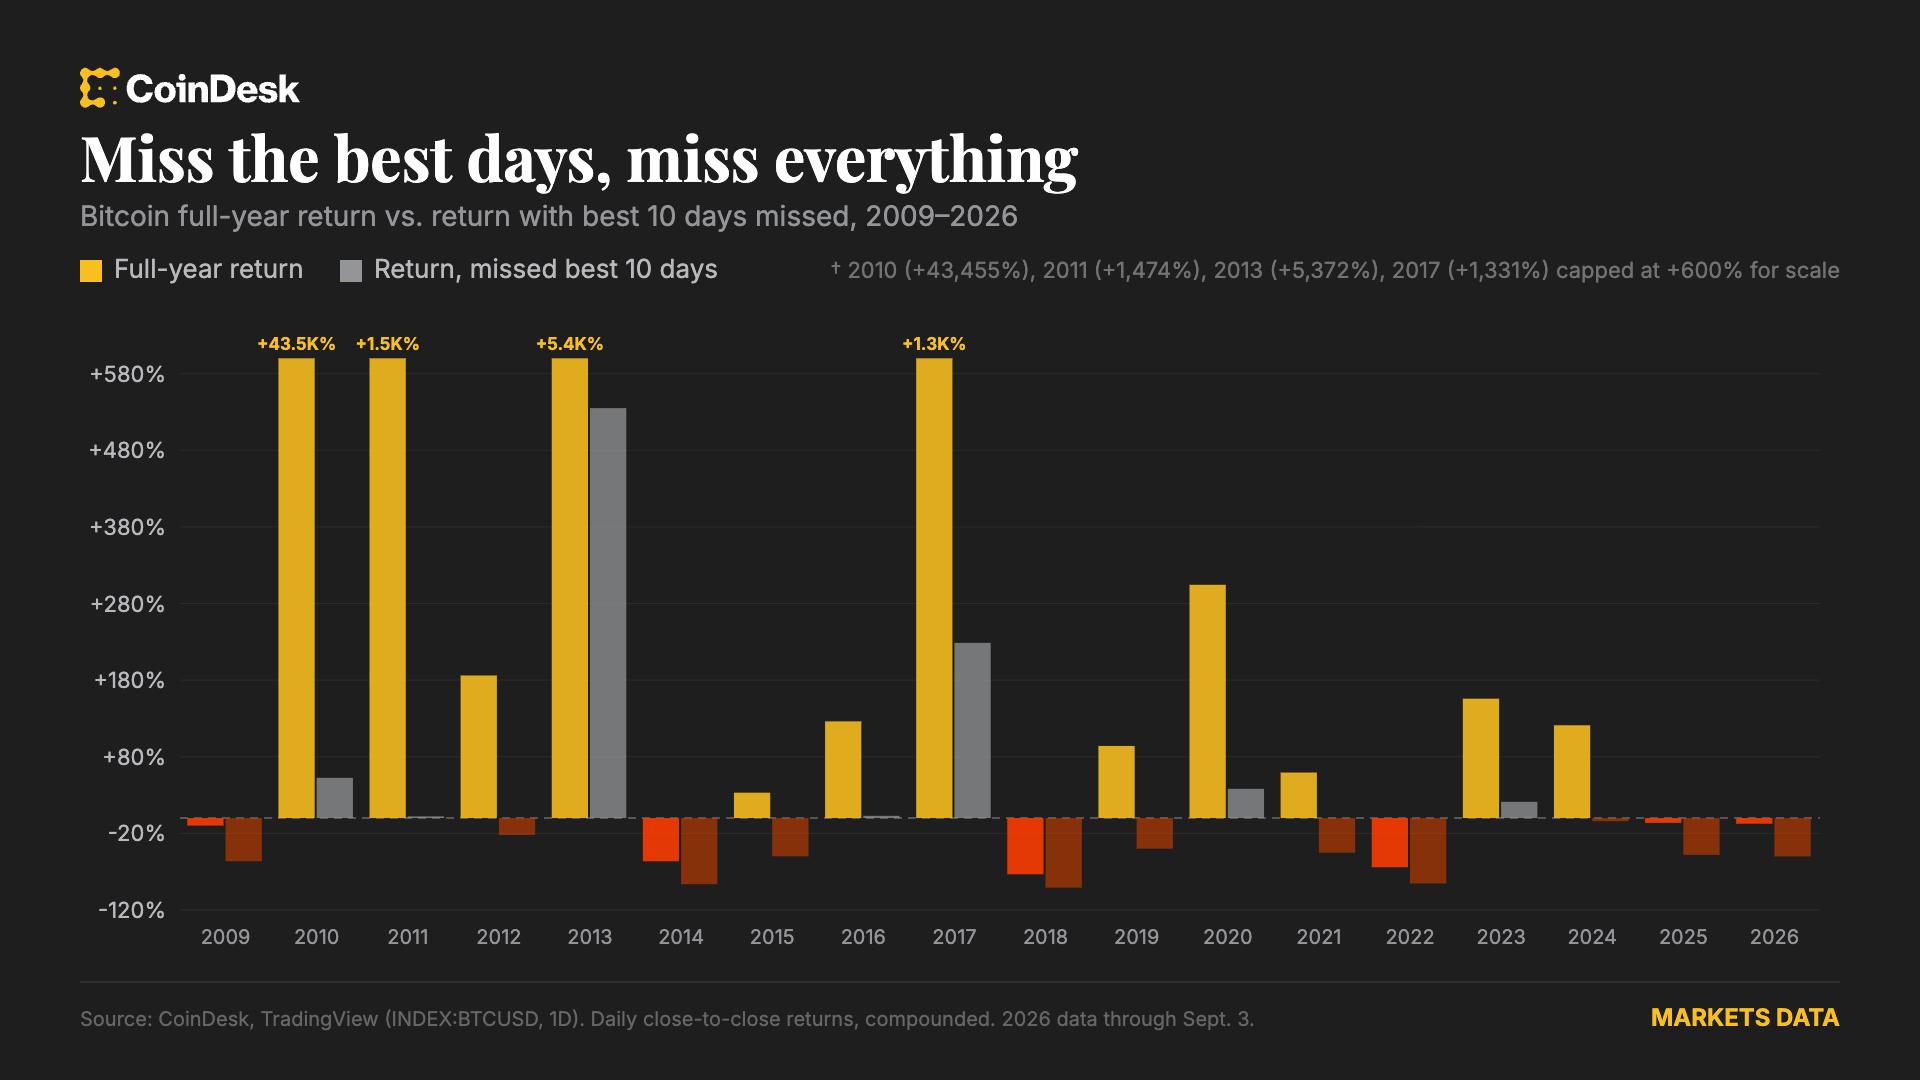
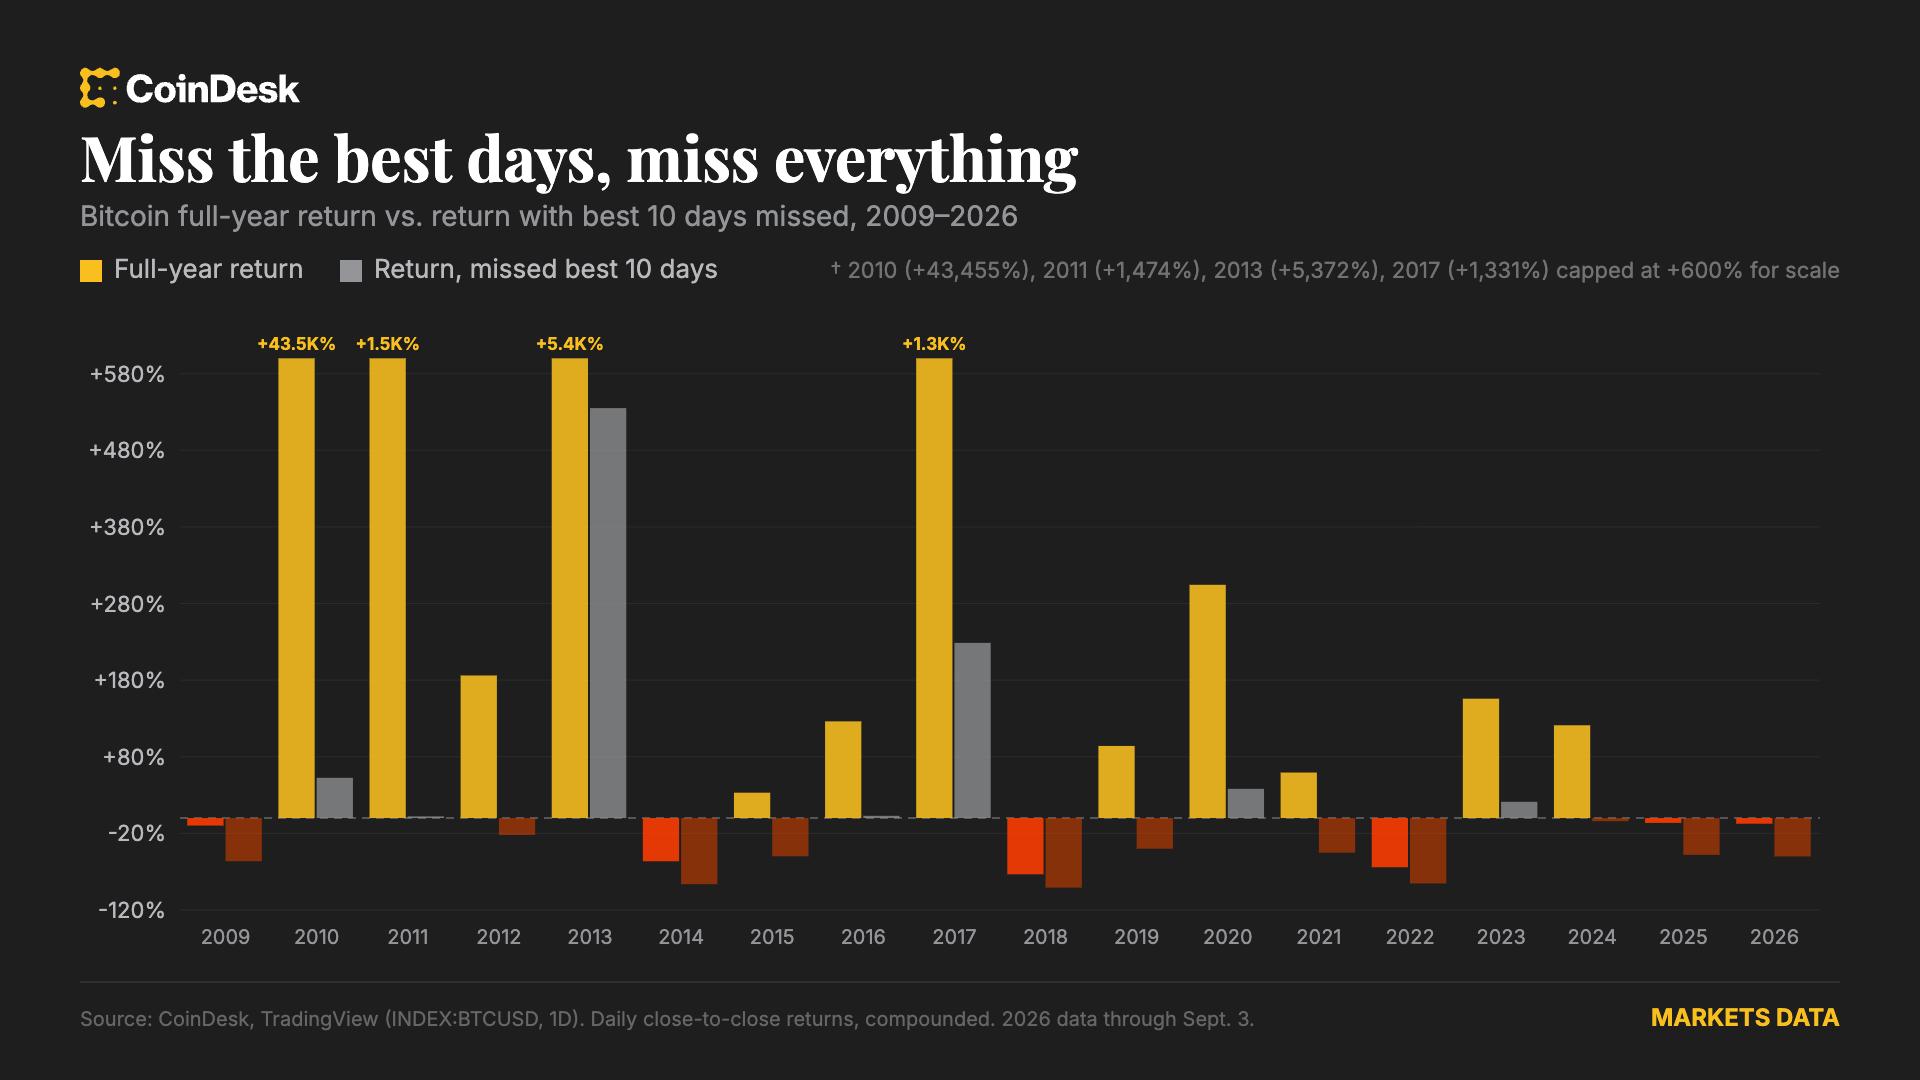
A historical analysis of bitcoin price performance from 2010 through 2026 demonstrates that the vast majority of the asset’s annual returns occur during a tiny fraction of the calendar year.
Polygon CEO Marc Boiron says staff time off pains him. His post on X split the crypto industry within hours.
The Polygon Labs boss admitted he prefers speed over rest. Critics called that a fiat mindset, so Boiron answered with a lesson about Bitcoin culture.
Polygon CEO Triggers a Fast Community Backlash
Boiron wrote that he feels torn whenever staff step away from work. He genuinely wants people to relax with their families. However, he cannot stomach the thought of a rival moving faster.
He wrote that time off “pains me so much” and conceded that he struggles to admit the preference. In the end, he prefers the pace over the pause.
The timing sharpened the reaction. Polygon Labs cut nearly 30% of its workforce in January. Then the company trimmed staff again in July while it pivoted toward stablecoin payments.
Both cuts followed a wider industry pivot toward revenue. Many readers therefore judged the post through that lens.
A Bitcoin supporter on X dismissed the stance as a fiat mindset. He also labeled Boiron a shitcoiner and told him to weigh what actually holds value.
Why He Answered With a Bitcoin Lesson
Boiron pushed back with a credential check. He said he worked as an investor, adviser and early lawyer for companies that Bitcoin maximalists admire. He also argued that he knows those founders better than his critics do.
“Before being a ‘shitcoiner’, I’ve been an investor, advisor and early lawyer for some of the most bitcoin maxi companies that bitcoiners love… They understand that bitcoin gets more valuable with time so getting more of it is actually more difficult with time,” Marc Boiron, CEO of Polygon Labs, on X
His argument rests on scarcity. Bitcoiners guard every coin, because each one gets harder to obtain over time. Therefore, he says, they maximize the hours they spend working on Bitcoin.
That reading of the culture remains contested. Maximalists split openly this year over Saylor’s first BTC sale, which exposed real disagreement on strategy.

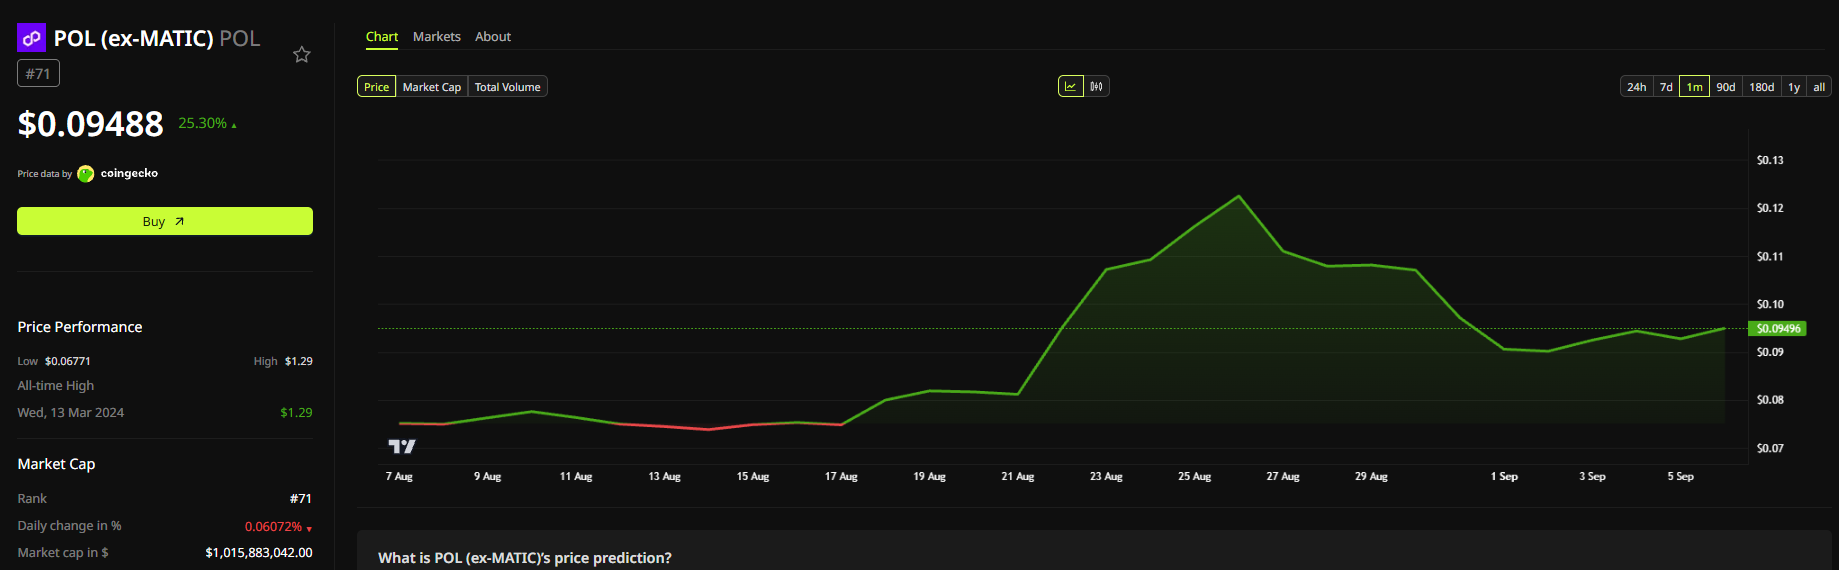
Polygon itself has momentum to protect. POL, the native token of the network, trades near $0.095 and ranks 71st by market value. Its market cap sits just above $1 billion.
The token has added roughly 25% over the past month. However, the rally stalled after a peak near $0.125 in late August, and POL has drifted sideways since then.
Boiron shows no sign of softening either message. The harder question now sits inside Polygon Labs, not on X. Staff there decide whether the exchange reads as candor or as pressure.
The post Polygon CEO Triggers Crypto Community With Vacation Take and Schools Critics appeared first on BeInCrypto.
In its 250th year, America finds itself confronting an age-old question with new urgency: what, exactly, counts as progress? 1776 was a hinge year for the modern world. Adam Smith published The Wealth of Nations, America adopted the Declaration of Independence, and Matthew Boulton and James Watt commercialized the steam engine—three developments that unleashed an age of capitalism, bringing unprecedented growth and unprecedented inequality.
And while growth and inequality are often treated as separate stories, fetishized respectively by the right and the left, corporate America and labor unions, and Wall Street and Main Street, this November’s midterm elections will put them on a collision course. But they have always gone hand in hand, their fates inextricably intertwined.
America’s triumphs are real. The United States is still the world’s largest economy. It remains a global engine of innovation. Its stock market is booming thanks to artificial intelligence, while its capital markets remain the deepest and most powerful in the world. And despite tariffs, a labor market slowed by restrictive immigration and repeated energy price shocks, its growth—as attested to by its $32.3 trillion GDP, larger than China, India, and Germany combined—appears to defy the odds and remains resilient.
Yet this dynamism is only half the story. Affordability has become the defining issue of the moment, and many signs indicate that the midterms in November will be decided on that basis. The Pew Research Center has found that the voters place the economy front and center by a wide margin, even as only 24% of Americans describe it as “good” or “excellent.” Gallup, meanwhile, reports that voters identify the cost of living as their foremost concern in the election.
GDP, the single statistic that now determines a country’s economic might, traces its roots to the scholarship of the American economist Simon Kuznets during the Great Depression, particularly his landmark 1934 report, National Income, 1929-1932. But as the Cambridge economist Diane Coyle points out, Kuznets was, himself, aware of the many flaws and pitfalls of the metric he had developed and warned against confusing economic output with human welfare.
What even fewer people know is that the “godfather” of GDP was also a pioneer in the study of inequality. The Kuznets curve—his famous prediction that inequality would eventually decline as economies grew richer—is not one history has obliged, but it points to the Janus-headed quality of modern capitalism.
Indeed, it’s been exactly 15 years since the Occupy Wall Street protests radiated out of Zuccotti Park in New York’s Financial District. Born in the aftermath of the Great Recession of 2008, the movement became the most visible public outcry against economic inequality in recent American history and gave the country an enduring rallying cry: “We are the 99%.”
While the movement dissipated, the issues it raised have not. If anything, the concerns it foregrounded have migrated from the political margins to the mainstream in American politics, championed by progressive figures like Bernie Sanders, Alexandria Ocasio-Cortez, and Zohran Mamdani.
The World Inequality Report 2026 finds that the top 0.001% of the globe’s population own “three times more wealth” than the entire bottom half of humanity combined, and within “almost every region, the top 1% alone” hold more wealth than the bottom 90% combined. Inequality in America is no longer only a question of who has more; increasingly, it is a question of who has enough to make ends meet. According to the Brookings Institution, 45.5% of American households do not earn enough to cover even basic necessities, with housing, health care, and childcare among the most acute pressures.
The problem is that a single statistic can conceal as much as it reveals. GDP can tell us how the economy is performing without telling us how Americans are faring. It can tell us how much an economy produces, but not who receives the rewards, whether those gains improve people’s lives, or what is destroyed and what is sacrificed in producing them.
Some of the things on which society most depends—unpaid caregiving, clean air, cohesive communities—barely register in its accounts. Economists classify many of these costs as “externalities”: consequences borne by people and places that fall outside the transaction being measured.
Climate change provides perhaps the starkest example of GDP’s glaring blind spots. A natural disaster can destroy homes, lives, and ecosystems without being registered as an equivalent loss in GDP; the money spent to rebuild afterward, meanwhile, counts as additional economic activity. The meter can rise even as human welfare falls.
But the two metrics—GDP, our shorthand for growth, and the Gini coefficient, our shorthand for inequality—are not rival ways of describing the economy so much as incomplete halves of the same story; the two key consequences of capitalism, joined at the hip. One shows us how large the pie has grown; the other, something about how it has been sliced.
On growth and inequality
When it comes to growing the pie, the relentless efficiency of global capitalism in allocating resources is hard to match. It has allowed, in the aggregate, societies to eke out more from finite resources than ever before. Its advocates point out that most people live longer and better lives: they are better fed, more securely housed, and better protected against diseases that once routinely killed them.
Capitalism’s champions can reasonably claim that it has helped lift much of humanity above bare subsistence while proving more compatible with individual freedom than its major rivals. It holds out the promise of a game that everyone has an equal chance to play—and win. Its defenders often invoke the specter of repression and unfreedom associated with state-led communism or socialism as a cautionary tale.
Capitalism’s unique two-plus-two-equals-five quality—its capacity to produce more than the sum of its parts—may also have helped pave the way for the material foundations of modernity. The shift from sustenance to surplus created, in many ways, the foundations for our moral revolutions, from liberalism and feminism to cosmopolitanism.
Yet, beyond some vague gestures toward “trickle-down economics,” the discipline’s approach has largely been to focus on growing the pie and argue about slicing it later. Economics has tried to separate the two: markets create wealth; politics distributes it. Friedrich von Hayek, the Nobel Prize-winning economist, who was an early and influential proponent of free-market economics, warned against the “fatal conceit” that governments could know enough to design an economic order from above.
The Kaldor–Hicks principle, a dominant idea in modern economics, offered a technical basis for avoiding the reckoning with distributive questions. An outcome counts as an improvement if the winners gain enough that they could compensate the losers—even if they never do. That “even if” is a significant caveat.
Kenneth Arrow’s Impossibility Theorem, another foundational result in economics, exposes the deeper difficulty: there is no perfect mathematical procedure for turning individual preferences into a coherent collective choice. At some point, as even mainstream economists recognize, economic calculation must give way to political judgment. It follows that morality should trump mathematics.
But what if inequality is baked into the pie itself? Thomas Piketty coined the famous formulation for the notion that the odds may be stacked against the ordinary person: r > g, the proposition that the return on capital tends to exceed the rate of economic growth. History suggests that the playing field was never level.
In Empire of Cotton and, now, Capitalism, Sven Beckert excavates the blood-soaked origins of modern capitalism through slavery, colonialism, and state power; Ha-Joon Chang shows how rich countries used tariffs and industrial policy before prescribing freer markets to poorer ones. Such empirical evidence reinforces a broader idea: markets do not simply materialize, as the spectral metaphor of the “invisible hand” suggests. Markets are made—by human hands.
If the economy is a game, then the question is not merely who wins and who loses. The question instead is: Who designed the board, who wrote the rules, and whether the game was rigged from the start? Today, capitalism treats Monopoly money as real while human beings are reduced to pieces on a chessboard.
Perhaps the most important omission from the current economic paradigm concerns the psychology of the sport. Research on “inequality aversion,” the idea that who gets what matters as much as how much there is, suggests that people care deeply about how the pie is sliced, even when a fairer division means settling for a slightly smaller one.
The economics of the everyman
Can growth, given enough time, deliver widely shared prosperity, as capitalism’s champions still insist? Or does the way the game is designed predetermine who benefits from growth? Far from disappearing, could excessive inequality gnaw away at the very foundations of economic growth?
GDP’s shortcomings have inspired repeated attempts to devise a better answer. In Mismeasuring Our Lives, Joseph Stiglitz, Amartya Sen, and Jean-Paul Fitoussi argued for moving beyond economic production and measuring well-being, distribution, and sustainability. Sen’s capabilities approach asks a still more fundamental question: not merely what resources people possess, but what those resources actually enable them to be and to do.
The late Pakistani economist Mahbub ul Haq’s Human Development Index, inspired in part by Sen’s work, was an attempt to translate that insight into numbers, treating health, education, and income as measures of human progress.
The point is not to dispense with GDP. Growth matters enormously. It has financed scientific discovery, lengthened lives, reduced material deprivation, and expanded the range of human possibility. But human progress may be better represented by a dashboard of indicators rather than by a single number. More fundamentally, what should be a means to an end has too often become an end in itself. A metric intended to crudely measure the output of the market economy has gradually acquired the authority to tell us whether society itself is succeeding.
America’s 250th anniversary offers an unusually apt moment to question that bargain. The Declaration of Independence did not promise Americans the pursuit of economic growth. It promised something considerably more ambitious: the pursuit of happiness. Two and a half centuries later, perhaps the most important economic question America can ask is also the simplest: Who is the economy for?
Fittingly, this fall, American voters will have an opportunity to offer their answer. If the elections of the past decade were won in part by rejecting an outdated economic playbook, 2026 may present a more constructive opportunity: not merely to discard the economic playbook, but to redesign and rewrite it with Everyman, the ordinary American, as its protagonist.
Adapted with permission from Everyman: The Untold Story of Economics by Antara Haldar.
CryptoQuant data shows that bitcoin investors started realizing major profits after the explosive August rally, disposing of roughly 110,000 BTC in just a few weeks.
Such highly concentrated profit-taking developments have historically been followed by substantial price correction for the underlying asset, the analysts warned. Moreover, several demand indicators have weakened, which could add to the selling pressure.
110K BTC Profit Taken
The major run that began on August 19 at prices of under $65,000 drove the leading cryptocurrency to almost $80,000 in just two days. According to CQ’s latest weekly report, holders realized net profits of 23,000 BTC on that day alone (August 21), which became the largest single-day profit realization this year.
The asset indeed dipped in the following days as it felt almost inevitable after such a gigantic jump, but went on the offensive once again in the following week or so. It rocketed past $82,000 on Friday before it was rejected following the US jobs report, and now sits below $80,000.
The report described the major profit-taking as a classic characteristic of a bullish cooldown, but warned that if they continue at such a rapid pace, the asset’s price could be primed for another correction. Historical occurrences have shown that BTC tends to dump hard after a major rally if investors are not convinced about its potential.
“It is a hallmark of a bullish cooldown: bullish because it happens into strength, cautionary because concentrated realization can cap near-term upside,” reads the report.

Cooling Demand
CryptoQuant outlined another reason why BTC could be primed for a more profound correction, even though it already slipped from $82,400 to $79,600. Its apparent spot demand briefly expanded by 43,000 units, marking its fastest growth pace of the year. However, that metric has lost its momentum and is now back in contraction.
US investors’ demand has weakened as well. The most used metric for this, the Coinbase Premium, measuring the price difference between the asset on the leading US exchange and other trading platforms, has returned to slightly negative territory at -0.05.
The analysts said similar periods of soft US spot demand have capped the cryptocurrency’s rallies three other times this year alone.
Nevertheless, the short-term picture does not necessarily mean that BTC’s run is over and that it will return to a bearish phase. The Bull Score currently stands at 70, which is above the 60 threshold historically associated with sustainable bull markets.
” This keeps the broader picture constructive: Bitcoin remains in the early phase of a new bull market even as short-term momentum cools. The “official” bull market begins once price closes above its 365-day moving average,” they added, outlining that this key MA is located at around $83,000 – the level that stopped BTC in May.
The post Bitcoin Holders Just Cashed Out 110,000 BTC in Profits: Is a Bigger Price Drop Coming? appeared first on CryptoPotato.


Buying pressure in Binance-paired currencies correlates with local currency depreciation as market makers balance positions.
Bitcoin remains locked in a post-breakout consolidation phase, but the latest rejection from the upper end of the structure shows that buyers are still struggling to generate sustained momentum above $80K. The broader trend remains constructive, although the current range leaves BTC vulnerable to further liquidity-driven swings before its next directional move.
Bitcoin Price Analysis: The Daily Chart
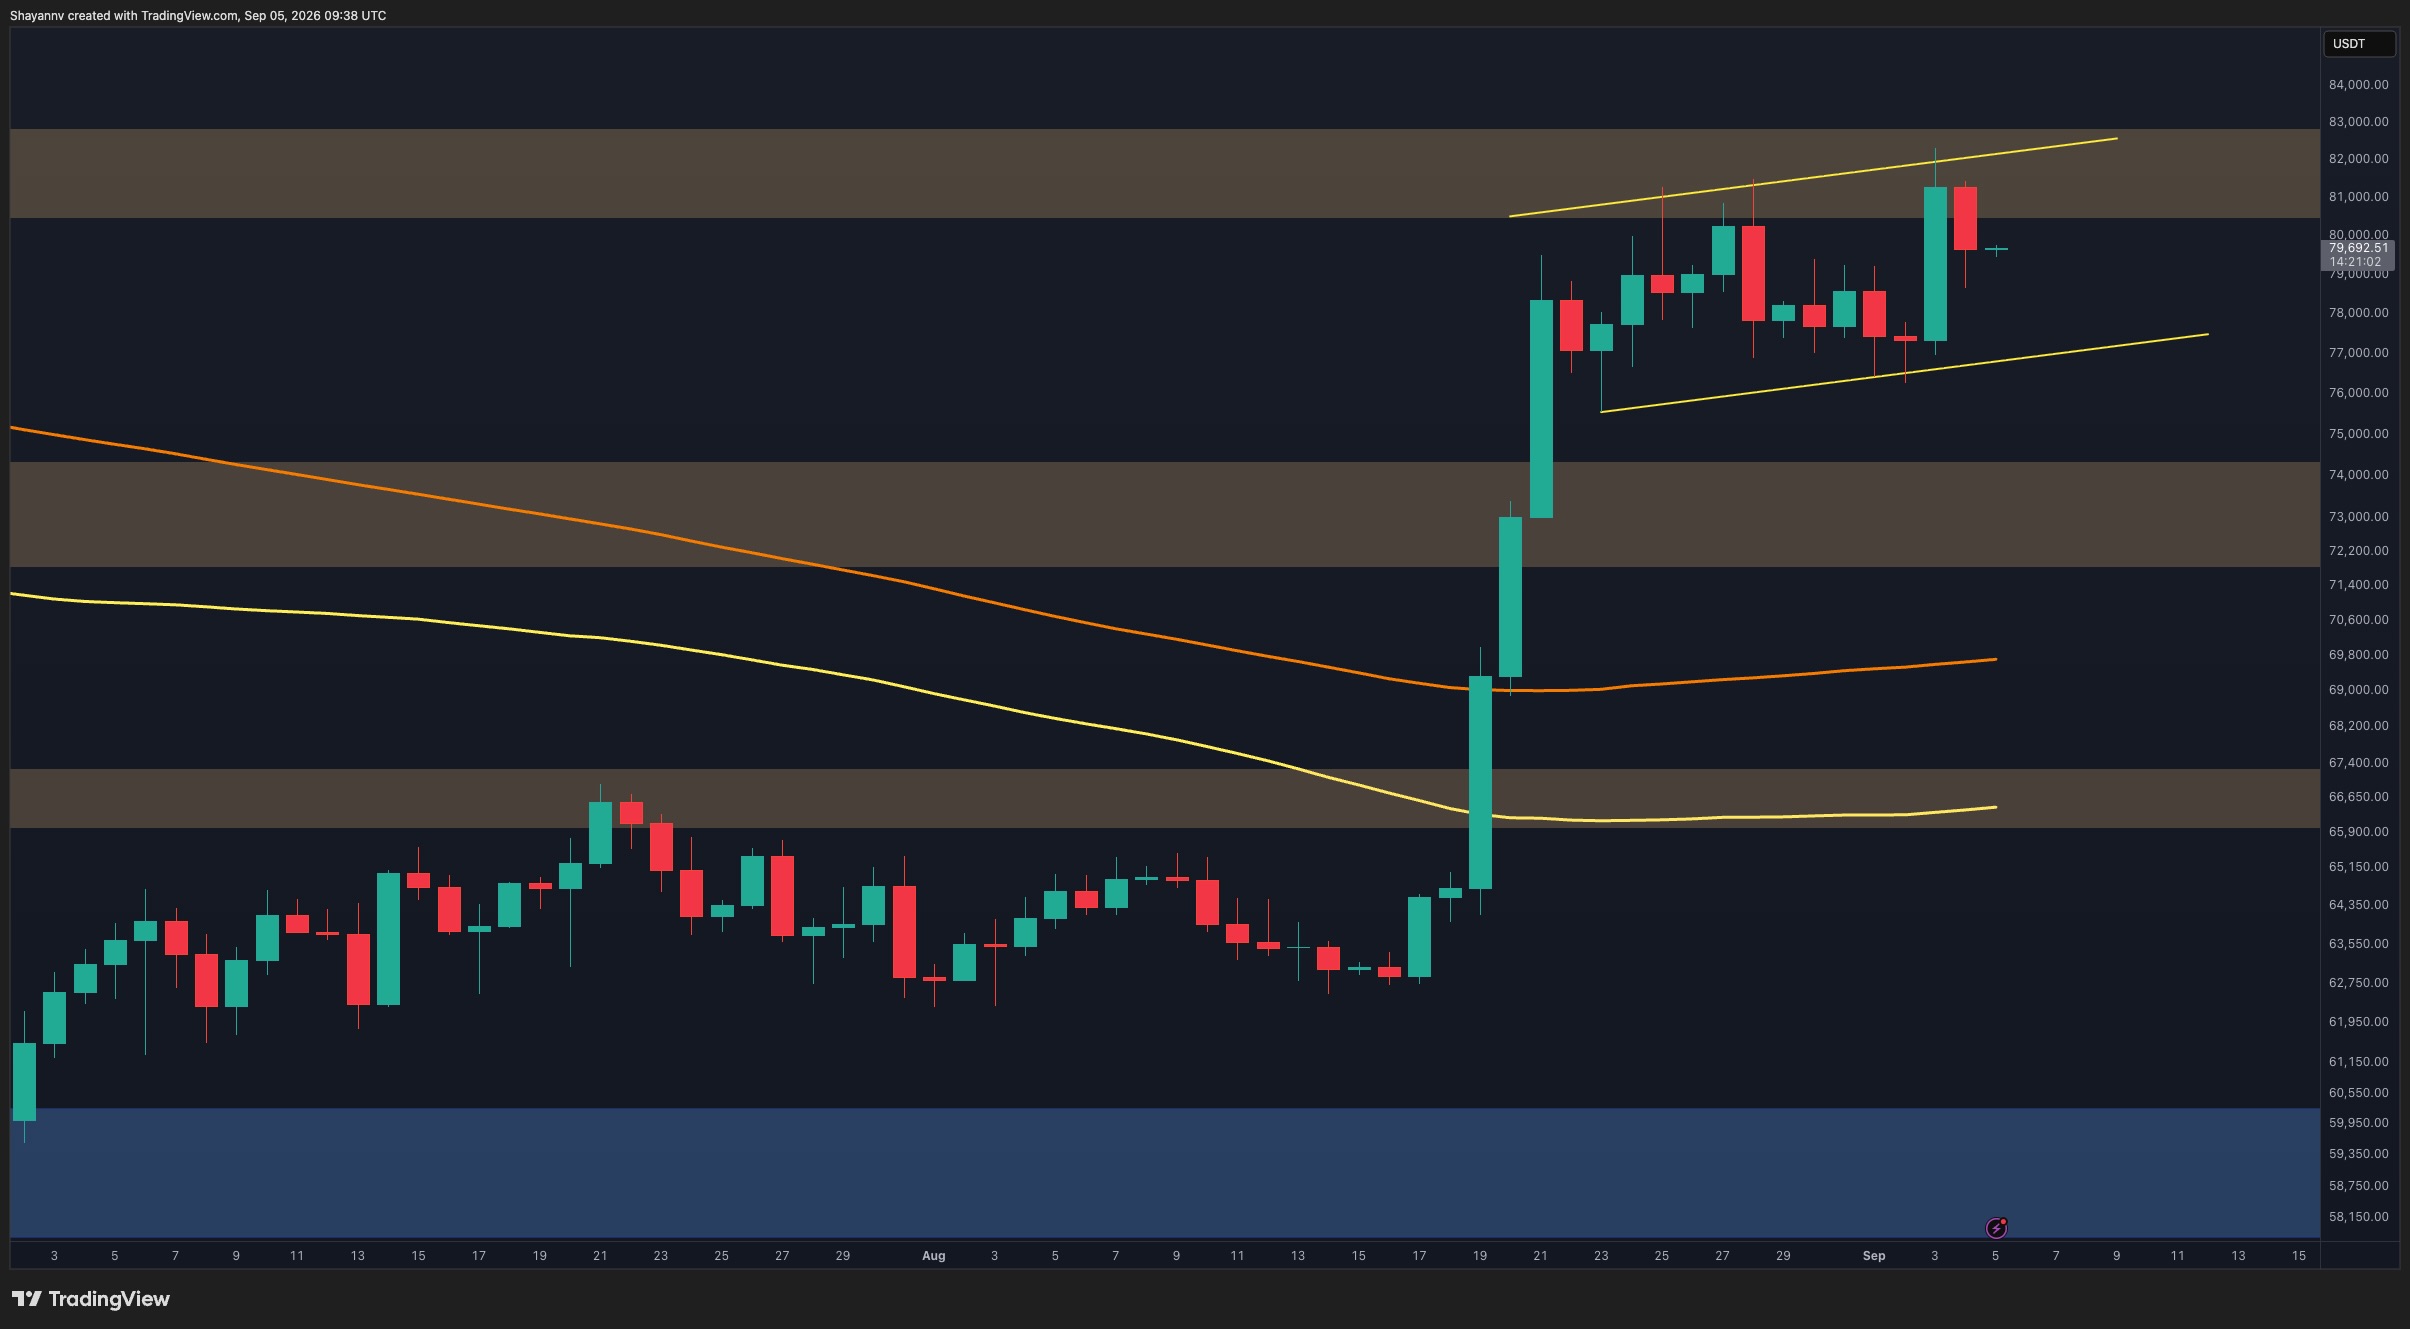
Bitcoin’s daily structure remains significantly stronger than it was before the August breakout. The asset is holding well above the former $72K-$74.5K resistance zone and both moving averages, preserving the broader bullish shift despite the recent loss of momentum.
However, BTC has repeatedly encountered selling pressure inside the $80.5K-$82.5K resistance zone. The latest attempt briefly pushed toward $82K before being rejected, sending the price back below $80K. This inability to establish acceptance above the resistance area suggests that supply remains active at higher prices.
At the same time, the asset continues to trade within a gradually ascending channel. Its lower boundary currently sits around the $76K-$77K region, making this the most important nearby structural support. As long as BTC remains above this area, the ongoing price action can still be interpreted as consolidation following the sharp rally rather than a confirmed bearish reversal.
A decisive breakout above the $80.5K-$82.5K zone would strengthen the continuation scenario. Conversely, losing the channel support around $76K-$77K could trigger a more substantial correction, with the former $72K-$74.5K breakout zone becoming the next major area of interest.
BTC/USDT 4-Hour Chart
The 4-hour chart highlights the market’s current indecision more clearly. BTC rallied from the lower boundary of the ascending structure near $76.5K-$77K and quickly tested the $81K-$82K area, only for sellers to reject the move once again.
Price subsequently dropped toward $79.5K and has entered a tight short-term consolidation. This creates a notable contrast between the rising channel structure and the repeated failures near its upper boundary. Buyers are still defending higher lows, but they have yet to demonstrate enough momentum to convert the $80.5K-$82.5K supply area into support.
The $76.5K-$77.5K region therefore remains crucial. Another test of this zone could determine whether the ascending structure survives. A strong reaction would keep a renewed push toward $81K-$82K in play, whereas a breakdown would indicate that the consolidation is transitioning into a deeper corrective phase.

Sentiment Analysis
The one-week BTC liquidation heatmap shows substantial liquidity on both sides of the current price, which supports the possibility of continued choppy trading and liquidity sweeps.
Above the market, notable liquidation concentrations appear around $81K-$82K and extend toward approximately $84K. These clusters could attract price if buyers regain momentum.
However, the downside liquidity is particularly relevant following the latest rejection. A broad and comparatively dense concentration is visible below the market, especially around the $76K-$78K region. This aligns closely with the lower boundary of the ascending technical structure.
As a result, a downside liquidity sweep toward $76K-$78K remains a plausible near-term scenario before another recovery attempt. Such a move would not automatically invalidate the broader bullish setup, but a sustained breakdown beneath this region would increase the probability of a deeper retracement toward the $72K-$74.5K support zone.

The post Bitcoin Price Analysis: The Good and the Bad for BTC After Latest $82.4K Rejection appeared first on CryptoPotato.

Chainlink’s LINK token has climbed nearly 50% over the past month, with the latest rally pushing its price above $12 as partnerships with financial institutions and U.S. government entities strengthens the market’s focus on the network’s role in traditional finance.
LINK gained about 8% in 24 hours on September 4, bringing its market capitalization to roughly $9 billion and placing it among the largest crypto assets by market value. The move has coincided with a broader crypto recovery but has also been supported by several developments involving Chainlink’s infrastructure.
Key Takeaways
- LINK has gained nearly 50% in one month and recently moved above $12.
- Chainlink partnered with Bottomline, which serves more than 600 banks and processes over $16 trillion in annual payments.
- The U.S. Department of Commerce is using Chainlink infrastructure to bring selected economic data onchain.
- Wyoming has expanded its use of Chainlink for its state-issued stablecoin, while Standard Chartered sees LINK reaching $200 by 2030.
Chainlink Expands Its Connection To Banking Infrastructure
On September 3, when Chainlink announced a strategic partnership with Bottomline, a major provider of payment technology used by hundreds of banks, the news added momentum.
Bottomline’s platforms reportedly process more than $16 trillion in payments each year and serve over 600 banks.
Through the agreement, Chainlink will provide an interoperability layer designed to connect existing payment systems with both public and private blockchains.
Notably, the integration is intended to allow financial institutions to use ISO 20022 messages to interact with blockchain-based payment infrastructure without having to build separate connections for individual networks.
The development adds to Chainlink’s growing involvement in financial infrastructure as banks and other institutions explore blockchain-based settlement and tokenized assets.
“Bottomline moves more than $16 trillion in payments annually across its platforms. Through the partnership, Chainlink is providing the secure interop and orchestration layer connecting Bottomline’s existing payment infrastructure to public and private blockchains.” Chainlink tweeted.
U.S. Government Data Moves Toward The Blockchain
Chainlink has also gained exposure to a U.S. government initiative. On September 1, the project announced that the Department of Commerce would use its infrastructure to make selected economic data available onchain.
The data includes real gross domestic product, the personal consumption expenditures price index and actual final sales to domestic private domestic buyers.
The initiative could allow blockchain applications connected to Chainlink’s infrastructure to access updated government economic data, creating another potential use case for decentralized data delivery.
Wyoming Deepens Chainlink Stablecoin Integration

Fidelity Digital Assets has cautioned that Bitcoin’s strong August performance does not necessarily mean the cryptocurrency’s broader bear market has ended. While the latest rally has improved market conditions, the firm said investors should still consider the possibility of another market bottom later this year.
Bitcoin posted its strongest monthly gain since late 2024 during August, while Ethereum and other major cryptocurrencies also recorded substantial advances. The move has led some investors to argue that the market may have already established a bottom.
Key Takeaways
- Fidelity said Bitcoin’s bear market may not be over despite its strong August recovery.
- The four-year cycle model places potential attention on November 2026, although Fidelity stressed that the pattern is not a reliable timing tool.
- Bitcoin gained more than 25% during the third week of August, while Ethereum and Solana rose 34.1% and 28%, respectively.
- Growing stablecoin activity, real-world asset adoption, institutional participation, and regulatory developments could support a broader recovery.
Four-Year Cycle Keeps November in Focus
Fidelity’s latest digital asset outlook points to Bitcoin’s historical market cycles as one reason investors remain cautious.
Bitcoin’s previous major bear market bottom occurred in November 2022. If the roughly four-year pattern were to repeat, another potential bottom could emerge around November 2026.
However, Fidelity emphasized that investors should not treat the cycle as a precise forecasting model. Bitcoin’s historical cycles have not consistently lasted exactly four years, meaning the market could have already bottomed in July or could experience another decline later in the year.
Chris Kuiper, vice president of research at Fidelity Digital Assets, said the broader significance of the cycle may be connected to how cryptocurrency adoption develops.
“The more important point for investors is that adoption of digital assets has happened in waves, which can perpetuate cycles. In light of this, having a long-term perspective and holding period is what has historically been the most beneficial for investors.” He noted.
August Rally Provides Evidence of a Possible Shift
Fidelity also identified several developments that could support the argument that the market is moving away from its bearish phase.
Bitcoin spent much of the third quarter in relatively subdued trading before volatility increased sharply in late August. During the third week alone, Bitcoin rose more than 25%, while Ethereum gained 34.1% and Solana advanced 28%.
According to Fidelity, previous Bitcoin bear markets have sometimes ended after a period of subdued volatility followed by a sharp expansion in price activity.
Kuiper said the period from June through mid-August showed signs that selling pressure had weakened and that several digital assets were trading toward the lower end of their historical valuation ranges.
The subsequent price expansion therefore represents one factor that could indicate the market is approaching a turning point. Fidelity, however, stopped short of treating the rally as confirmation of a new bull market.
Esewhere, crypto analyst Darkfost described Bitcoin as being at a “tipping point between a genuine bullish recovery and a continuation of the correction.”
According to the analyst, futures activity is currently helping drive market movements while spot demand has declined. Darkfost said speculation can produce short-term price movements, but sustained momentum would require stronger spot buying to develop alongside derivatives activity.
“The balance remains and still leans towards buyers. But the question is, what type of buyers are driving the market? Speculation can trigger movement, but for momentum to become sustainable, spot demand must synchronize,” the analyst noted.
Regulation and Institutional Demand Remain Important
Fidelity identified regulatory progress, institutional adoption, monetary policy, and new cryptocurrency use cases as potential factors that could influence the next phase of the market.
In the United States, attention remains focused on the CLARITY Act, which seeks to establish clearer regulatory responsibilities for digital assets. The legislation has passed the House and remains under consideration in the Senate.
The SEC has also proposed a new regulatory framework that could provide exemptions from securities registration requirements for certain early-stage crypto asset offerings. The proposal remains subject to public comment.
What to Watch Next
Bitcoin’s August recovery has improved the market’s outlook, but Fidelity’s assessment suggests that investors should not assume the bear market is definitively over.
The next phase will depend on whether higher prices are supported by sustained adoption, institutional participation, and spot market demand rather than short-term volatility alone.
For now, November remains a date watched by investors following the four-year cycle thesis, while Fidelity continues to stress that historical patterns should not be used as a precise method for timing Bitcoin’s market bottom.
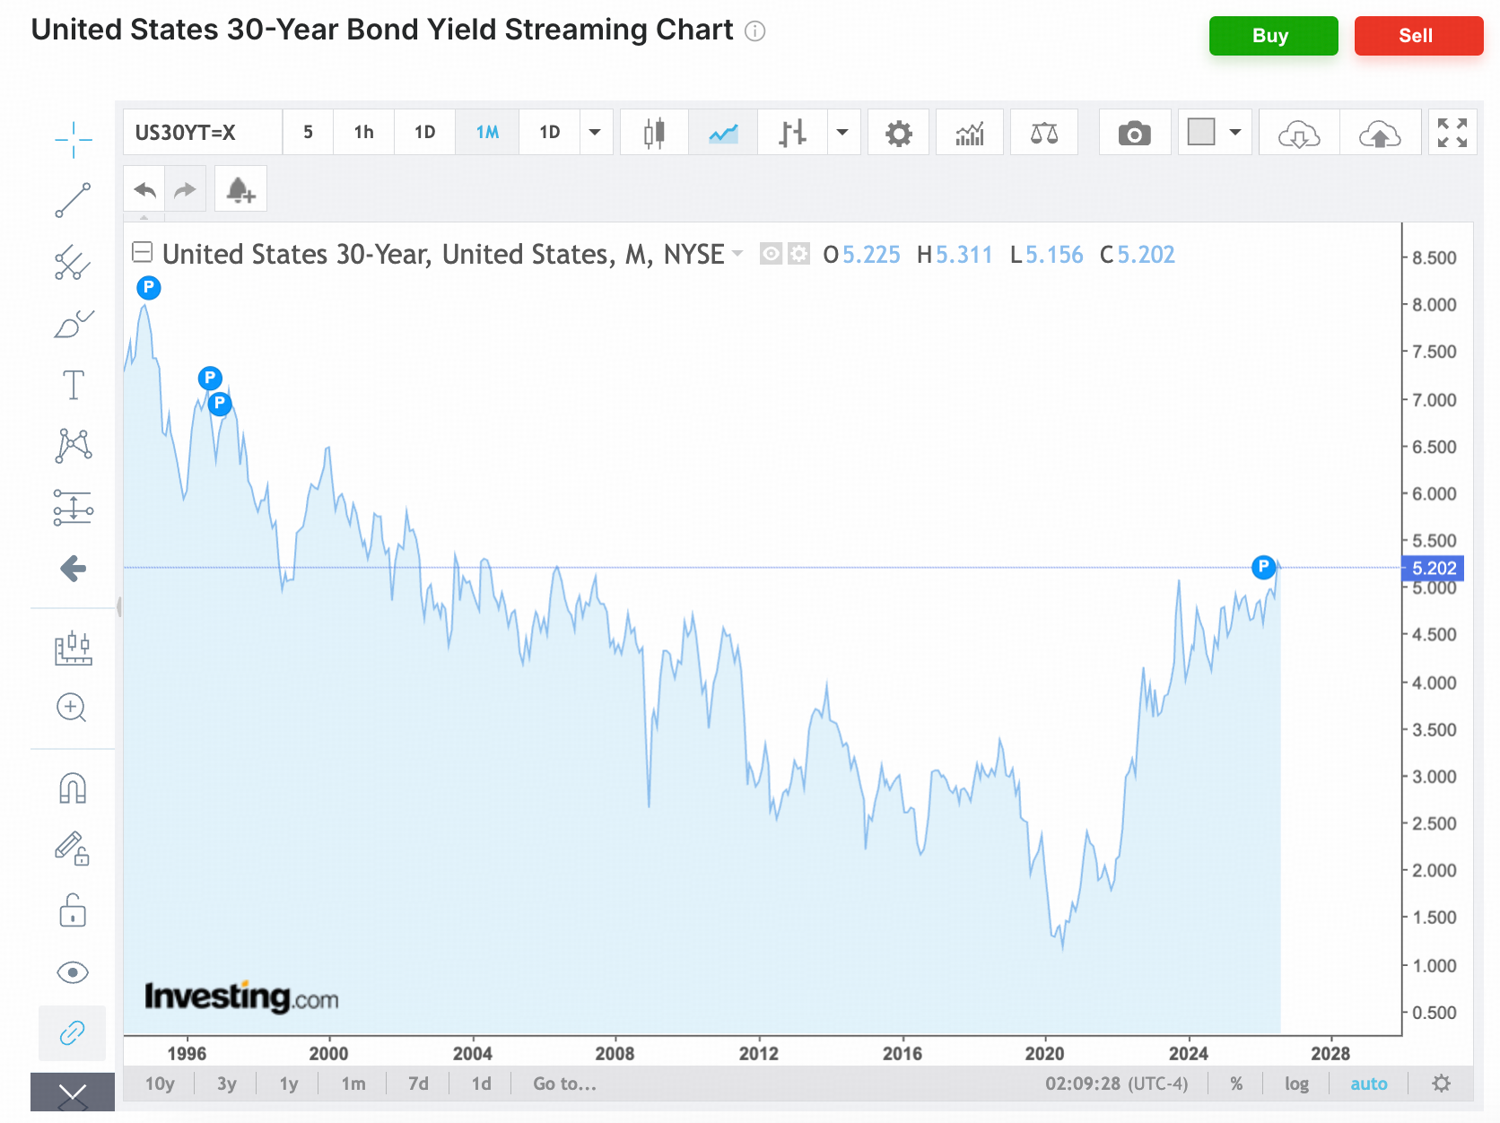
US federal debt has crossed $40 trillion. The government is still running a deficit close to 6% of GDP. Long-term borrowing costs remain high. Yet Bitcoin is trading near $80,000, roughly 37% below its record high from last year.
That creates an awkward question for one of Bitcoin’s oldest macro narratives. If rising debt and weaker fiat money are supposed to make scarce assets more valuable, why has Bitcoin spent much of 2026 falling?
Analysts at BloFin argue that it’s about how the debasement trade is changing. Its latest report finds that the trade has entered a “second phase.” Investors are now watching government attempts to control borrowing costs as closely as money creation itself.
The Trade Broke Before It Came Back
The debasement trade rests on a simple idea. Large fiscal deficits eventually create pressure for easier monetary policy because governments cannot allow borrowing costs to rise forever.
Investors then move toward scarce assets such as gold and Bitcoin.
That thesis weakened in early 2026. Bitcoin fell below $62,000, while gold and silver also dropped sharply from their highs.
BloFin links much of that unwind to the nomination of Kevin Warsh as Federal Reserve chair. Markets viewed Warsh as less likely to use aggressive balance-sheet expansion to absorb fiscal pressure.
The trade depends heavily on expectations. Investors still saw huge deficits, but the path toward easier monetary policy looked less certain.
Then the Bond Market Started Making Noise
The picture changed in August. On August 18, the 30-year US Treasury yield reached its highest level since 2007.
One day later, the Treasury said it would at least double the maximum size of liquidity-support buybacks in some 10-to-30-year bonds, from $2 billion to at least $4 billion per operation.

Bitcoin rose about 25% in August. Gold gained around 15%.
The timing is actually critical. Expanding buybacks immediately after a surge in long-term yields suggested policymakers may be becoming less willing to tolerate higher borrowing costs.

Treasury Buybacks Are Not QE
The Treasury cannot print money. It has to fund buybacks through cash, tax receipts, or new borrowing. That makes the mechanism very different from Federal Reserve quantitative easing.
Under QE, the Fed creates reserves and buys government debt. Treasury buybacks mostly change the composition of government liabilities.
Still, BloFin argues that markets may care more about the direction of policy than the immediate liquidity effect. As the research puts it: “Treasury buybacks are not QE.”
If investors believe rising long-term yields will repeatedly trigger intervention, they may begin pricing an informal limit on borrowing costs.
That is where financial repression enters the story.
Bitcoin Still Has a Real-Yield Problem
The current data shows why the debasement trade remains incomplete.
US public debt is around 101% of GDP, while the 2026 deficit is projected near $1.9 trillion. M2 has also returned to growth.
At the same time, 10-year real Treasury yields remain around 2.4%.
That is a major obstacle for Bitcoin. Investors can still earn a strong inflation-adjusted return from government bonds without taking crypto risk.
It also helps explain why Bitcoin’s 2026 price action still resembles a traditional crypto cycle.
Bitcoin peaked roughly 534 days after the April 2024 halving, close to the timing of the 2017 and 2021 cycle highs. It then fell by more than half before recovering.
The old four-year cycle still works.
The Next Test Is Whether Policy Starts Bending
BloFin’s thesis becomes much stronger if real yields start falling while fiscal pressure remains high.
That could happen if long-term borrowing costs keep creating stress and policy responses become larger. A more aggressive version would involve the Fed eventually stepping in.
History offers a clear precedent. From 1942 to 1951, the Fed capped long-term Treasury yields at 2.5%, helping the government finance wartime debt while inflation later pushed real bond returns deeply negative.

Bitcoin does not need that exact scenario to benefit. It needs investors to believe governments will increasingly protect the debt market from its own borrowing costs.
For now, Bitcoin is caught between a traditional crypto cycle that explains much of its 2026 weakness and a worsening fiscal backdrop that is starting to push scarce assets higher again.
The debasement trade has not failed. The bigger question is whether August marked the point when it became harder to ignore.
The post US Debt Hit $40 Trillion. So Where Is Bitcoin’s Debasement Trade? appeared first on BeInCrypto.
Binance Coin is among the top performers in the past 24 hours in the altcoin space, surging by over 6% and further extending its lead above XRP in terms of market cap placement.
This impressive rally on a rather dull Saturday after the Friday market rejection came following some positive news from Kalshi and the overall growth of the BNB Chain.
BNB Pops
The native token of the broader Binance ecosystem traded at $725 yesterday amid the market-wide revival that drove BTC to $82,400. However, the subsequent retracement prompted by the strong US jobs report pushed it south to $710. The asset found solid support there and exploded out of the gate, surging to $770 minutes ago for the first time since early February.

This Saturday’s rally is quite unexpected since most of the market is still in the red following yesterday’s bad news for risk-on assets. As such, the reason for BNB’s defiance is likely coming from outside factors, such as Kalshi’s move to launch perpetual futures contracts for the asset in the US, regulated by the Commodity and Futures Trading Commission.
Leverage is capped at around 4.5x for eligible US traders and comes after the platform added support for other altcoins such as ADA, AAVE, WLD, and VVV. Kalshi also supports BNB Smart Chain (BSC) integrations for managing deposits and withdrawals on international accounts.
BNB Chain Growth
The other probable reason comes from a Grayscale report cited by Wu Blockchain. As explained, BNB Chain is among the most widely used networks for trading tokenized equities.
The paper reveals that the weekly spot volume peaked at almost $3 billion in August, while only 5% of the market is currently deployed in on-chain finance. Robinhood Chain leads the pack, followed by BNB Chain and Solana.
Grayscale explained that further US regulatory clarity could “expand tokenized stocks from global, around-the-clock trading products into productive on-chain financial assets.”
Grayscale: Tokenized Equity Weekly Spot Volume Nears $3B, Only 5% Used in Onchain Finance
Grayscale said tokenized equity trading reached record highs in August, with weekly spot volume peaking near $3 billion, while only about 5% of the market is currently deployed in onchain… pic.twitter.com/ZcVA72DYTX
— Wu Blockchain (@WuBlockchain) September 4, 2026
The post BNB Hits 7-Month High After Major Kalshi Move and Explosive Chain Growth appeared first on CryptoPotato.

Penélope Cruz’s Luxe-Looking Two-Toned Flats Style Is on Amazon

Taxi drivers could face new rules on older vehicles

Bristol Myers Squibb’s Breakout Is Here: Portfolio Renewal Gaining Momentum (NYSE:BMY)





-
 Crypto World1 day ago
Bitcoin price stalls near $82K as key resistance holds
-

 Politics1 day ago
Best Gaming Laptops, CPUs, TVs, And Keyboards To Upgrade Your Set Up For GTA VI
-

 Tech1 day ago
The Birds Outside, Drawn For You Automatically
-

 Crypto World1 day ago
IMF Says El Salvador’s Post-Review Bitcoin Purchases Used No Public Funds
-
 Crypto World1 day ago
U.S. added stronger than expected 162,000 jobs in August as labor market bounced back
-

 Fashion1 day ago
Weekend Open Thread: Beyond Yoga
-

 Sports1 day ago
Alexandre Pato consortium’s Northampton Town investment approved
-

 Sports1 day ago
Golden Eaglets Drawn in Group B for 2026 WAFU B U17 Championship
-

 Sports1 day ago
Commanders’ Chig Okonkwo is a top breakout fantasy football candidate
-
 Crypto World1 day ago
XRP price breaks falling channel as bulls target $1.53
-

 Politics1 day ago
A new European chapter for Gibraltar
-

 Politics1 day ago
The House | Bin the lectures, bring gossip and be ready to banter: how the new PM should prepare for his Trump encounter
-

 Politics1 day ago
How To Avoid Winter Colds: 4 Everyday Habits That Spread Germs, Says Pharmacist
-

 Crypto World1 day ago
From warning to listing: UK’s largest retail investment platform opens access to crypto ETNs
-

 Tech1 day ago
A Worthy Android Ereader, With Some Tradeoffs
-

 Crypto World1 day ago
FinCEN flags $12.7B tied to Southeast Asia crypto investment scams
-

 Crypto World1 day ago
Trezor Data Breach Impacts 67,000 More US Customers
-

 Politics1 day ago
33 Cosy Autumn Home Decor Ideas: Blankets, Pumpkin Decorations, And Candles
-

 Sports1 day ago
Seven wickets in 21 balls: Sri Lanka’s Chamari Athapaththu scripts history with record-breaking spell
-

 Tech1 day ago
How To Edit Claude’s Memory
You must be logged in to post a comment Login