
Crypto World
Ethereum risks 10% drop against Bitcoin as double-top pattern emerges



Key takeaways
- ETH traded near 0.03167 BTC as its performance against Bitcoin weakened.
- A potential double top has formed with two peaks around 0.03344 BTC.
- A close below the 0.03078 BTC neckline could trigger a 10% decline toward 0.0283 BTC.
Ethereum is showing signs of further underperformance against Bitcoin as a potential double-top pattern develops on the ETH/BTC daily chart.
Ether traded near 0.03167 BTC on September 16 after failing to sustain its latest advance. Weakening momentum, growing regulatory uncertainty, and a sharp increase in ETH deposits to Binance support a cautious near-term outlook.
A confirmed breakdown below 0.03078 BTC could send the pair approximately 10% lower toward 0.0283 BTC.
ETH/BTC double top signals potential decline
The ETH/BTC chart has formed two comparable peaks near 0.03344 BTC, with the first appearing in August and the second in September.
This structure resembles a double top, a bearish reversal pattern that develops when buyers repeatedly fail to break through the same resistance level.
The pattern’s neckline sits near 0.03078 BTC. Ethereum would need to record a decisive daily close below this level to confirm the bearish setup.
Subtracting the pattern’s height from the neckline produces a downside target around 0.0283 BTC. Reaching that level would represent an approximately 10% decline from Ether’s current value against Bitcoin.
Ethereum momentum weakens
The ETH/BTC Relative Strength Index has fallen toward 50 after previously moving above the overbought threshold of 70.
Although the RSI remains slightly above neutral, its retreat indicates that the momentum supporting Ethereum’s August-to-September recovery is fading.
Ether is still holding marginally above its 20-day exponential moving average at approximately 0.03162 BTC. A strong rebound from this moving average could delay or prevent the bearish breakdown.
A sustained move above the two peaks at 0.03344 BTC would invalidate the double-top scenario and restore a more bullish relative outlook for ETH.
The bearish technical setup emerged as the US Senate failed to advance the Digital Asset Market Clarity Act on September 15.
The procedural vote received 50 votes in favor and 49 against but fell short of the 60 votes required to move the legislation forward. A procedural vote change by Senator Thom Tillis preserves the possibility of reconsidering the measure.
The setback triggered a wider cryptocurrency sell-off. Bitcoin declined approximately 4% to around $75,900, while shares of major crypto companies, including Coinbase and Circle, also fell.
Regulatory uncertainty can encourage traders to favor Bitcoin over more risk-sensitive assets such as Ethereum. This could increase pressure on the ETH/BTC pair and bring the 0.03078 BTC neckline back into focus.
Binance receives 709,400 ETH in one day
Ethereum deposits to Binance have also increased sharply, creating another potential source of selling pressure.
Approximately 709,400 ETH moved onto the exchange on September 11, marking the highest daily inflow since June, according to CryptoQuant. Several recent sessions also recorded inflows exceeding 500,000 ETH, considerably above typical July and August levels.
Rising exchange inflows increase the amount of ETH immediately available for trading. Although transfers to exchanges do not necessarily mean holders intend to sell, unusually large deposits can precede higher market supply and increased volatility.

The elevated inflows reinforce the cautious outlook created by Ethereum’s weakening relative momentum and the CLARITY Act setback.
ETH/BTC bulls must defend 0.03078
The bearish scenario depends on ETH/BTC closing decisively below the 0.03078 BTC neckline. Confirmation could open the path toward the measured target of 0.0283 BTC.
However, support from the 20-day EMA near 0.03162 BTC could allow Ether to rebound. A break above 0.03344 BTC would invalidate the double top and signal renewed Ethereum strength against Bitcoin.


Bitcoin (BTC) is stuck in a narrow price range as investors wait for the U.S. Federal Reserve to announce its interest-rate decision on Wednesday. Selling has slowed, but buying has not been strong enough to push BTC clearly higher.
According to Bitfinex Alpha, Bitcoin has traded within a 5.5% range for more than 24 sessions, keeping the market quiet. The report says the next move could depend on whether new demand returns after the Fed decision, as traders have built positions at both ends.
Selling Eases, but Buyers Remain Cautious
About 840,000 BTC have a cost basis within this narrow range, meaning they were bought at prices inside it. Glassnode’s sell-side risk ratio has fallen to seven basis points, showing that long-term holders are taking fewer profits.
Newer investors now account for most of the remaining supply, but trading activity remains low. In other words, sellers have become less aggressive without a strong wave of new buyers stepping in.
Leverage has also built up around the current price levels, which could make any breakout more volatile. CoinGlass data show about $1.95 billion in possible short liquidations near $82,000, while long positions are concentrated around $75,000 to $76,000.
Institutional demand has also weakened, adding another obstacle to a sustained move higher. U.S. spot Bitcoin ETFs saw over $460 million in outflows last week, selling approximately 5,900 BTC, while Ether ETFs took in $196.9 million. September ETF flows remain positive, but recent outflows show weaker institutional demand could limit Bitcoin’s upside.
Inflation Keeps Pressure on the Fed
Inflation is adding another challenge, with August prices rising 0.4% from the previous month and 3.4% over the year. Core inflation eased to 2.4%, but gasoline prices rose 3.9%, and diesel reached $5.65 per gallon.
Higher energy costs could keep inflation elevated, especially as Brent crude trades above $100 a barrel and U.S. strategic reserves fall to 285.4 million barrels. This could reduce expectations for easier monetary policy and keep pressure on interest rates.
Markets now see an 88.5% chance of a 25-basis-point rate hike on September 16. The U.S. 10-year real Treasury yield has risen to 2.55%, making non-yielding assets such as Bitcoin less attractive to some investors.
The post Bitcoin Stays Stuck as Traders Wait for the Fed’s Next Move appeared first on CryptoPotato.
Crypto World
LatAm telco VIVA taps Avalanche-based Iris for stablecoin settlement and dollar reserves


Between 2012 and 2025, global mobile data traffic grew more than 50% annually while operator service revenue increased less than 1% per year, according to McKinsey figures cited by Iris.
Telecom operators bring something financial apps often spend heavily trying to build: customers, verified identities and distribution.
That can be particularly powerful in emerging markets.
“In the U.S. the operator is like one rail among many,” Ava Labs Chief Business Officer John Nahas told CoinDesk. In markets such as Bolivia, by contrast, “the mobile carrier is often the rail that people do everything on.”
That is why Iris expects its initial expansion to focus on Latin America and potentially parts of Africa and Asia rather than the U.S., Nahas said.
VIVA offers an early test of whether that model can translate into better economics for carriers. Nahas said a super-app product used by VIVA helped reduce churn among prepaid mobile customers by 33% while increasing their lifetime value by 35%.
“When you start to see numbers like this, it just starts making a lot of sense,” he said, adding that Iris now needs more real-world case studies.
Stablecoins behind telecoms
Iris runs on a dedicated Avalanche Layer 1, giving the network control over its settlement, operating and compliance requirements. USDi serves as the settlement asset, while also giving VIVA the option to hold eligible operating reserves in dollars.
In VIVA’s case, using U.S. dollar stablecoin for settlements also means having the option to hold eligible operating reserves in U.S. dollars, which is particularly relevant in markets with volatile local currencies.


The central point of the deal is Payward is trying to bring a popular offshore and onchain trading product into a regulated U.S. structure while keeping trade matching and recordkeeping on Hyperliquid.
“A U.S. client would open a futures account with Payward’s registered broker and trade new perpetual futures contracts on Hyperliquid, cleared through the same clearinghouse that already supports the crypto perpetual contracts Payward offers U.S. clients today,” said Jon Pham, head of U.S. derivatives.
Payward acquired Bitnomial in May for $550 million. It bought NinjaTrader Clearing for $1.5 billion in 2025.
Perpetuals are derivative products that allow investors to place positions on the price movements of an underlying digital asset without owning the asset itself. Unlike traditional futures contracts, perps do not expire and can be maintained indefinitely. Traders make or receive periodic funding payments to keep their positions open.
The markets will run on Hyperliquid’s public blockchain, whose onchain order book matches and records trades. Bitnomial Exchange and Bitnomial Clearinghouse would act as the HIP-3 deployer, creating, owning and administering the market and clearing and settling the contracts. NinjaTrader Clearing, Payward’s registered futures commission merchant, would carry client accounts.
Payward did not disclose a fee schedule, expected trading volumes, details of any economic arrangement with Hyperliquid or a planned launch date. A Kraken spokesperson said it could not speculate on the potential revenue this would bring to the company, and did not address questions about expected trading volumes.
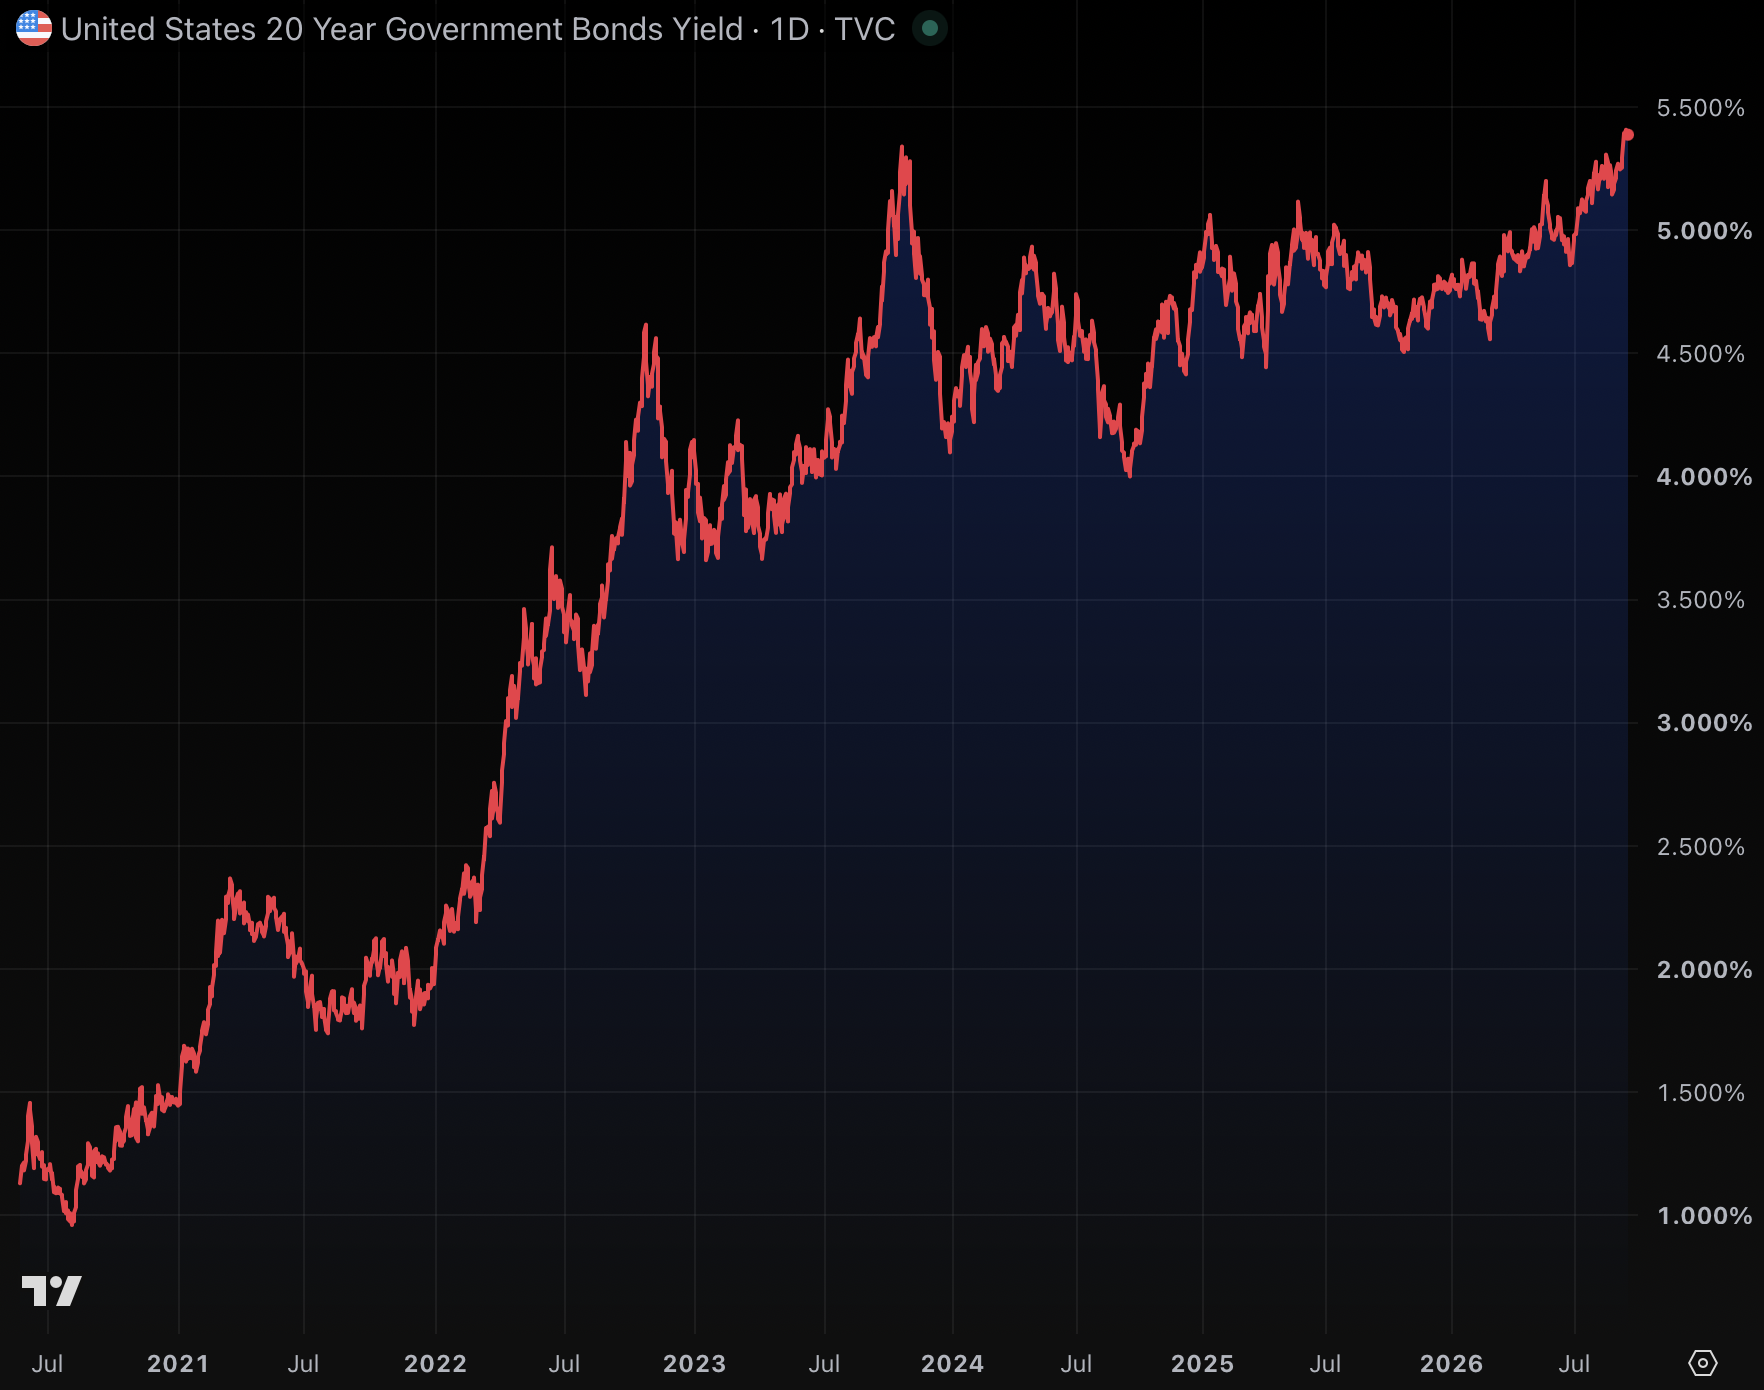
Yesterday morning, the head of the US Treasury proudly reported in front of Congress that the government had just run two of its best bond auctions in decades.
By 1pm, the Treasury conducted its worst 20-year bond auction in history.
On Tuesday, the US government had to pay a record-breaking 5.42% interest yield-to-maturity to sell its auction of 20 year maturity bonds — the most expensive cost of capital the US government has paid for Treasuries of this maturity since modern record-keeping began in 1986.

On a bit of a technicality, the government avoided paying 5.42% interest on the bonds, instead paying 5.125% yet selling them below par to mathematically offer 5.42% de facto yield to purchasers.
Worse, the particular type of investors Washington needs for offloading its sovereign debt — foreign investors — bought the lowest percentage ever of that $13 billion auction.
Record cost to borrow money for 20 years
Bond auctions aren’t complicated. The US Treasury offers IOUs, and buyers around the world name the yield they’ll accept.
At each live auction, yield-to-maturity is focus. The bond’s effective interest rate is the cost of capital for the US government.
The higher the yield, the less creditworthy the US government is in the opinion of bond traders. With $40.1 trillion and rising of outstanding debt that costs taxpayers over $1.1 trillion per year in interest payments, US debt-to-GDP at 123% is a growing concern for bond investors.
Tuesday’s sale was terrible on three counts.
The rate was the start of the disaster. Twenty-year bonds traded around 5.40% minutes before the sale and cleared at 5.42%. In other words, Washington paid more than the open market was charging at the end, just to find sufficient takers to fully clear the auction.
Traders call that additional 0.02% a two basis point “tail,” and it was the worst tail for any 20-year auction since 2024.
Second, the crowd mix was terrible. So-called “indirect bidders” are Treasury auction participants like foreign central banks and overseas buyers.
Like any sovereign, the US wants to sell as much of its debt to buyers abroad as possible.
Instead, indirect bidders took just 52.5% of yesterday’s auction, lower than August’s 62.9% and the lowest percentage on record for any 20-year Treasury auction since the 1980s besides a small, idiosyncratic $25 million special auction in 2021.
Third, the liquidity or depth of demand was thin as well, as measured by the bid-to-cover ratio. Specifically, bids covered yesterday’s bond sale 2.57 times, below the 2.65 average of the previous six auctions.
Read more: How the bond market helped push BTC to all-time high
Did Scott Bessent expect no one would notice?
Given the historically bearish turnout for yesterday’s Treasuries sale, anyone could rightly be curious as to why Secretary Scott Bessent had so little foresight when boasting about the supposed strength of US creditworthiness during yesterday’s Congressional testimony.
To be fair, despite the immediate embarassment, Bessent actually had a real basis for his positive remarks for a few hours prior to 1pm.
Indeed, last week’s 10-year and 30-year bond sales went smoothly.
Indirect bidders took a healthy 79.5% of the $22 billion 30-year bond sale on September 10, for example. That success was true and fleetingly newsworthy.
Questioned at a US House hearing, Bessent leaned in.
“We then proceeded to have the two most successful treasury auctions that we’ve had in 20 years, and the US bond market, since President Trump has come in, has been the best performing bond market in the developed world.”
Connecticut Democrat Jim Himes wasn’t buying it. “Wait, wait, wait. The 10-year went up by 20 basis points. How can you say it was successful?” he asked, hours before the 20-year auction supplied an even worse data point.
Treasury yields provide the floor under which banks price mortgage and corporate borrowing rates. The household version, i.e. the average 30-year mortgage rate in the US, costs homeowners an alarming 6.76%.
Interest expense on the national debt now costs more than $1.1 trillion a year and is the US government’s second biggest expense behind Social Security payments.
The next 20-year US bond auction is scheduled for October 21, 2026.
Got a tip? Send us an email securely via Protos Leaks. For more informed news and investigations, follow us on X, Bluesky, and Google News, or subscribe to our YouTube channel.

The evaluation was based on three key evaluation pillars: Financial Performance, Reputation Analysis, and Online Engagement.
The first dimension, Financial Performance, was assessed through a detailed analysis of financial metrics, such as revenue per employee and funding amount. These metrics provided insight into the financial stability, growth potential, and operational efficiency of the companies. This dimension accounted for 50% of the total score.
The second dimension, Reputation Analysis, evaluated how companies and their digital health solutions are publicly perceived. Using social listening techniques, the analysis captured sentiment, visibility, and perceived credibility by examining publicly available content, such as news coverage, blogs, forums, and social media activity. This dimension contributed 30% to the total score.
The third dimension, Online Engagement, measured the reach and engagement levels of companies through their digital platforms. Website traffic served as the key indicator of user engagement. This dimension made up 20% of the overall score.
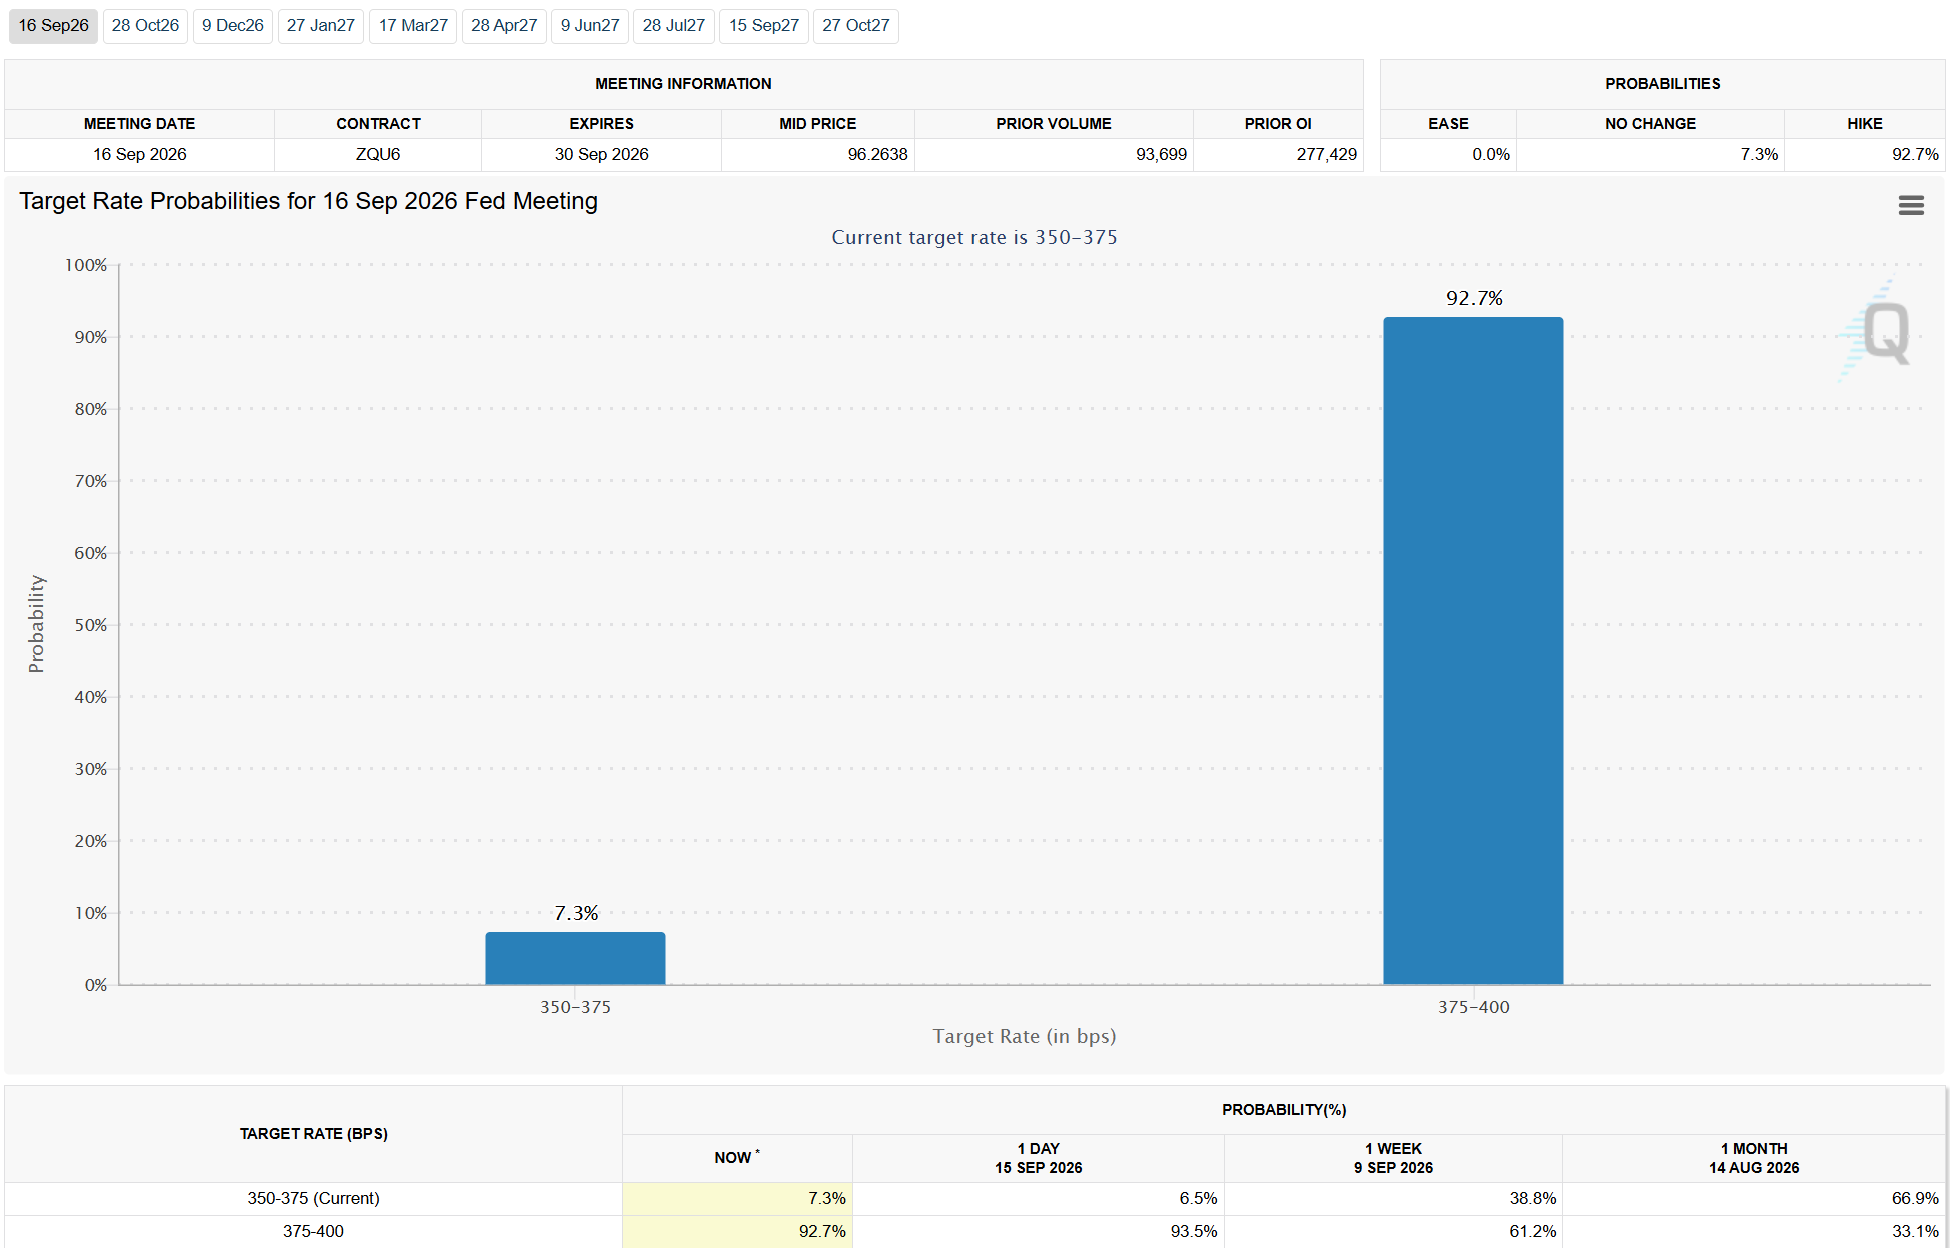
Interest rate futures put a 92.7% chance on the Federal Reserve raising rates on Wednesday. That leaves traders worried across both the crypto and stock markets. Because Donald Trump appointed Kevin Warsh with one single promise: cut interest rates. But Warsh can’t deliver that with inflation running at 3.4%
So, how will the market react, and which way will Bitcoin move?
Why a Pause is the Closest thing Warsh can give Trump
The Fed’s target range sits at 3.50% to 3.75%. The CME FedWatch tool put the odds of no change at 7.3% on Wednesday morning, with zero odds of a cut.

Trump picked Warsh for the job and watched him sworn in at the White House in May. Even ahead of the swearing-in, the president was already treating his would-be chair as an ally.
Wharton professor Jeremy Siegel has argued that Trump pressure and midterms are the only forces still blocking a hike. White House economic adviser Christopher Phelan said a move this week would be a mistake. Midterm elections are seven weeks away.
Former Fed governor Stephen Miran made the data case against hiking in an interview this week.
“If you held in June and July and become more hawkish as the inflation data come down, it speaks to an incoherent reaction function,” he shared.
Follow us on X to get the latest news as it happens
What Bitcoin and Gold Did the Last Time the Data Surprised
Rate expectations set the cost of holding assets that pay no interest. Bitcoin and gold both sit in that group, so cheaper money tends to help them.
The Bitcoin price held near $76,022 as of this writing, down 1.17% in 24 hours. Gold traded around $4,340 an ounce, up 1.4% on the day.

The August inflation report on September 11 showed how fast both react. Bitcoin fell from roughly $77,100 to $76,050 inside a minute. Gold slid from $4,353 to $4,292, then recovered.
BeInCrypto flagged hike odds near 90% that day. Pricing has since hardened to 92.7%.
KPMG chief economist Diane Swonk told the Associated Press that a hike now could pull long-term rates lower later. Warsh’s press conference, not the quarter point itself, is what traders will parse.
The post 93% Chance of a Fed Rate Hike Today. What Happens to Bitcoin Now? appeared first on BeInCrypto.

The CLARITY Act did not receive enough support in the US Senate, so it could not move to official discussion. This triggered a correction in the broader cryptocurrency market, while the upcoming FOMC meeting may worsen the sector’s condition.
The prevailing expectation is that interest rates in the USA will rise by 0.25%, yet analyst Ali Martinez assumed the central bank may be forced to keep the benchmark unchanged, which could propel a BTC price rally. Here’s why.
Influence From Trump?
Martinez started his thesis by noting the CLARITY Act failure and describing it as “a major setback for one of Trump’s crypto-policy objectives ahead of the November midterms.”
Then, he revealed that the odds of a 25-basis-point rate hike following the FOMC meeting, scheduled for later today (September 16), are roughly 93%, with only a small minority expecting the figure to stay the same.
According to the analyst, the smaller group may actually get it right this time. He pointed to the approaching midterms in the US, arguing that Trump needs a political win and that another rate increase could create more economic pressure, possibly hurting his chances of success.
“That could weigh on Kevin Warsh and the FOMC’s decision-making,” he said.
Martinez thinks that such a surprise move could trigger a powerful rally across risk assets, with BTC (which has rarely risen after the past 14 FOMC decisions) potentially surpassing $82,000.
“This is my wild prediction. Not the consensus view. Trump needs a win. A no-hike decision could give markets exactly the surprise they need to rally,” he concluded.
However, another angle is worth considering. The widely expected rate hike may already be priced in, making Fed Chair Warsh’s press conference the key event to watch. It will take place immediately after the FOMC meeting, and any signals of further rate increases could negatively impact BTC and altcoins. On the other hand, a softer tone and remarks that the central bank has made progress on inflation could lead to a solid rebound.
Massive Shorts Ahead of the Meeting
X user Max Crypto revealed that a mysterious whale opened a $50 million short position on BTC and a $15.8 million short on ETH ahead of the central bank’s crucial decision.
Usually, such major bets fuel speculation that the trader may have access to inside information. However, the whale’s win rate is around 40.6%, meaning their track record is far from flawless.
Meanwhile, another anonymous trader (with a staggering 100% win rate) recently opened multi-million shorts on BTC, ETH, and ZEC before the CLARITY Act vote. As mentioned above, the bill did not move forward for official discussion, and the crypto market headed south.
The post Wild Bitcoin Prediction Ahead of the FOMC: Here’s What Could Trigger a Pump appeared first on CryptoPotato.

XRP fell about 8% over the past 24 hours, one of the worst showings among the top cryptocurrencies, after the US Senate failed to advance the Digital Asset Market CLARITY Act on Tuesday.
The drop left XRP down well over 10% for the week, well behind Bitcoin and most other major coins, and it shows how closely tied the token’s price still is to progress on crypto legislation in Washington.
The Selling Was Not Just Profit-Taking
XRP’s price ran from around $1.46 per CoinGecko data to near $1.27, with analyst Xaif Crypto noting that its cumulative volume delta (CVD) cratered to negative 10.5 million as the price dumped.
“Sellers aren’t hiding anymore, this is aggressive dumping not just profit taking,” they wrote on X.
The selloff tracked the Senate vote almost exactly. Cloture on the bill, formally known as H.R. 3633, needed 60 votes and got 49. Every yes vote came from Republicans, and four of their own broke ranks to vote no.
Furthermore, Senators Gillibrand, Warner, Booker, Warnock, Gallego, Alsobrooks, and Cortez Masto all voted no after months of talks, meaning no Democrats crossed over to support it.
The CLARITY Act is meant to divide oversight of digital assets between the SEC and CFTC and bring exchanges, brokers, and dealers under a new federal registration regime, provisions the market had been pricing ahead of the Tuesday vote.
At the time of writing, CoinGecko data put XRP around $1.28, down over 8% in 24 hours and more than 10% in seven days. The picture looks different further out, with the Ripple token still up close to 29% over the past 30 days, even after this week’s drop, although it remains down more than 56% across one year and about 65% below its all-time high of $3.65 from July 2025.
Bitcoin and the Rest of the Market Also Slipped
The broader market was also under pressure, with Bitcoin slipping around 2.0% over the same 24 hours to trade near $75,000, while its share of the total crypto market remained above 56%. On its part, Ethereum dropped close to 4%, which saw it trading a few bucks under $2,400.
Stellar dipped even harder than XRP, shaving nearly 9% from its value, while BNB was only slightly ruffled, with its price dropping less than 1%.
Zcash gained about 3%, and Hyperliquid fell more than 2% over the same period, while Dogecoin slipped 3.7% and Solana lost over 4%, in line with the rest of the market’s retreat.
For XRP, the immediate price damage does not change its legal position, as pointed out by Ripple CEO Brad Garlinghouse, who also stated that his company “has never been stronger” despite the CLARITY setback.
The post Why XRP Was Hit Hardest After the CLARITY Act Senate Failure appeared first on CryptoPotato.
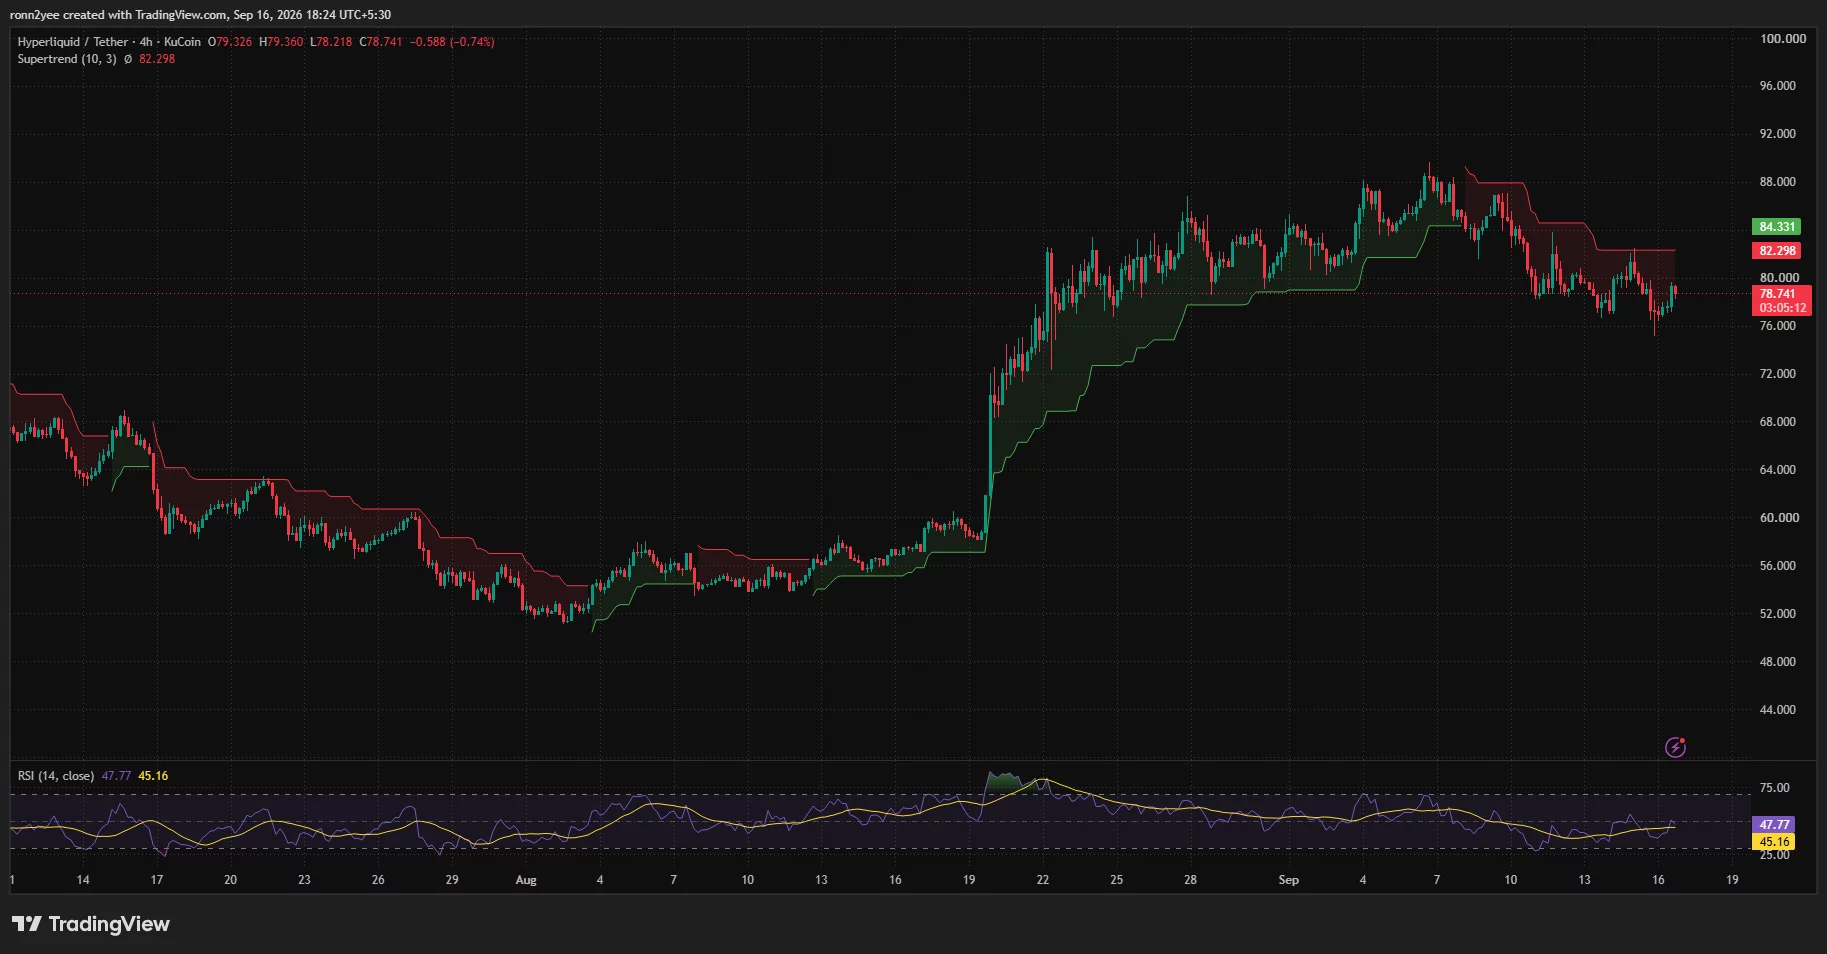
Hyperliquid’s HYPE token fell about 7.5% over the past week, retreating from $83.55 to around $78.70 as legal concerns and weaker technical momentum weighed on its recent rally.
Summary
- HYPE price has fallen 7.5% since Sep. 10 after setting a record high near $89.
- 4-hour Supertrend resistance sits at $82.30, keeping the short-term structure bearish.
- Bollinger Band support at $75.83 remains the main level protecting the broader uptrend.
- Hyperliquid reportedly bought and burned 36,720 HYPE worth $2.84 million within 24 hours.
HYPE price retreats from record high
Hyperliquid (HYPE) price traded near $78.70 on Sep. 16 after falling from an opening price of $83.55 on Sep. 10. The move represented a weekly decline of about 7.5%, although the token remained well above its August trading range.
The correction followed HYPE’s rally to a record high near $89 in early September. Daily candles show that buyers repeatedly failed to hold prices above the $88 area before sellers pushed the token below $82.
HYPE briefly dropped toward $76 on Sep. 16 before rebounding to around $78.70. The recovery showed that buyers remained active near the lower end of the week’s range, but price had yet to reclaim the technical levels that would signal a stronger reversal.
The pullback also followed federal charges against two former Robinhood engineers accused of using confidential listing information to trade perpetual futures on Hyperliquid.
Separate federal complaints alleged that Huaisong “Jerry” Xiang and Hefu Chai traded ahead of Robinhood’s public announcements. Prosecutors said each defendant earned more than $50,000 through the alleged activity. The allegations concern the individuals’ conduct and do not accuse Hyperliquid or its developers of participating in the scheme.
Short-term HYPE structure remains bearish
The 4-hour chart shows HYPE trading below the Supertrend indicator, which had shifted to resistance at $82.30. The indicator will continue to favor sellers unless the token closes above that level and holds it as support.
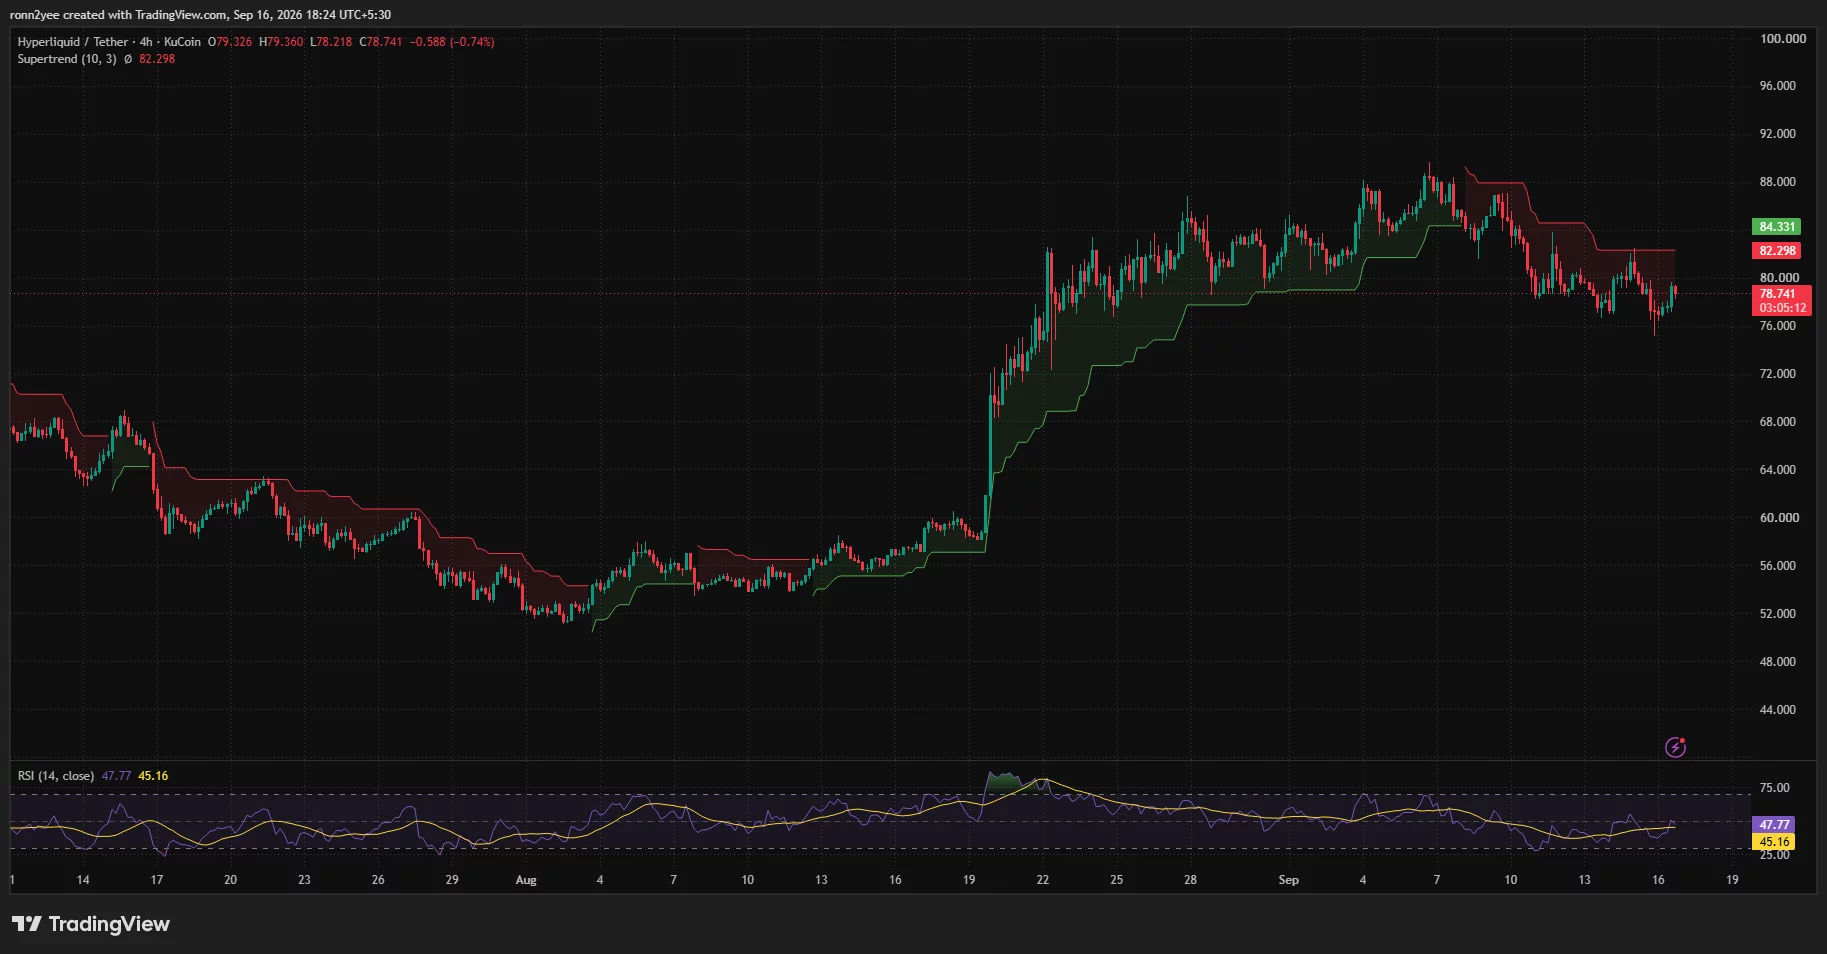
HYPE’s 4-hour Relative Strength Index stood at 47.77, while its RSI-based average was 45.16. The readings place momentum near neutral territory after recovering from a recent approach toward oversold conditions.
Price action has also formed a series of lower highs since the Sep. 7 peak. A rebound toward $80 stalled before reaching the Supertrend line, suggesting that sellers continue to defend rallies.
The $80 psychological level is the first barrier for buyers. A sustained move above it could allow HYPE to test the $82.18–$82.30 area, where the daily Bollinger Band midpoint and 4-hour Supertrend resistance converge.
A close above that zone would weaken the bearish short-term setup and expose $84.30, followed by the upper Bollinger Band near $88.53. The record area between $89 and $90 would become relevant only if HYPE clears those intermediate levels.
Daily Bollinger support protects the larger uptrend
The daily chart presents a less bearish picture than the 4-hour setup. HYPE remained above the lower Bollinger Band at $75.83 despite trading below the middle band at $82.18.
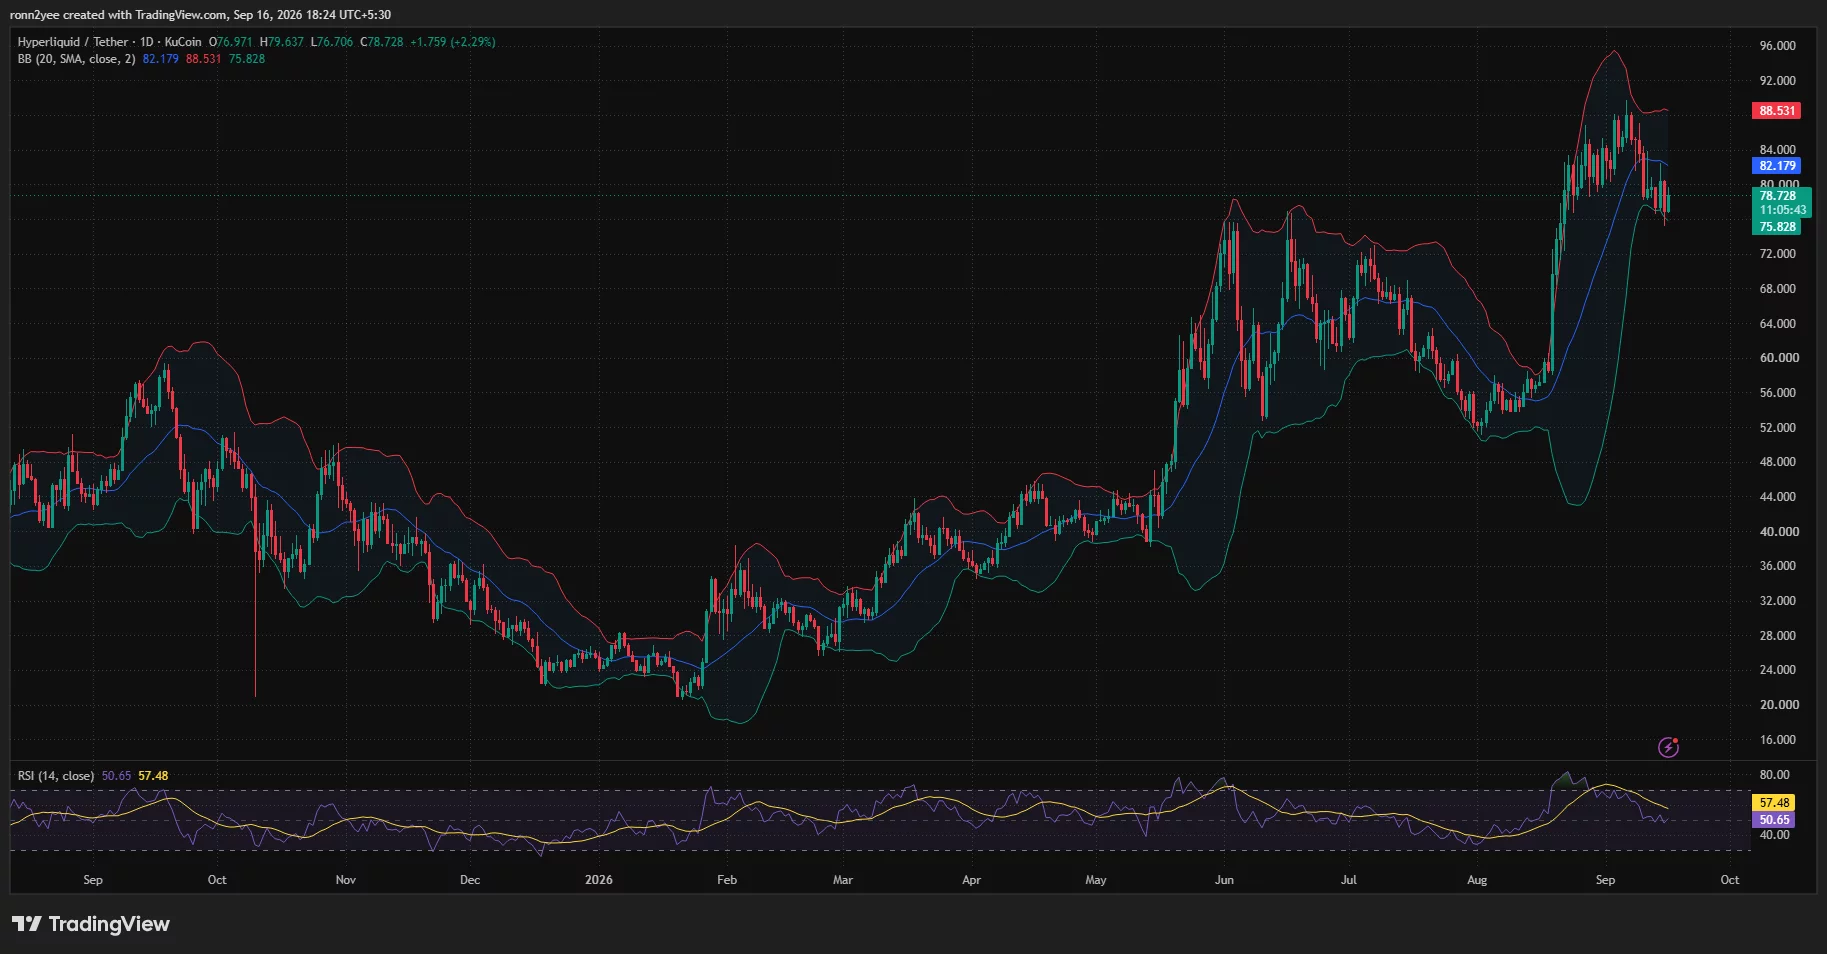
Daily RSI stood at 50.65, down from an overbought reading reached during the early-September rally. The indicator’s average remained higher at 57.48, showing that momentum has cooled faster than its recent trend.
A daily close below $75.83 would mark a more serious technical breakdown. The next visible support zone lies around $72, where HYPE consolidated before its late-August advance. A deeper correction could then bring the $68–$70 region back into focus.
The wider chart still shows a sequence of higher lows from the August bottom near $51. HYPE would therefore need to lose the mid-$70s support area before the larger recovery structure faces a clearer threat.
Holding $75.83 while reclaiming $82.30 would instead support a consolidation scenario between the lower and middle Bollinger Bands.
Liquidation map places liquidity near $80
CoinGlass’ 24-hour liquidation heatmap shows a dense liquidity cluster between roughly $78.40 and $78.90, close to HYPE’s current price. A second concentration appears between $79.70 and $80.50.
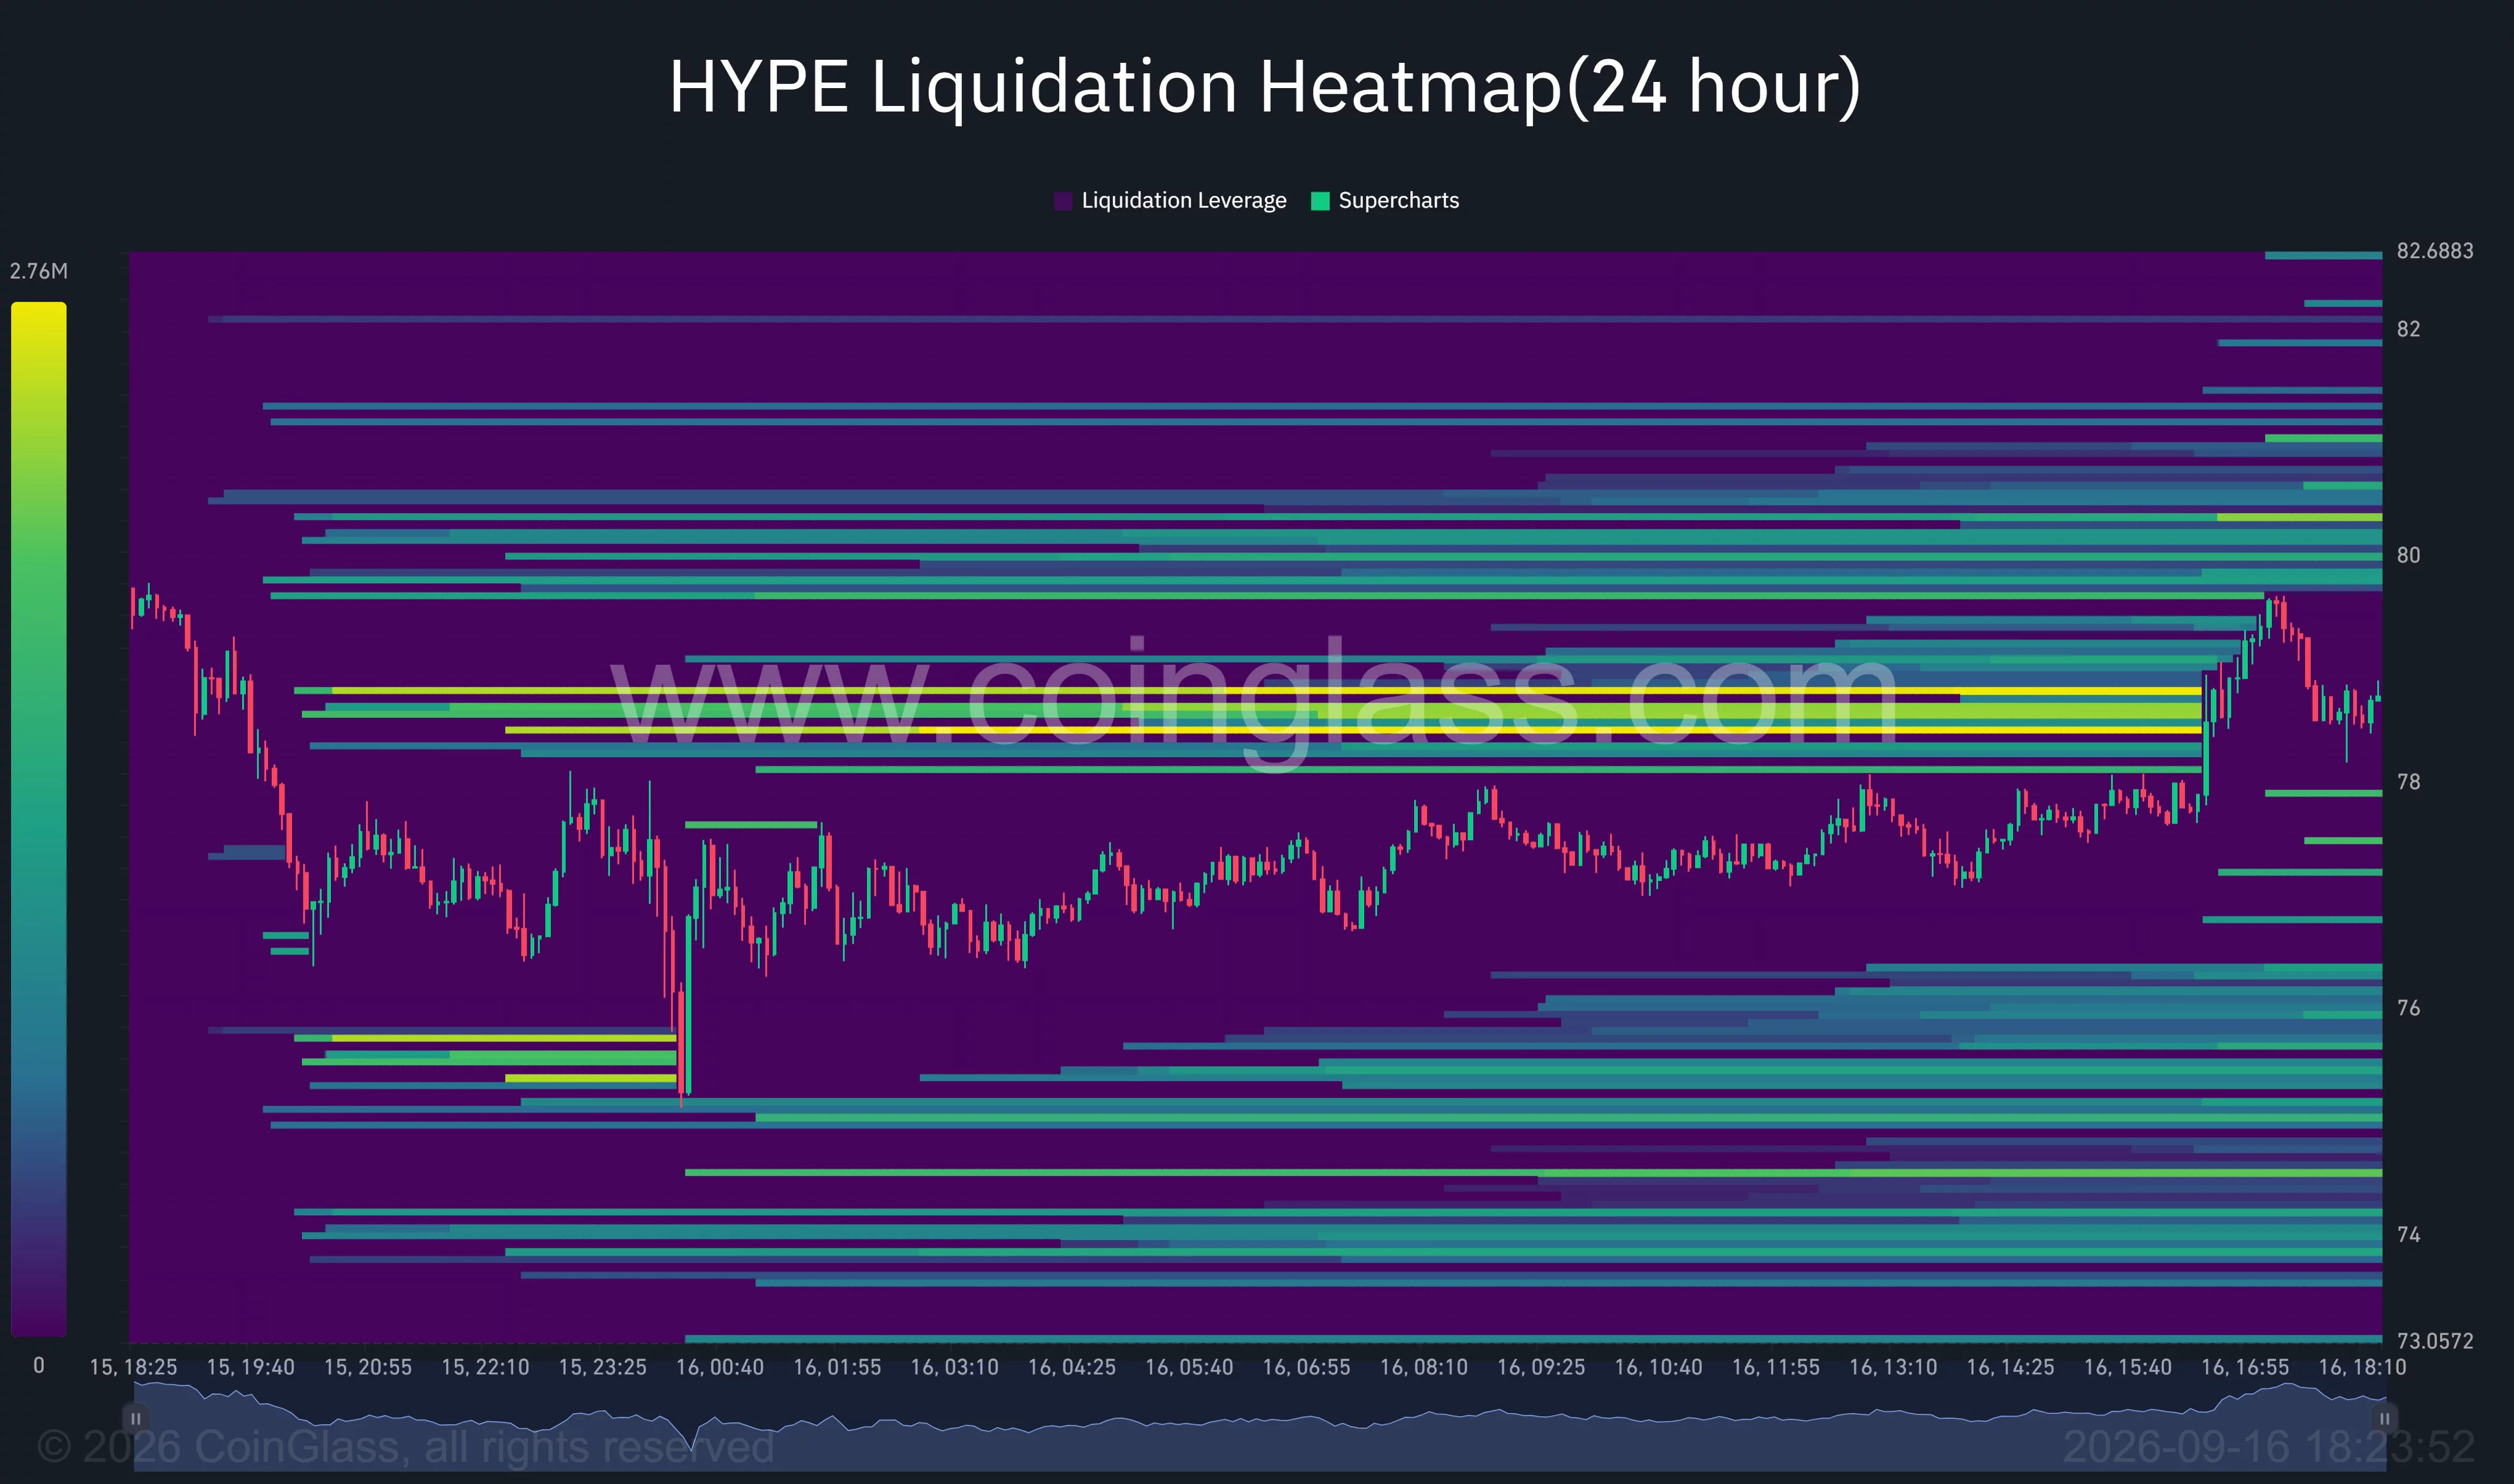
Those bands could attract price during a rebound because leveraged positions tend to accumulate around crowded levels. The heatmap does not show that all positions in those zones have already been liquidated; it identifies areas where forced closures could increase if price reaches them.
Above the market, the strongest nearby liquidity sits around $80.30. A move through that level could accelerate toward $81 and $82 as short positions face pressure.
Liquidity is also visible below price around $75–$76, aligning with the daily lower Bollinger Band. A break under $77 could therefore expose HYPE to a sweep of leveraged long positions before buyers attempt another recovery.
Token burns offer support during the correction
Onchain Lens reported that Hyperliquid bought and burned 36,720 HYPE worth about $2.84 million during a 24-hour period, at a volume-weighted average price of $77.31.
The account said lifetime burns had reached 48.67 million HYPE, valued at approximately $3.78 billion and equal to 4.87% of the token’s maximum supply. It also reported $2.14 million in rolling 24-hour fees and $2.07 million in HYPE-directed revenue.
The buyback mechanism may absorb part of the available sell-side supply, but the charts show that it has not yet restored bullish short-term momentum.
For HYPE, the immediate setup depends on whether buyers can defend $75.83 and push the price above $82.30. Remaining below that resistance would leave the token vulnerable to further consolidation, while a confirmed reclaim could reopen a path toward $84.30 and $88.53.
Disclosure: This article does not represent investment advice. The content and materials featured on this page are for educational purposes only.


Zero-knowledge technology could let companies verify who you are without storing your identity documents. So why isn’t it already standard practice?

TOP 5 HIGHEST DEBT INTEREST RATES ON FINANCIAL AUDIT

Ed Sheeran loses 150,000 followers in wake of Macklemore controversy while rapper sees following skyrocket

J.B. Hunt stock plunges 10% on earnings drop expectation



-

 Fashion5 days ago
Weekend Open Thread – Corporette.com
-

 Business7 days ago
Micron Stock Climbs Above $1,031 as AI Memory Crunch and a $50 Billion Outlook Fuel the Rally
-
 Tech3 days ago
The Latest Weird Thing to Play Doom Is the Mapped-Out Brain of a Fruit Fly
-

 Business7 days ago
AMD Stock Climbs After Management Lifts 2027 Data Center Outlook Toward $70 Billion in AI Sales
-

 Business5 days ago
10 Most-Streamed Songs On Spotify In 2026 So Far, Led By Ella Langley’s Dominant Run On The Charts This Year
-

 Crypto World5 days ago
XAG/USD: Silver’s Short-Term Rally Meets Its Moment of Truth
-
 Crypto World6 days ago
2 Chip Stocks Broke Out This Week. Neither Was Nvidia
-

 Tech6 days ago
Battery life is the only iPhone 18 Pro and iPhone Duo upgrade I care about. Apple didn’t disappoint
-

 Crypto World7 days ago
Pi Network ships Protocol 27 on a network with 14 million users and zero DeFi
-

 Crypto World6 days ago
OKX launches 10x OpenAI, Anthropic X-Perps in Europe
-

 Crypto World5 days ago
Diesel Tops $6 a Gallon for the First Time as 28 States Set Records
-

 Tech7 days ago
Apple Watch Ultra 4 vs Watch Ultra 3: Should you really spend another $799?
-

 News Videos5 days ago
Facing Financial Fears
-
 Crypto World7 days ago
Bitcoin price risks $70K if $78K neckline breaks
-

 Business6 days ago
Western Digital Slips 2.7% as AI Storage Rally Cools After Record Cash and Guidance
-

 Entertainment7 days ago
Case Sees Major Update As Jury Deliberations Begin
-

 Business3 days ago
Rivals Sam Altman and Elon Musk Rally Behind Dario Amodei’s Call for a Slowdown in AI Development
-

 Crypto World2 days ago
Elon Musk Drops a Bombshell: Grok 5 Could Be the AGI Breakthrough
-
Crypto World6 days ago
Ethereum Price Analysis: Consolidation at $2.5K Tests Momentum as On-Chain Activity Surges
-
 Crypto World7 days ago
Ethereum price breakout hinges on a close above $2,535
You must be logged in to post a comment Login