

Crypto World
XRP ETFs in Green For 3 Week, But Price Remains Stuck

XRP price has traded mostly flat over the past 24 hours and the past week. This sideways move shows clear market indecision. On the surface, institutional activity looks supportive. XRP spot ETFs have now recorded three straight weeks of inflows. But underneath this positive trend, a hidden weakness is quietly building.
Several technical and on-chain signals suggest XRP may be closer to a breakdown than it appears.
ETF Inflows Stay Positive, But Institutional Strength Is Rapidly Fading
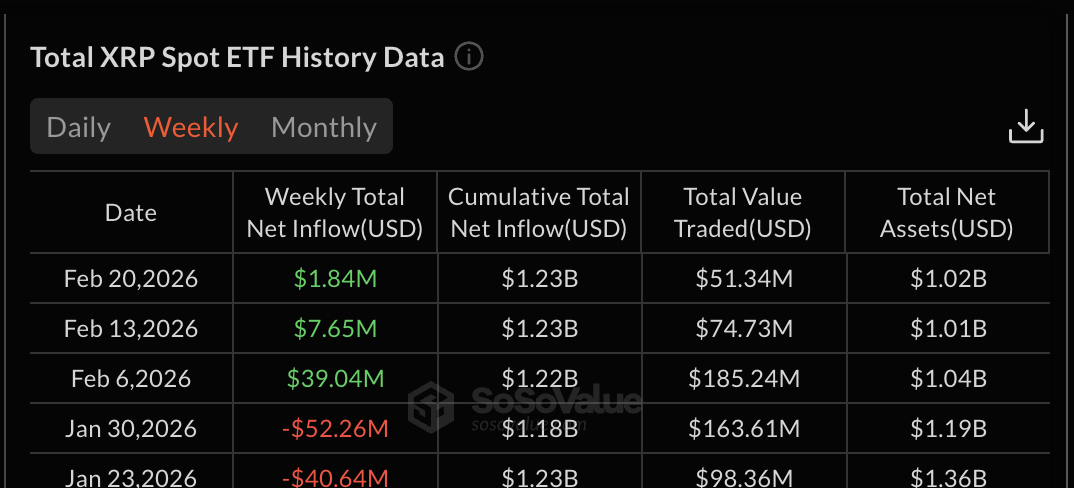
XRP spot ETFs have recorded inflows for three straight weeks. The week ending February 6 saw $36.04 million in inflows. By the week ending February 20, inflows had fallen further to just $1.84 million.
This represents a drop of nearly 95% in weekly inflows within three weeks.
ETF inflows show how much institutional money is entering an asset. Rising inflows usually signal growing confidence. But falling inflows, even if still positive, show that institutional conviction is weakening quickly.
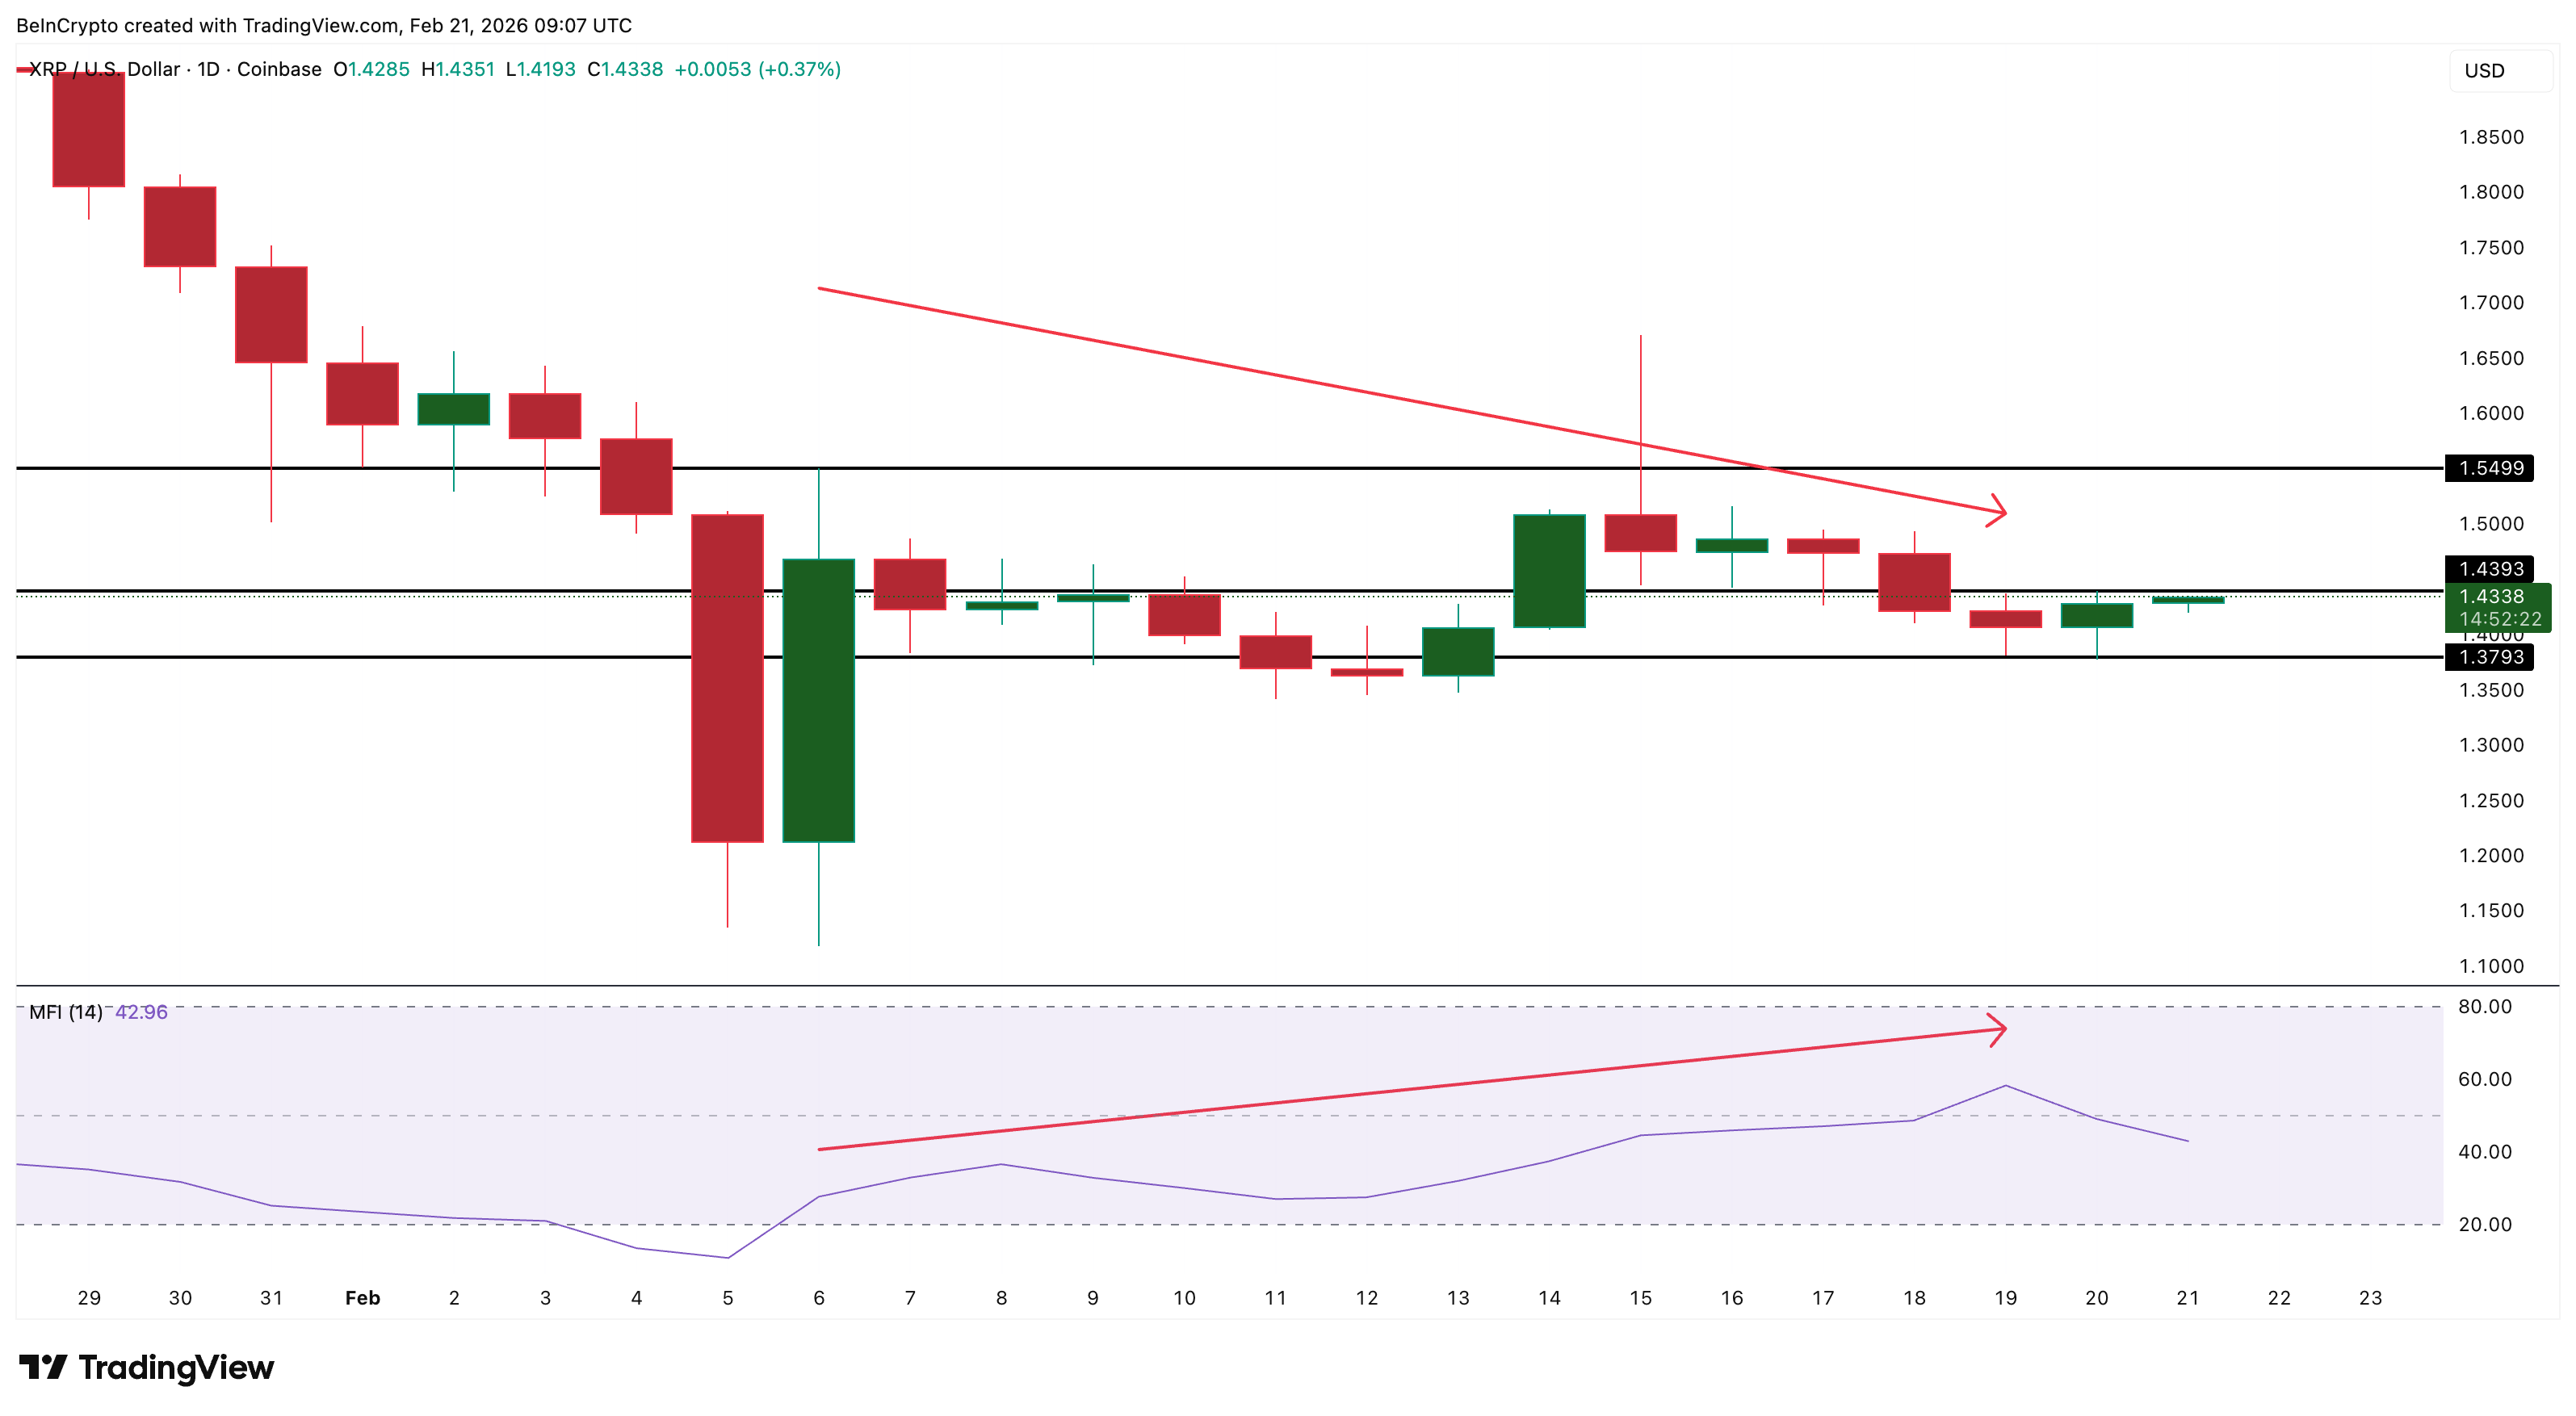
This institutional slowdown is already visible on the chart. XRP fell below its weekly Volume Weighted Average Price, or VWAP, on February 18 and hasn’t reclaimed the line since.
VWAP represents the average price weighted by volume. It is widely used as a proxy for institutional cost basis and is referred to by big money as a benchmark.
When the price falls below VWAP, it means institutions are holding positions at a loss on average. This often reduces their willingness to buy more. The last time XRP broke its weekly VWAP, it fell nearly 26%. The correction since February 18 is also continuing.
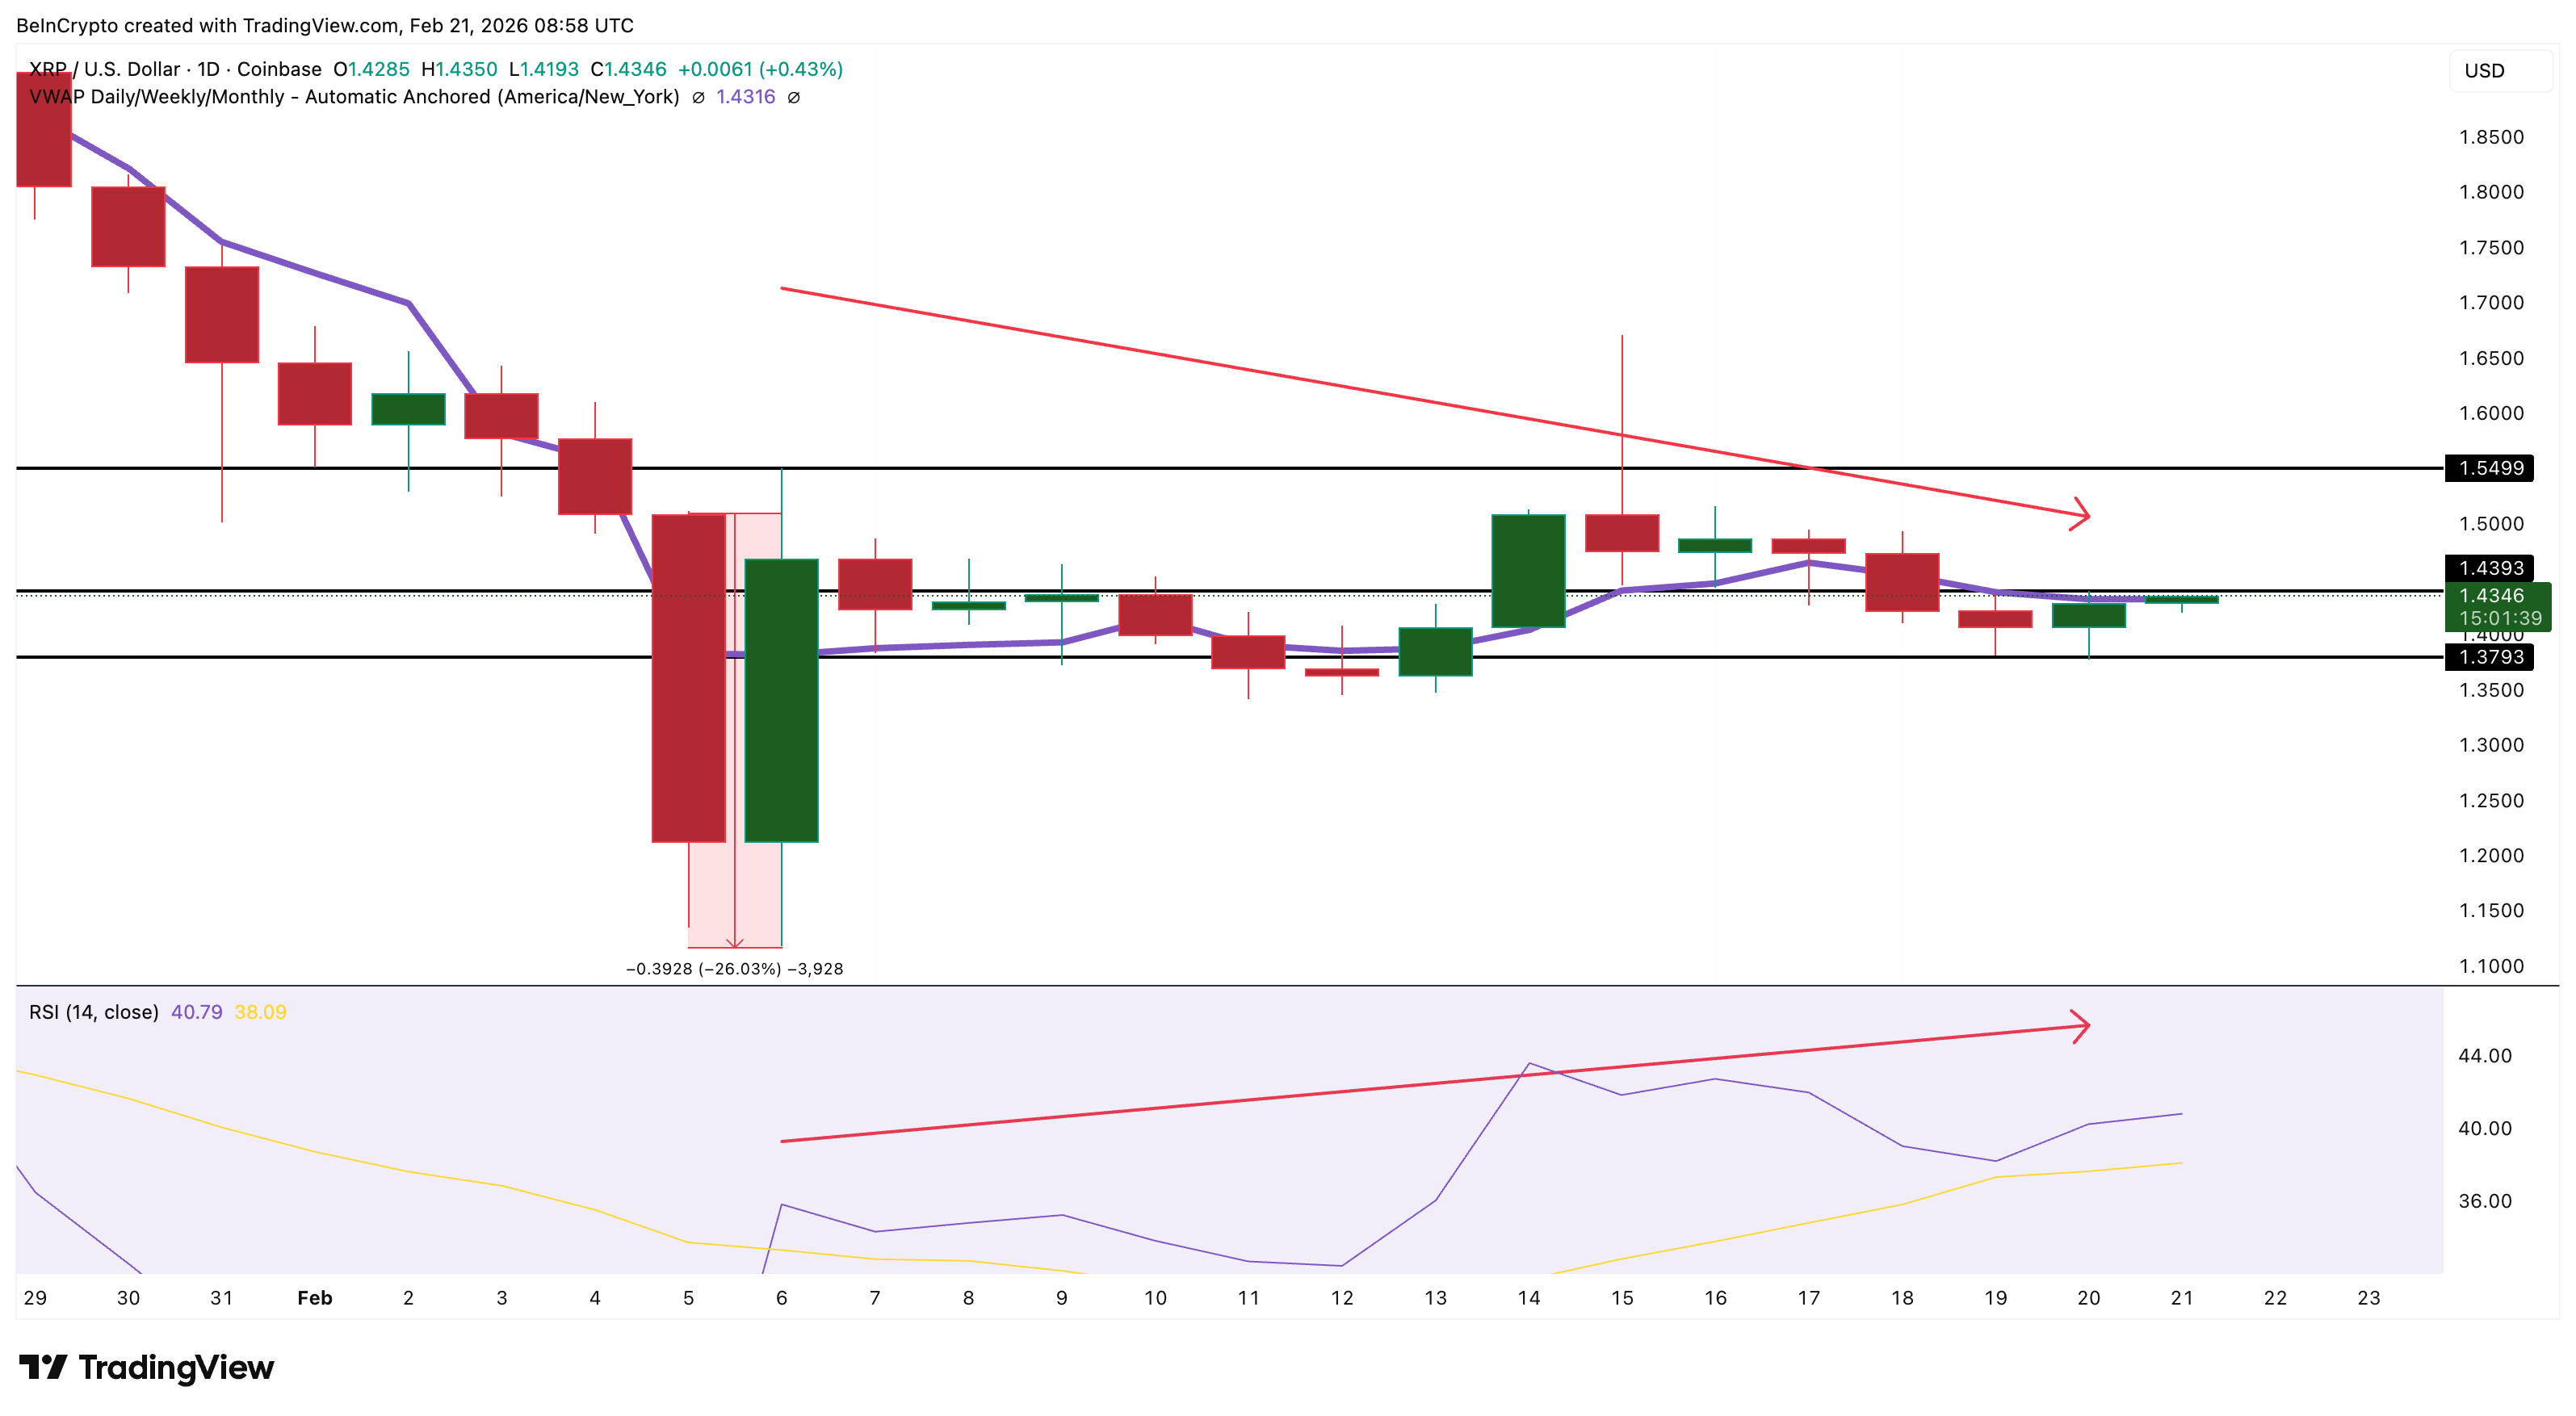
At the same time, XRP is close to forming a hidden bearish divergence between February 6 and February 20. During this period, the XRP price seems to be printing a lower high. But the Relative Strength Index, or RSI, already formed a higher high.
RSI measures momentum. When momentum rises, but price fails to follow, it signals weakening recovery strength and a possible downtrend extension for XRP if $1.379 breaks. A clear price-specific confirmation would occur if the current XRP price fails to reach or exceed $1.439.
Together, weakening ETF inflows, VWAP loss, and bearish divergence show that institutional strength is fading despite the positive ETF streak.
Exchange Flows and Dip Buying Explain Why Price Has Not Collapsed Yet
Despite falling below the VWAP, XRP has not collapsed sharply, like earlier. On-chain data helps explain why.
One key metric is Exchange Net Position Change. This tracks whether coins are moving into or out of exchanges. Outflows usually signal buying, while falling outflows show weakening demand.
On February 18, exchange outflows peaked near 71.32 million XRP. Recently, outflows dropped to around 41.69 million XRP. This marks a decline of about 41%.
Want more token insights like this? Sign up for Editor Harsh Notariya’s Daily Crypto Newsletter here.
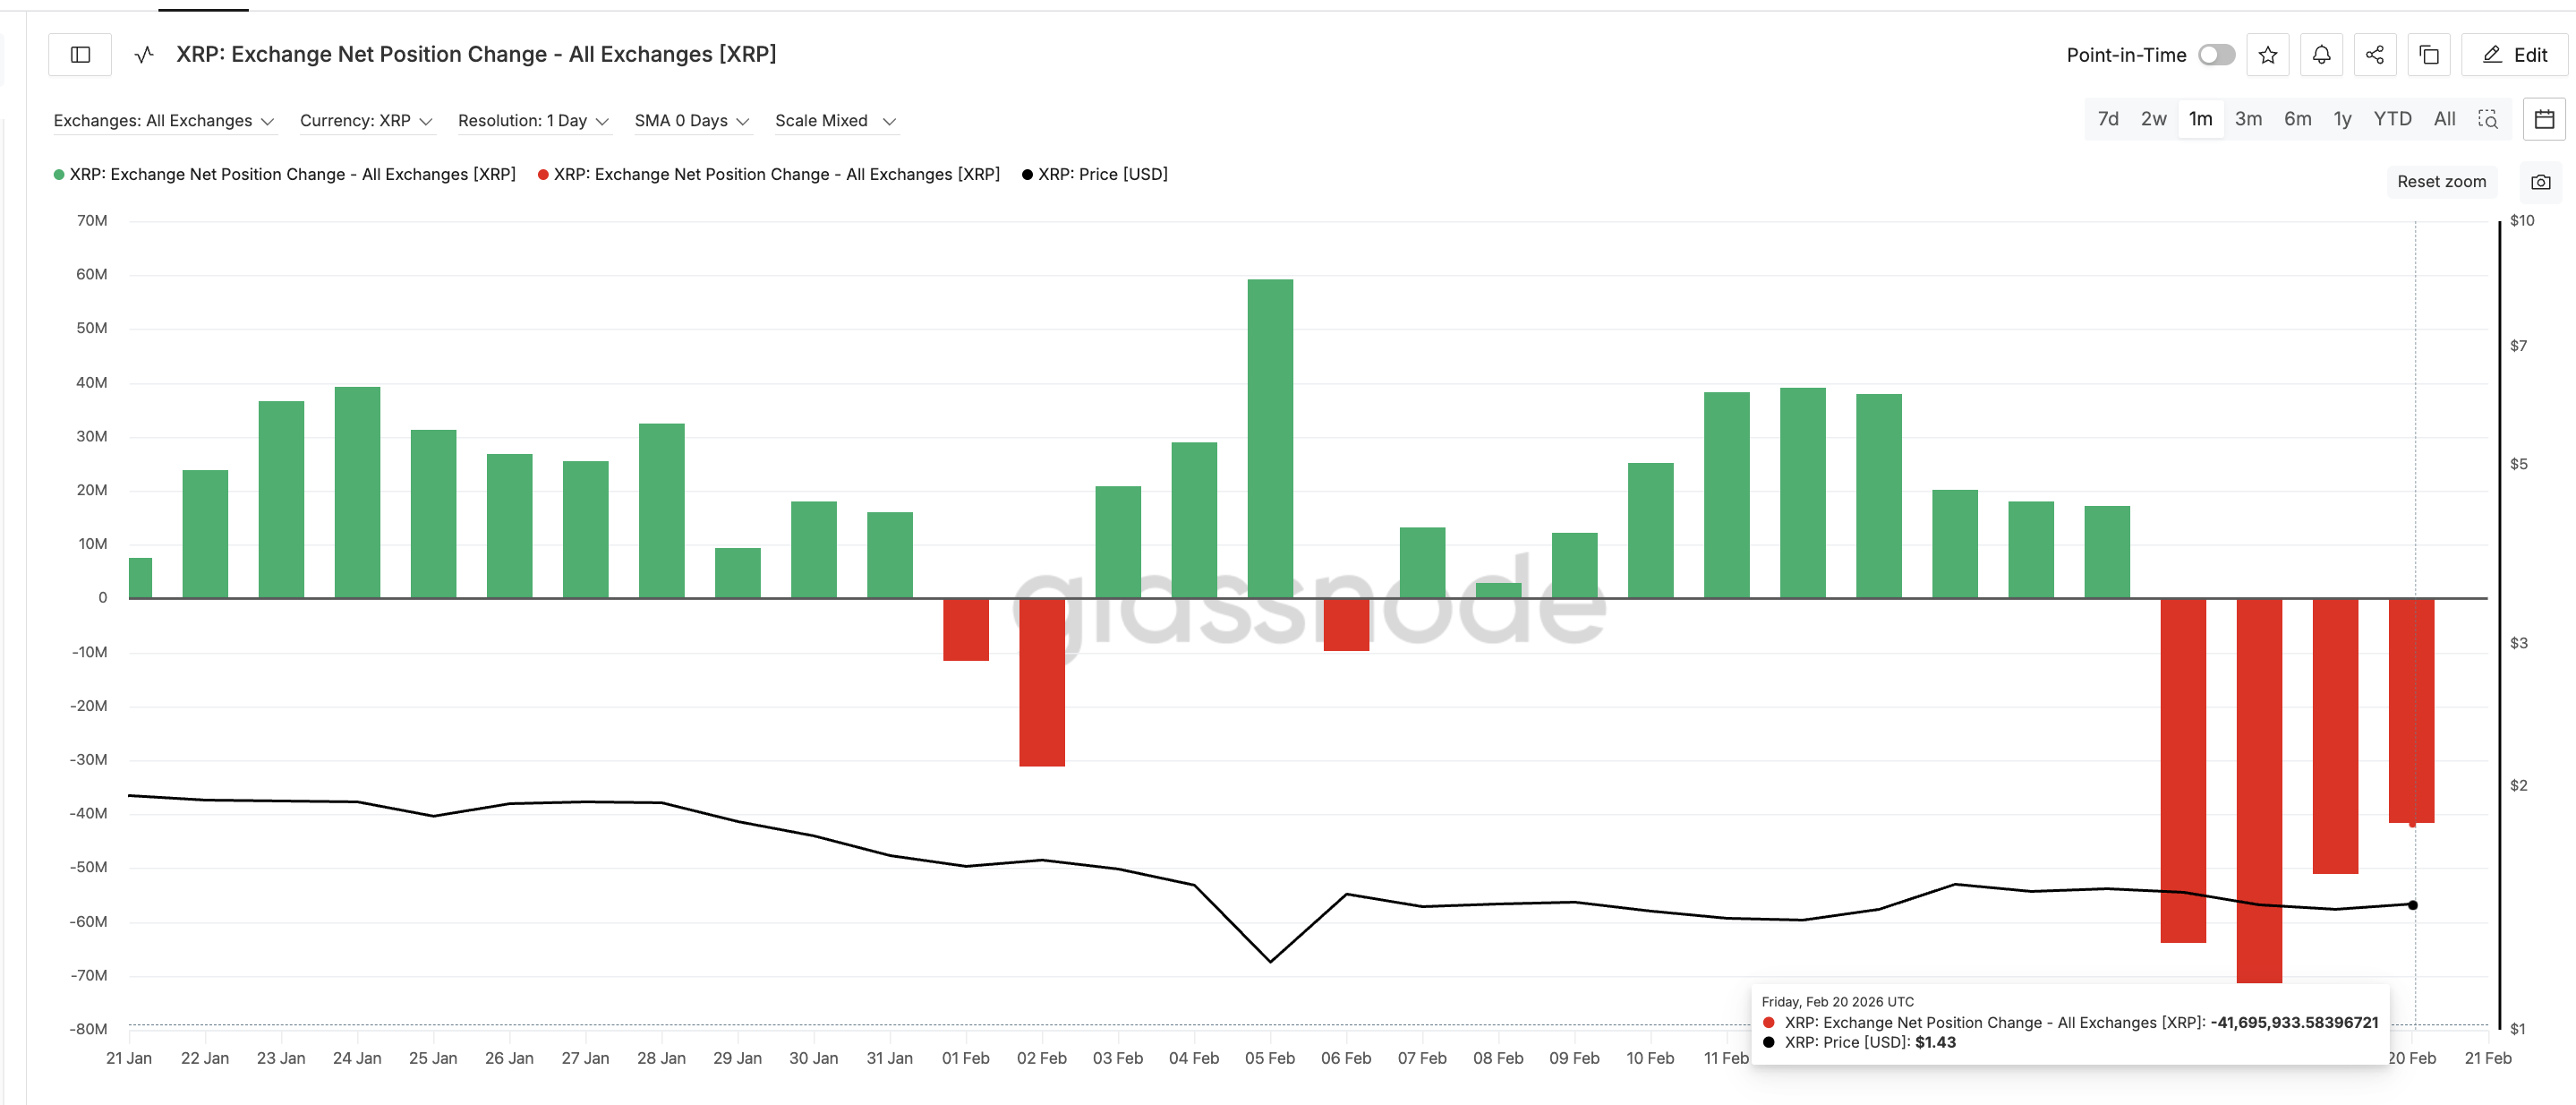
This shows that buying pressure has weakened significantly but still remains.
Another indicator shows buyers are still active. The Money Flow Index, or MFI, tracks real capital entering an asset. Between February 6 and February 19, the XRP price trended lower.
But MFI trended higher. This divergence shows dip buyers are slowly accumulating even as the price weakens.
This dip buying helps explain why XRP has remained relatively stable after losing its VWAP. Buyers are absorbing selling pressure. This has prevented an immediate collapse so far. But this support is limited. If dip buying weakens, downside risk could increase quickly.
XRP Price Faces Critical $1.25 Test as Cost Basis Cluster Becomes Final Support
Cost basis data now shows XRP approaching a critical support zone. Cost basis represents the prices at which investors previously bought XRP.
These levels often act as strong support or resistance. The most important support cluster currently sits near $1.26, hosting over 159 million XRP.
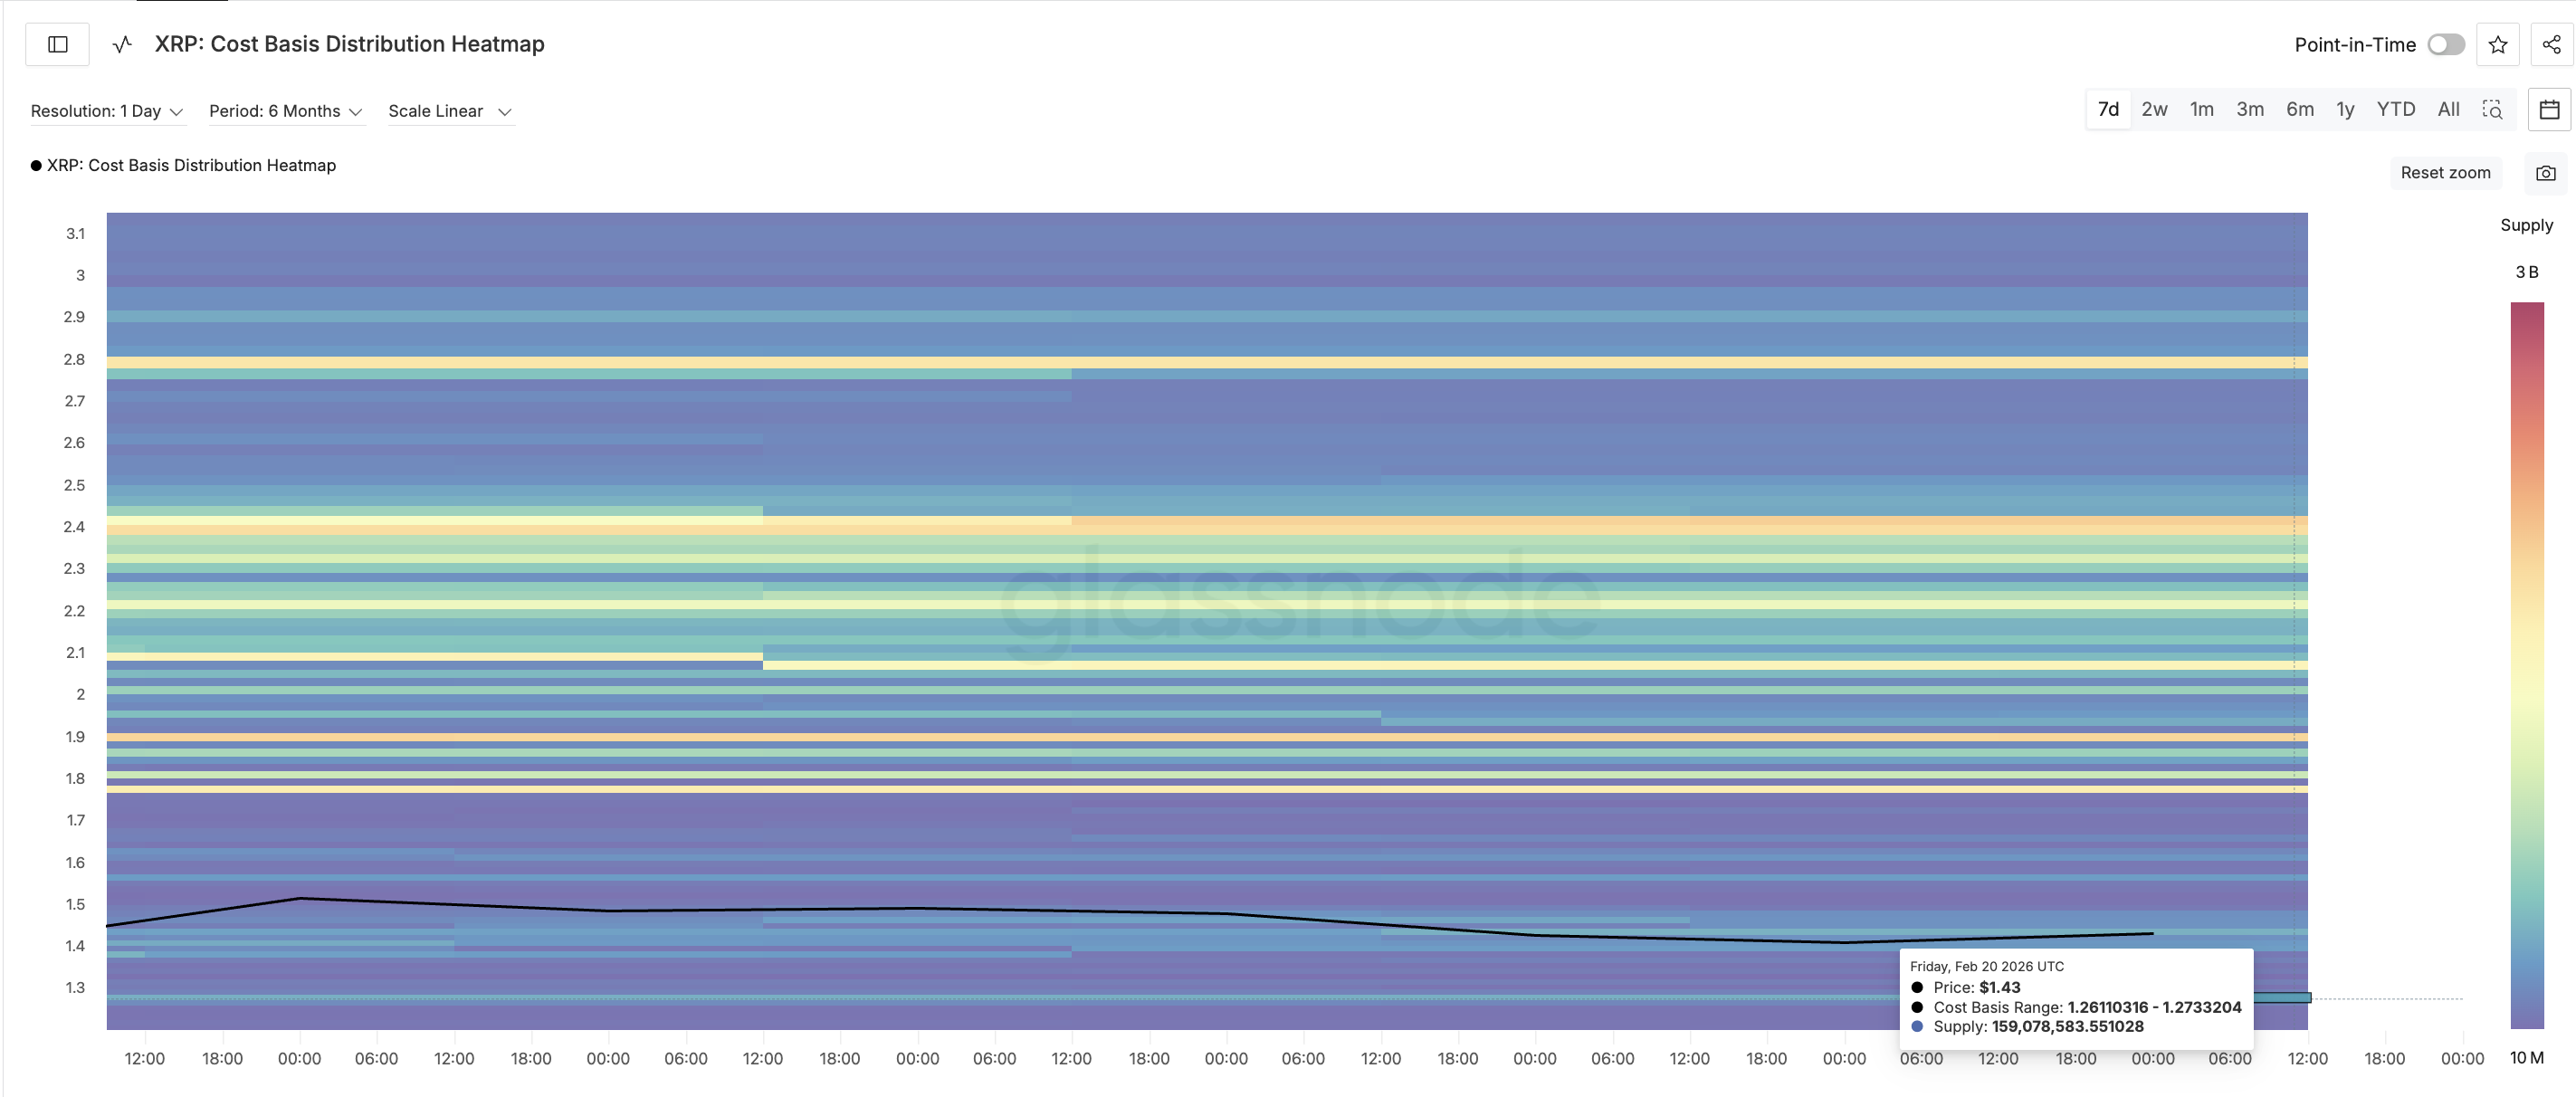
This is where a large number of holders bought XRP. As long as this level holds, the XRP price may avoid a deeper crash beyond 12% even if the immediate support zone at $1.35-$1.37 breaks.
However, if XRP falls below $1.26 ($1.259 on the chart), selling pressure could accelerate sharply. The next major downside levels would appear near $1.162 and $1.024.
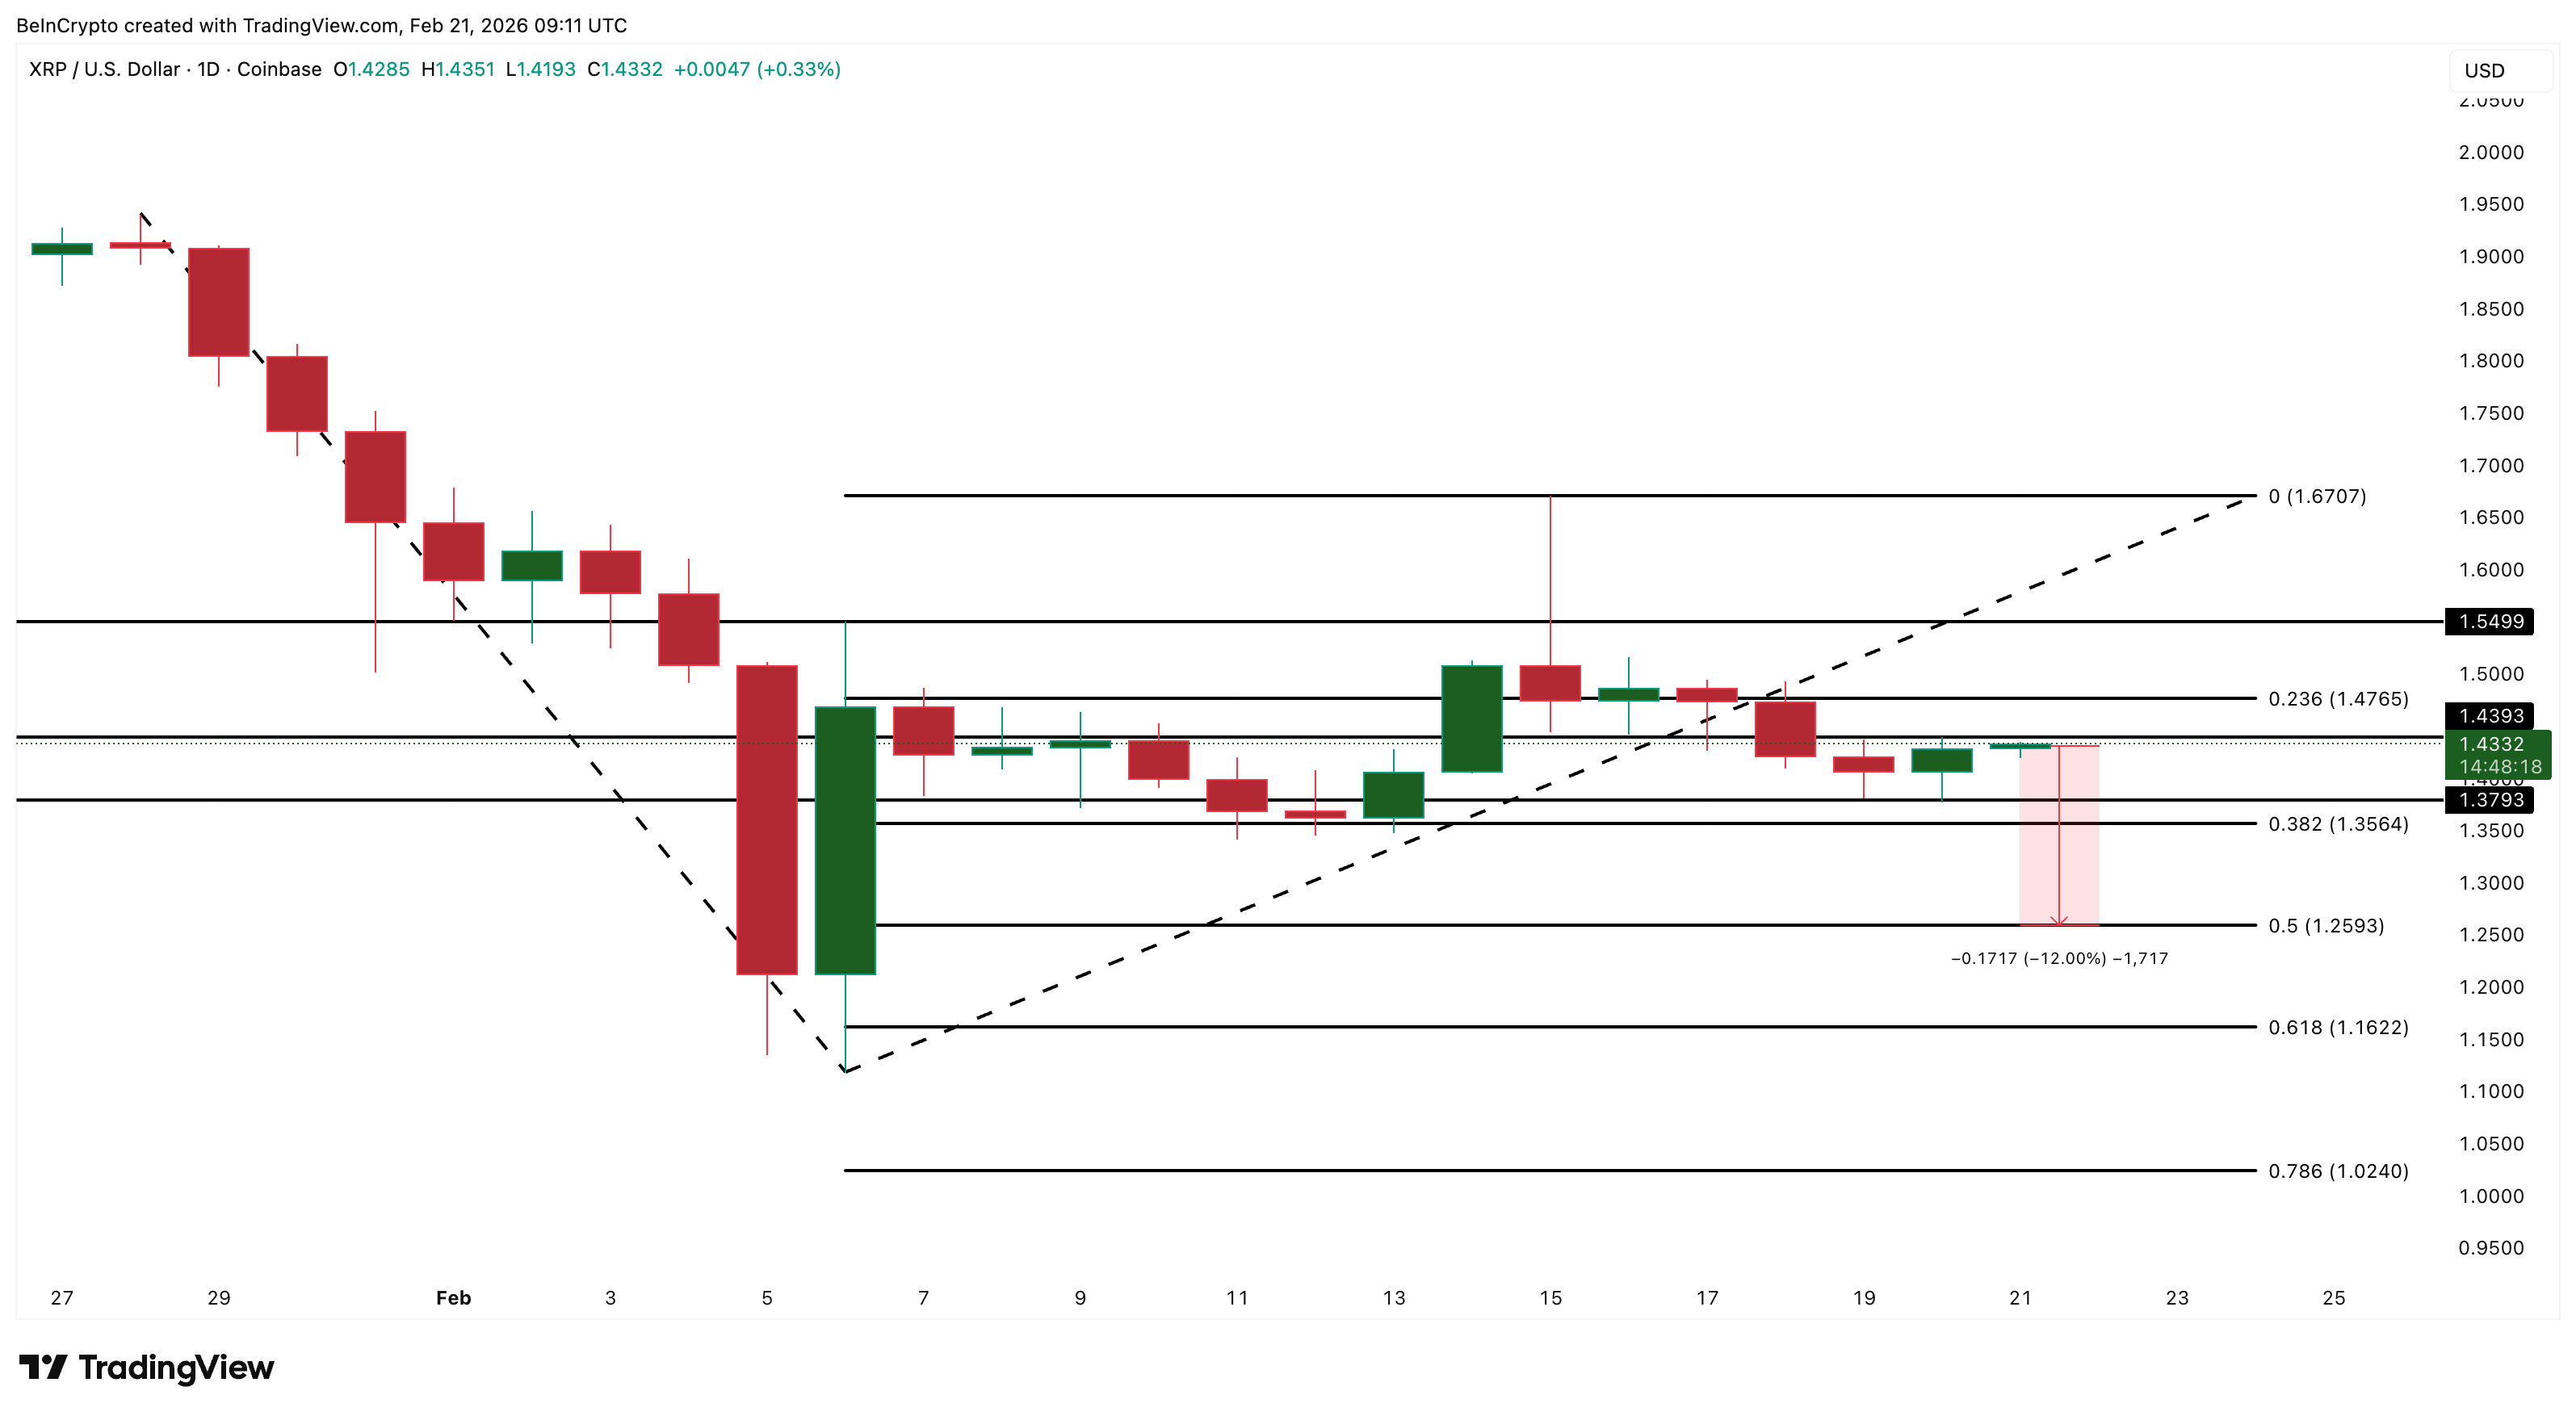
On the upside, XRP must first reclaim $1.439. A stronger recovery would require moves above $1.476 and $1.549. Only a breakout above $1.670 would fully cut the bearish momentum.
For now, XRP remains stuck between weakening institutional support and steady dip buying. ETF inflows are still positive, but falling rapidly.
Technical and on-chain signals show that $1.259 is now the most important level that could determine XRP’s next major move, especially if the bearish divergence and VWAP weakness continue to play out.

Crypto World
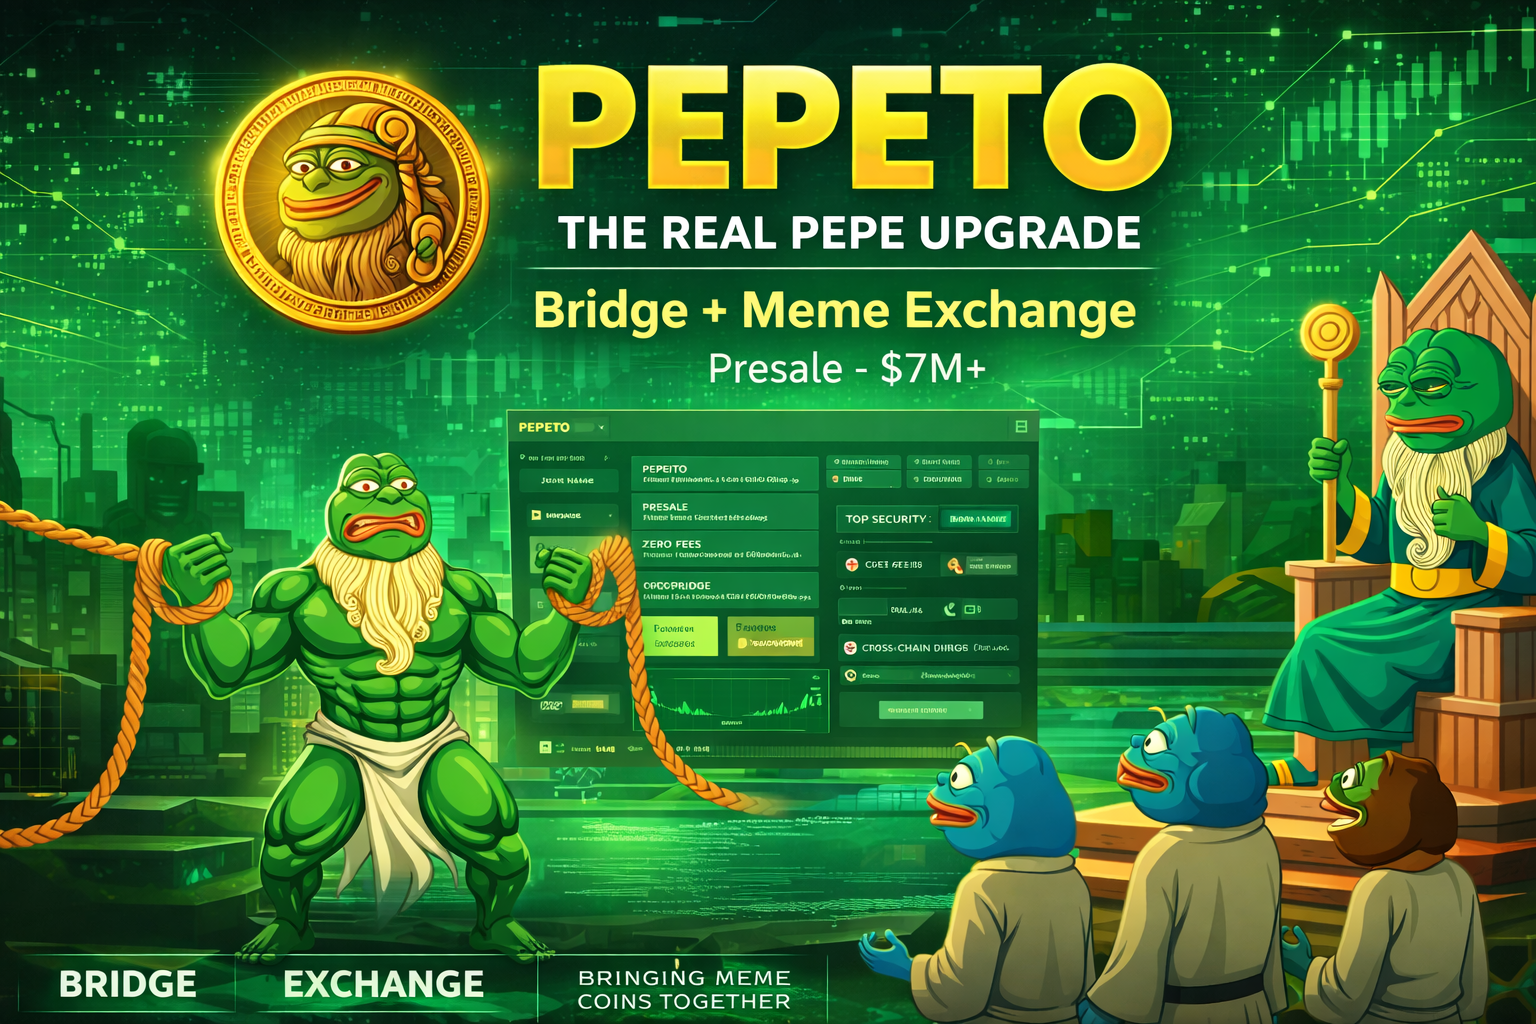
Pepeto Presale Surges Past $7M as Robinhood Tests Blockchain and Major Coins Crumble: Why Investors See a 300x Opportunity Here
Ever notice how the biggest opportunities show up when most people are too scared to look? That is exactly what is happening in crypto right now.
Robinhood just launched a blockchain testnet that processed 4 million transactions in its first week. Traditional finance is building deeper into crypto, not pulling back. At the same time, roughly $1 trillion was wiped from total crypto capitalization over recent months.
This disconnect between institutional building and retail fear creates a rare setup. And one presale is catching both crowds.

Pepeto: Investors Migrate for Utility and Explosive Upside
Traders and investors are actively moving toward projects that deliver actual usable tools instead of flashy promises. And Pepeto is at the center of that shift.
While most tokens fight to regain any kind of momentum in today’s volatile market, Pepeto offers something almost nobody else does at this stage: three working demo products. A cross chain swap, a bridge, and an exchange. Not concepts. Not wireframes. Working technology backed by dual audits from SolidProof and Coinsult.
Among these tools, the cross chain bridge stands out. Investors can move assets between blockchains without centralized intermediaries. That infrastructure turns Pepeto from a meme coin into something that could power an entire trading ecosystem.
Remember Pepecoin? It went from nothing to a $7 billion market cap. Zero products. Zero audits. Now imagine the same meme power plus working technology and a connection to the original Pepe cofounder.
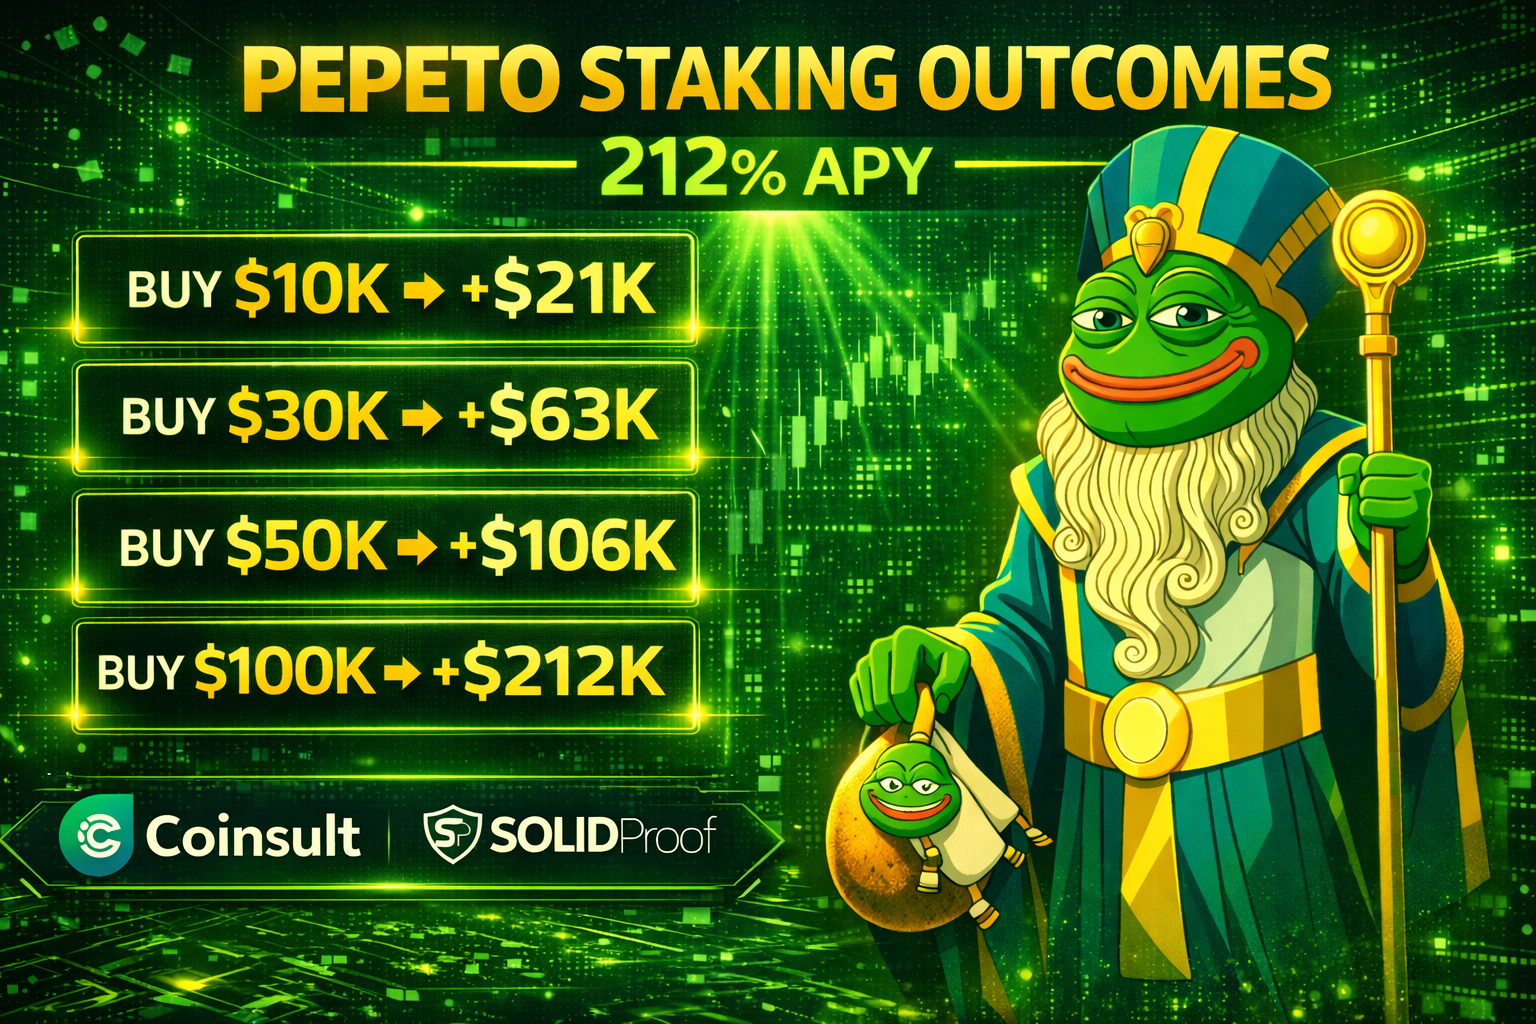
Pepeto has raised over $7.258M so far at a price of $0.000000185. The presale is over 70% filled. The tokenomics carry a 0% buy and sell tax. And staking at 212% APY means a $20,000 position would generate roughly $42,400 in annual staking rewards.
But here is what really matters for investors thinking bigger. Staking is a holding bonus. The real play is what happens to your position when listings hit. If Pepeto captures even a sliver of the meme coin market that turned PEPE into a multi billion dollar token, the math on a 100x to 300x return is not wishful thinking. It is pattern recognition.
By providing real utility during a period of peak fear, Pepeto positions early investors to benefit from both adoption driven growth and price surges once market conditions flip. The presale window will not stay open much longer.
Avalanche Teases Recovery as AVAX Pushes Above $9
AVAX pushed above $9 this week, climbing from $8.63 to roughly $9.34 by February 20. Not a dramatic surge, but it hints at traders testing the waters after heavy selling.
Solana Investors Eye $100 as SOL Consolidates Around $86
Solana rose modestly from $84 to $86 as it consolidates. A push toward $100 is on investors’ radar. Many are balancing SOL positions with early stage projects offering working tools, which is why Pepeto is drawing attention.
Conclusion
While the altcoin market searches for its footing, capital is flowing toward projects that prove they can deliver. That is where Pepeto stands out. Three demo products live. Dual audits complete. A community growing fast enough to remind you of the early days of every meme coin that went on to create millionaires.
In a market that rewards function over speculation, the presale window at $0.000000185 will not last. Act while it is still open.

Visit the official website to buy into the Pepeto Presale now, and visit X for the latest community updates.
FAQs
Why is Pepeto gaining traction while bigger tokens struggle? Pepeto combines meme coin energy with working infrastructure: a swap, bridge, and exchange. That mix of culture and utility is drawing investors away from tokens that only offer speculation.
How do Pepeto’s demo products work for presale buyers? Presale participants can test the cross chain swap, bridge, and exchange demos. This gives buyers a hands on look at the technology before full public launch.
Is the 212% staking APY the main reason to invest? Staking is a holding bonus, not the primary thesis. The real opportunity is the potential price multiple when Pepeto lists on exchanges and captures meme coin market share.
Disclaimer: This is a Press Release provided by a third party who is responsible for the content. Please conduct your own research before taking any action based on the content.

Crypto World
STRC Yield Play: How Fed Rate Cuts Could Drive Billions Into Strategy’s Bitcoin Machine

TLDR:
- STRC faces a major tailwind as U.S. money market funds lose $233.7 billion annually from a projected 300bps rate drop
- STRC pays 11.25% annually with $2.25 billion in cash reserves covering over 2.5 years of dividends at 5.6x overcollateralization
- A 0.5% rotation from money markets into STRC could generate $2–$4 billion, funding the purchase of up to 80,000 Bitcoin
- Strategy’s Bitcoin holdings could grow 13%–34% if STRC scales to $10–$20 billion in notional value by the year 2028
STRC, Strategy’s Variable Rate Series A Perpetual Preferred Stock, is drawing growing institutional attention as the Federal Reserve advances its rate-cutting cycle into 2026.
U.S. money market funds now hold $7.79 trillion, currently yielding between 4.5% and 5%. Analysts project yields on those funds could fall by 300 basis points.
That drop could push hundreds of billions toward high-yield alternatives. Trading near $100 par on Nasdaq and paying 11.25% annually, STRC stands positioned at that crossroads.
Fed Rate Cuts Threaten Hundreds of Billions in Annual Income
U.S. money market fund yields remain elevated from the prior rate-hiking cycle. However, the Fed has already moved 125 basis points into the current easing cycle, with markets pricing in another 75–100 basis points ahead.
Analysts expect front-end yields to compress toward 1%–2%, replicating the post-2008 and 2020 patterns.
A 300-basis-point decline across $7.79 trillion in money market assets equals roughly $233.7 billion in lost annual income.
Pensions, insurers, and corporate treasuries cannot simply absorb that loss. They are historically known to pursue higher-yielding alternatives when safe returns erode.
EPFR and McKinsey data indicate that for every 100-basis-point drop in short-term rates, alternative and high-yield vehicles see 10%–20% accelerated inflows within 12–18 months.
A 5%–10% rotation out of money markets alone could direct $390–$780 billion toward private credit, listed preferred stocks, and similar instruments.
STRC Positioned to Capture Institutional Yield Demand
STRC currently trades at $99.82 with an effective annual yield of 11.27%, paying dividends every month. Its notional value already stands at $3.458 billion. Average daily trading volume runs at approximately $128 million, reflecting growing market participation.
Analyst Adam Livingston wrote on X: “STRC sits at the perfect nexus because it’s liquid, high-yield, and structurally engineered to vacuum up the dumbest, most desperate money on Earth.”
He added that Strategy holds $2.25 billion in cash reserves, covering more than 2.5 years of dividends at 5.6 times overcollateralization.
If only 0.5% of projected capital rotation flows into STRC, that equals $2–$4 billion in new capital. At $100 par, that creates 20–40 million new shares issued. Proceeds from those shares go directly toward Strategy’s Bitcoin acquisition program.
Bitcoin Supply Could Face Pressure from STRC’s Expansion
Each $1 billion raised through STRC issuance allows Strategy to purchase approximately 14,700 Bitcoin at a $68,000 spot price.
A $4 billion capital inflow translates to roughly 58,800–80,000 additional Bitcoin removed from the open market.
Strategy currently holds 717,000 BTC. Analysts project STRC could scale to $10–$20 billion in notional value by 2028.
That growth range would add an estimated 95,000–242,000 Bitcoin to Strategy’s treasury, a 13%–34% increase in total holdings.
That accumulated buying would represent 8%–11% of annual Bitcoin issuance. Livingston noted: “Do that at scale and you’re talking supply-shock math that makes ETF inflows look quaint.”
Post-GFC private credit grew more than seven times as rate cuts redirected capital toward yield-bearing alternatives, and Bitcoin compounded sharply during each of those liquidity-driven periods.
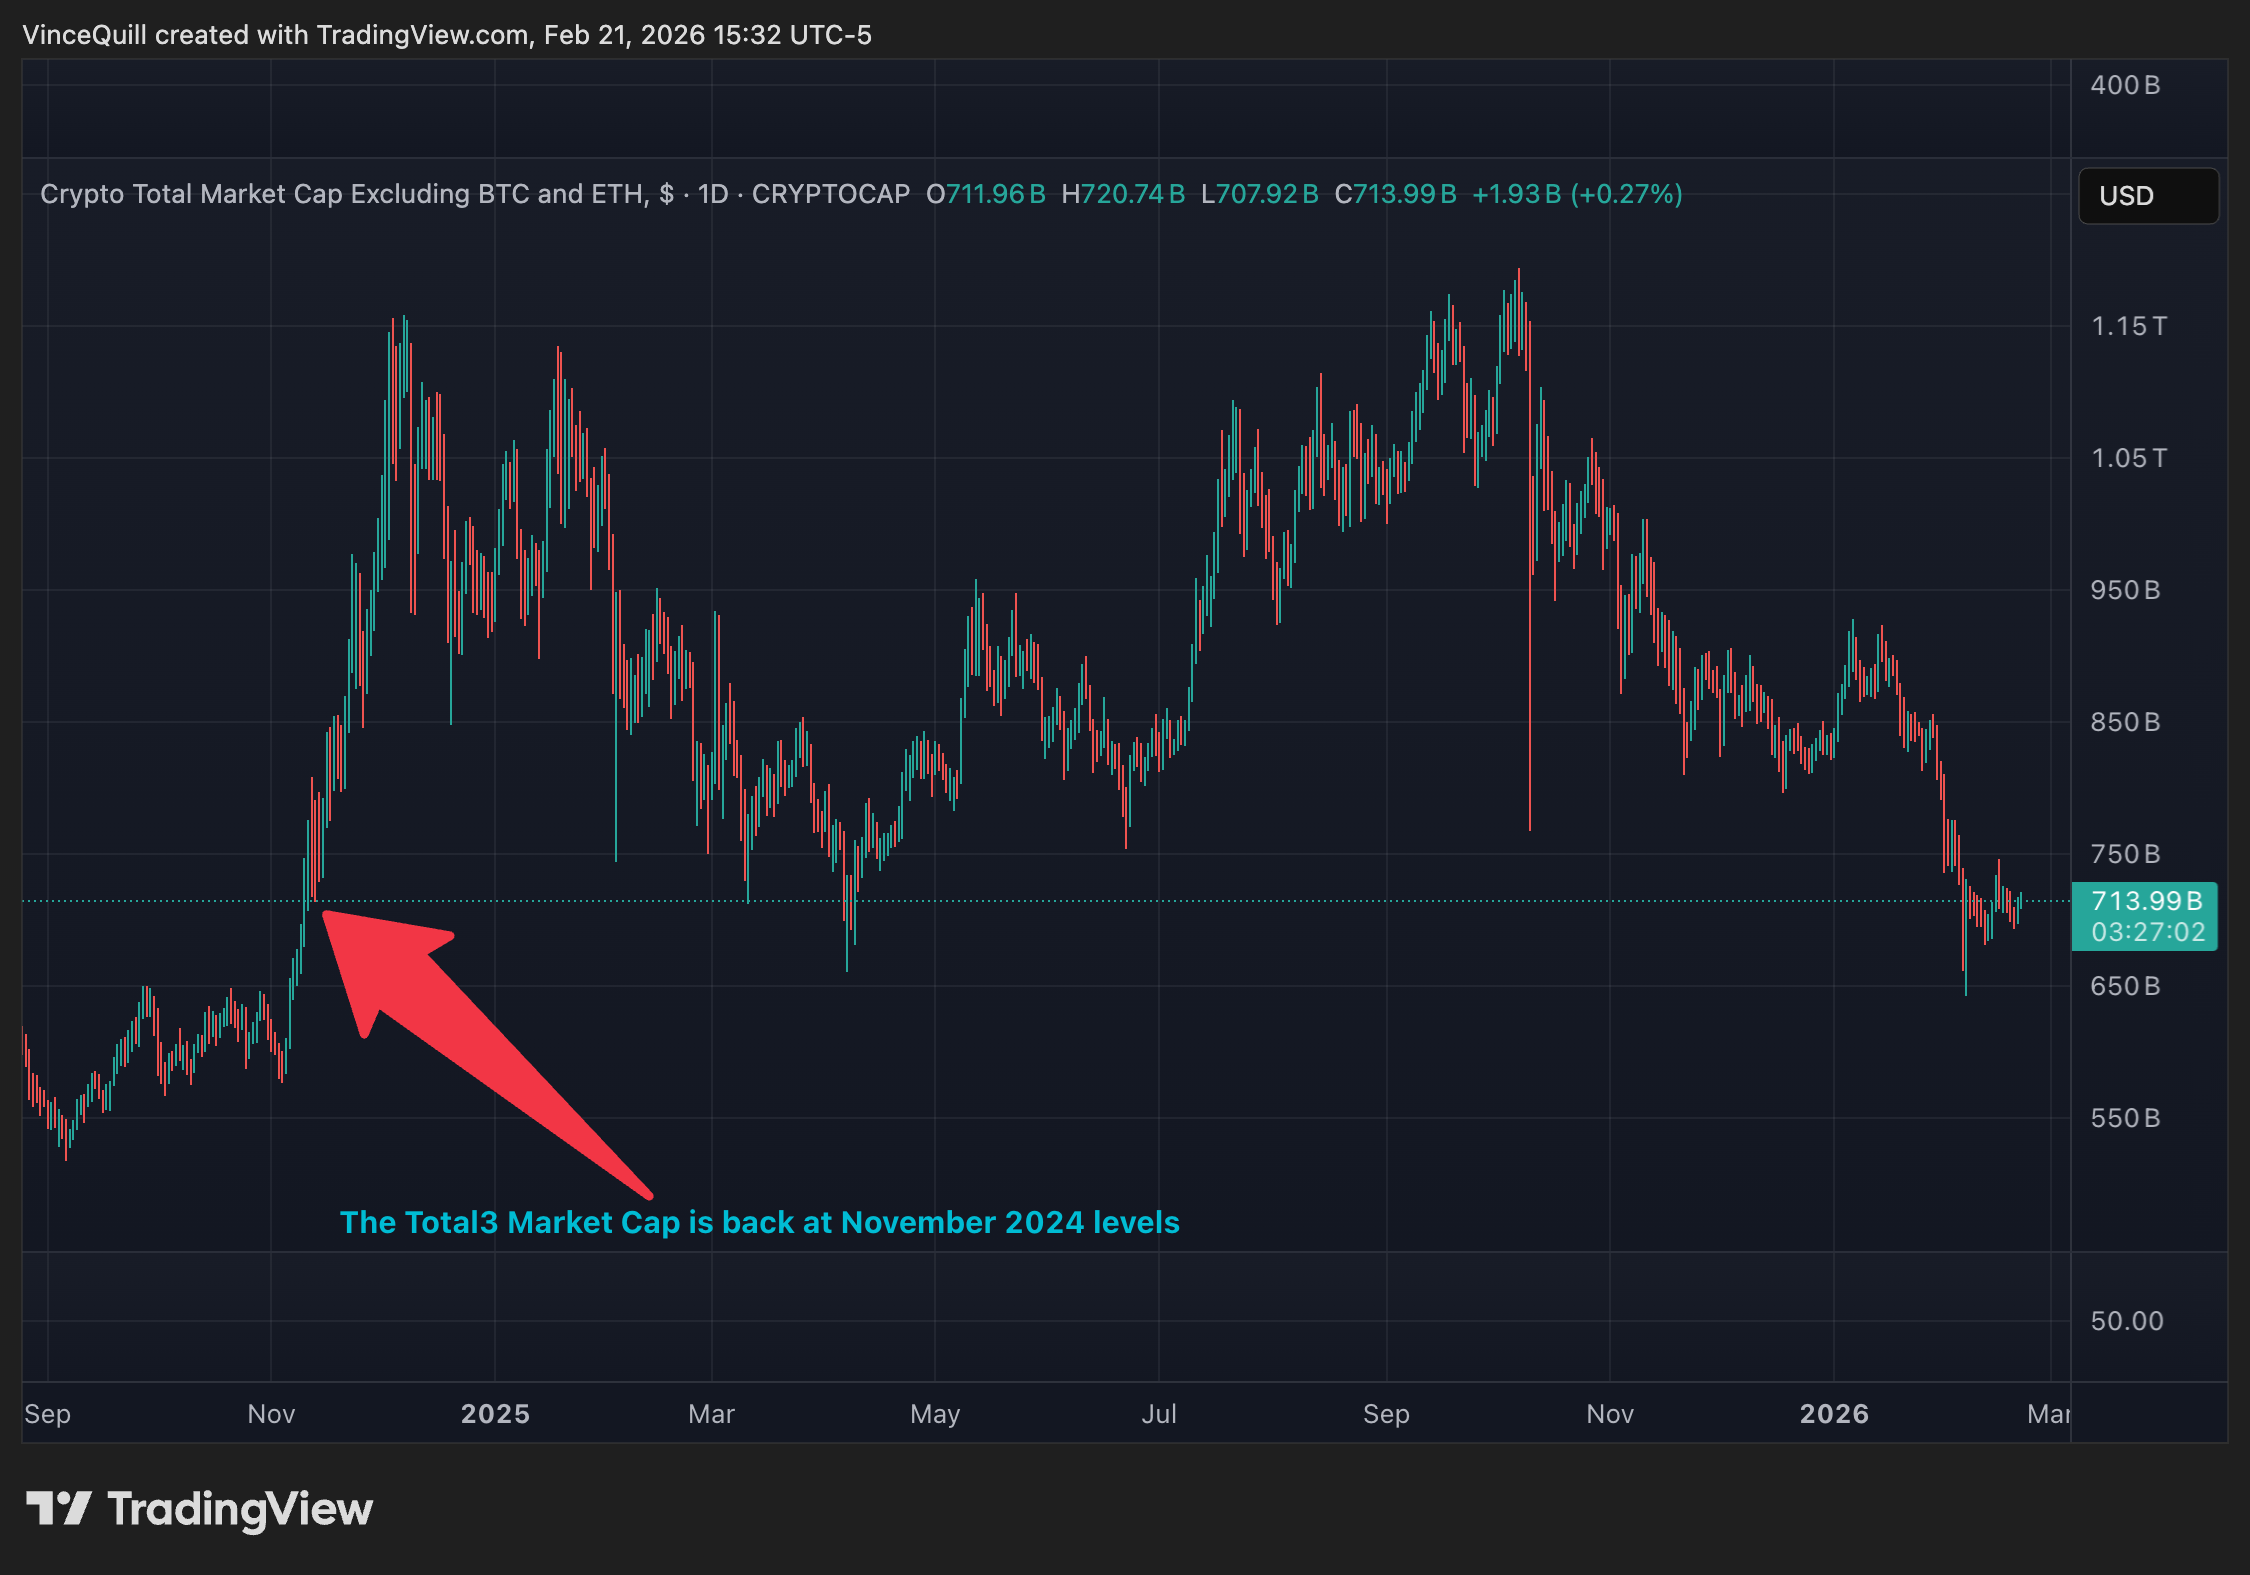
The crypto market has retracted most of the gains made during the 2024-2025 pump that kicked off after the 2024 elections in the United States, and has lost about 40% of its value from the peak recorded in October 2025.
The Total3 Market Cap, a metric tracking the market capitalization of the entire crypto market, excluding Ether (ETH) and Bitcoin (BTC), surged by over 91% immediately following the outcome of the US Presidential election on November 5, reaching a high of $1.16 trillion by December 2024.
For context, the Total3 Market Cap was about $600 billion directly before the 2024 US election pump.

The market then fell to the $900 billion range, with price whipsawing until January 2025, when the Total3 briefly climbed back up to $1.13 trillion on January 18 — two days before the inauguration of Donald Trump as president of the United States.
The crypto market continued to trade sideways for much of 2025, but finally hit a new peak of about $1.19 trillion in October 2025, days before a historic market crash broke the structural uptrend of the crypto sector.
The Total3 Market Cap is about $713 billion at the time of publication, around the same level it was on November 10, 2024, with the market showing no signs of a sustained recovery.
Related: Bitcoin most ‘undervalued’ since March 2023 at $20K, BTC price metric shows
Crypto staples like Bitcoin and Ether have also retraced most gains
BTC shed over 50% of its price from peak to trough during the market downturn, falling to a low of about $60,000 before staging a limited recovery to about $68,000.
The price of ETH also plummeted by about 60% from its all-time high of nearly $5,000, reached in August 2025.

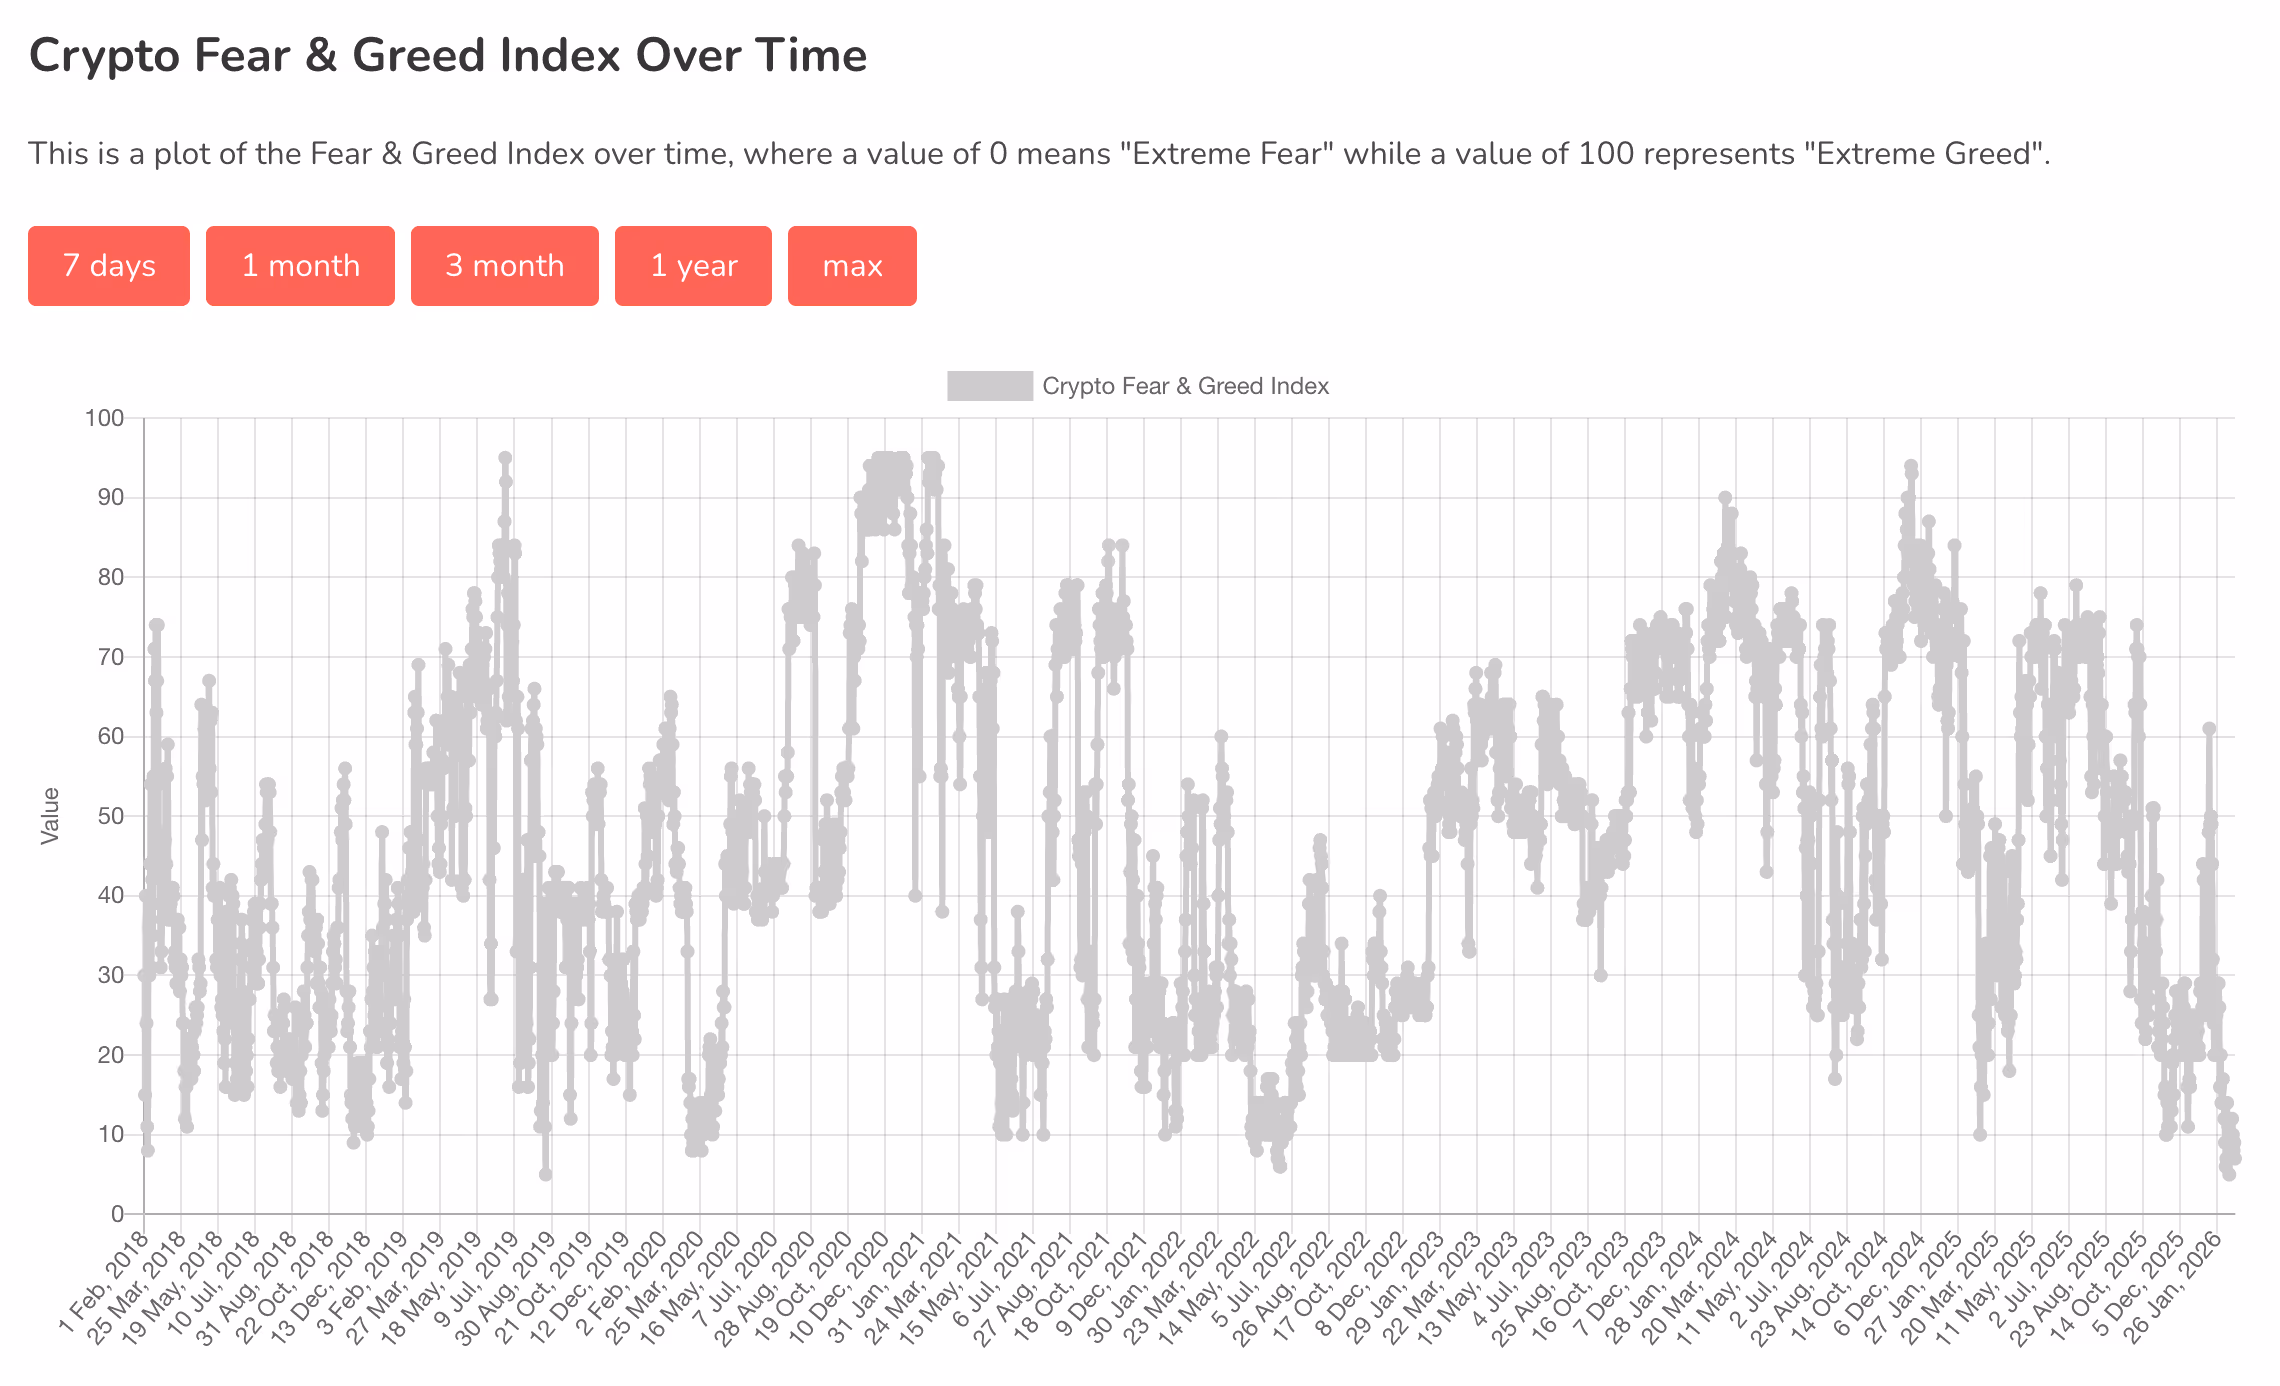
Crypto investor sentiment is also sitting at multi-year lows. The Fear and Greed Index, a sentiment tracker, is at 14 at the time of publication, indicating “extreme fear,” according to CoinMarketCap.
The indicator fell to a five on February 5. This is the lowest level recorded by the CoinMarketCap Fear & Greed Index, based on available data.
Magazine: If the crypto bull run is ending… it’s time to buy a Ferrari: Crypto Kid
Tariff politics collided with crypto markets this week after a Supreme Court decision constrained the White House’s authority to impose duties under the IEEPA, prompting President Donald Trump to unveil a new 10% global tariff. The legal setback, coming as lawmakers and think tanks weighed in on the economic impact, did little to quell debate about the proper scope of U.S. trade policy or its ripple effects on risk assets. In crypto circles, the reaction was nuanced: bitcoin and wider digital-asset markets showed resilience, with BTC gaining ground even as traditional markets wrestled with the policy signal. The episode underscores how policy shifts in traditional finance can still shape sentiment and price action in decentralized markets.
Key takeaways
- The Supreme Court struck down Trump’s authority to levy tariffs under IEEPA, creating a constitutional and legal constraint on the administration’s tariff toolbox.
- Officials nevertheless announced a new 10% global tariff, layering the fresh measure on top of existing duties and signaling a broader protectionist posture.
- Crypto markets exhibited relative stability, with bitcoin (CRYPTO: BTC) rising about 3% following the tariff news, while the broader market showed limited movement.
- Critics, including Rand Paul and Ro Khanna, described the tariffs as a tax on workers and small businesses, framing them as a costful component of a contested trade strategy.
- A pro-crypto attorney cautioned that the legal scope for global tariffs remains constrained, suggesting long-run policy risks even if immediate moves appear limited in scope.
Tickers mentioned: $BTC
Sentiment: Neutral
Price impact: Positive. Bitcoin rose roughly 3% in response to the tariff announcements, even as other risk-on assets showed caution.
Trading idea (Not Financial Advice): Hold. The policy environment remains uncertain, and crypto prices have shown sensitivity to headlines without committing to a sustained directional move.
Market context: The tariff developments arrive amid ongoing shifts in risk sentiment, liquidity dynamics, and regulatory scrutiny that continue to shape crypto market behavior in a macro backdrop characterized by policy flux and evolving trade talks.
Why it matters
The Supreme Court’s ruling on IEEPA limited the executive branch’s ability to unilaterally deploy tariffs, a development watched closely by policymakers and markets alike. While the court’s decision constrains authority, the administration signaled a readiness to implement a 10% global tariff, a move that critics say could intensify costs for consumers and disrupt supply chains. The divergence between judicial constraints and executive intent creates a nuanced policy landscape that investors must monitor closely, particularly for asset classes with heightened sensitivity to macro shocks and regulatory signals.
Within the crypto ecosystem, the immediate price reaction was modest but notable. Bitcoin, often viewed as a risk-on barometer in times of policy uncertainty, posted a roughly 3% uptick after the tariff news, illustrating that crypto markets can decouple from traditional equities for short stretches or interpret policy announcements through a crypto-positive lens. The broader crypto market, as tracked by aggregate indicators, showed limited dispersion, suggesting that traders were weighing longer-run implications rather than chasing sharp short-term moves. This is consistent with a market that has learned to price in policy noise without overreacting to every headline.
Reactions from lawmakers and think tanks highlighted the political fault lines surrounding tariff policy. Rand Paul framed the tariffs as a tax transfer, arguing they burden working families and small businesses to fund a broader trade conflict. Ro Khanna countered that the measures aren’t about national security but about shouldering domestic costs for political ends. These voices underscore the partisan and ideological dimensions of tariff moves, which may shape future trade negotiations and regulatory trajectories that could indirectly affect crypto markets through volatility spillovers or shifts in capital flows.
Industry observers at policy think tanks and legal circles have also weighed in on the scope of presidential authority. Scott Lincicome of the Cato Institute cautioned that even in the absence of IEEPA, other statutes and political commitments could sustain a higher-tariff regime over time, with potential knock-on effects on economic performance and foreign relations. The tension between legal constraints and political ambitions illustrates a longer-running risk for markets that rely on predictability and stable policy environments to price risk accurately. In crypto markets, such a backdrop can intensify volatility during headlines while offering a resilience story when headlines become noise rather than signal.
Beyond these developments, market participants have tracked related coverage that suggests ongoing debates about how policy shocks could influence crypto-specific mechanics. For instance, separate analyses have discussed how policy shifts interact with crypto fear and greed metrics and how any perceived refund or relief discussions could alter risk sentiment in the near term. While the immediate moves in digital assets may appear modest, the longer arc remains tied to regulatory clarity, fiscal policy, and the evolving synchronization (or lack thereof) between traditional and decentralized financial systems.
What to watch next
- Follow any formal steps or commentary detailing the 10% global tariff’s implementation timeline and scope, including affected sectors and countries.
- Monitor potential legal challenges or administrative changes that could further constrain or expand tariff authority beyond IEEPA’s current framework.
- Watch crypto market liquidity and volatility in the wake of policy signals, especially any sustained moves in bitcoin and ether (CRYPTO: ETH) as policy headlines evolve.
- Track any discussions or proposals around tariff-related refunds or relief measures that could influence investor sentiment and capital allocation to crypto assets.
- Observe policymakers’ additional statements and regulatory steps that could affect risk appetite and cross-asset correlations in the weeks ahead.
Sources & verification
- Supreme Court ruling on tariffs and the IEEPA framework: cointelegraph.com/news/scotus-strikes-trump-tariffs-alternative-plan
- Trump expands with a 10% global tariff announcement: cointelegraph.com/news/trump-10-global-tariff-scotus-ruling
- Rand Paul on tariff policies: x.com/SenRandPaul/status/2024983414110085181
- Ro Khanna’s position on tariffs: x.com/RepRoKhanna/status/2024873957296337219
- Bitcoin price context and market response: cointelegraph.com/bitcoin-price
- Total3 market-cap indicator reference: https://www.tradingview.com/chart/g7xkPkTa/?symbol=CRYPTOCAP%3ATOTAL3
- Related coverage on crypto-market reactions to tariffs and refunds: cointelegraph.com/news/bitcoin-ignores-us-supreme-court-trump-tariff-strike-amid-talk-of-150b-refund
Tariffs, the Supreme Court ruling and crypto markets: the resilience test for Bitcoin and beyond
Bitcoin (CRYPTO: BTC) and its peers are again being tested by a combination of regulatory signals and geopolitical policy moves that bleed into the risk spectrum. The Supreme Court’s decision narrows executive latitude on punitive duties, but the administration’s follow-up announcement of a 10% global tariff demonstrates a continued willingness to use trade policy as a lever. The duality—legal constraint paired with policy intent—creates a bifurcated environment for markets: one where the rule of law structures potential actions, and another where political calculations determine timing and scale.
From a price perspective, the immediate reaction in digital assets was not dramatic, but notable for its direction. Bitcoin rose by roughly 3% in the wake of the tariff news, suggesting that some participants view crypto as a hedge or at least as a diversification option amid policy uncertainty. At the same time, broader market indicators showed muted responses, with the Total3 index hovering near prior levels, indicating that the overall crypto market did not exhibit a broad, abrupt shift in risk-on or risk-off sentiment in the immediate aftermath. This decoupling—where single-asset moves diverge from the wider market—highlights the nuance of crypto market dynamics in a policy-driven environment.
Industry voices have framed the tariff moves in distinctly different terms. Rand Paul described the tariffs as a tax transfer that harms working families and small businesses, underscoring the domestic economic costs of what he characterized as a reckless trade policy. Ro Khanna offered a counterpoint, emphasizing that the measures were not focused on national security but rather on domestic fiscal calculations that may burden consumers and small enterprises. In parallel, a prominent pro-crypto attorney noted that the legal scope of the president’s authority remains constrained by statutory limits, which could temper the medium-term impact of new tariffs if challenged or narrowed in subsequent fiscal cycles.
Looking ahead, market watchers will be closely tracking whether these tariff moves translate into concrete policy actions beyond headlines. A sustained higher-tariff regime could influence corporate investment, supply chain strategies, and cross-border capital flows—factors that, in turn, feed into crypto market sentiment and liquidity. Investors should also watch for any shifts in regulatory posture or fiscal relief discussions that might dampen or amplify the observed price responses in Bitcoin and other digital assets. The story remains fluid, with policy debates continuing to shape risk tolerance and the calculus of hedging across traditional and decentralized markets.


Ethereum co-founder Vitalik Buterin identified limits to human attention as the core problem plaguing decentralized autonomous organizations (DAOs) and democratic governance systems.
Summary
- Buterin says limited human attention is DAOs’ core governance flaw.
- Personal AI agents could vote using user preferences and context.
- Suggestion markets and MPC may improve privacy and decisions.
Writing on X, Buterin argued that participants face thousands of decisions across multiple domains of expertise without sufficient time or skill to evaluate them properly.
The usual solution of delegation creates disempowerment where a small group controls decision-making while supporters have no influence after clicking the delegate button.
Buterin proposed personal large language models as the solution to the attention problem and shared four approaches. Personal governance agents, public conversation agents, suggestion markets, and privacy-preserving multi-party computation for sensitive decisions.
Personal LLMs can vote based on preferences
Personal governance agents would perform all necessary votes based on preferences inferred from personal writing, conversation history, and direct statements.
When the agent faces uncertainty about voting preferences and considers an issue important, it should ask the user directly while providing all relevant context.
Public conversation agents would aggregate information from many participants before giving each person or their LLM a chance to respond.
The system would summarize individual views, convert them into shareable formats without exposing private information, and identify commonalities between inputs similar to LLM-enhanced Polis systems.
Buterin noted that good decisions cannot come from “a linear process of taking people’s views that are based only on their own information, and averaging them (even quadratically).” “Processes must aggregate collective information first, then allow informed responses.
Suggestion markets could surface high-quality proposals
Governance mechanisms valuing high-quality inputs could implement prediction markets where anyone submits proposals while AI agents bet on tokens. When the mechanism accepts the input, it pays out to token holders.
The approach applies to proposals, arguments, or any conversation units the system passes along to participants. The market structure creates financial incentives for surfacing valuable contributions.
Decentralized governance fails when important decisions need secret information, Buterin argued. Organizations generally handle adversarial conflicts, internal disputes, and compensation decisions by appointing individuals with great power.
Multi-party computation using trusted execution environments could incorporate many people’s inputs without compromising privacy.
“You submit your personal LLM into a black box, the LLM sees private info, it makes a judgement based on that, and it outputs only that judgement,” Buterin explained.
Privacy protection becomes important as participants submit larger inputs containing more personal information. Anonymity needs zero-knowledge proofs, which Buterin said should be built into all governance tools.


Data from Santiment shows new wallet creation rising even as prices slump, hinting network curiosity hasn’t faded with sentiment yet.
The price of Solana’s native SOL token is near $84, after a steep, multi-month slide that erased nearly 67% from its September 2025 all-time high, with new on-chain data and community debates pointing to a network under strain.
The mixed signals matter because they show a split between falling market sentiment and activity metrics that suggest users have not abandoned the chain.
Security Patch Delays and Infrastructure Concerns
A February 19 report from Santiment noted that a significant source of recent frustration for the Solana community stems from a critical security scare in January. Client maintainers urged validators to upgrade to Agave/Jito v3.0.14 after disclosing vulnerabilities that could crash nodes and threaten consensus integrity.
Tim Garcia of the Solana Foundation urged operators to update quickly, but reports at the time said over half of validators were still on older versions, exposing the chain to potential risks.
This operational friction resurfaced in February when a network disruption rerouted U.S. traffic through Europe and Asia. While infrastructure providers like DoubleZero noted that such rerouting is a normal part of internet networking, for validators operating a high-speed chain, milliseconds matter.
These events have forced the market to pay closer attention to how smoothly Solana’s decentralized validator set can respond to pressure, as that response directly affects uptime and the safety of funds moving through DeFi.
The uncertainty is reflecting on SOL’s price, which earlier in the month fell 25% in a week to about $96, with analysts such as Ali Martinez warning that losing the $100 zone could open a path toward $74 or even $50.
You may also like:
At the time of writing, the asset was trading around the $84 level, down about 35% over the past month and more than 51% year-on-year. Shorter time frames show mild relief, with gains near 3% in 24 hours and about 6% in seven days, per CoinGecko data.
Technical indicators remain mixed. Some traders say a breakdown near $80 confirmed a bearish chart pattern, while others see a shorter-term setup that could push prices back toward $114 if resistance clears. Santiment added that deeply negative funding rates suggest many traders are betting against SOL, a setup that sometimes comes right before short squeezes.
Activity Growth Contrasts With Fading Hype
Despite the price pressure, Santiment reported rising daily wallet creation in February. That metric tracks new addresses interacting with the network and suggests ongoing user interest even in the face of weakening sentiment.
Exchange data also shows outflows exceeding inflows in recent weeks, a sign that some holders are moving tokens off trading platforms rather than preparing to sell.
Nevertheless, the current mood contrasts with earlier cycles that defined Solana’s culture. According to Santiment, traders still reference past events such as NFT booms, meme coin launches, and exchange-related shocks that once dominated online discussion.
More recently, app builder Zora shifted a new product from Base to Solana, charging about 1 SOL per creation, which sparked debate about incentives but also signaled ongoing developer interest.
Ultimately, Solana’s is a layered picture, with prices and online attention having fallen since late 2025, yet new wallets, active builders, and crowded short positions showing that participation has not disappeared.
SECRET PARTNERSHIP BONUS for CryptoPotato readers: Use this link to register and unlock $1,500 in exclusive BingX Exchange rewards (limited time offer).
TLDR:
- Vitalik Buterin argues AI used correctly can empower democratic governance rather than centralize control over it.
- Personal AI agents could vote on a user’s behalf by learning from their writing, history, and stated preferences.
- Public conversation tools can aggregate views across many participants before asking them to weigh in on decisions.
- Multi-party computation allows private governance decisions without exposing sensitive data to any single participant.
AI governance is at the center of a fresh discussion sparked by Ethereum co-founder Vitalik Buterin. He argues that AI, when applied correctly, can push democratic and decentralized governance forward rather than replace it.
His post addresses a long-standing problem: most people lack the time to participate meaningfully in governance decisions.
With thousands of choices across many domains, the current model of delegation concentrates power in too few hands.
Personal AI Agents Could Reshape How People Vote
Buterin proposes using personal large language models to handle the attention problem in decentralized governance.
A personal governance agent could cast votes on a user’s behalf by studying their writing, conversations, and stated preferences. This approach keeps individuals connected to decision-making without requiring constant attention.
When an agent is unsure how a person would vote on a given issue, it would pause and ask them directly. It would also provide all relevant context before prompting any response. This design avoids blind delegation and keeps the individual informed on matters that count.
The model differs sharply from current delegation systems, where supporters often lose influence after pressing a single button.
A personal agent maintains ongoing alignment with the user’s values. It acts as a filter rather than a replacement for human judgment.
Public Conversation Tools Can Aggregate Views More Accurately
Buterin also raises concerns about how collective decisions are currently formed. Simply averaging people’s views based on their own limited information does not produce well-informed outcomes.
A better process would gather and combine information across many participants before asking them to respond.
He points to tools like LLM-enhanced versions of pol.is as one direction worth pursuing. These systems summarize what people have in common based on their actual words. They can surface shared ground that might otherwise stay hidden in large groups.
Additionally, a public conversation agent could translate a person’s views into a shareable format without exposing private details.
This makes broader participation possible without forcing individuals to be publicly identifiable. Anonymity tools using zero-knowledge proofs could support this further.
Multi-Party Computation Addresses Private Decision-Making
One major weakness of democratic governance is its struggle with confidential information. Negotiations, internal disputes, and compensation decisions often require secrecy that open voting cannot provide. Buterin suggests multi-party computation as a technical solution to this tension.
Under this model, a participant’s personal LLM would enter a secure environment, review private data, and output only a judgment.
Neither the participant nor anyone else would see the private information itself. Trusted Execution Environments, or TEEs, have already demonstrated this approach in practice.
Buterin also calls for greater use of garbled circuits to achieve pure cryptographic security in at least two-party cases.
Privacy, he notes, must cover both participant anonymity and the contents of their inputs. Zero-knowledge proofs and multi-party techniques together form the foundation he envisions for this system.
TLDR:
- The SEC reduced the stablecoin capital haircut from 100% to 2%, in line with money market fund treatment.
- Broker-dealers previously needed $2 million in capital reserves just to hold $1 million in stablecoins.
- The rule change allows regulated firms to use stablecoins for settlement, collateral, and tokenized assets.
- Lower capital requirements are expected to drive broader institutional demand and stablecoin adoption in 2026.
Stablecoins have cleared a major regulatory hurdle in 2026. The U.S. Securities and Exchange Commission revised capital treatment rules for broker-dealers holding stablecoins.
Previously, firms faced a 100% haircut on stablecoin holdings, making institutional use prohibitively costly. The SEC now aligns stablecoin treatment with money market funds at a 2% haircut.
This change removes a long-standing barrier for regulated institutions looking to adopt stablecoins in daily operations.
SEC Cuts Capital Burden on Broker-Dealers
Under the old framework, broker-dealers faced a steep capital penalty for holding stablecoins. A 100% haircut meant every dollar in stablecoins required an equal dollar set aside.
A firm holding $1 million in stablecoins effectively locked up $2 million in balance sheet capacity. That structure made stablecoins costly and unattractive for regulated financial institutions.
This arrangement gave Wall Street little reason to integrate stablecoins into daily operations. The capital cost far outweighed any operational benefit stablecoins could realistically offer.
Consequently, traditional finance largely stayed away from stablecoin use under these rules. Regulated broker-dealers could not incorporate them without visibly straining their capital ratios.
Crypto market commentary account Bull Theory addressed the change directly in a post. “The SEC has changed the rules, which forced Wall Street to need $2 million in capital to hold $1 million in stablecoins,” the account stated.
The revised haircut now stands at 2%, consistent with money market fund treatment. Firms now set aside only a small buffer rather than freezing the full amount.
This correction makes stablecoins balance sheet friendly for the first time under U.S. regulatory rules. Broker-dealers can now hold stablecoins without straining their capital positions or compliance standings.
The change applies broadly across regulated institutions operating in traditional finance. It stands as one of the most practical regulatory adjustments for crypto in 2026.
Stablecoin Integration Into Traditional Finance Now More Viable
With the capital burden reduced, broker-dealers can bring stablecoins into everyday institutional workflows. Settlement, collateral transfers, and tokenized treasury transactions all become accessible for regulated firms.
These are standard financial functions that previously excluded stablecoin participation entirely. The revised rule opens those operational pathways directly to Wall Street.
Stablecoins have long served as the bridge between traditional finance and crypto markets. That bridge becomes far more functional when institutions can cross it without a capital penalty.
Greater institutional participation strengthens stablecoins as core financial infrastructure over time. Demand grows as more firms incorporate stablecoins into routine operations.
More demand for stablecoins also supports broader crypto market activity going forward. Settlement becomes more efficient when institutions move stablecoins freely across platforms.
On-chain transactions grow more practical for regulated entities operating at meaningful scale. The crypto market gains a more reliable and institutional-grade liquidity layer as adoption expands.
This regulatory shift did not expand the risk profile of crypto for institutions. Rather, it corrected a disproportionate treatment inconsistent with comparable low-risk financial instruments.
Stablecoins backed by short-term assets were previously treated far more harshly than similar products. The 2% haircut now aligns regulatory treatment with the actual financial risk stablecoins carry.
Bitcoin’s violent selloff earlier this month may be giving way to a late-stage bear market phase, but investors shouldn’t expect a quick recovery, according to Vetle Lunde, head of research at K33.
“Current conditions closely resemble late September and mid November 2022, periods near the bear market bottom that were followed by extended consolidation,” he wrote.
At that time, bitcoin languished between $15,000 and $20,000, some 70% below its 2021 peak.
Now, bitcoin has settled into a quieter range between $65,000 and $70,000, and K33 Research’s regime model — which combines derivatives data, ETF flows, technical signals and macro signals — suggests the market is approaching a cyclical trough.
The quiet grind
One of the signs of the quiet consolidation period is that trading activity has dropped markedly, with speculative excess thoroughly flushed out.
Spot volumes fell 59% week-over-week, the K33 report noted. Meanwhile, perpetual futures open interest slid to a four-month low, and funding rates remained negative across the board.
That kind of cool-off period is typical after heavy liquidation cascades as market participants digest losses and reset positioning, Lunde said.
Meanwhile, U.S.-listed bitcoin ETFs have seen a record peak-to-trough decline in exposure of 103,113 BTC since early October. Even so, Lunde noted that, given BTC has retraced nearly 50%, more than 90% of the peak exposure in bitcoin terms remains.
Sentiment gauges also paint a bleak picture, with the “Crypto Fear and Greed” Index plunging to an all-time low of 5 last week and languishing below 10 for most of this past week.

Long-term value area
What does this all mean? Bitcoin is “likely near, or at, a global bottom but set for a prolonged consolidation between $60,000 and $75,000,” according to Lunde. Similar historical regimes have delivered muted returns
Still, for investors with a long-term view, the current levels are attractive for accumulation, though patience may be required, he argued.
James Check, an onchain analyst and co-founder of Checkonchain, also noted that bitcoin’s sideways periods are an opportunity for positioning.
He said that bitcoin, most of the time, “does nothing,” and then tends to move in sharp repricing bursts rather than steady trends. Those explosive phases are often concentrated in a handful of trading days, frequently early in a bull cycle and again toward the later stages.
“It does nothing most of the time, and then sometimes it goes up 100% in a quarter, and if you’re not there for that quarter, you kind of miss the whole run.”
He cautioned investors against trying to perfectly time tops and bottoms as they often miss the initial surge.
In other words, prolonged consolidation may feel frustrating, but historically the market has rewarded patient positioning rather than nailing the timing.
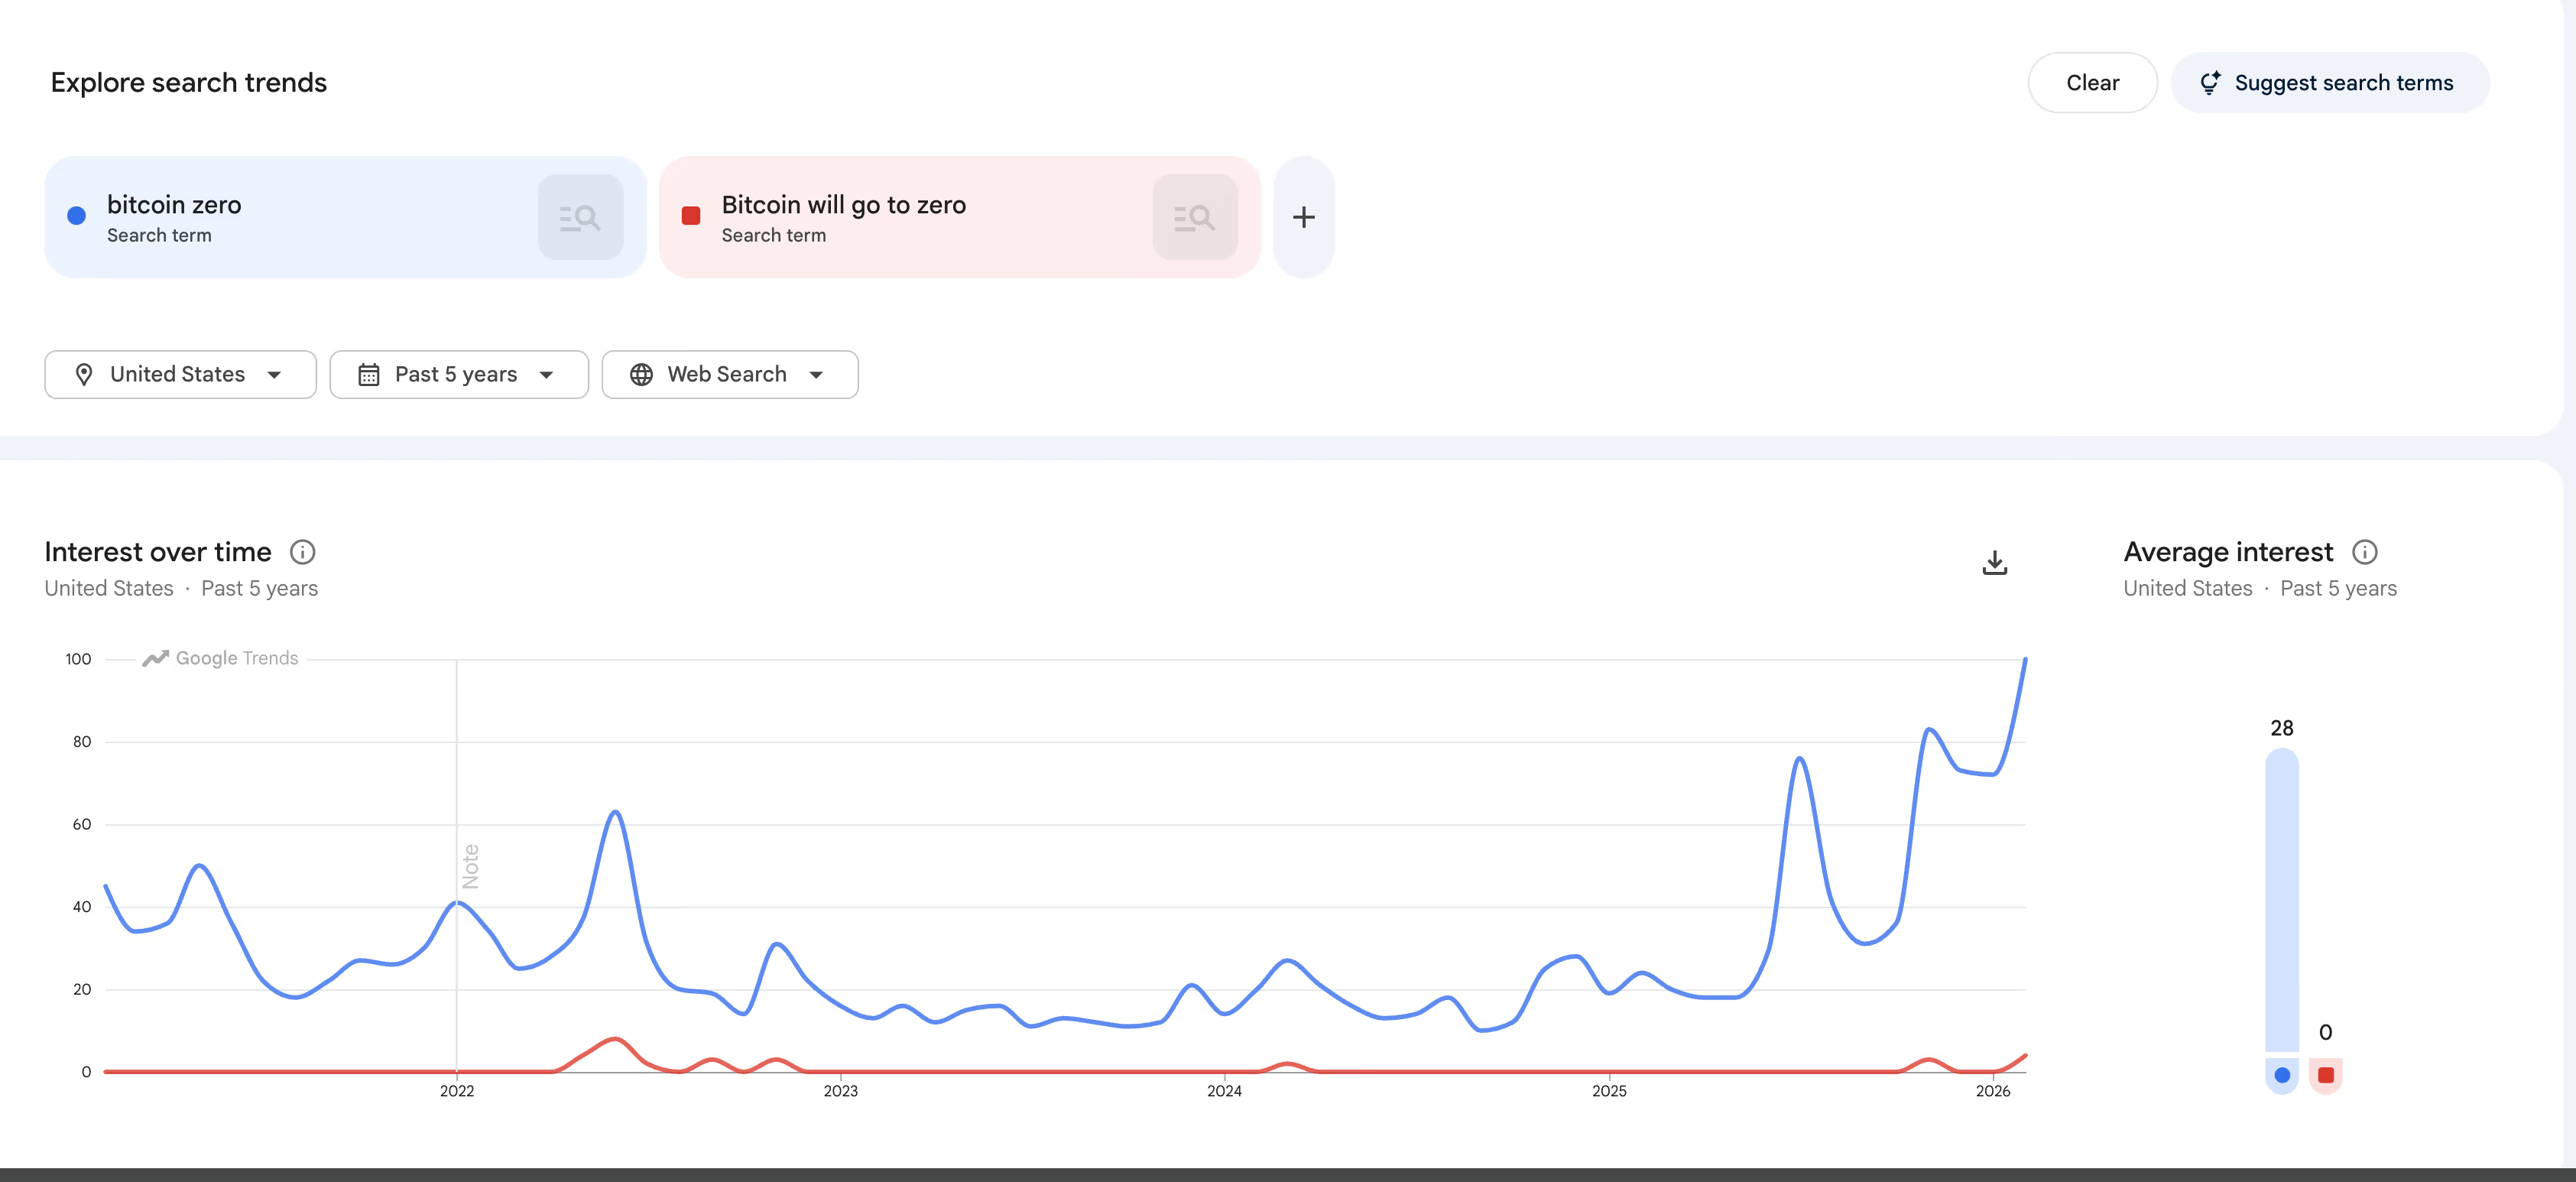
Google searches in the U.S. for “bitcoin zero” surged to a record 100 on the company’s relative interest scale in February, coinciding with bitcoin’s slide toward $60,000 after a 50%-plus drawdown from its October all-time high.

The spike could be read as a signal of widespread capitulation and, potentially, a contrarian buy signal. Similar peaks in 2021 and 2022 occurred near local lows in the bitcoin price.
The global data, however, tells a different story. Worldwide, the same term peaked at 100 back in August, falling to as low as 38 this month. Rather than setting record highs, global fear searches have been declining for months.

The divergence suggests any panic is more localized than universal. That fits the backdrop. U.S.-specific catalysts — such as tariff escalation, tensions with Iran and broader risk-off rotation in domestic equities — have dominated the macro narrative in recent weeks.
Retail investors in the U.S. may be reacting to those headlines more acutely than holders in Asia or Europe, where bitcoin’s drawdown is landing in a different news cycle.
There’s also a methodological wrinkle worth flagging. Google Trends doesn’t report raw search volume, but scores interest on a relative 0-to-100 scale, where 100 simply marks a term’s own peak within the selected time window.
A score of 100 in February 2026, when bitcoin’s U.S. retail audience is meaningfully larger than it was during the 2022 bear market, doesn’t necessarily mean more people are searching in absolute terms. It means the term spiked relative to a higher baseline.
Bitcoin’s user base and mainstream visibility have themselves grown dramatically since 2021. The takeaway is that retail fear is clearly elevated in the U.S., but the “searches hit a bottom” framework may not carry the same weight when the global trend is cooling. It may still be contrarian fuel, just not the kind that guarantees a clean trend reversal.

Vitali Klitschko tells Sky News his message to Donald Trump | World News

Pepeto Presale Surges Past $7M as Robinhood Tests Blockchain and Major Coins Crumble: Why Investors See a 300x Opportunity Here

Netball Super Cup 2026 results: Loughborough Lightning beat London Pulse in Sheffield final


-

 Video5 days ago
Bitcoin: We’re Entering The Most Dangerous Phase
-

 Tech7 days ago
Luxman Enters Its Second Century with the D-100 SACD Player and L-100 Integrated Amplifier
-

 Crypto World4 days ago
Can XRP Price Successfully Register a 33% Breakout Past $2?
-

 Sports5 days ago
GB's semi-final hopes hang by thread after loss to Switzerland
-

 Fashion1 day ago
Weekend Open Thread: Boden – Corporette.com
-

 Video2 days ago
XRP News: XRP Just Entered a New Phase (Almost Nobody Noticed)
-
 Tech5 days ago
The Music Industry Enters Its Less-Is-More Era
-

 Business4 days ago
Infosys Limited (INFY) Discusses Tech Transitions and the Unique Aspects of the AI Era Transcript
-

 Entertainment3 days ago
Kunal Nayyar’s Secret Acts Of Kindness Sparks Online Discussion
-

 Video4 days ago
Financial Statement Analysis | Complete Chapter Revision in 10 Minutes | Class 12 Board exam 2026
-

 Tech3 days ago
Retro Rover: LT6502 Laptop Packs 8-Bit Power On The Go
-
 Sports3 days ago
Clearing the boundary, crossing into history: J&K end 67-year wait, enter maiden Ranji Trophy final | Cricket News
-

 Entertainment3 days ago
Dolores Catania Blasts Rob Rausch For Turning On ‘Housewives’ On ‘Traitors’
-

 Business4 days ago
Tesla avoids California suspension after ending ‘autopilot’ marketing
-
 NewsBeat6 days ago
The strange Cambridgeshire cemetery that forbade church rectors from entering
-

 Politics5 days ago
Eurovision Announces UK Act For 2026 Song Contest
-

 Crypto World3 days ago
WLFI Crypto Surges Toward $0.12 as Whale Buys $2.75M Before Trump-Linked Forum
-
 NewsBeat6 days ago
Man dies after entering floodwater during police pursuit
-

 Crypto World2 days ago
83% of Altcoins Enter Bear Trend as Liquidity Crunch Tightens Grip on Crypto Market
-
 NewsBeat2 days ago
Andrew Mountbatten-Windsor latest: Police search of Royal Lodge enters second day after Andrew released from custody