Crypto World
XRP ETFs in Green For 3 Week, But Price Remains Stuck

XRP price has traded mostly flat over the past 24 hours and the past week. This sideways move shows clear market indecision. On the surface, institutional activity looks supportive. XRP spot ETFs have now recorded three straight weeks of inflows. But underneath this positive trend, a hidden weakness is quietly building.
Several technical and on-chain signals suggest XRP may be closer to a breakdown than it appears.
ETF Inflows Stay Positive, But Institutional Strength Is Rapidly Fading
XRP spot ETFs have recorded inflows for three straight weeks. The week ending February 6 saw $36.04 million in inflows. By the week ending February 20, inflows had fallen further to just $1.84 million.
This represents a drop of nearly 95% in weekly inflows within three weeks.

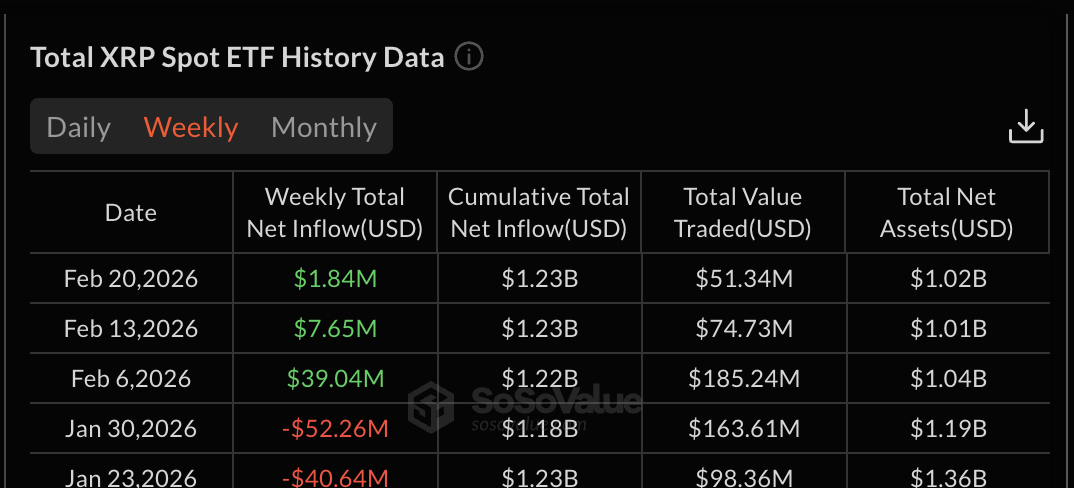
ETF inflows show how much institutional money is entering an asset. Rising inflows usually signal growing confidence. But falling inflows, even if still positive, show that institutional conviction is weakening quickly.
This institutional slowdown is already visible on the chart. XRP fell below its weekly Volume Weighted Average Price, or VWAP, on February 18 and hasn’t reclaimed the line since.
VWAP represents the average price weighted by volume. It is widely used as a proxy for institutional cost basis and is referred to by big money as a benchmark.
When the price falls below VWAP, it means institutions are holding positions at a loss on average. This often reduces their willingness to buy more. The last time XRP broke its weekly VWAP, it fell nearly 26%. The correction since February 18 is also continuing.

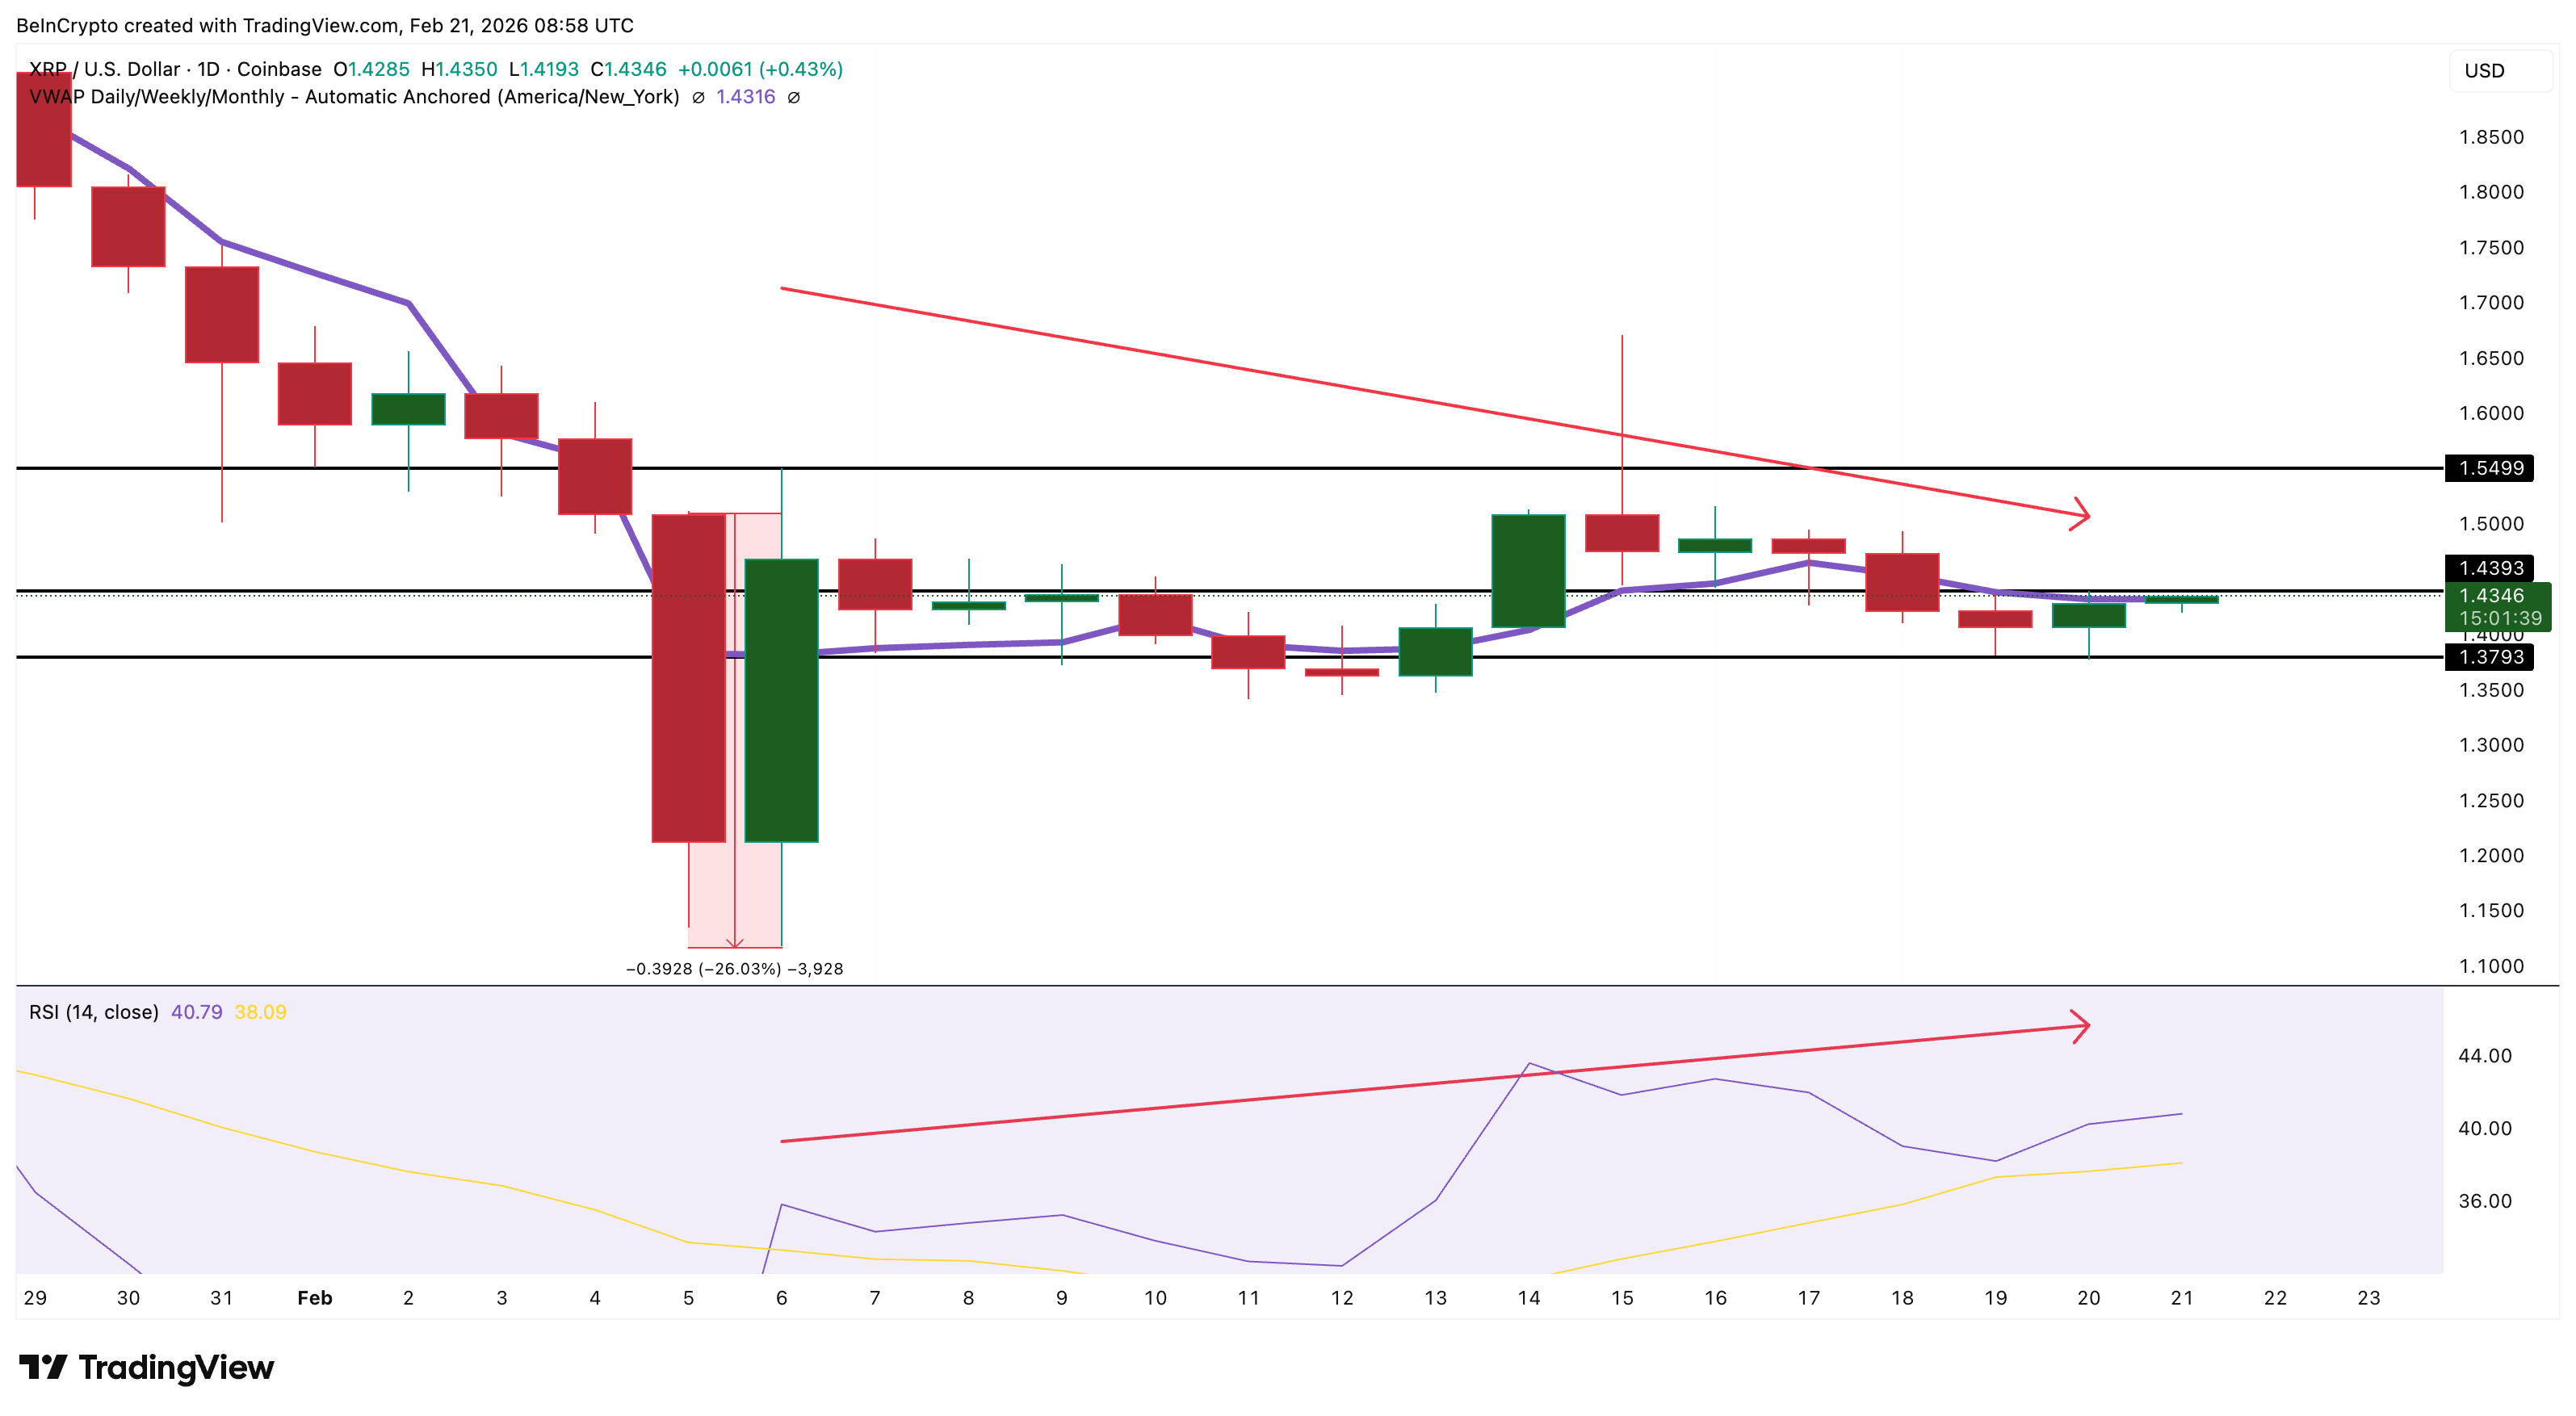
At the same time, XRP is close to forming a hidden bearish divergence between February 6 and February 20. During this period, the XRP price seems to be printing a lower high. But the Relative Strength Index, or RSI, already formed a higher high.
RSI measures momentum. When momentum rises, but price fails to follow, it signals weakening recovery strength and a possible downtrend extension for XRP if $1.379 breaks. A clear price-specific confirmation would occur if the current XRP price fails to reach or exceed $1.439.
Together, weakening ETF inflows, VWAP loss, and bearish divergence show that institutional strength is fading despite the positive ETF streak.
Exchange Flows and Dip Buying Explain Why Price Has Not Collapsed Yet
Despite falling below the VWAP, XRP has not collapsed sharply, like earlier. On-chain data helps explain why.
One key metric is Exchange Net Position Change. This tracks whether coins are moving into or out of exchanges. Outflows usually signal buying, while falling outflows show weakening demand.
On February 18, exchange outflows peaked near 71.32 million XRP. Recently, outflows dropped to around 41.69 million XRP. This marks a decline of about 41%.
Want more token insights like this? Sign up for Editor Harsh Notariya’s Daily Crypto Newsletter here.

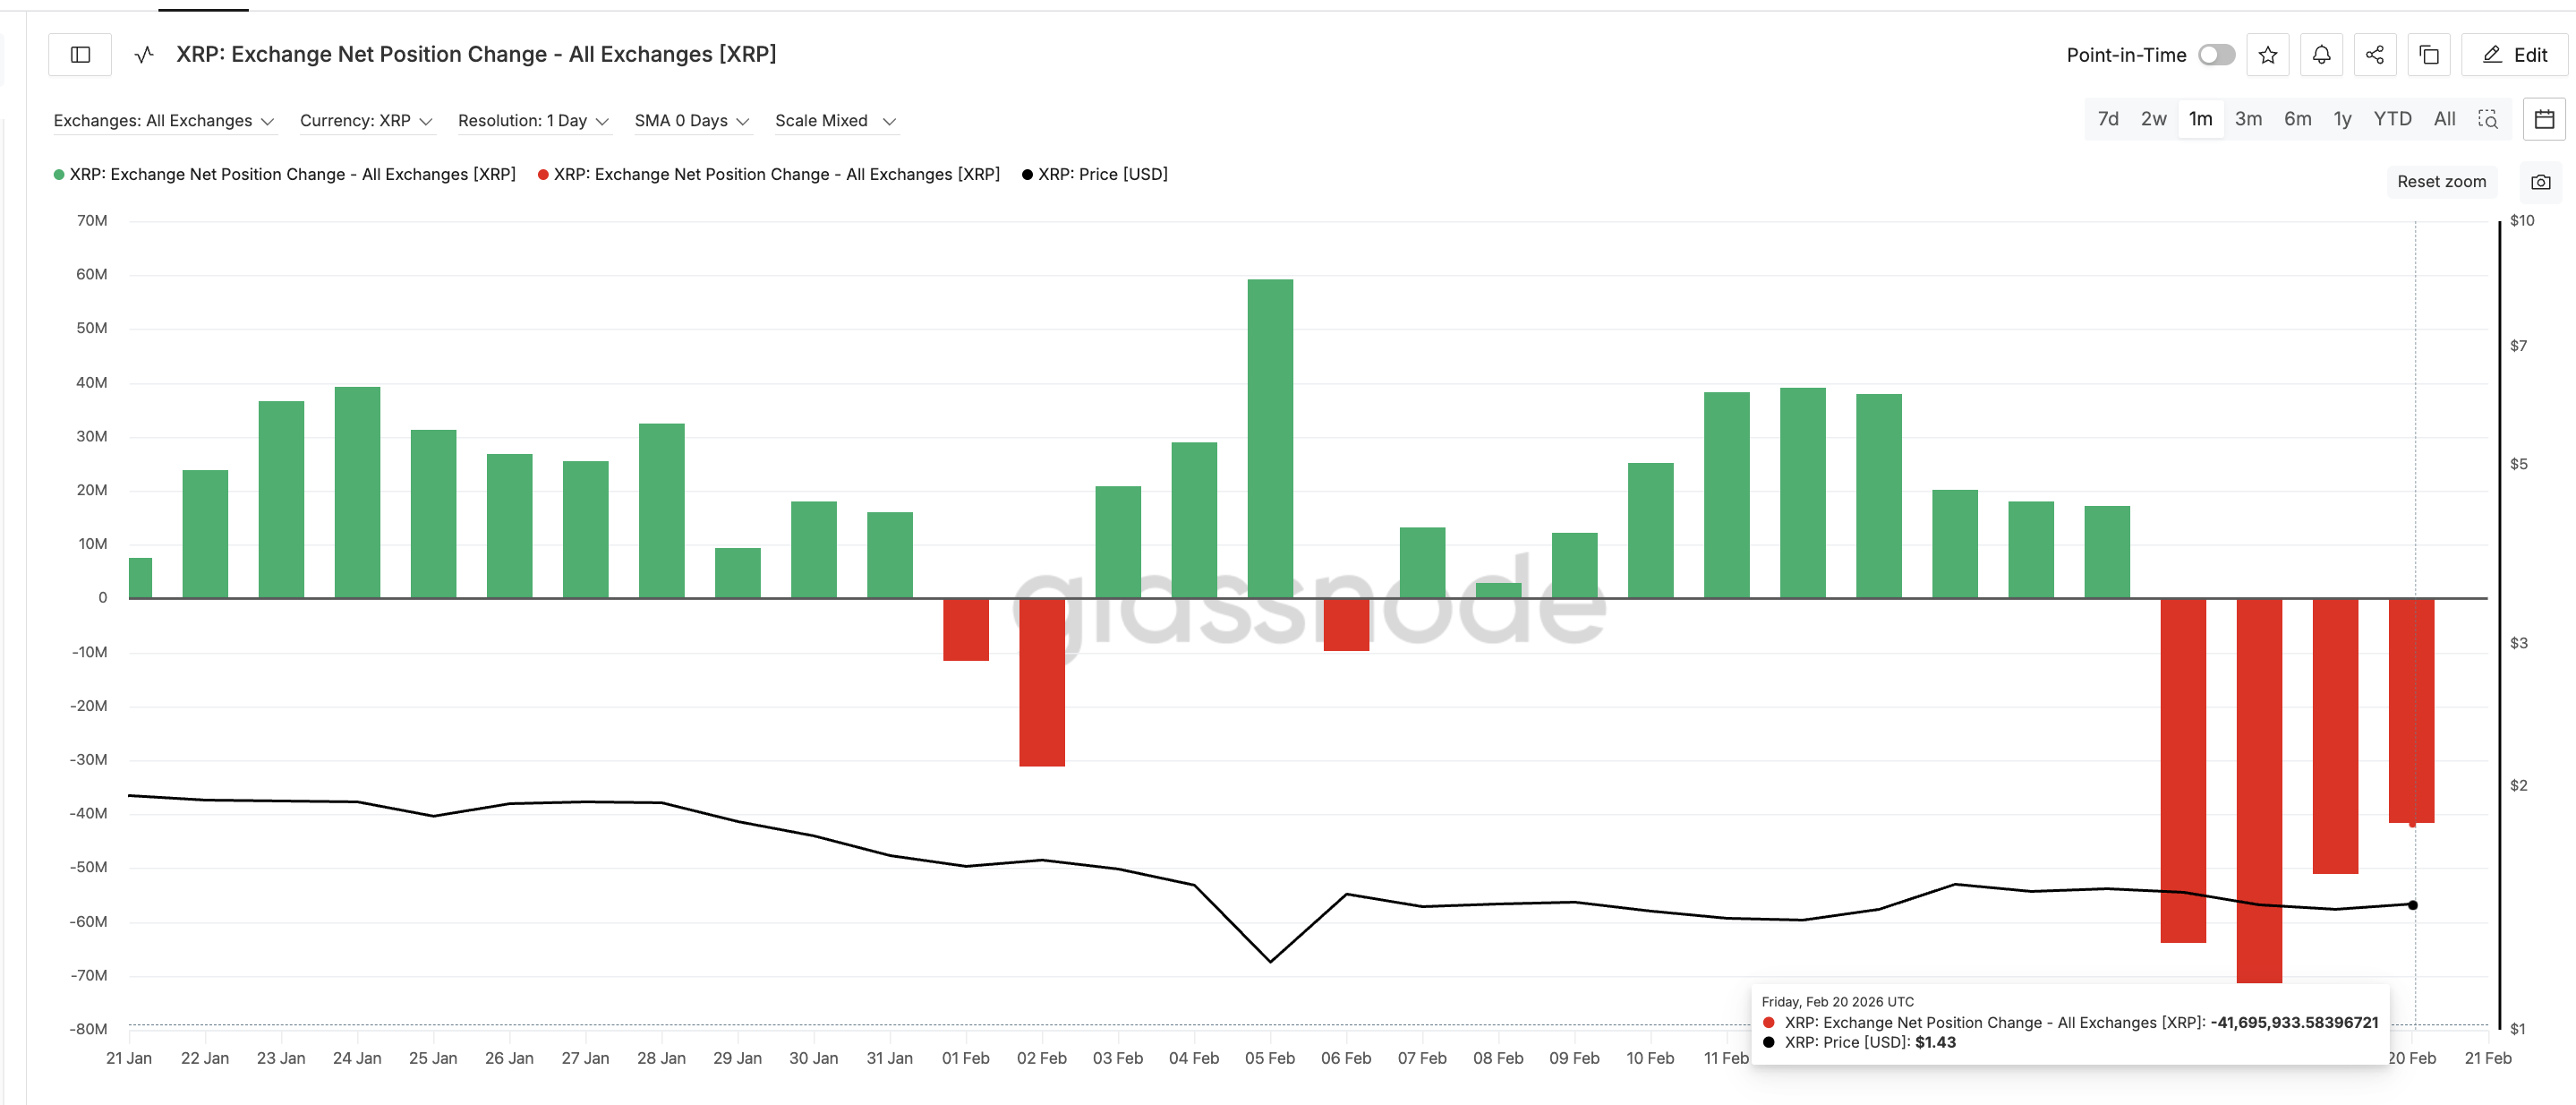
This shows that buying pressure has weakened significantly but still remains.
Another indicator shows buyers are still active. The Money Flow Index, or MFI, tracks real capital entering an asset. Between February 6 and February 19, the XRP price trended lower.
But MFI trended higher. This divergence shows dip buyers are slowly accumulating even as the price weakens.
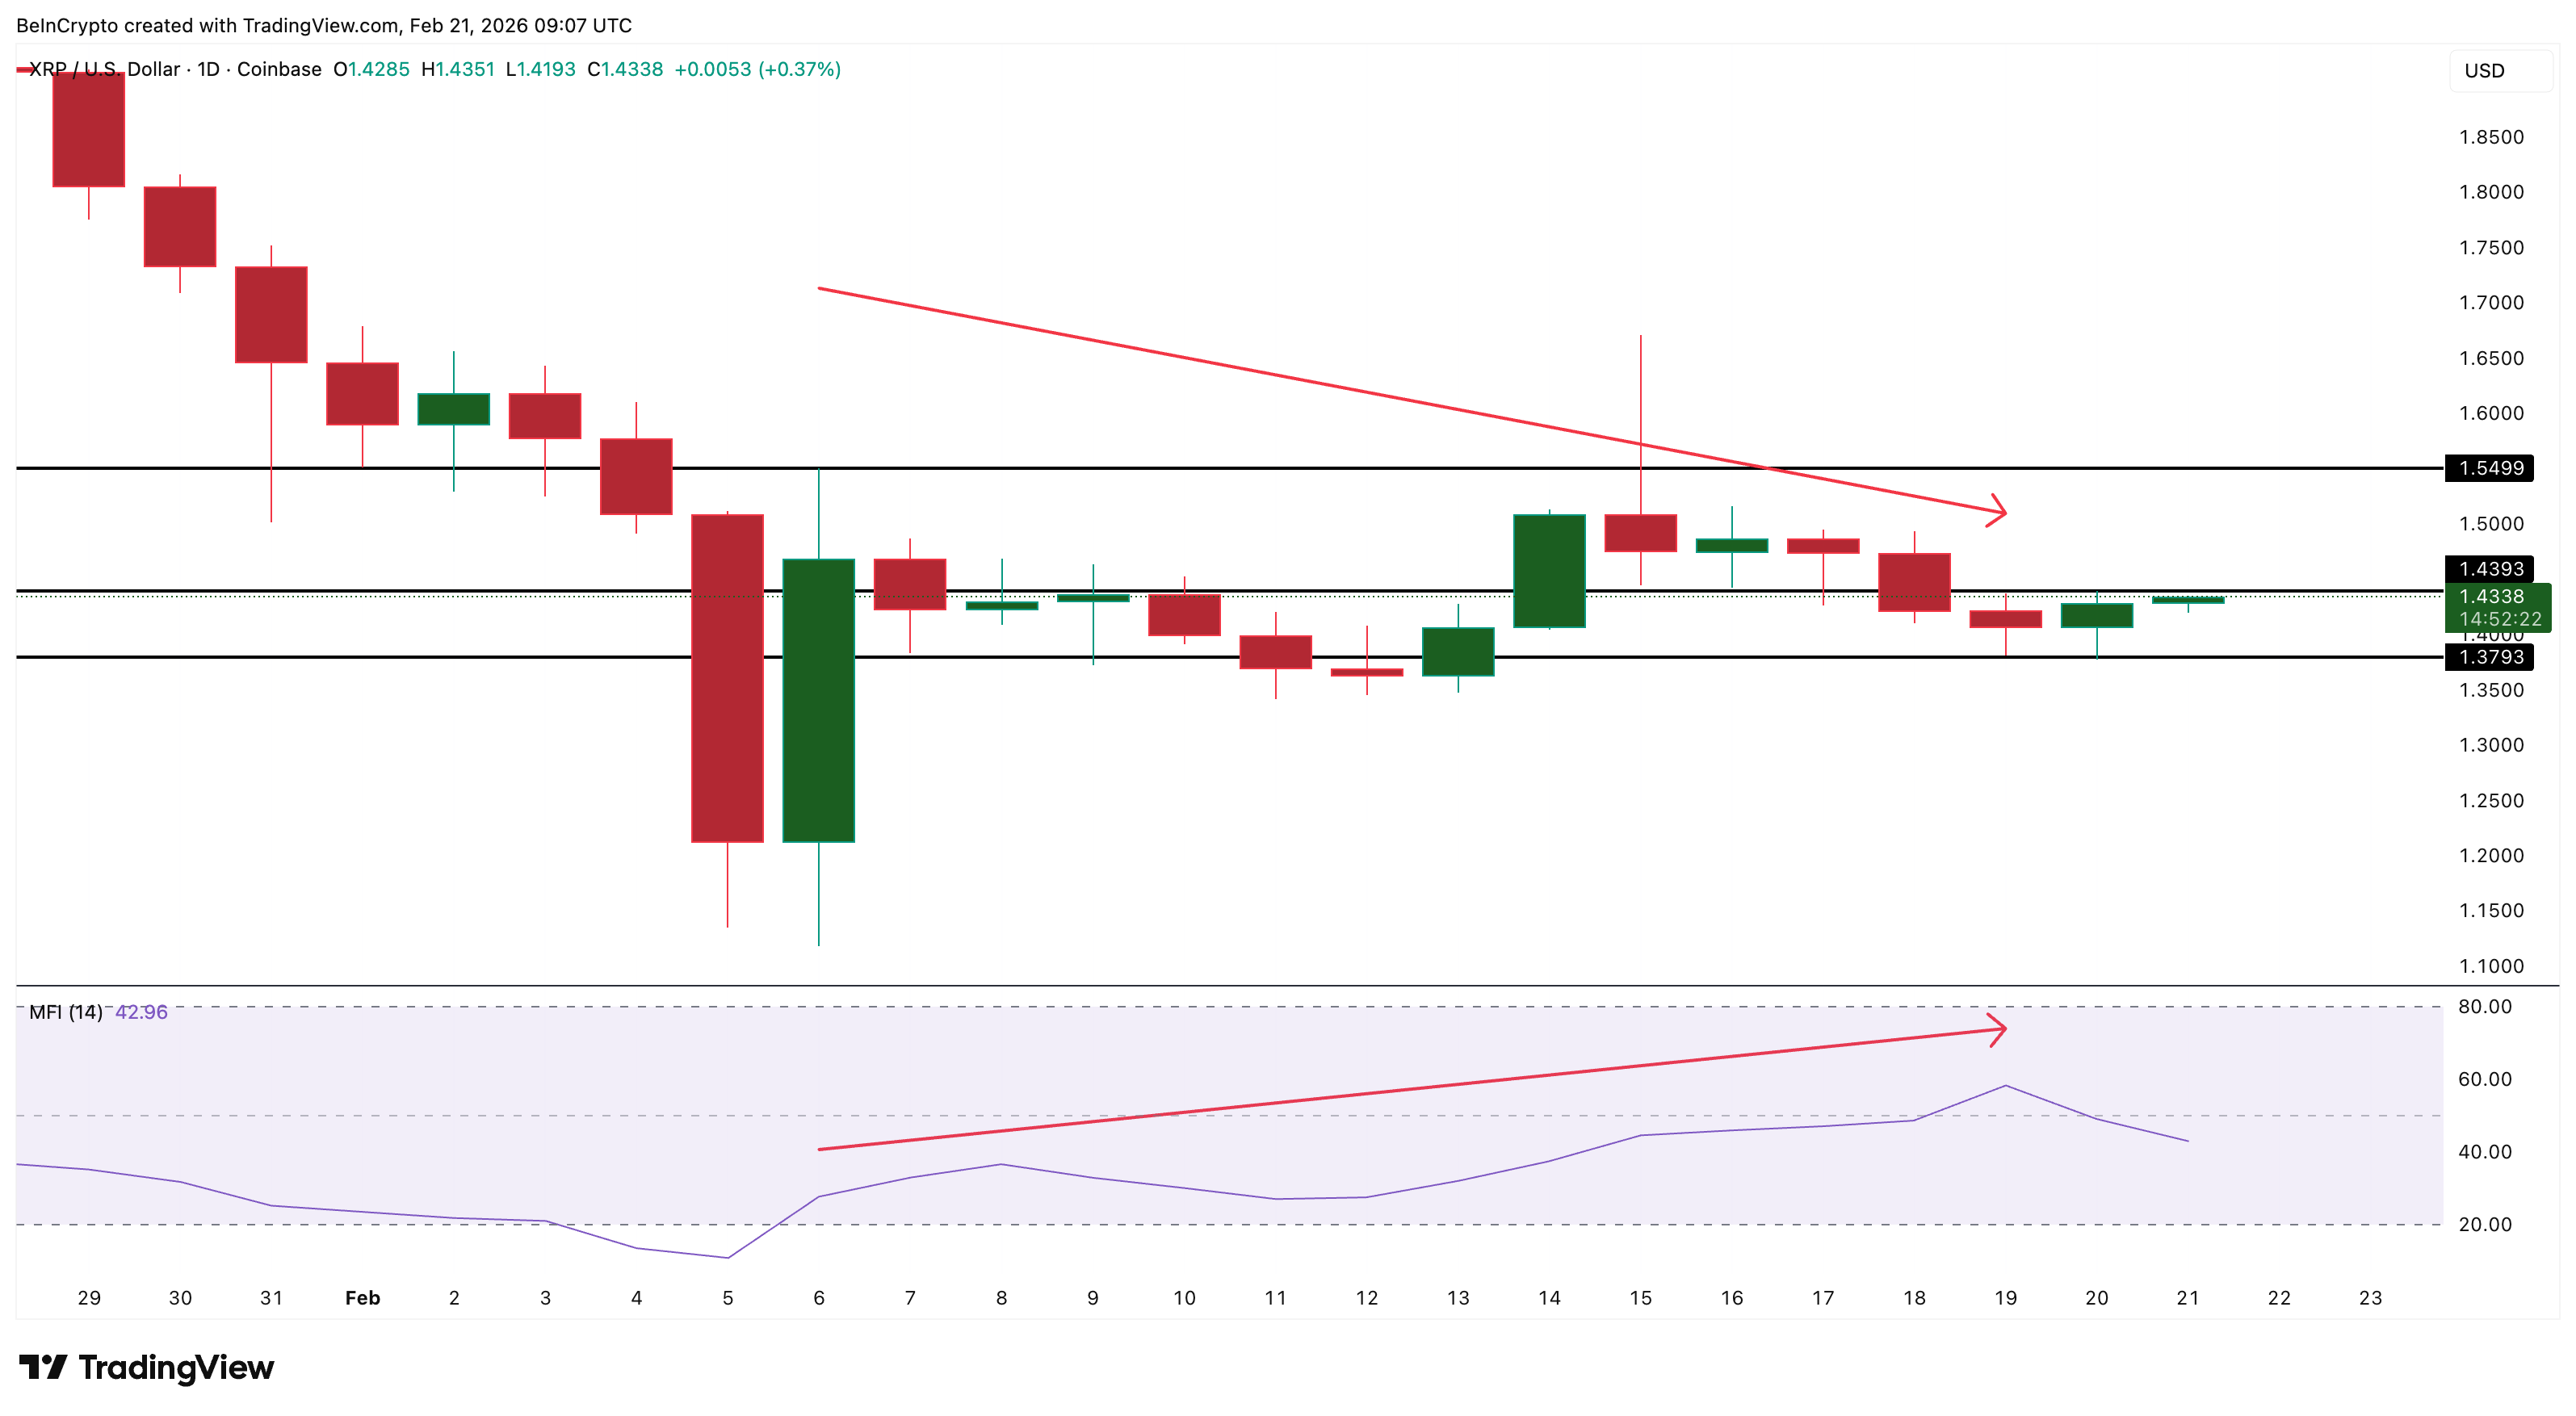
This dip buying helps explain why XRP has remained relatively stable after losing its VWAP. Buyers are absorbing selling pressure. This has prevented an immediate collapse so far. But this support is limited. If dip buying weakens, downside risk could increase quickly.
XRP Price Faces Critical $1.25 Test as Cost Basis Cluster Becomes Final Support
Cost basis data now shows XRP approaching a critical support zone. Cost basis represents the prices at which investors previously bought XRP.
These levels often act as strong support or resistance. The most important support cluster currently sits near $1.26, hosting over 159 million XRP.

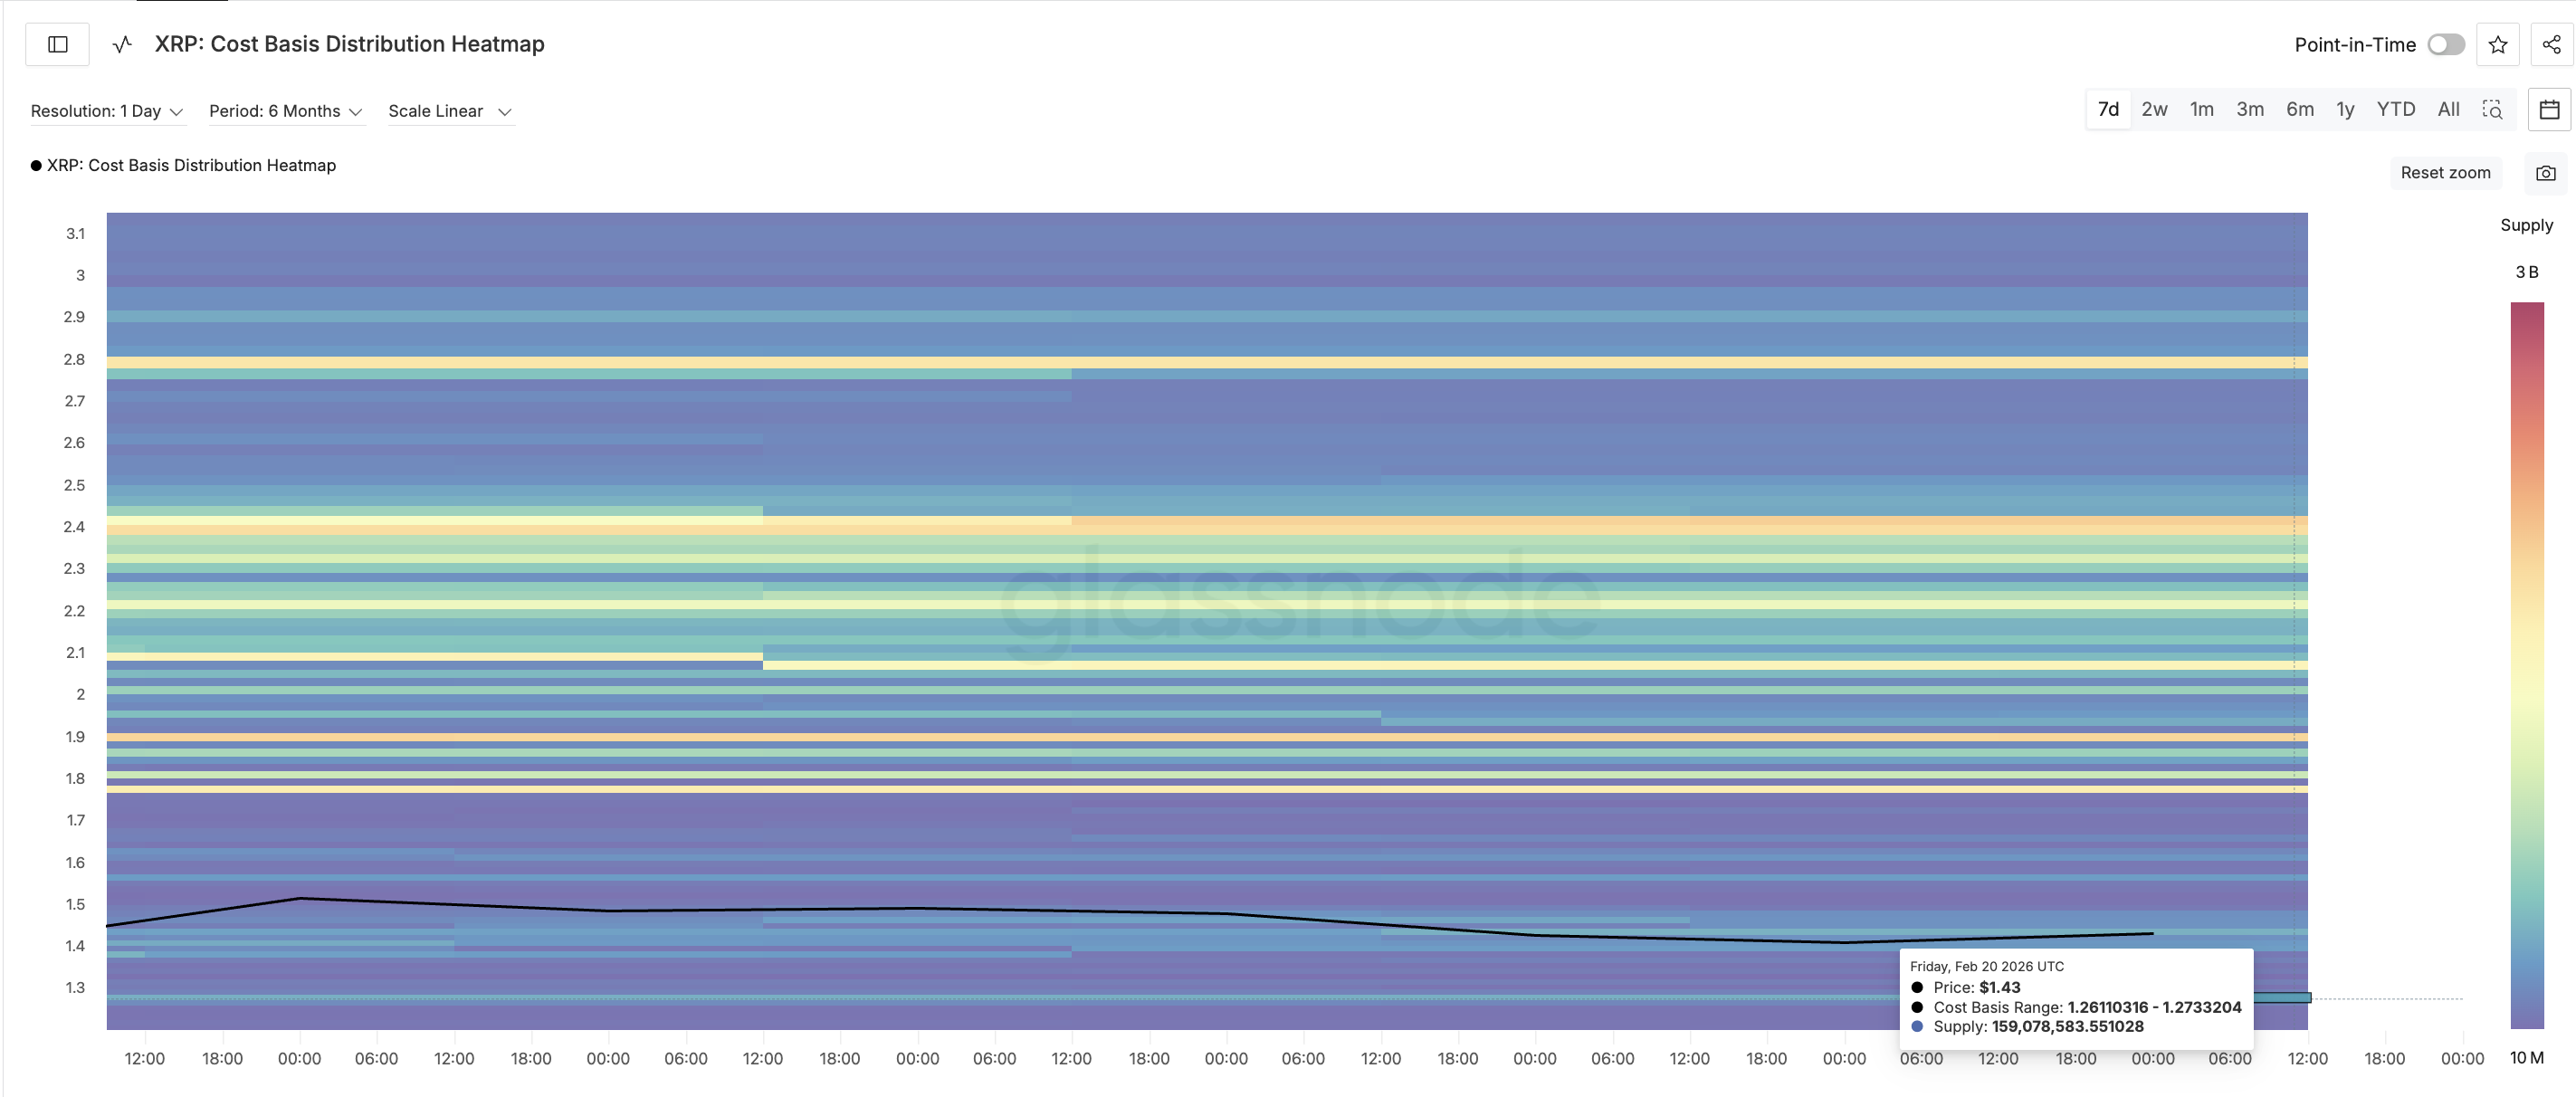
This is where a large number of holders bought XRP. As long as this level holds, the XRP price may avoid a deeper crash beyond 12% even if the immediate support zone at $1.35-$1.37 breaks.
However, if XRP falls below $1.26 ($1.259 on the chart), selling pressure could accelerate sharply. The next major downside levels would appear near $1.162 and $1.024.
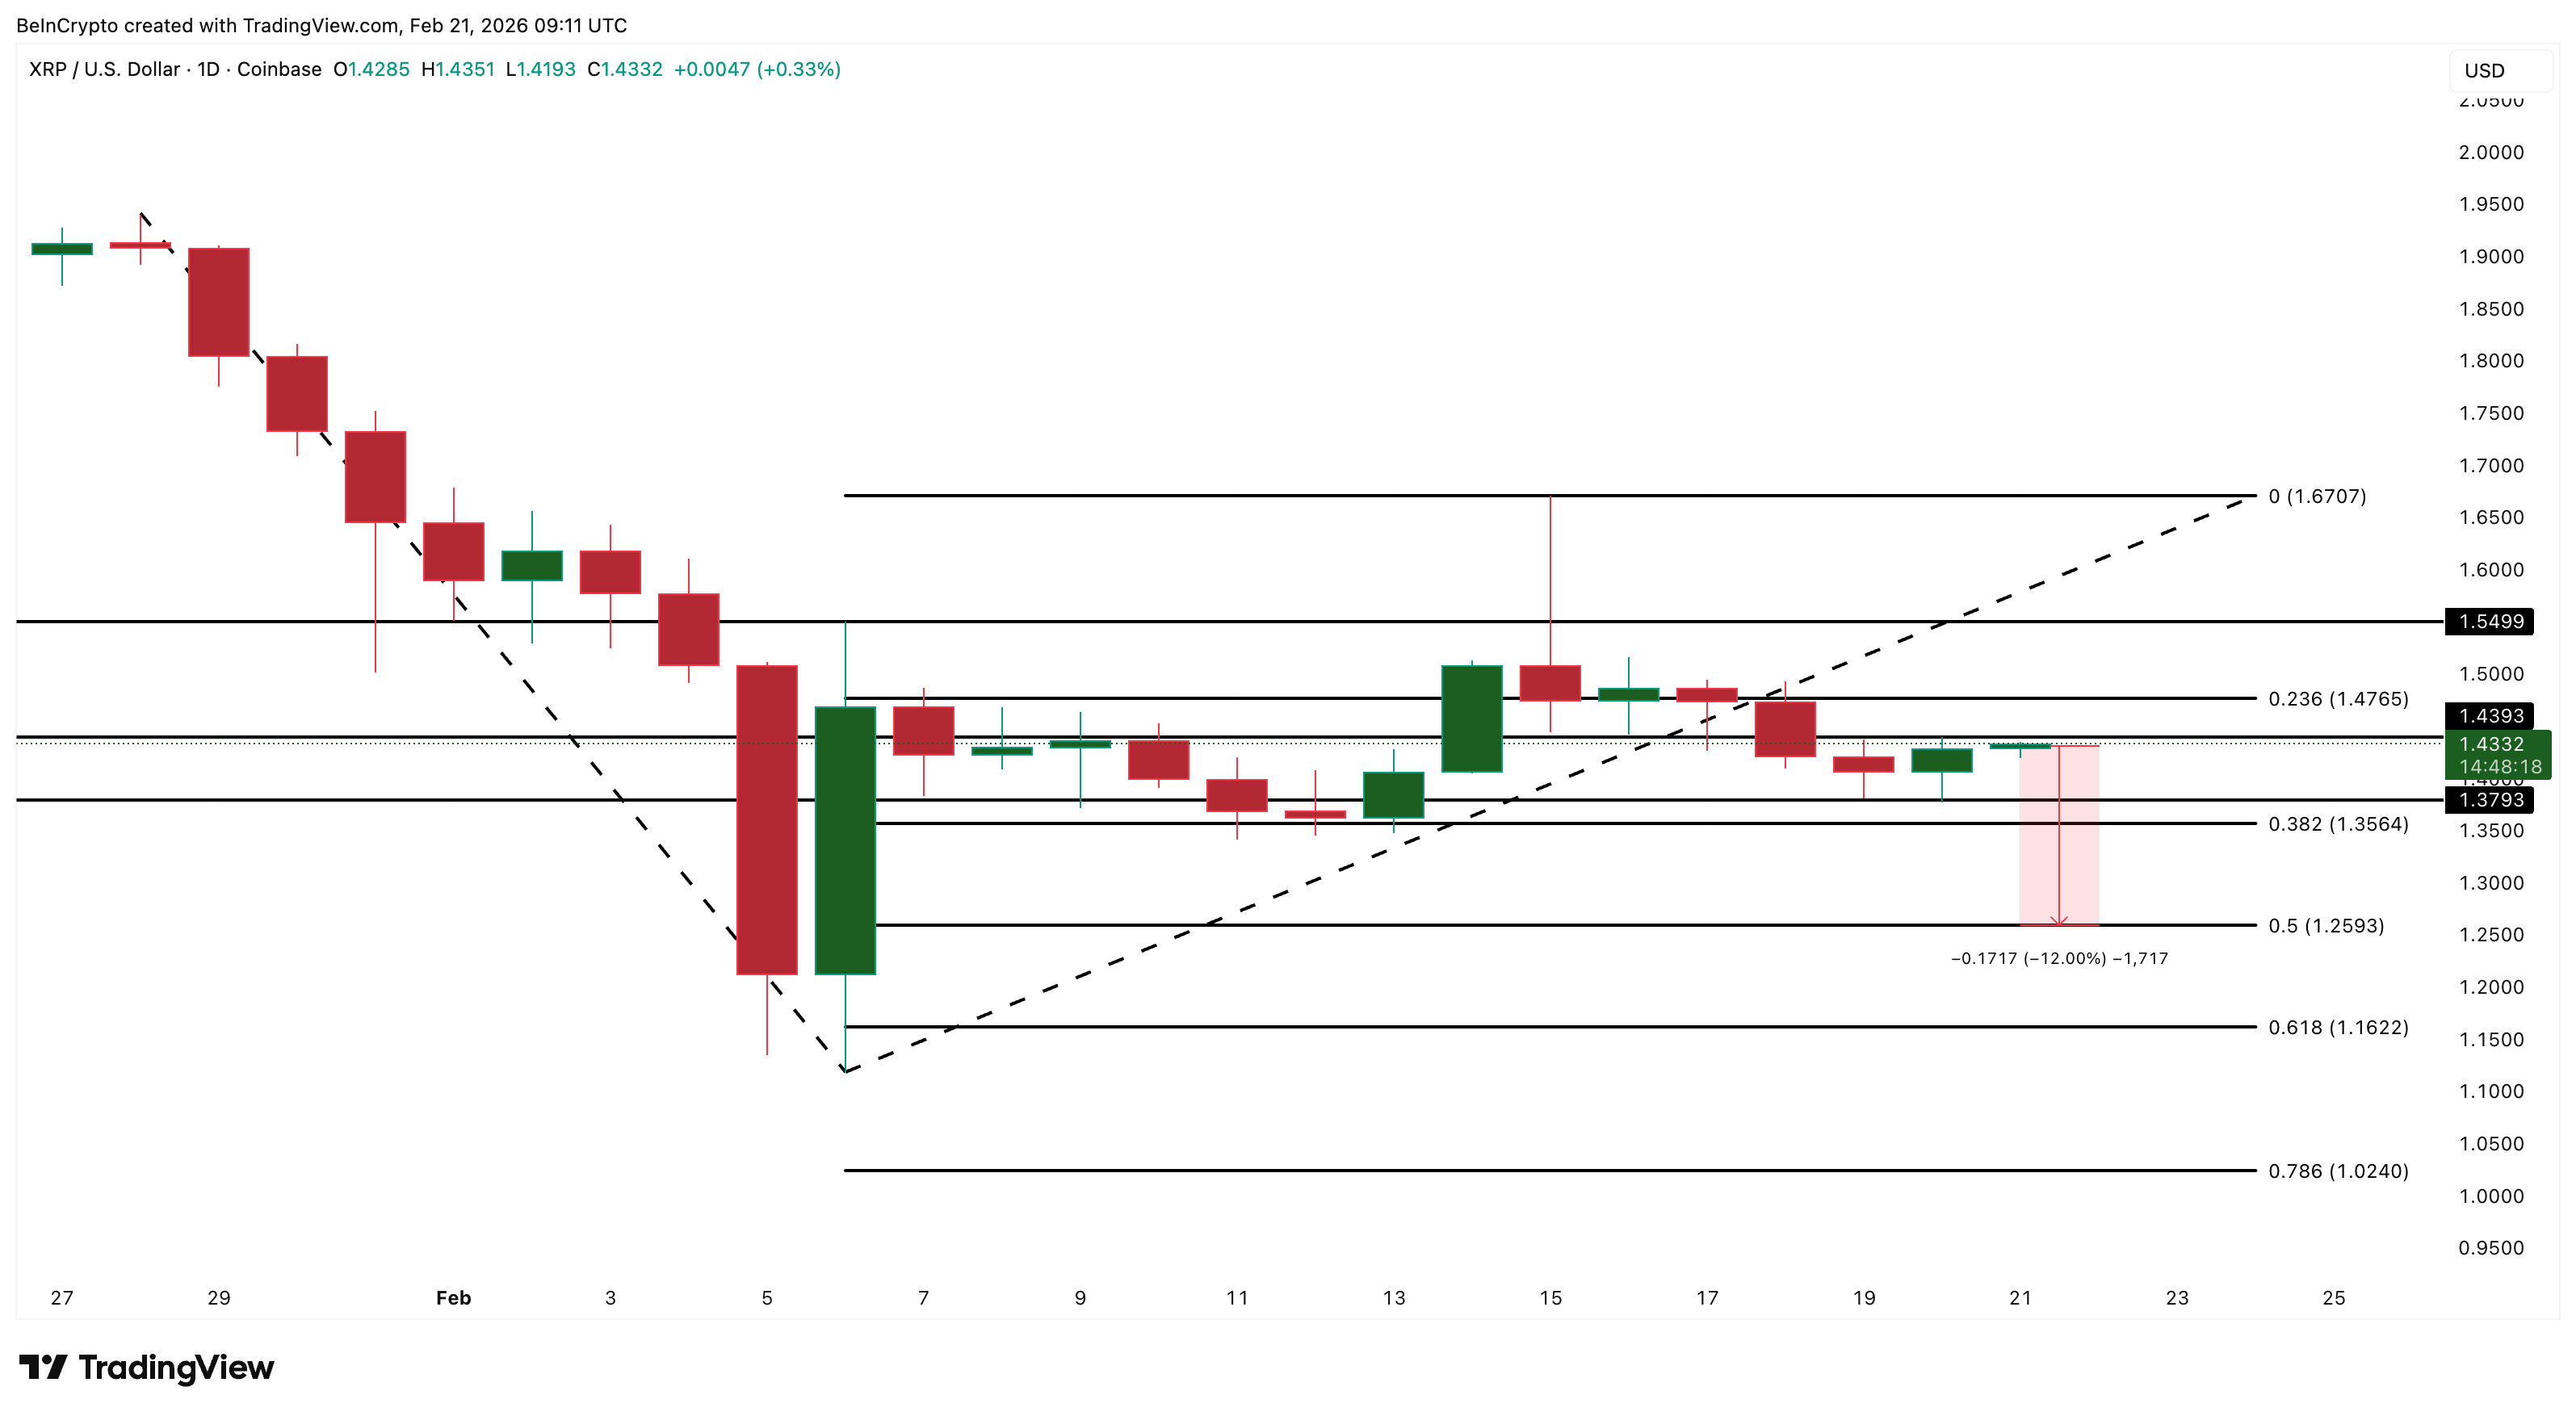
On the upside, XRP must first reclaim $1.439. A stronger recovery would require moves above $1.476 and $1.549. Only a breakout above $1.670 would fully cut the bearish momentum.
For now, XRP remains stuck between weakening institutional support and steady dip buying. ETF inflows are still positive, but falling rapidly.
Technical and on-chain signals show that $1.259 is now the most important level that could determine XRP’s next major move, especially if the bearish divergence and VWAP weakness continue to play out.