

Crypto World
BitMine stock forms a rare bullish pattern as short interest hits 6%

BitMine stock price remains in a tight range this week, even as Ethereum dropped to a multi-week low of $1,880.
Summary
- BitMine stock has formed a large falling wedge pattern on the three-day chart.
- It continued to accumulate ETH as it moved towards owning 5%.
- Data shows that the short interest has jumped to 6%.
The BMNR stock was trading at the key support level at $20, down by almost 90% from its highest level in July last year.
BitMine stock has wavered as the company has continued accumulating Ethereum (ETH). Data shows that the company has bought over 168,000 Ethereum tokens in the last 30 days, bringing the cumulative total to 4.7 million, which are currently worth over $8.3 billion.
The company’s goal is to ultimately own 5% of ETH coins and generate a monthly return through staking. Data compiled by StakingRewards shows that the average staking return on Ethereum is about 2.9%, meaning that the company will be generating over $350 million in annual staking revenue.
BitMine also holds over $600 million in cash, which it has invested in short-term government bonds, which earn over 4%.
At the same time, Tom Lee has invested in other companies, including Beast Industries, the company owned by Mr. Beast. It offers numerous products, including chocolate bars and financial services. It recently acquired Step, a company that provides financial literacy solutions to young people.
BitMine has access to more money to make investments as its shareholders recently increased its authorized shares to 50 billion. This means that it may issue additional shares to make these investments.
This performance, together with Ethereum’s track record of bouncing back, explains why top institutional investors have continued buying the stock. Some of the top holders of the BMNR stock are companies like Morgan Stanley, ARK Investment, BlackRock, Citadel, and Goldman Sachs.
The main risk facing the BMNR stock price is the ongoing Ethereum price crash and the rising short interest. Short interest jumped to 6%, meaning that many investors anticipate it to keep falling.
BitMine stock price technical analysis
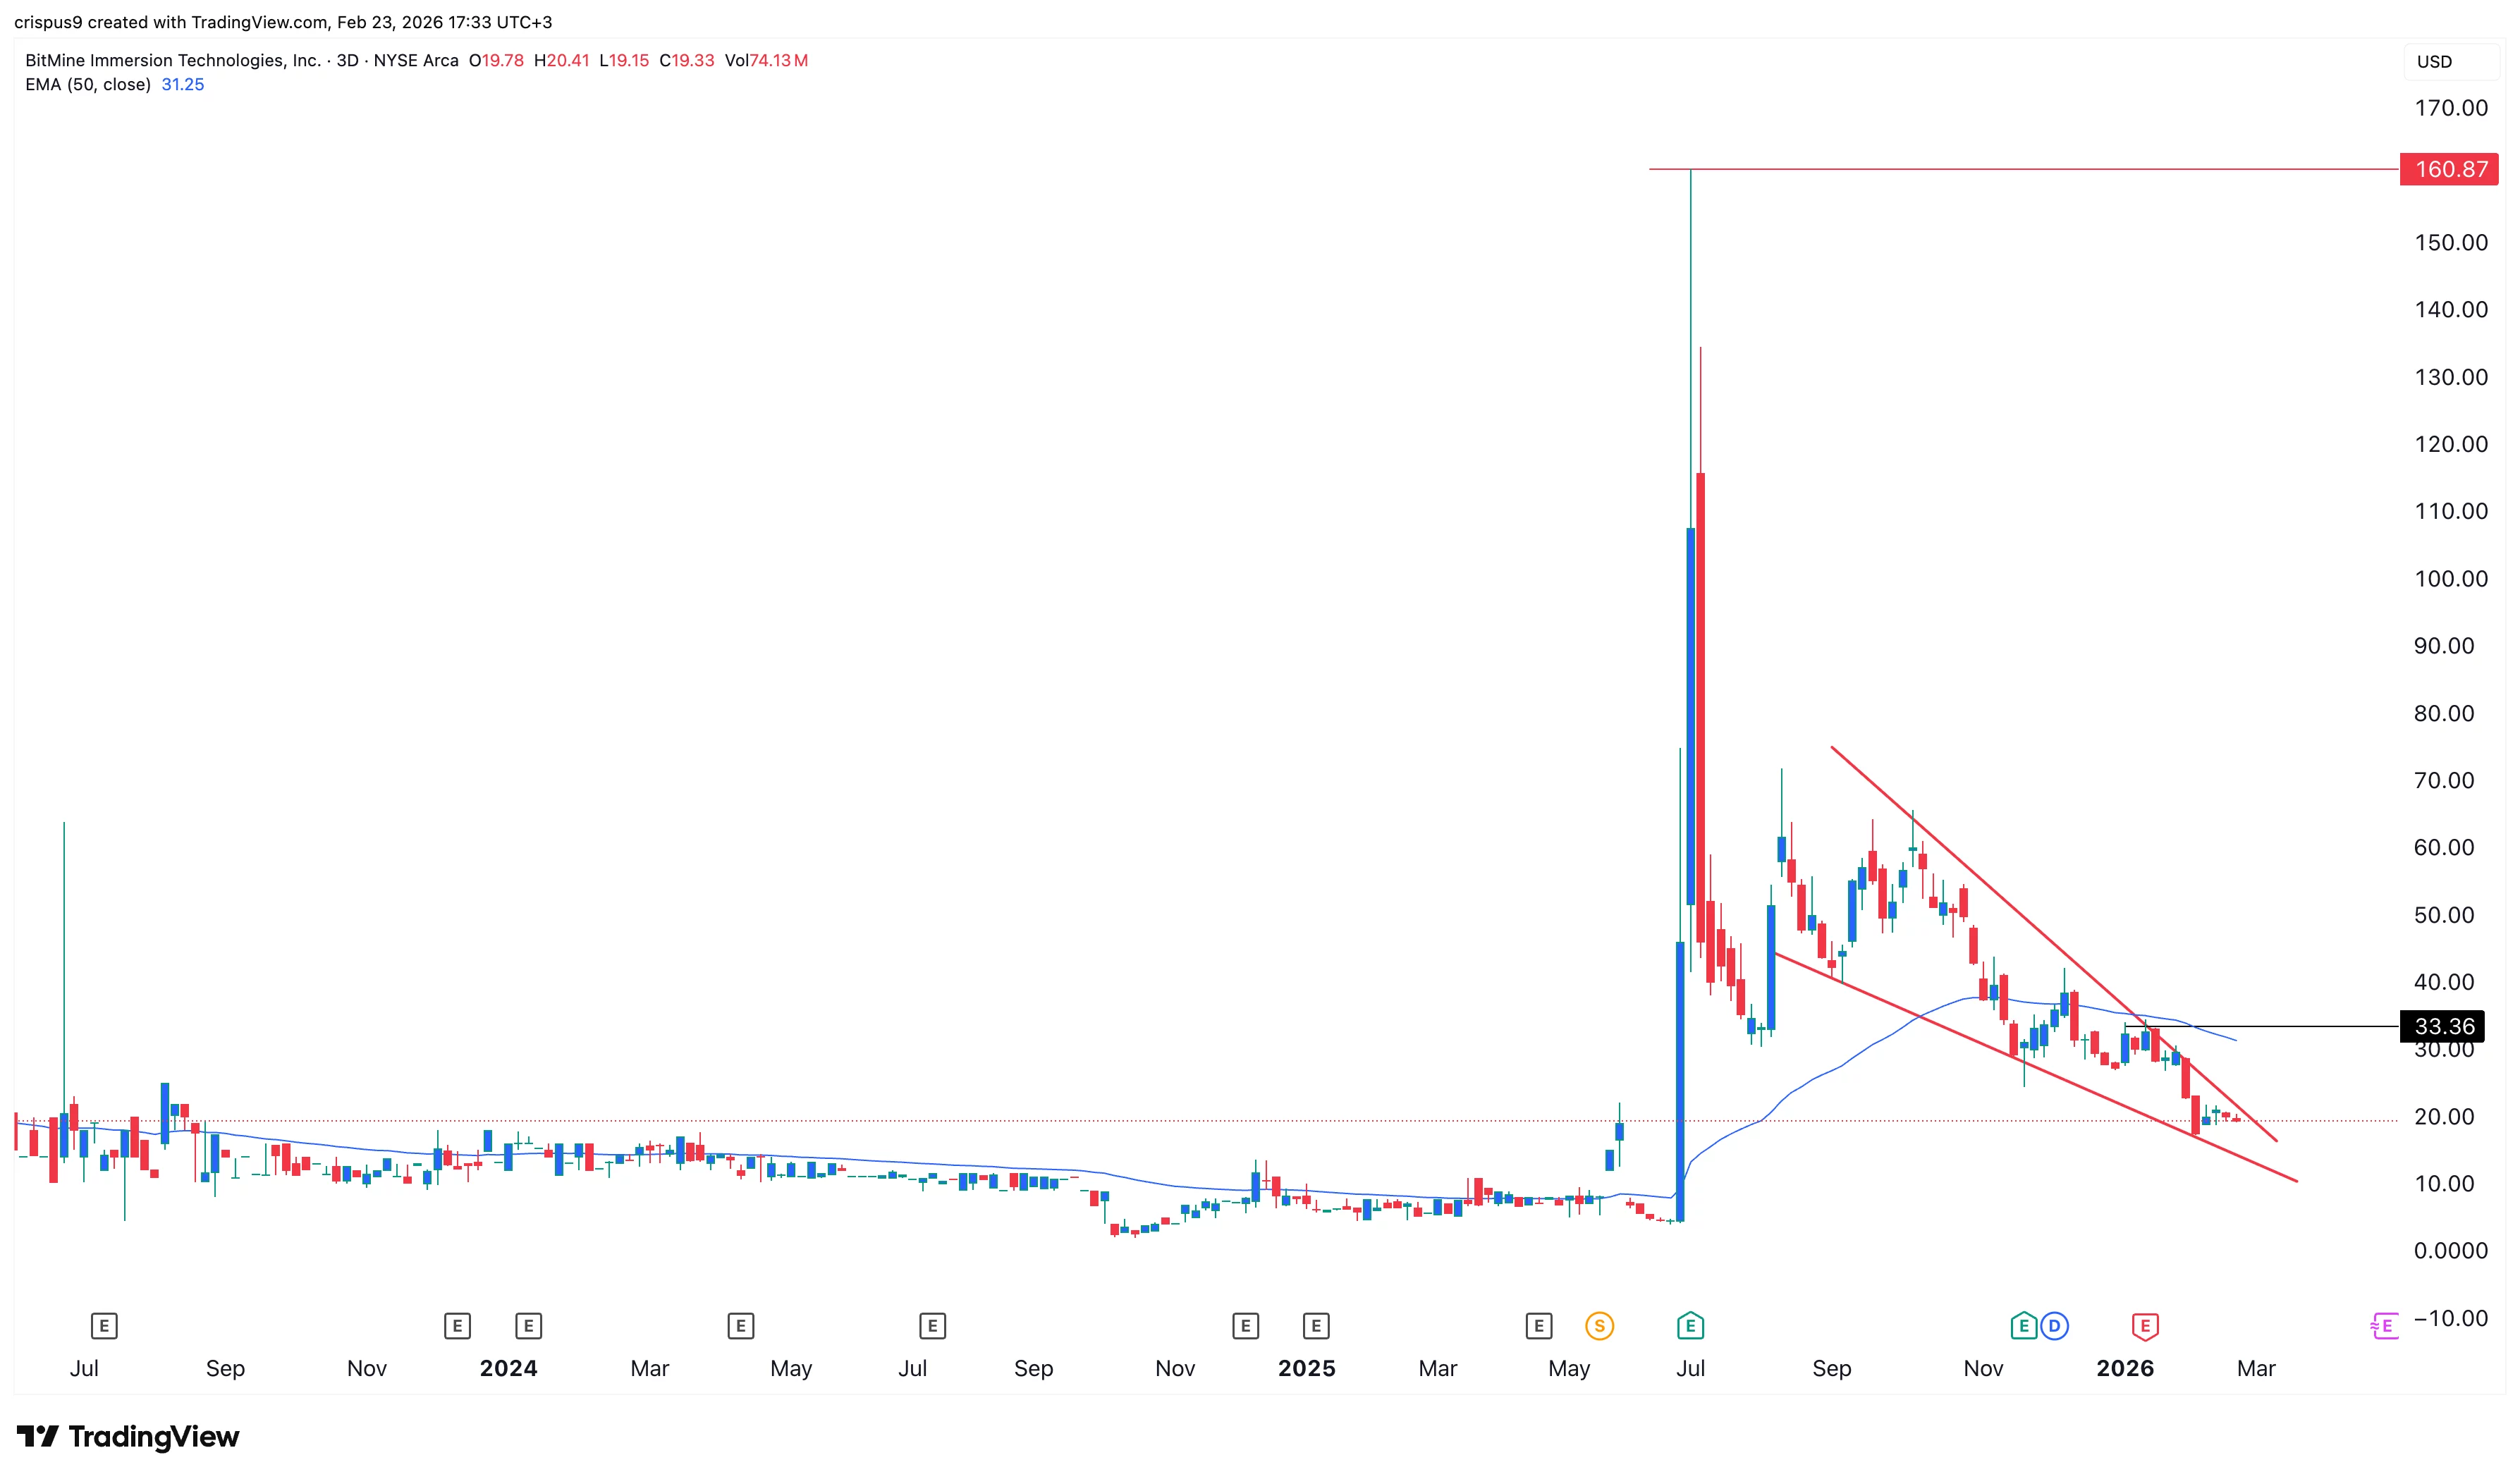
The daily chart shows that the BMNR stock price has slumped in the past few months. This retreat has pushed it to move below all moving averages, a sign that bears have prevailed.
A closer look shows that the stock has formed a giant falling wedge pattern. This pattern is made up of two descending and converging trendlines. A bullish breakout normally happens when the two lines are about to converge.
Therefore, the most likely BitMine stock price forecast is bullish, with the initial target being at $35, its highest level in January this year.

XRP price is forming a potential Gartley harmonic pattern near $1.30 support, signaling a possible bullish bottom as price rotates within a broader range.
Summary
- XRP developing Gartley harmonic pattern near $1.30 support
- Holding above $1.20 keeps bullish reversal structure valid
- Completion of leg D could trigger a strong upside rally
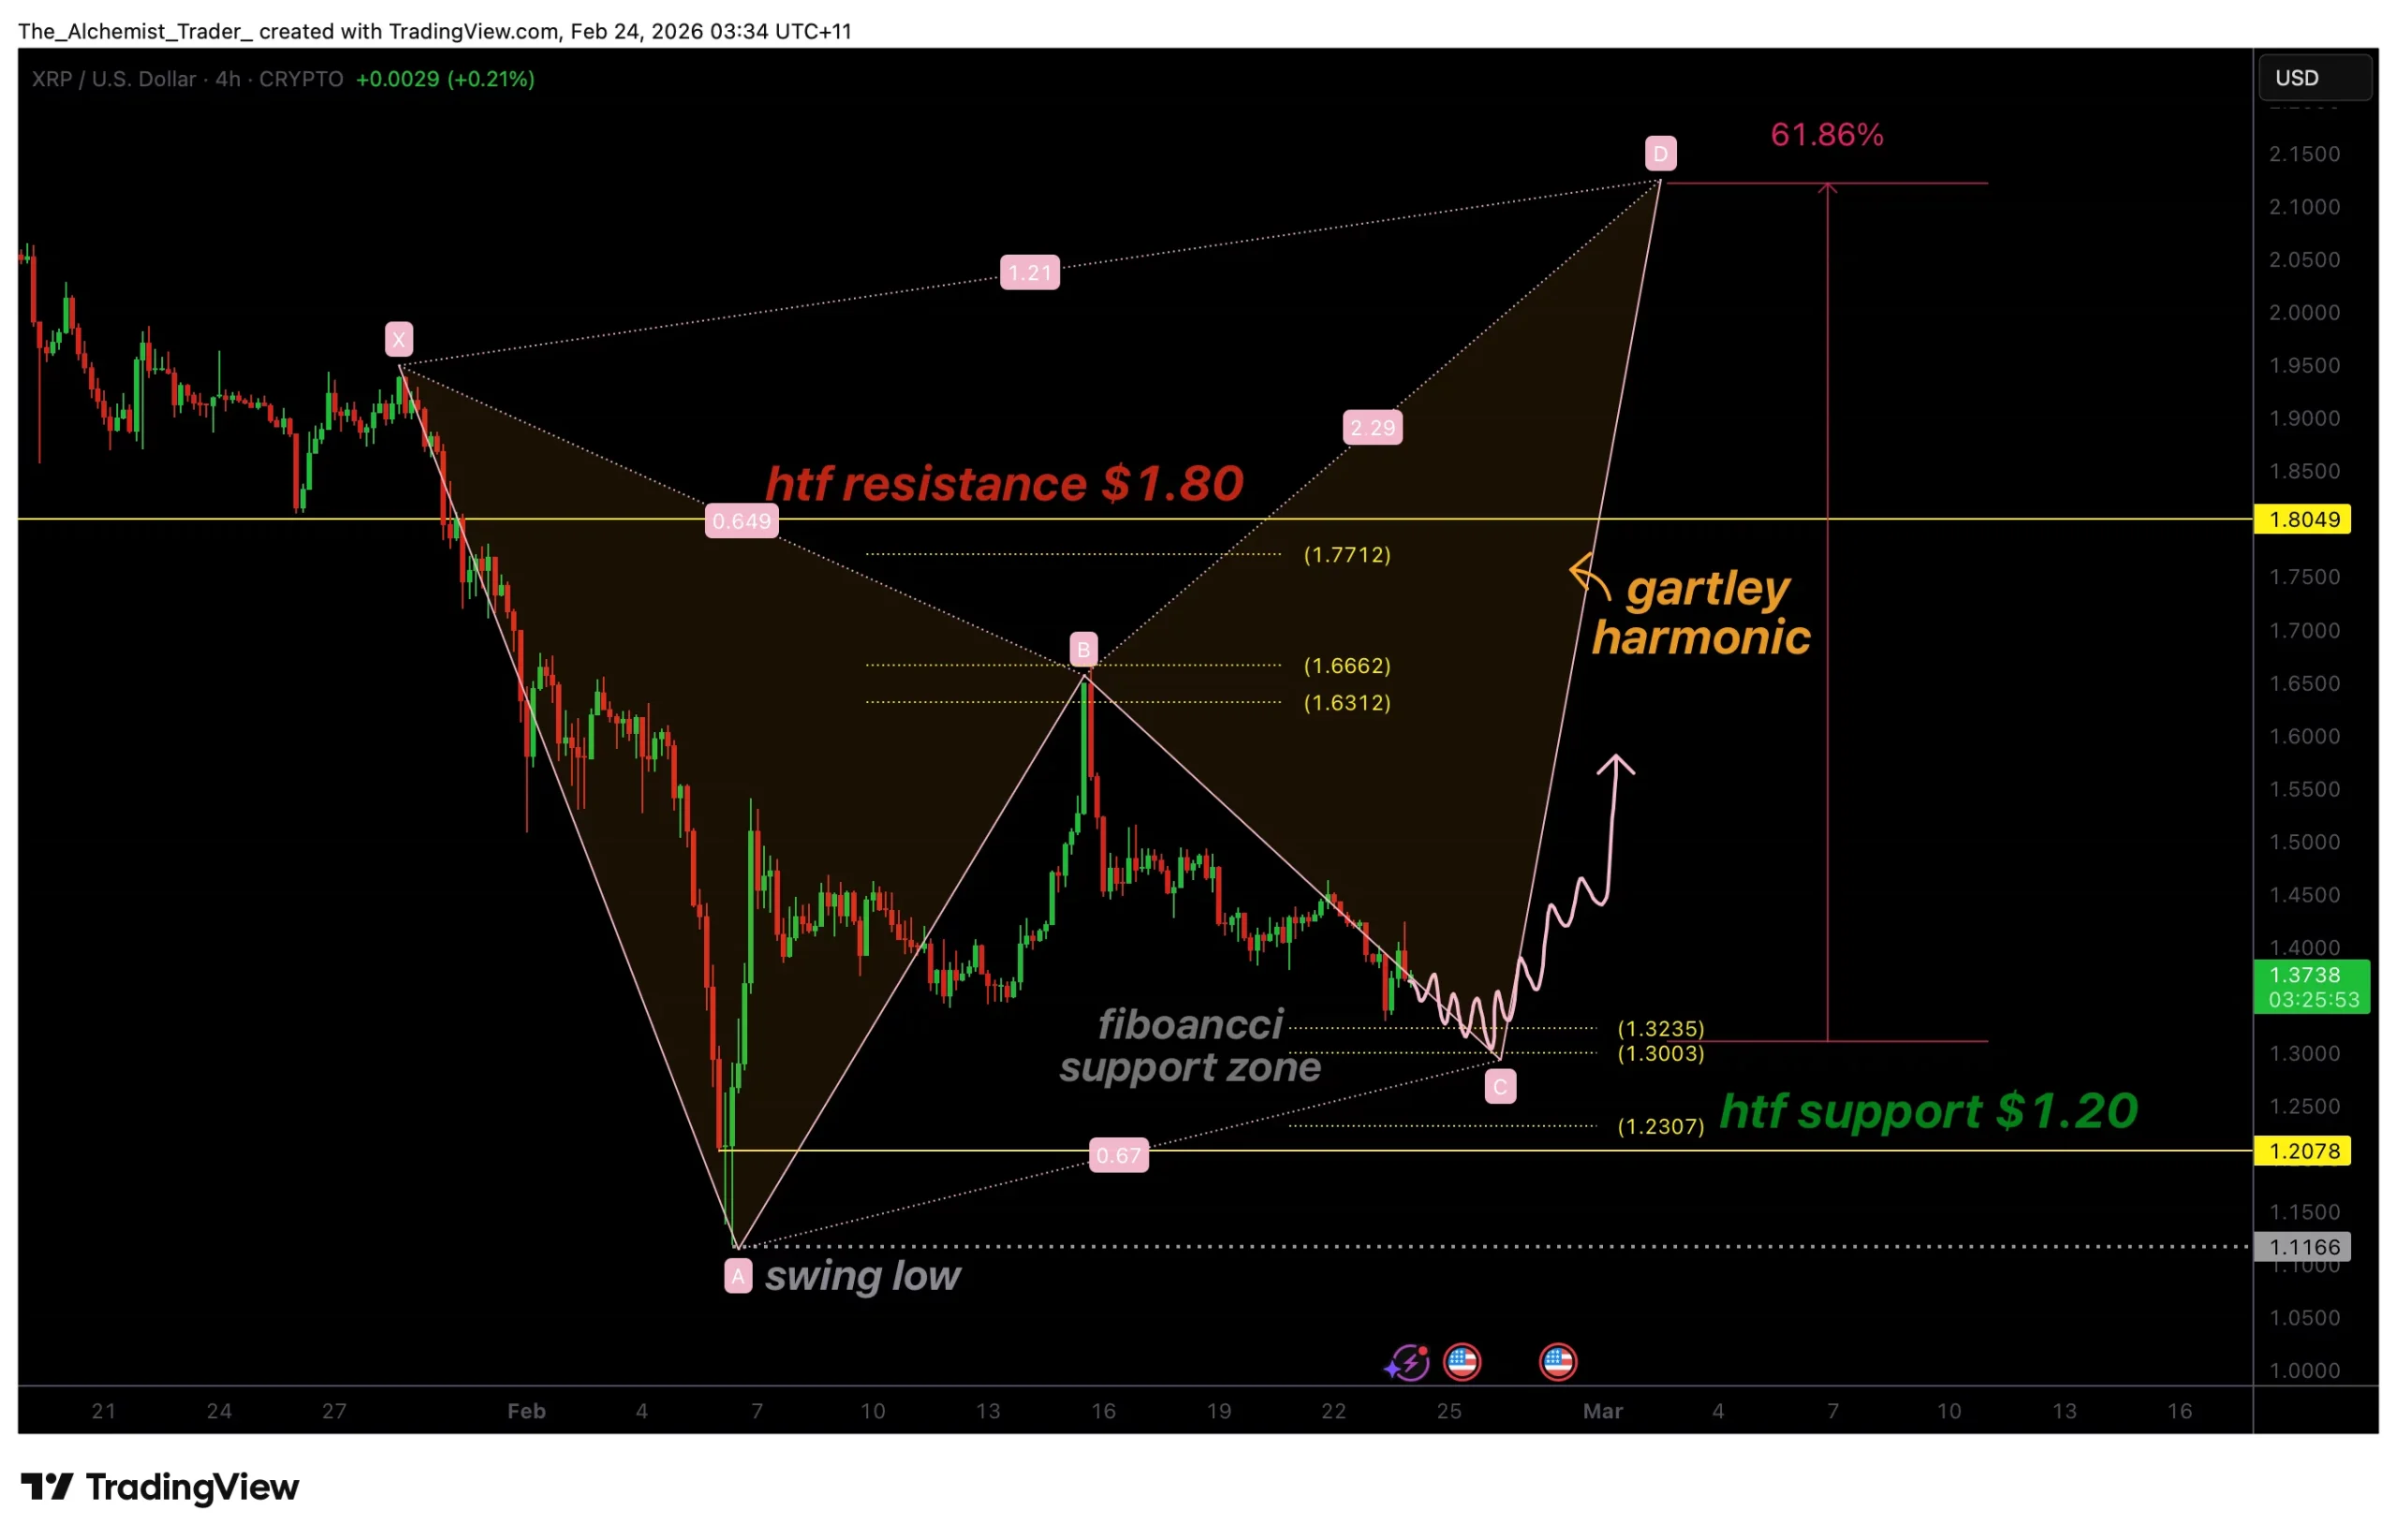
XRP (XRP) price action is beginning to show technical structure as a potential Gartley harmonic pattern develops near the $1.30 region. After weeks of rotational trading between high-timeframe resistance near $1.80 and strong support around $1.20, the market now appears to be transitioning into a pattern-driven consolidation phase that could precede a larger directional move.
Harmonic patterns, particularly the Gartley structure, rely heavily on Fibonacci relationships and precise price pivots. Recent XRP movements align closely with these technical requirements, with price rejecting key Fibonacci levels and forming recognizable swing structures. This evolving setup raises the question whether XRP is establishing a bullish bottom within its current range.
While confirmation is still required, the ongoing formation suggests a growing upside potential if support continues to hold.
XRP price key technical points
- Gartley pattern forming near $1.30: Fibonacci reactions are shaping harmonic structure development
- Range environment intact: XRP continues rotating between $1.80 resistance and $1.20 support
- Potential 60% upside projection: Completion of leg D could trigger a strong bullish rally
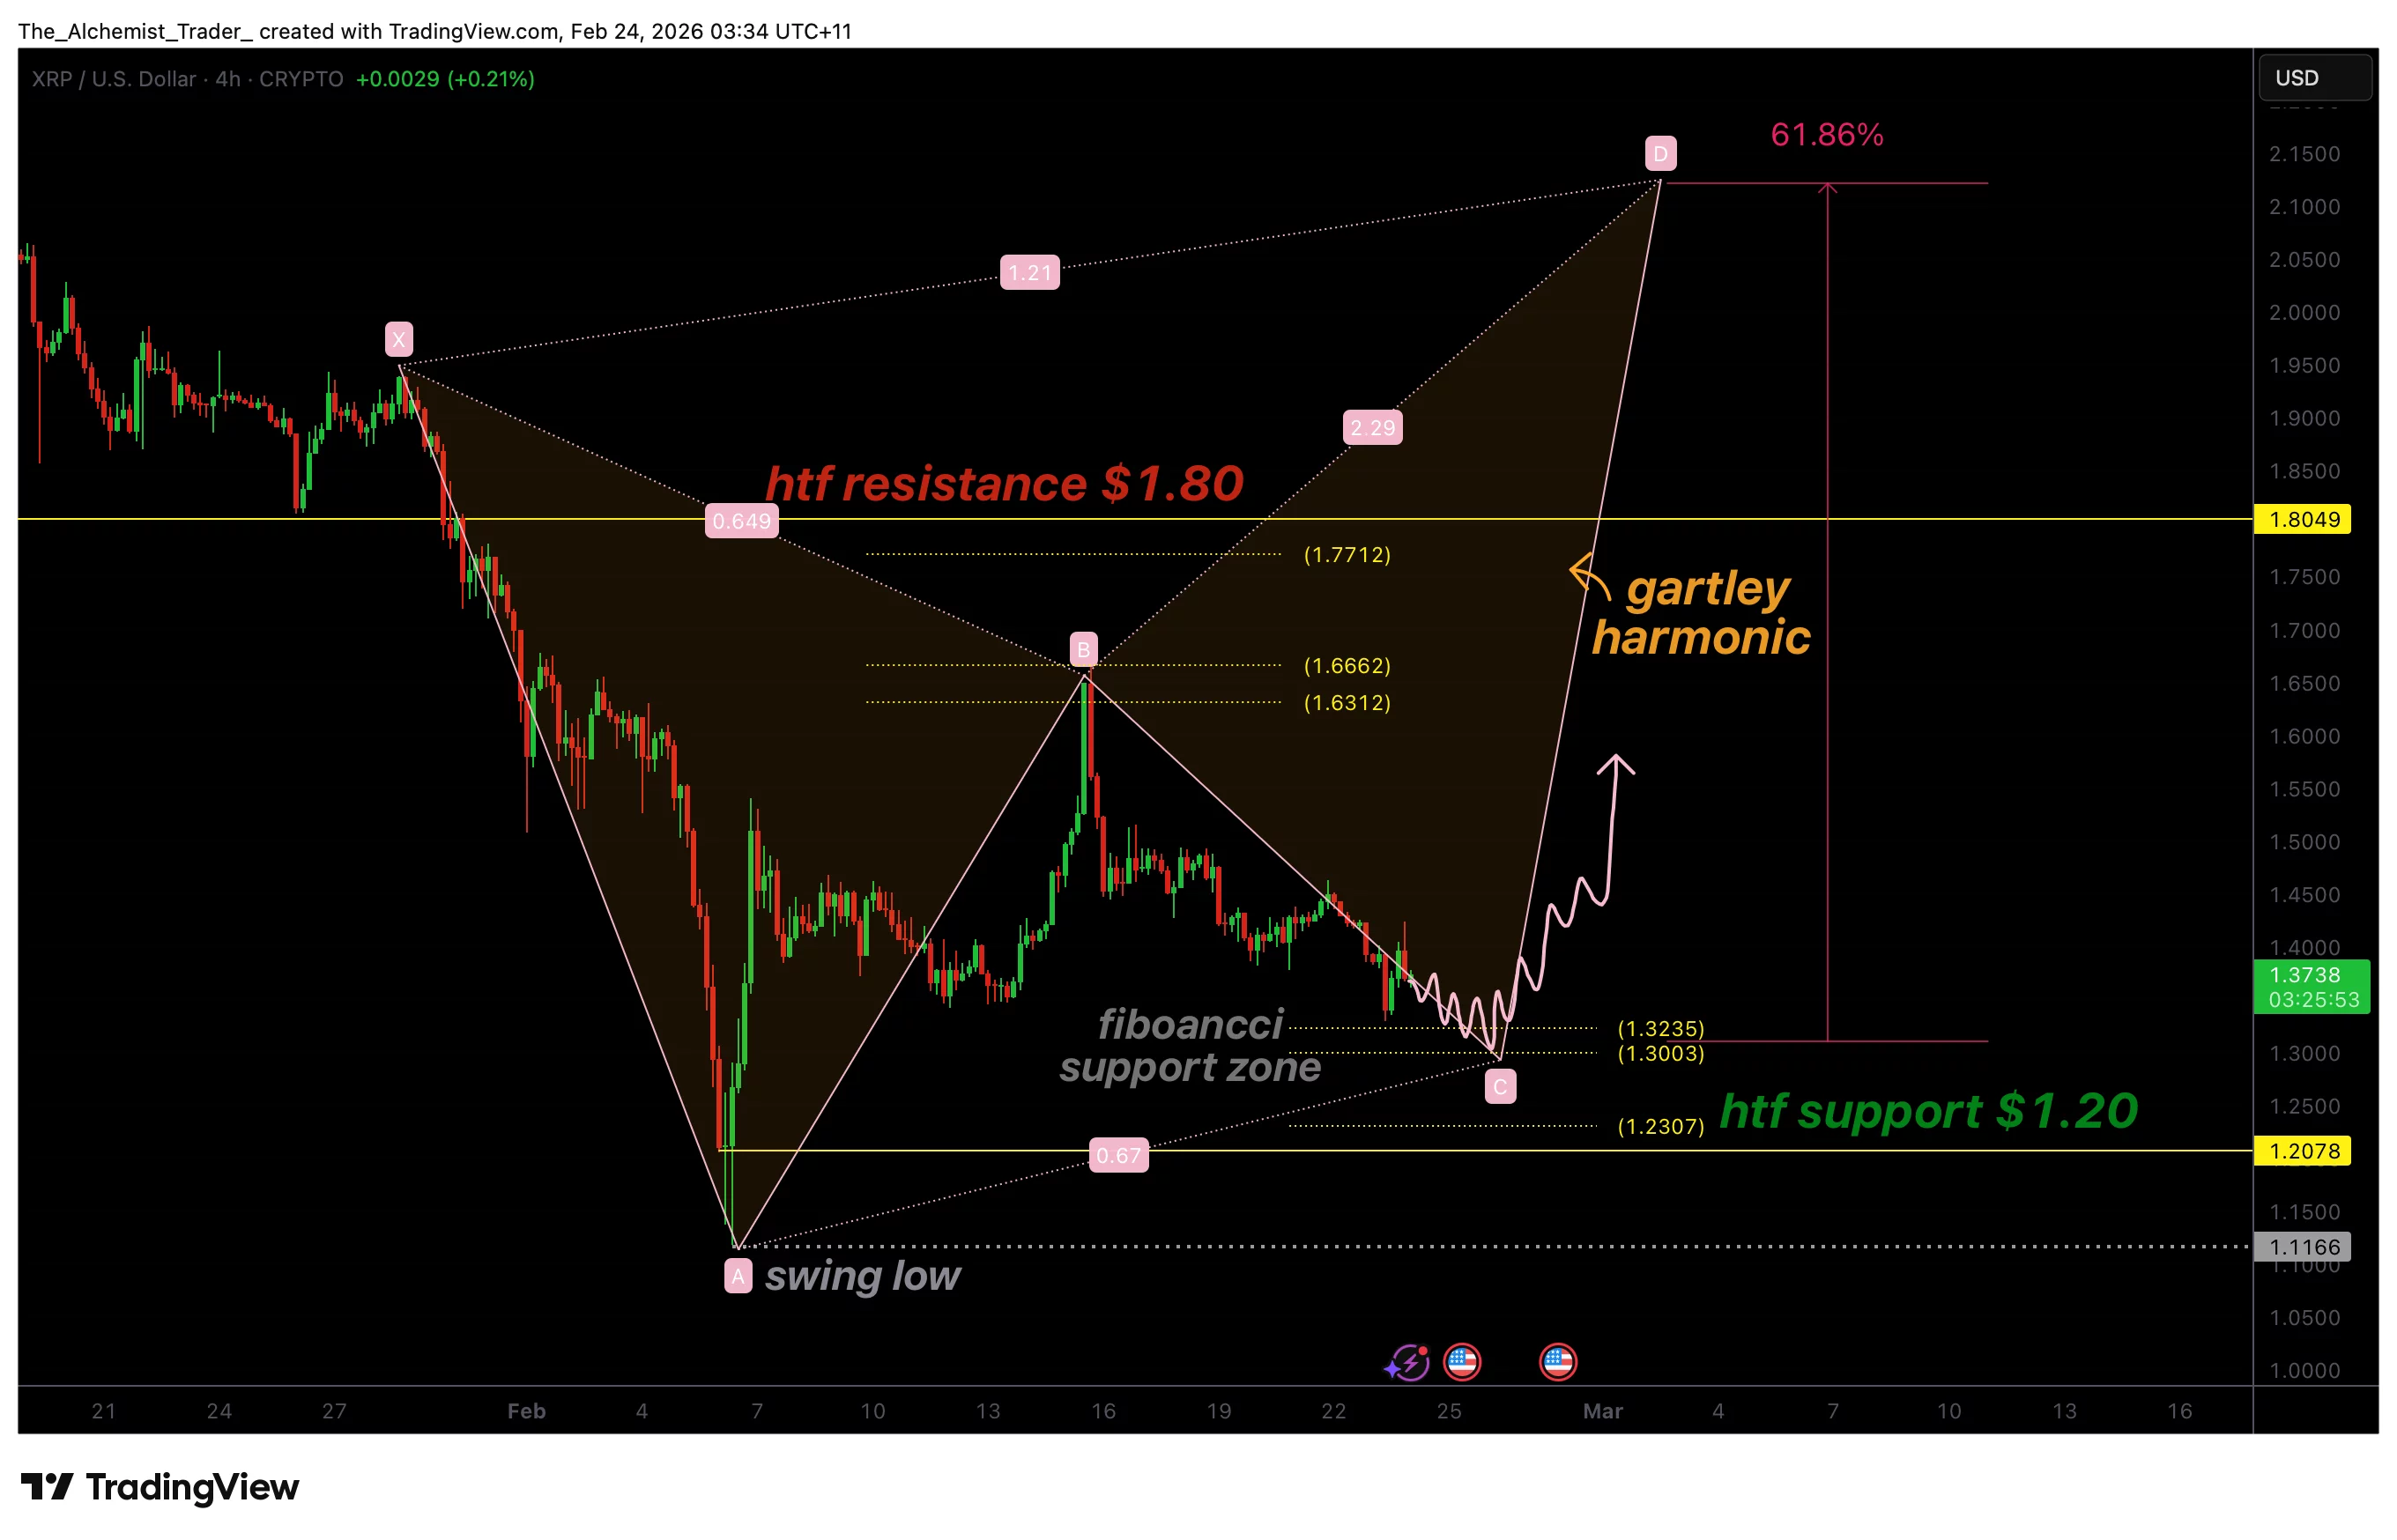
XRP has spent recent months trading within a well-defined range, oscillating between high-timeframe resistance at $1.80 and major structural support at $1.20. Rather than trending impulsively, price has displayed rotational behavior, a condition that often allows harmonic patterns to develop naturally.
The latest corrective move saw XRP reject the 0.618 Fibonacci retracement, an important technical reaction that supports the formation of a Gartley pattern. Price is currently trading below a local Fibonacci support zone, aligning with expectations for the ongoing development of the pattern’s internal legs.
In harmonic analysis, a Gartley pattern typically unfolds through multiple measured swings labeled X, A, B, C, and D. XRP appears to be progressing through the latter stages of this structure, with several clean pivots already established. These pivots reflect strong technical reactions at Fibonacci levels, reinforcing the validity of the developing setup.
Support defense critical for pattern validation
For the Gartley pattern to remain valid, XRP must continue to hold above the high-timeframe support near $1.20. This level represents a critical point of invalidation. Acceptance below it would weaken the harmonic structure and increase the probability of a deeper corrective move.
However, as long as price maintains support and reacts positively near the 0.618 Fibonacci region, the pattern continues to mature. The immediate focus shifts toward the completion of leg C, which typically precedes the impulsive move toward leg D, the final stage of the harmonic formation.
The significance of this stage lies in market psychology. Harmonic patterns often develop during periods of uncertainty, where both buyers and sellers test liquidity extremes before a clearer directional bias emerges. XRP’s repeated reactions at key Fibonacci zones suggest that market participants are actively responding to these technical levels.
Upside potential builds toward leg d completion
If XRP successfully completes leg C and establishes support in the current technical region, the probability increases for a bullish expansion toward the projected completion of leg D. Based on harmonic measurements, this move could represent a rally of approximately 60% from current price levels.
The projected upside aligns with higher resistance areas within the broader range structure, potentially revisiting zones closer to $1.80 and beyond. Importantly, this scenario does not require an immediate breakout but instead reflects a structured recovery within the existing market framework
Momentum confirmation will likely come through sustained higher lows, improved trading volume, and continued respect of Fibonacci retracement levels. These factors would signal that buyers are gaining confidence and positioning ahead of a larger move.
What to Expect in the Coming Price Action
From a technical, price-action, and market-structure perspective, XRP’s developing Gartley pattern suggests a bullish bottom may be forming near $1.30. As long as price remains above the $1.20 high-timeframe support and holds the 0.618 Fibonacci region, the probability favors completion of leg C followed by a rally toward leg D.

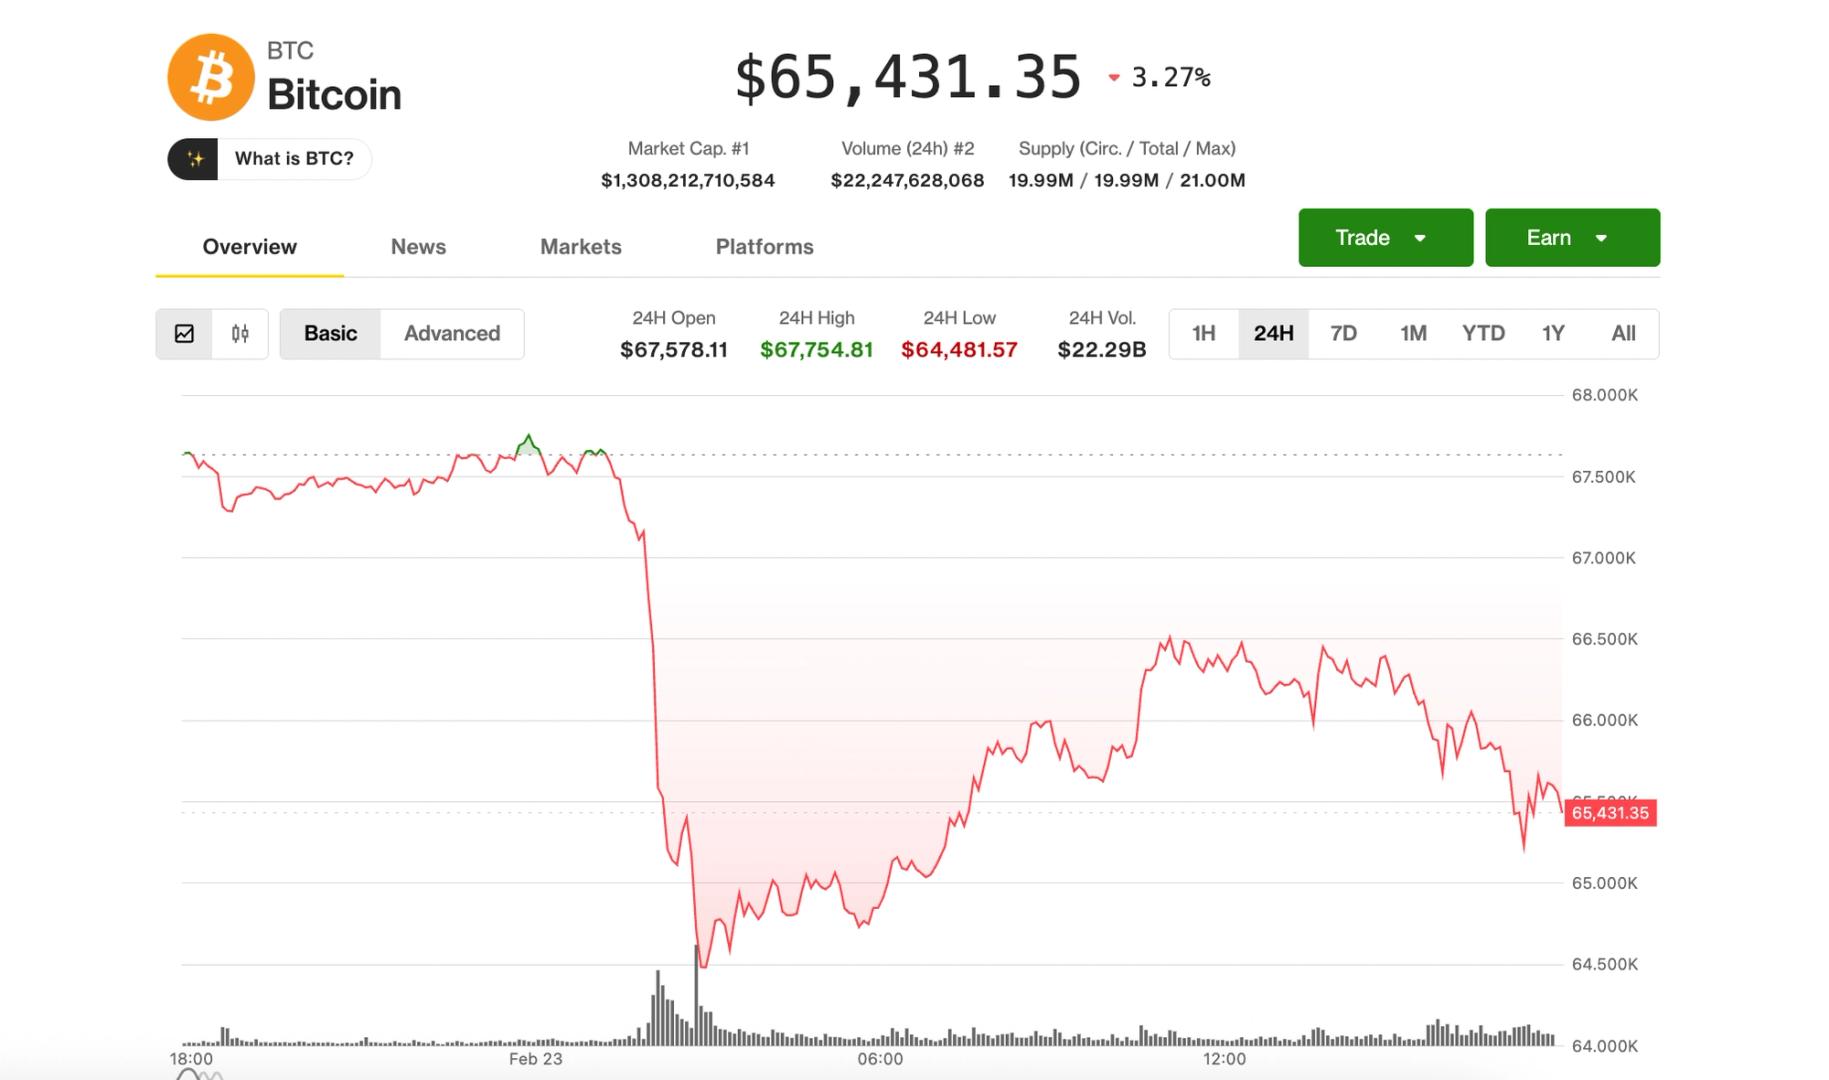
Bitcoin dipped below $65,000 on Monday as investors weighed mounting tariff uncertainties and geopolitical concerns.
The token traded as low as $64,830 early as it continued a nearly 5% slide that began a day earlier. Over the weekend, that decline brought the digital asset to $64,324 at its nadir, marking its lowest level since Feb. 6 when it hit $60,062.
Bitcoin was last down more than 2% at $65,836.68 at 9:40 a.m. ET.

Bitcoin YTD
The world’s oldest cryptocurrency has taken a dive, particularly as geopolitical and macroeconomic uncertainties spark investors’ flight from risk-on investments.
Last week, U.S. President Donald Trump said he would decide whether to strike Iran “over the next probably 10 days” due to its resistance toward a new nuclear deal. The tensions seemed to build over the past few days, with the U.S. continuing to position its military forces across the Middle East.
Separately, Trump said Saturday in a social media post that he would raise his so-called retaliatory tariffs against many of the U.S.’ foreign trading partners to 15%, “effective immediately,” just one day after the Supreme Court struck down his previous trade taxes.
Since the beginning of the year, Bitcoin has lost 24% due to the onslaught of macro threats, while risk-off assets like precious metals have surged. Gold has gained about 20% in the year to date, while silver has added 23% during the same period.

Bitcoin’s very modest rebound from its steep overnight selloff quickly fizzled out during U.S. morning trading on Monday as broader risk markets turned sharply lower.
Trading at $65,400 near the noon hour on the east coast, bitcoin was down 35% over the past 24 hours.
The action occurred as U.S. equities tumbled. The S&P 500 and the tech-heavy Nasdaq 100 were each lower by more than 1%, led by renewed weakness in software stocks and private-equity names.
The iShares Expanded Tech-Software ETF (IGV) sank another 5% to a fresh 52-week low and is now down nearly 35% since October amid concerns that generative AI tools could disrupt traditional software business models. Whether true or not, current market thinking is that crypto is just software, and price movements of bitcoin and IGV of late have been nearly perfectly correlated.
Adding to that bearish theme are continuing worries that AI could be leading markets to the cusp of a major negative credit event similar to that of 2008’s global financial crisis. This is currently reflected in private equity share prices. These companies have heavy exposure to the afore-mentioned software sector. Blow Owl Capital (OWL) — which last week sold assets in an attempt to mollify liquidity-seeking investors — is lower by another 3.5% Monday and 32% year-to-date. BlackStone (BX), Ares Management (ARES), and Apollo Global Management (APO) all added to their sizable recent losses, falling between 6% and 8%.
Crypto often trades as a high-beta proxy for tech and broader liquidity conditions, and Monday’s weakness reflected that dynamic. While BTC has so far held above the worst of its early February lows, it still trades in a tight range between $60,000 and $70,000 as risk appetite remains fragile.
Added to all of this is uncertainty about global tariffs after the Supreme Court clamped down on President Trump’s previous use of sweeping levies, Joel Kruger, market strategist at LMAX Group, said in a note.
“This sparked a classic risk-off environment,” Kruger said. “Investors pulled back from speculative assets like crypto, with bitcoin behaving more like a high-beta risk play than ‘digital gold.’”

Ali Martinez points to a rare three-day signal that historically appeared just before Bitcoin’s final bear-market plunges.
A key technical signal that has foreshadowed the final capitulation phase of previous Bitcoin (BTC) bear markets is flashing again.
According to chartist Ali Martinez, a “death cross” on the three-day chart could be confirmed in late February, potentially sending BTC to $40,000 or even $30,000.
The Death Cross Pattern and What History Shows
Martinez pointed to the three-day chart as a crucial timeframe for understanding Bitcoin’s macro structure, noting that the interaction between the 50 and 200 simple moving averages on this chart has reliably signaled the last major downside move since 2014.
“The death cross between these two moving averages on the 3-day chart has consistently preceded the final leg down of a bear market,” the trader wrote.
Following the 2013 top, Bitcoin dropped more than 72% before the death cross printed in December 2014, after which it fell another 52%. After the 2017 peak, the death cross appeared in November 2018, coming just before a final 50% decline. The signal emerged again in May 2022, following the 2021 top, which led to an additional 45% drop.
Bitcoin registered a new all-time high (ATH) in October 2025 when it went above $126,000, but the current price, which had recovered to just over $66,000 at the time of writing after earlier shedding about $4,000 in only a matter of hours, is nearly 48% below that ATH.
With a potential death cross projected for late February, Martinez warns that if history repeats even partially, a further 30% decline would place Bitcoin near $40,000, while a 50% drop could take it to $30,000.
However, the market watcher was quick to note that there were no guarantees the price drops would happen, even though the current structure matches up with historical setups that led to the last major downside moves before macro bottoms formed.
You may also like:
Market Reaction and On-Chain Divergence
Bitcoin is currently down about 2.5% in the last 24 hours and more than 4% over the past week. It has also lost nearly 27% of its value in the past month, a drop exacerbated by U.S. President Donald Trump’s recent announcement of a 10% (later upgraded to 15%) temporary global tariff after the country’s Supreme Court struck down many of the previous tariffs the Trump administration had imposed under a 1977 emergency law.
As seen during past tariff-related volatility, the impact on Bitcoin wasn’t immediate but arrived once legacy futures markets opened. It also sparked a coordinated bearish impulse in the futures market, with data from analyst Axel Adler Jr. showing that taker sell volume spiked to $2.3 billion in a single hour, accompanied by forced long liquidations of approximately 1,247 BTC worth more than $81 million.
Santiment data confirmed the liquidation cascade, noting open interest dropped to $19.5 billion, which is less than half its January peak, leading to skyrocketing negative sentiment, and the Bitcoin market entering “FUD mode.”
Binance Free $600 (CryptoPotato Exclusive): Use this link to register a new account and receive $600 exclusive welcome offer on Binance (full details).
LIMITED OFFER for CryptoPotato readers at Bybit: Use this link to register and open a $500 FREE position on any coin!
Even though bitcoin (BTC) is, historically speaking, one of the best performing assets of all time, on most days its performance isn’t actually all that impressive. In fact, almost all of its long term returns are crammed into a small number of trading sessions.
The rest of the time, it chops around.
For example, on November 17-18, 2013, BTC rallied 50%. Take these two days out of the equation and every early Bitcoiner’s return would be halved.
Elsewhere, on July 20, 2017, BTC rallied 27% and in December of that same year, it surged 40%.
To have made the most of the rally that’s exceeded one million percent between 2009 and July 2012, investors needed to be holding during rare bull runs.
Read more: Bitcoin Core promotes first Trusted Keys maintainer in three years
Visualizing the uneven returns of bitcoin
There are various ways to visualize the irregular days that generate the vast majority of BTC investment returns.
The most appropriate method might be a giant calendar highlighting the tiny number of days responsible for the majority of BTC returns.
Similarly, the same calendar could highlight the fewest days that would have zeroed out the lifetime return of BTC if an investor hadn’t held on during those days.
That number is shockingly small: less than 100 of the 5,000 days since July 2012.
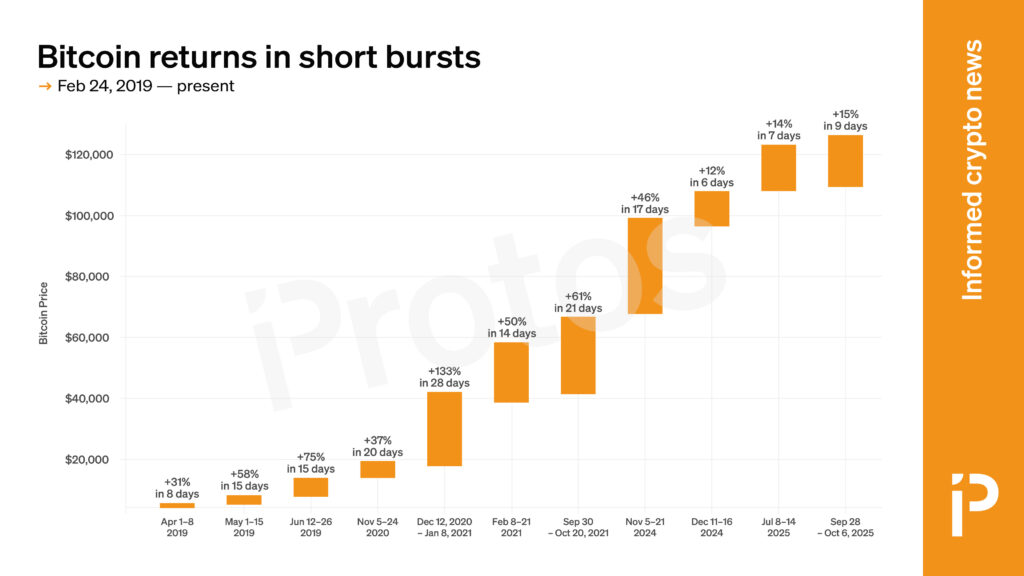
Whereas a vast and mostly blank calendar certainly conveys the message about clustered outperformance amid normally unremarkable behavior, perhaps the most visually compelling way to track this data is to show the price change by periods of significant rallies.

From a starting point exactly seven years ago, there have been 11 significant BTC rallies that achieved new highs. The above chart illustrates these periods.
- April 1-8, 2019: $4,095 to $5,347, a 31% gain in eight days
- May 1-15, 2019: $5,268 to $8,300, a 58% gain in 15 days
- June 12-26, 2019: $7,916 to $13,880, a 75% gain in 15 days
- November 5-24, 2020: $14,168 to $19,442, a 37% gain in 20 days
- December 12, 2020-January 8, 2021: $18,031 to $42,000, a 133% gain in 28 days
- February 8-21, 2021: $38,870 to $58,354, a 50% gain in 14 days
- September 30-October 20, 2021: $41,538 to $67,017, a 61% gain in 21 days
- November 5-21, 2024: $67,817 to $99,121, a 46% gain in 17 days
- December 11-16, 2024: $96,658 to $107,821, a 12% gain in six days
- July 8-14, 2025: $108,286 to $123,236, a 14% gain in seven days
- September 28-October 6, 2025: $109,679 to $126,272, a 15% gain in nine days
Eleven periods outperformed BTC
As a simple, non-cumulative sum, these rallies are worth 532% or one-third of the 1,540% BTC rally from $4,100 seven years ago to its $67,200 price as of writing.
On a compounded basis, those 11 trading periods are worth 5,800% or nearly quadruple the actual seven-year gain in BTC.
Yes, had an investor only held during those periods and reinvested fully each time, they’d have substantially outperformed BTC.
Of course, no investor can magically time the market perfectly. Nonetheless, this exercise shows how important the returns of a very short number of days are to the overall returns of one of the world’s all-time best-performing assets.
Got a tip? Send us an email securely via Protos Leaks. For more informed news, follow us on X, Bluesky, and Google News, or subscribe to our YouTube channel.

Officials advising Donald Trump’s “Board of Peace” are exploring a US dollar-backed stablecoin for Gaza, according to reports from the Financial Times. The proposal remains in early stages.
However, it signals a potential shift toward using crypto as core infrastructure in Gaza’s post-war economic reconstruction.
Turning Gaza Into a Crypto Project?
According to the Financial Times, the stablecoin would be pegged to the US dollar and used to facilitate digital payments, not replace Gaza with a sovereign currency.
Governance would involve the Board of Peace and Gaza’s interim technocratic administration.
The discussions come as Gaza’s banking system remains severely impaired. Cash access has been restricted since 2023 due to ATM destruction and limits on physical currency deliveries.
As a result, digital payments have become more common, though connectivity and financial infrastructure remain fragile.
Board of Peace Takes Central Role in Gaza Transition
The Board of Peace sits at the center of Trump’s broader 20-point plan for Gaza. Trump chairs the body. Its members include senior US officials such as Secretary of State Marco Rubio and envoy Steve Witkoff, alongside international figures like former UK Prime Minister Tony Blair and World Bank President Ajay Banga.
The board oversees Gaza’s transitional governance, reconstruction planning, and economic recovery. It also coordinates with a Palestinian technocratic committee tasked with restoring services and managing daily administration.
Meanwhile, an international stabilization force is expected to handle security and policing during the transition period.
Within this framework, the stablecoin proposal reflects a broader effort to rebuild Gaza’s financial system without relying on traditional banking infrastructure.
Promise of Financial Access, But Ethical Risks of Control
In theory, a stablecoin could help restore economic activity. Digital dollars could enable aid delivery, salaries, and daily transactions even without functioning banks. This could potentially improve transparency and reduce corruption in aid distribution.
However, the plan raises serious ethical and political concerns. A digitally controlled currency governed by an international body could give external actors unprecedented influence over Gaza’s financial system. Every transaction could be tracked.
Access could potentially be restricted or revoked.
Moreover, introducing a separate payment system risks further separating Gaza economically from the West Bank. Infrastructure limits, including Gaza’s reliance on slow 2G networks, could also hinder adoption.
For now, the stablecoin remains only a proposal.
However, if implemented, it would represent one of the first attempts to rebuild a post-conflict economy using digital dollar infrastructure — a move that could reshape both Gaza’s future and the global role of stablecoins.

TLDR
- Novo Nordisk stock fell 15% after CagriSema failed to prove non-inferiority to Eli Lilly’s tirzepatide in an 84-week trial.
- CagriSema delivered 23% weight loss vs. 25.5% for tirzepatide — missing its primary endpoint.
- The stock hit its lowest level since June 2021, down nearly 50% over the past year.
- Novo’s CEO remains confident in CagriSema, citing its potential as the first GLP-1/amylin combo drug on the market.
- Eli Lilly stock rose 3.1% in premarket trading on the news.
Novo Nordisk took another hit on Monday. The stock fell as much as 15% after the company revealed its next-generation weight loss drug, CagriSema, failed to prove it was just as good as Eli Lilly’s tirzepatide in a head-to-head trial.
The result sent NVO to its lowest price since June 2021.
In the late-stage trial, patients on CagriSema lost 23% of their body weight over 84 weeks. Those on tirzepatide — the active ingredient in Lilly’s Mounjaro and Zepbound — lost 25.5%.
That gap meant CagriSema missed its primary endpoint: showing non-inferiority to tirzepatide.
The trial was open-label, meaning participants knew which drug they were taking. Novo’s Chief Scientific Officer Martin Holst Lange said this design can introduce bias toward a well-known product when tested against an experimental one.
Lange said he was “surprised” by tirzepatide’s 25.5% result, pointing out that Lilly’s own studies have shown the drug producing around 20.2% weight loss over 72 weeks.
CEO Stays Optimistic
Despite the miss, CEO Mike Doustdar pushed back on the negativity. “We strongly believe that CagriSema has, right now, the best weight efficacy than any product currently in the market,” he said.
Novo filed CagriSema with the FDA late last year, and a decision is expected by late 2026. Doustdar said he expects it to reach the market early next year with the best weight-loss label available.
The company is also exploring additional trials, including higher-dose combinations, to maximize the drug’s potential.
CagriSema combines semaglutide — the ingredient in Ozempic and Wegovy — with cagrilintide, an experimental hormone that affects appetite. Novo has positioned it as the first GLP-1/amylin combination treatment for obesity.
A Rough Run for Novo
This is not an isolated setback. When Novo first released CagriSema late-stage data in December 2024, the stock dropped 21% and wiped out nearly $100 billion in market value.
Over the past year, NVO has lost close to 50% of its value.
Earlier this month, Novo forecast a sales and profit decline of between 5% and 13% for 2026. The company is dealing with rising competition, lower U.S. prices, and upcoming patent expirations on Wegovy and Ozempic in some markets.
Jefferies analyst Michael Leuchten noted that CagriSema’s commercial positioning is “increasingly unclear” following Monday’s results. He estimated the drug could account for 15% to 25% of Novo’s revenue by 2030 and said the situation highlights “the pressing need for M&A,” forecasting Novo could spend up to $35 billion on acquisitions this year.
Meanwhile, Eli Lilly’s stock rose 3.1% in premarket trading Monday.
Novo’s Copenhagen-listed stock was last seen down 14% at 259 Danish kroner.

Dogecoin price is stuck in a technical bear market, a trend that may continue as key metrics like exchange-traded fund inflows and futures open interest slip.
Summary
- Dogecoin price has formed a large head-and-shoulders pattern.
- Data shows that spot DOGE ETFs have had no inflows in weeks.
- Dogecoin’s futures open interest has continued falling.
Dogecoin (DOGE) token was trading at $0.09610, down by 80% from its highest level in November 2024. It is hovering near its lowest level since September 2024.
DOGE, the biggest meme coin in the crypto industry, has dropped, mirroring the performance of Bitcoin (BTC) and other altcoins. It has also mirrored the performance of other meme coins like Shiba Inu and Bonk.
Third-party data shows that Dogecoin’s demand has waned in the past few months. A good example of this is in Wall Street, where DOGE ETFs by companies like Grayscale, 21Shares, and BitWise have not attracted any inflows since February 3.
Their cumulative inflows this month is just $252k, with their assets being $9 million. In contrast, spot XRP ETFs have over $1 billion in assets, while Solana have $775 million.
More data shows that the futures open interest has tumbled in the past few months. It has dropped to $1 billion, down from $5.2 billion in September last year. Falling open interest is a sign that demand from the highly active traders has continued falling.
The open interest has been in a downtrend after the major liquidation event that happened in October last year. In most cases, falling interest during a downtrend is a sign that demand is waning.
Dogecoin price prediction: technical analysis
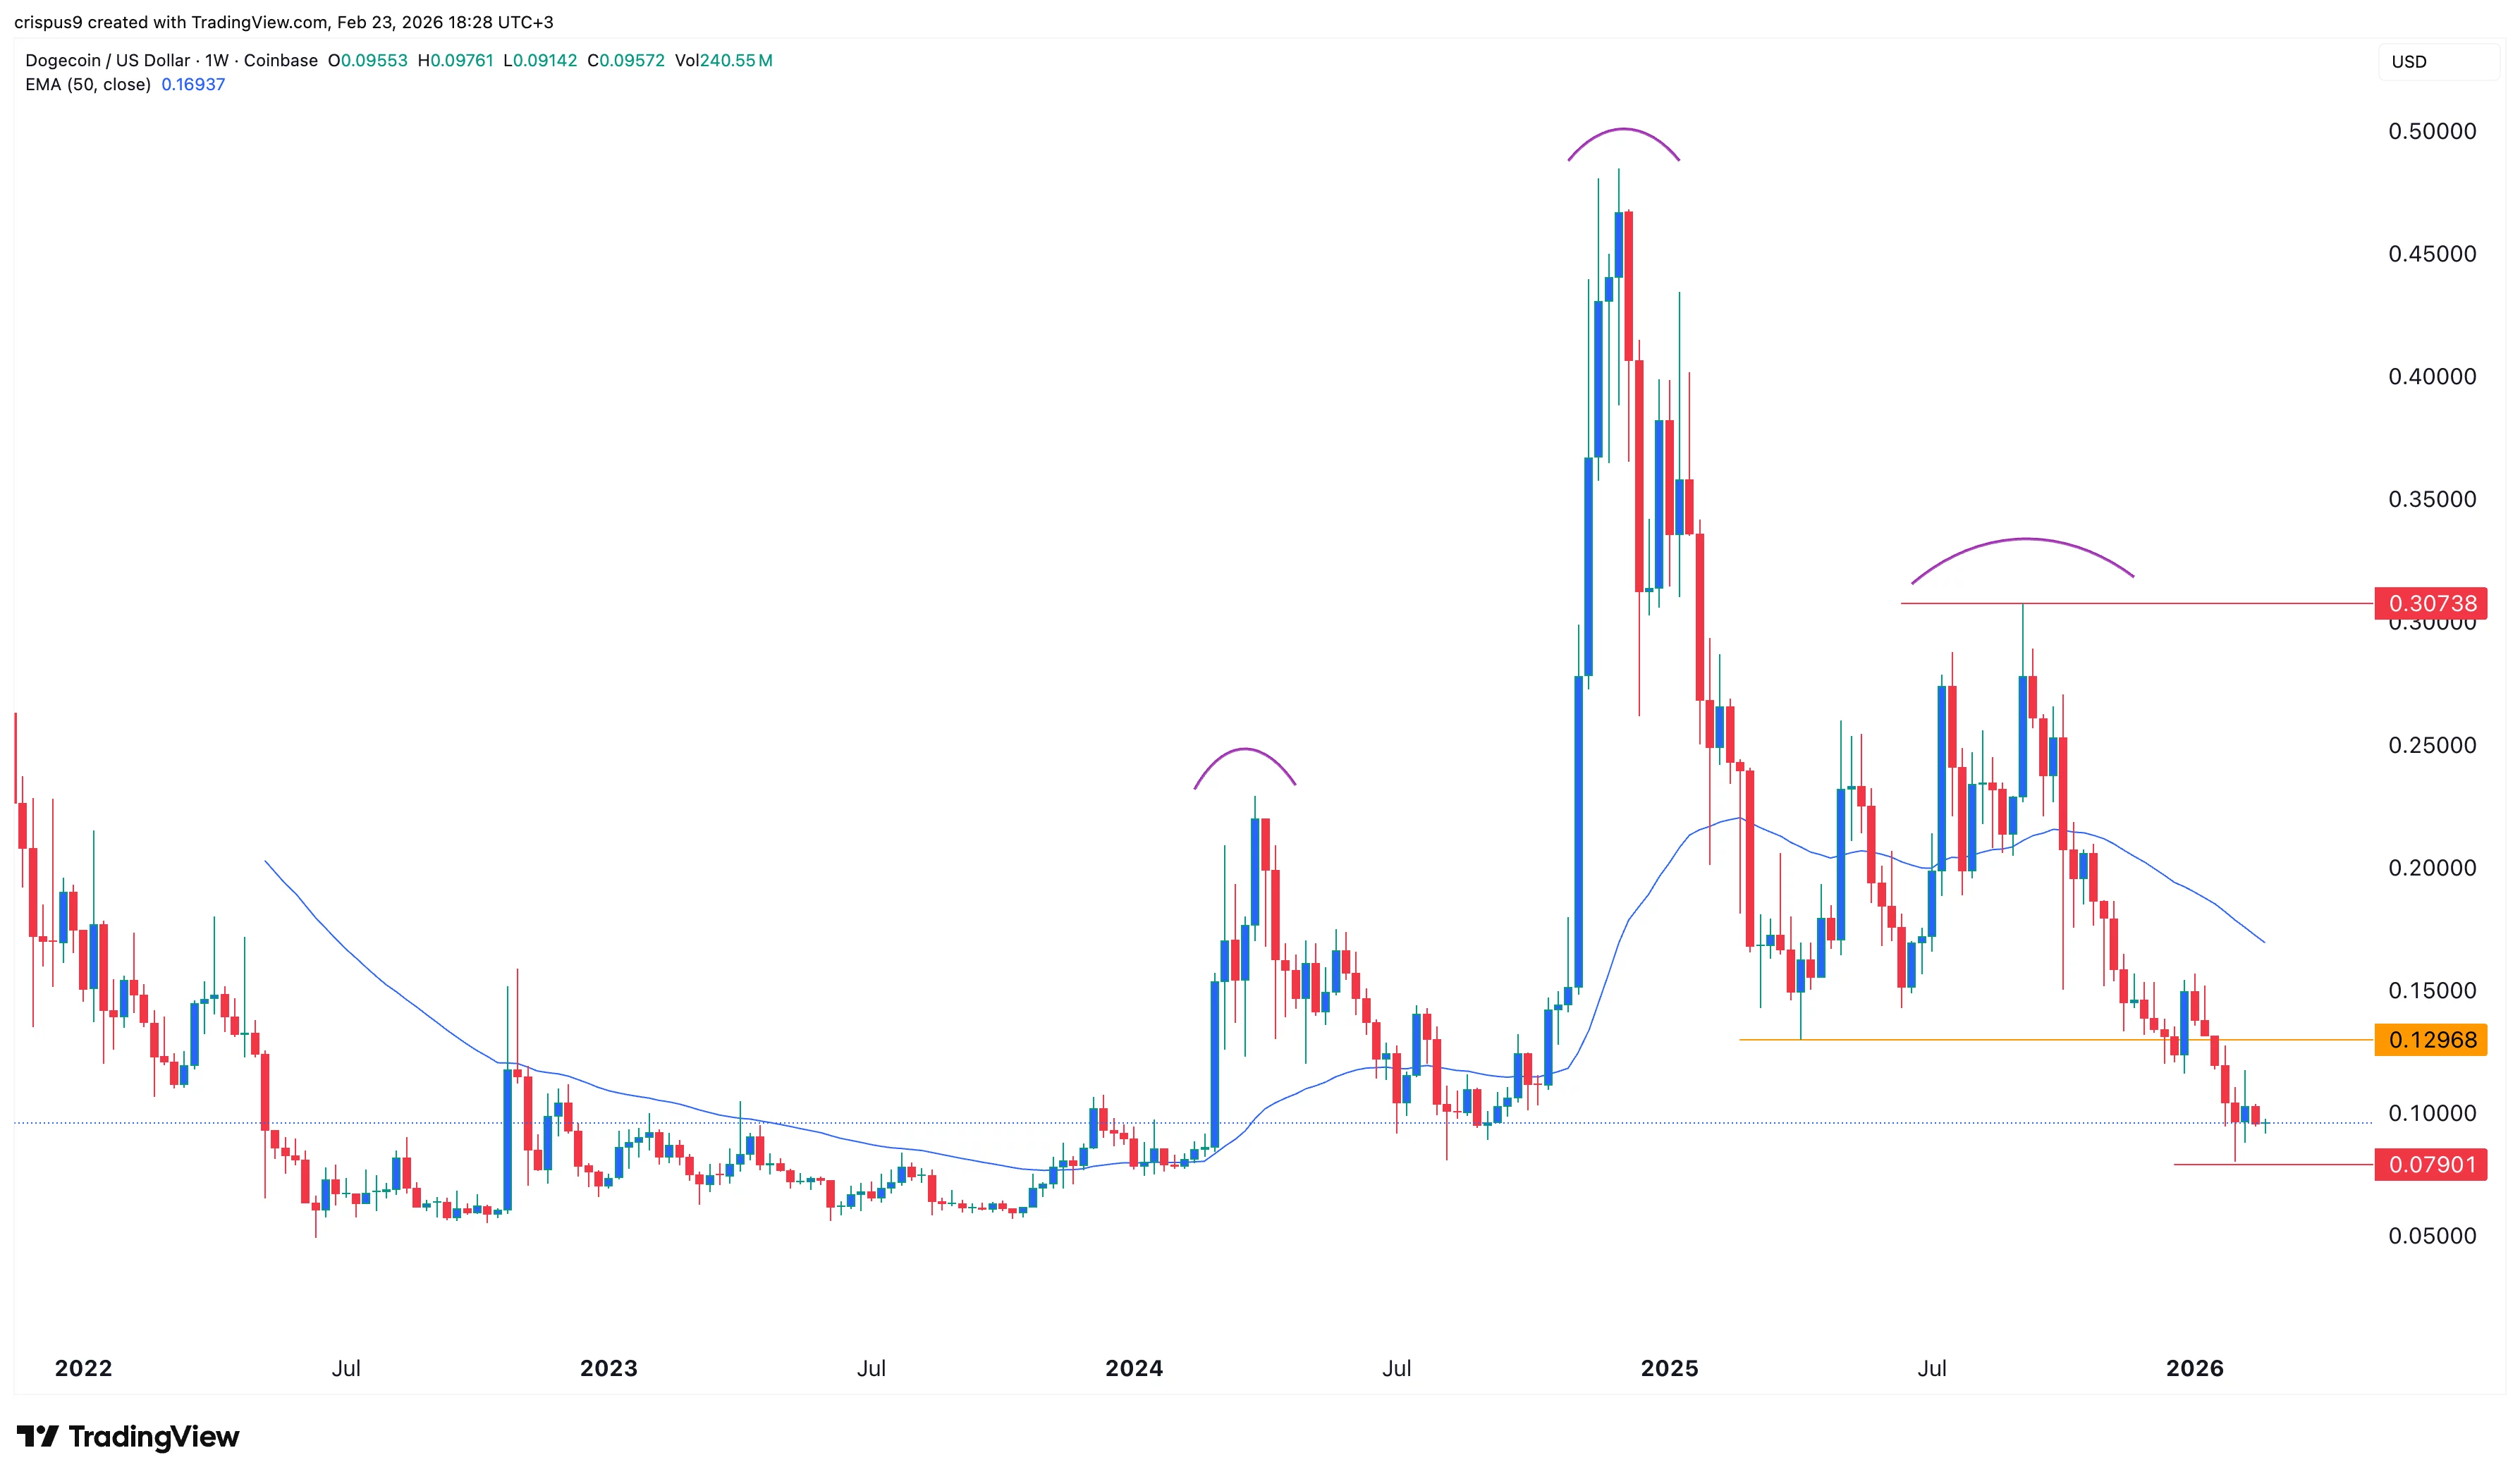
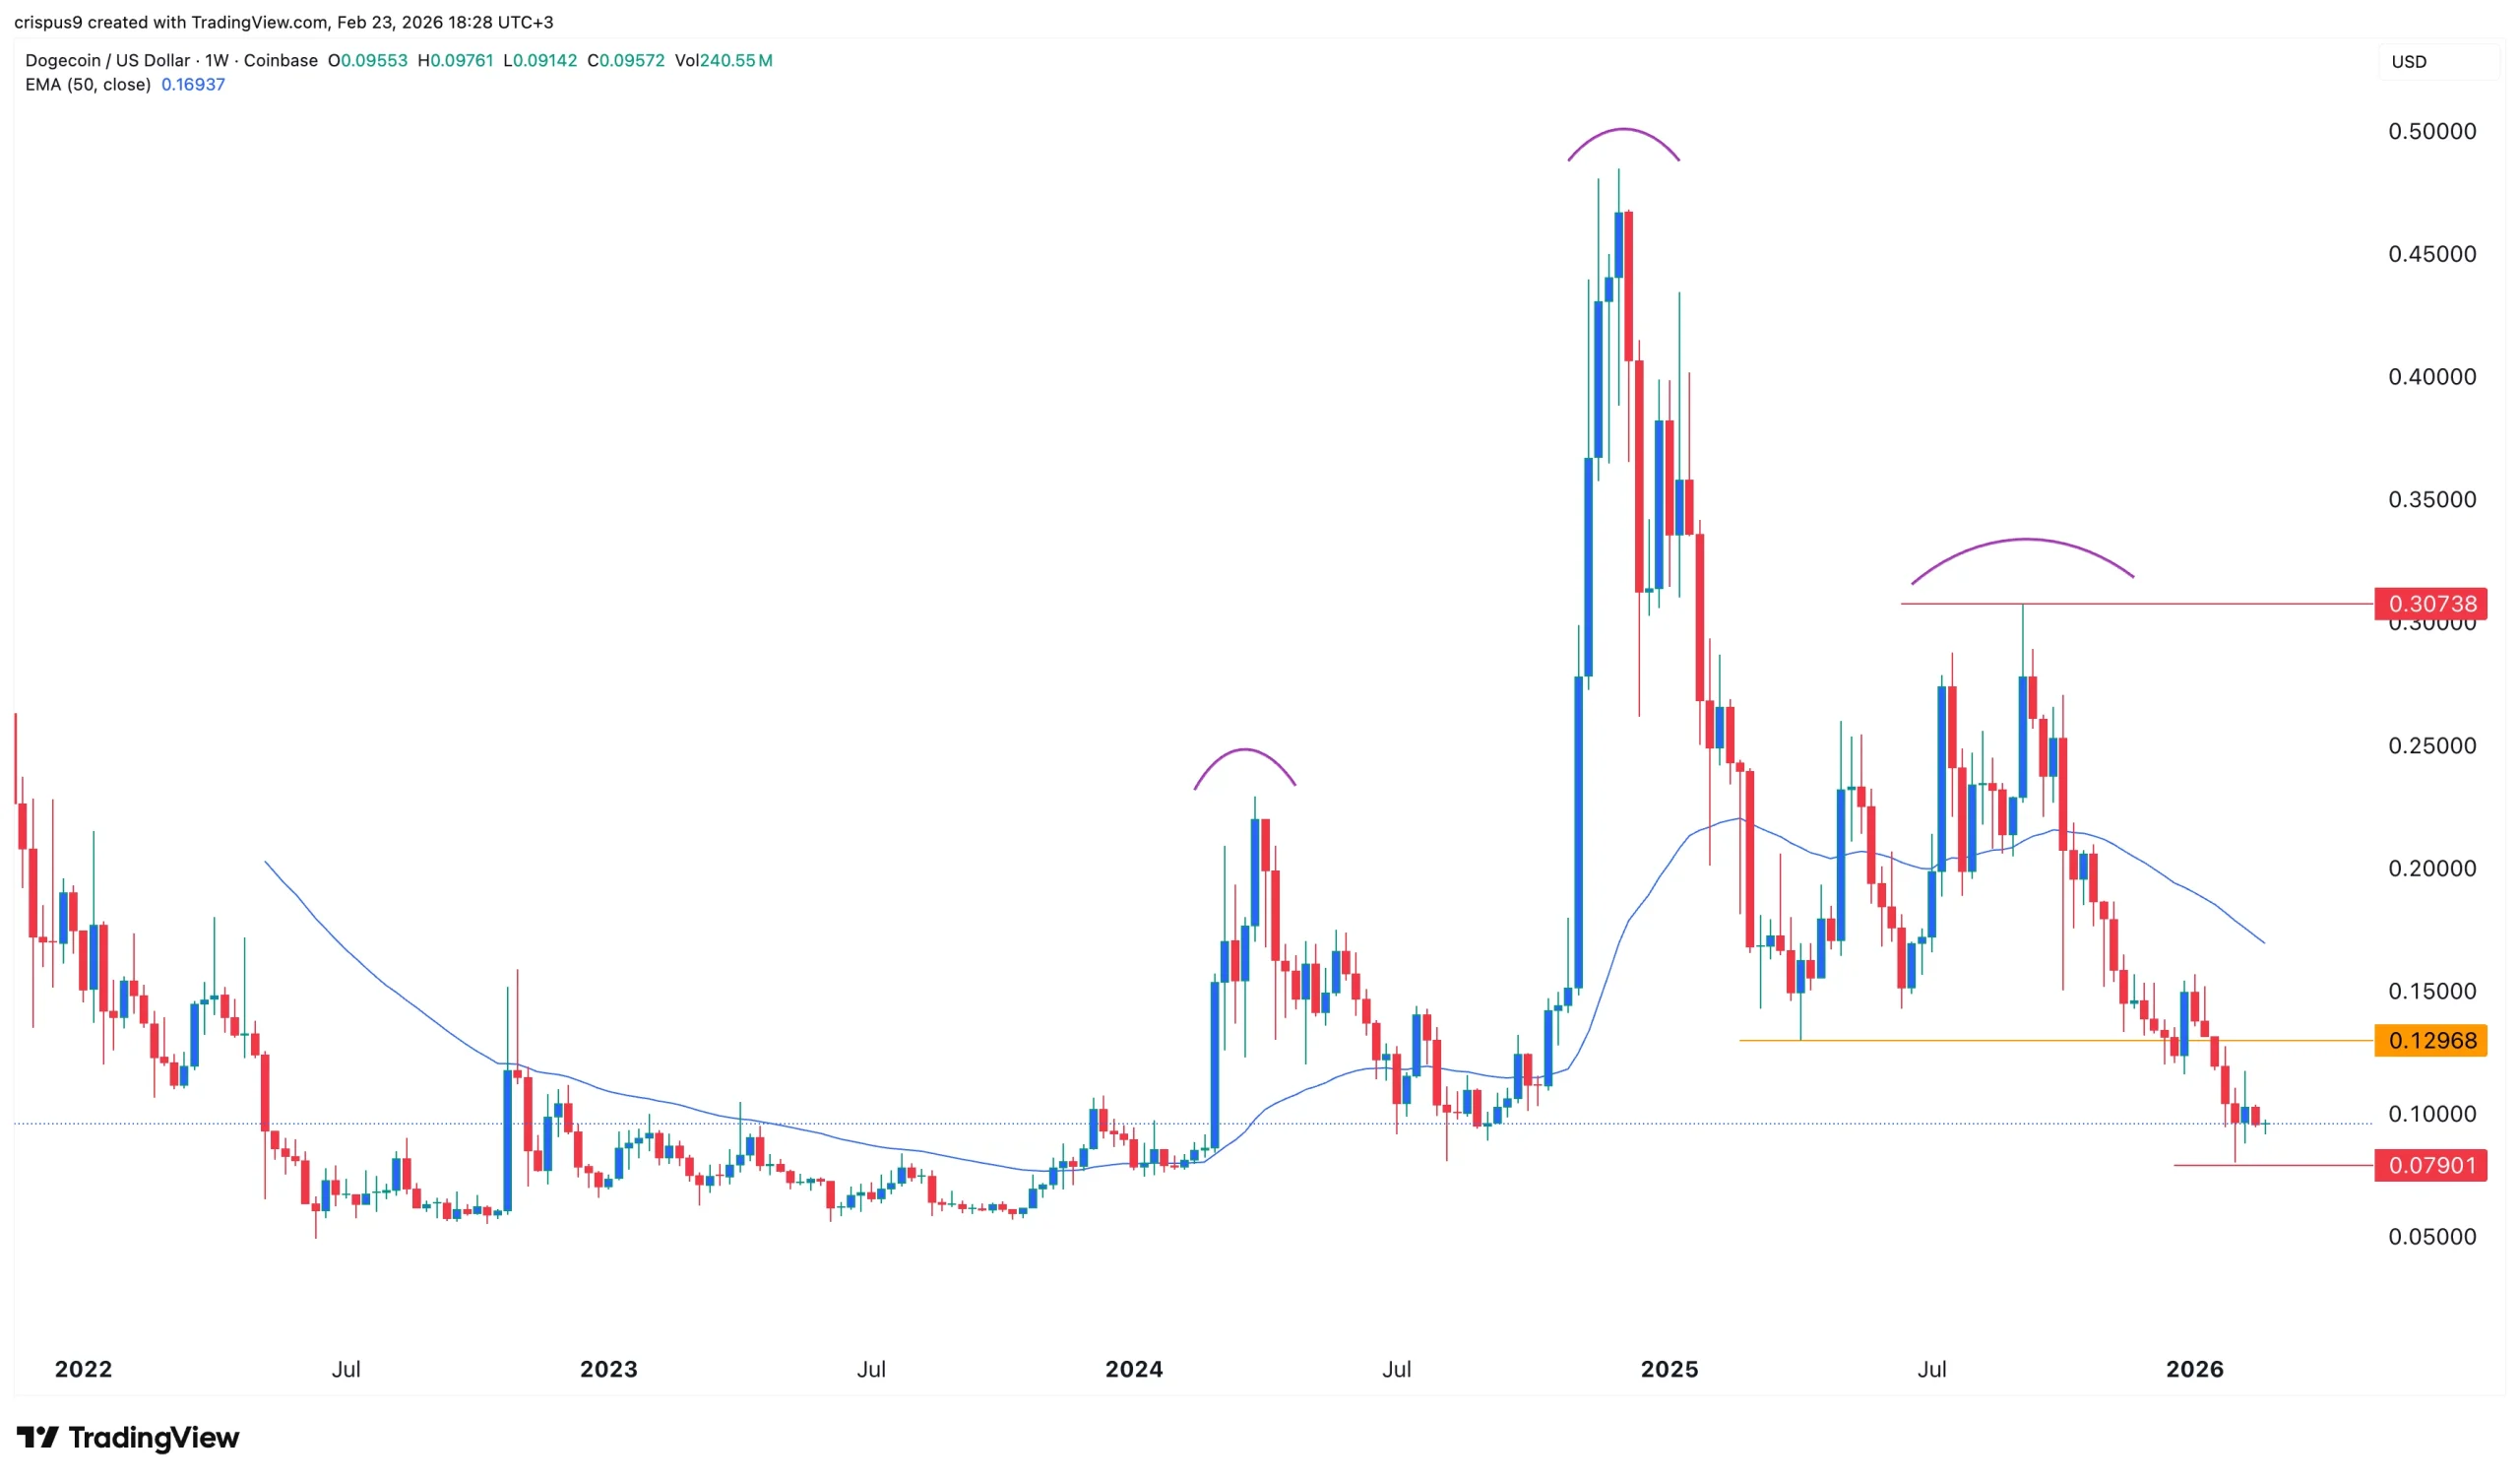
The weekly chart shows that the DOGE price has slumped in the past few months. It dropped below the important support level at $0.10, confirming a bearish outlook.
Most notably, the coin has formed a multi-year head-and-shoulders pattern. The head is at $0.4820, while the right shoulder is at $0.3073, and the left one is at $0.2290.
Dogecoin has remained below the 50-week and 100-week Exponential Moving Averages. It has dropped below the key support level at $0.1296, its lowest level in April last year.
Therefore, the coin will likely continue falling as sellers target the key support level at $0.050. The bearish outlook will become invalid if it moves above the key resistance at $0.1300 will invalidate the bearish outlook.

Crypto.com announced on Monday that it has secured conditional approval for a national bank trust charter from the U.S. Office of the Comptroller of the Currency (OCC). If the company clears final regulatory hurdles, it would operate as a federally regulated custodian with OCC oversight, enabling custody services for digital asset treasuries, exchange-traded funds, and other tokenized products across the United States. The application, which Crypto.com filed in October, signals a push toward regulated, institution-facing custody solutions as regulators weigh how crypto firms fit within traditional banking structures. The development comes amid a broader policy shift in Washington as regulators assess the path for crypto custody, stablecoins, and related financial services.
Key takeaways
- Crypto.com has won conditional approval from the OCC for a national bank trust charter, positioning it to offer nationwide custody under federal supervision.
- The OCC’s action comes two months after it conditionally approved five other national bank charters for Circle, Ripple, BitGo, Fidelity Digital Assets, and Paxos, signaling a growing regulatory pathway for crypto firms seeking bank-like status.
- Coinbase also applied for a national trust charter in October, stating it would not pursue a banking charter if approved.
- The American Bankers Association has urged the OCC to slow the pace of charter approvals for digital-asset firms until the GENIUS Act’s framework is fully implemented, arguing for robust safety and soundness standards.
- Nationally chartered trust companies could, in practice, be exempt from many state licensing requirements, a shift that could alter how crypto custodians operate across state lines.
Sentiment: Neutral
Market context: The OCC’s charter activity reflects a broader effort by U.S. regulators to define a federal framework for crypto custody and related services. As institutions seek regulated access to digital assets, the agency’s willingness to grant national trust charters signals a pathway for crypto firms to operate with bank-style oversight, while lawmakers debate stablecoins and payment infrastructure within the GENIUS Act and other regulatory constructs.
Why it matters
For Crypto.com, the conditional approval marks a consequential milestone in the company’s strategy to scale regulated custody services beyond traditional exchange models. A federally chartered custodian would offer clients a familiar, bank-like framework backed by OCC oversight, potentially increasing institutional comfort with safekeeping digital assets and related products. The ability to custody digital asset treasuries and exchange-traded funds at scale could reduce fragmentation in the market, offering a single, regulated point of custody for a broad array of tokenized assets. As regulated entities, these custodians may also gain access to mainstream banking services and payments rails that have historically remained out of reach for many crypto firms.
The OCC’s broader pattern — approving multiple national bank charters for crypto-focused firms — suggests a deliberate policy tilt toward integrating digital asset services into the U.S. banking system. This trend aligns with a growing cadre of firms pursuing trust-charter status as a route to credibility and growth within a tightly regulated financial ecosystem. At the same time, it invites ongoing questions about safety, risk management, and consumer protection in a rapidly evolving space. The ABA’s warning underscores the tension between innovation and prudence, highlighting the need for a clear regulatory timetable and robust standards before large-scale approvals are granted.
World Liberty Financial, another crypto-related firm pursuing a national bank charter with ties to the USD1 stablecoin project backed by high-profile political figures, illustrates the intense regulatory scrutiny surrounding these applications. The bank-charter process for World Liberty has drawn attention from lawmakers and regulators who are weighing the implications of native, in-house issuance and custody capabilities for digital-asset stablecoins. The OCC chair and senior staff have signaled a commitment to apolitical, nonpartisan review, even as political signals and stakeholder perspectives continue to shape the conversation.
In parallel, the regulatory dialogue continues to unfold around whether national charters should supersede or complement state-by-state licensing regimes. Legal experts have noted that a nationally chartered trust company could be exempt from much of the licensing friction tied to state rules, potentially streamlining cross-border or cross-state custody arrangements. This possibility adds a layer of strategic importance for issuers and asset managers contemplating multi-jurisdictional operations in the United States.
The ongoing debate also touches on the role of policy in facilitating or constraining innovation. While a federally chartered path can provide clarity and resilience for large-scale custody, regulators must balance that clarity with rigorous safety standards to protect customers and the financial system. As OCC reviews advance, market participants will be watching how quickly final approvals are issued, how the agency applies safety-and-soundness criteria to crypto-adjacent activities, and how the evolving framework interacts with broader legislative developments in the GENIUS Act era.
For more context on the specific filings and related regulatory developments, see the official crypto-company notices and industry coverage linked in this article, including Crypto.com’s conditional approval announcement, historical OCC actions on national bank charters, and related coverage of industry stakeholders urging caution or applauding progress.
What to watch next
- Final OCC approval for Crypto.com’s national bank trust charter and any conditions attached to it.
- Public decisions on the other recently approved national charters (Circle, Ripple, BitGo, Fidelity Digital Assets, Paxos) and any new applicants.
- Timeline and milestones for GENIUS Act implementation and how it might affect future charter reviews.
- Progress on World Liberty Financial’s charter bid and regulatory feedback from lawmakers and regulators.
- Coinbase’s regulatory status and any statements from the OCC on potential bank-charter interpretations for crypto companies.
Sources & verification
- Crypto.com press release confirming conditional OCC charter approval for a national trust charter: https://crypto.com/eea/company-news/cryptocom-receives-conditional-approval-from-occ-for-national-trust-bank-charter
- History of OCC conditional approvals for Circle, Ripple, BitGo, Fidelity Digital Assets, Paxos: https://cointelegraph.com/news/bitgo-circle-fidelity-bitgo-ripple-occ-approval-bank-conversion
- Coinbase application for a national trust charter: https://cointelegraph.com/news/crypto-exchange-coinbase-national-trust-charter-license
- ABA letter urging delay and safety standards: https://cointelegraph.com/news/bankers-push-occ-slow-crypto-trust-bank-charters
- World Liberty Financial’s charter bid and related coverage: https://cointelegraph.com/news/world-liberty-files-banking-charter-expand-usd1
Crypto.com gains conditional OCC national trust charter, signaling a broader shift in US crypto custody
Crypto.com has moved a step closer to a federally regulated custody framework, announcing conditional approval from the OCC for a national bank trust charter. If final approval is granted, the company would serve as a custodian across the United States, operating under OCC oversight. The company filed its application in October, aiming to provide custody services for digital asset treasuries, exchange-traded funds, and other tokenized products for institutional clients. This milestone comes amid a wave of regulatory activity as policymakers weigh how to integrate crypto-securities and digital assets into traditional banking systems. The OCC’s decision aligns with a broader push that has seen Circle, Ripple, BitGo, Fidelity Digital Assets, and Paxos receive conditional approvals in the preceding months, illustrating a concerted effort to establish a regulated pathway for crypto custodians. Crypto.com CEO Kris Marszalek framed the milestone as a testament to the company’s compliance culture and its commitment to delivering trusted, secure services that meet institutional expectations, a sentiment echoed in the broader industry narrative about formalizing crypto custody under a bank charter regime. Source: Crypto.com The development arrives alongside ongoing regulatory discussions about the balance between innovation and consumer protection in the crypto space, including questions about how national charters interact with state-level licensing regimes and whether a federally chartered custodian might enjoy exemptions from certain state requirements. Recent industry-background coverage highlights that the OCC’s approvals signal a growing appetite among federal regulators to incorporate crypto custody into the mainstream banking framework, a trend that could shape how institutions access custody services, secure settlement rails, and manage risk across digital asset portfolios. The broader policy environment—encompassing the GENIUS Act and related discussions—will influence how quickly such charters are granted and how strict the accompanying safety standards will be. For now, Crypto.com’s milestone stands as a signal that regulated custody is moving from concept to practice, and that the regulatory path for digital asset custodians is becoming more defined, even as scrutiny and debates continue across Washington.


- Toncoin price is up 4% as key metrics like volume and TVL rise.
- A breakout above the $1.50 zone could result in upside momentum.
- If broader sentiment doesn’t invalidate the outlook, the next target could be above $2.
Toncoin (TON) is demonstrating resilience as a challenging crypto market sees several altcoins slump to new lows.
The token trades around $1.37 with a modest 4% gain in 24 hours, and it’s seeing a notable surge in trading volume.
The total value locked is also up and highlights a potential strength that could embolden bulls and allow them to target the $2.00 mark.
Toncoin’s bullish outlook, however, could be tempered by the broader sentiment across major cryptocurrencies.
Bitcoin, which trades around $65,800 as bulls struggle with macro headwinds, highlights the bearish dangers.
Toncoin gains amid volume spike
Toncoin’s intraday gains to $1.37 buck the trend that saw BTC dip to under $65k before posting a slight recovery.
Other coins, including Ethereum, BNB and XRP, have notched downward moves amid growing negative sentiment in an increasingly risk-averse environment.
The 25% spike in daily trading volume to $80 million reflects the cryptocurrency’s likely upward strength.
Buyers have also bumped up open interest in TON, currently at $182 million.
While long positions account for nearly 70% of the “rekt” value in the past 24 hours, data shows more shorts have been liquidated in the past 12 hours.
Additionally, TON’s Total Value Locked (TVL) in DeFi protocols has climbed to $165 million.
The global defi TVL stood at $204 billion at the time of writing, but was less than 0.7% up in the past 24 hours.
In comparison, TON had its TVL up by nearly 2% to signal increased interest in protocols on The Open Network.
Meanwhile, the stablecoin market cap on TON has also risen to $941 million, with USDT dominance at 79%.
These metrics suggest capital rotation into TON, rather than gains being driven by broad speculation.
TON price prediction: Is $2 next?
Toncoin approaches a pivotal technical juncture on the daily chart. Gains to intraday highs have bulls testing resistance from a descending trendline that has capped upside since late 2025.

A successful breakout could allow bulls to target the 50-day EMA. This hurdle currently sits near $1.48, a level aligning with recent consolidation zones and a key resistance line since Dec. 2024.
If the supply zone paves the way amid overall bullish sentiment, momentum could drive TON toward the 200-day EMA around $2.0.
This outlook might strengthen if neutral RSI readings near 43 flip higher and the daily MACD invalidates the bearish hint.
However, Bitcoin’s ongoing selloff pressure amid deleveraging and ETF outflows might pose a downward risk for the token.
Currently, macroeconomic headwinds have dragged BTC back to the $65k area.
A similar outlook for TON could bring the $1.12 support level into view.
Manchester bar underneath Coronation Street cobbles announces sudden closure

Unlicensed betting firms face sponsorship ban

XRP price forms gartley pattern at $1.30: Bullish bottom?


-

 Crypto World6 days ago
Can XRP Price Successfully Register a 33% Breakout Past $2?
-

 Video4 days ago
XRP News: XRP Just Entered a New Phase (Almost Nobody Noticed)
-

 Fashion3 days ago
Weekend Open Thread: Boden – Corporette.com
-

 Sports7 days ago
GB's semi-final hopes hang by thread after loss to Switzerland
-

 Politics1 day ago
Baftas 2026: Awards Nominations, Presenters And Performers
-
 Tech7 days ago
The Music Industry Enters Its Less-Is-More Era
-

 Business6 days ago
Infosys Limited (INFY) Discusses Tech Transitions and the Unique Aspects of the AI Era Transcript
-

 Entertainment5 days ago
Kunal Nayyar’s Secret Acts Of Kindness Sparks Online Discussion
-

 Video6 days ago
Financial Statement Analysis | Complete Chapter Revision in 10 Minutes | Class 12 Board exam 2026
-

 Tech5 days ago
Retro Rover: LT6502 Laptop Packs 8-Bit Power On The Go
-
 Sports5 days ago
Clearing the boundary, crossing into history: J&K end 67-year wait, enter maiden Ranji Trophy final | Cricket News
-

 Business1 day ago
Mattel’s American Girl brand turns 40, dolls enter a new era
-

 Business1 day ago
Law enforcement kills armed man seeking to enter Trump’s Mar-a-Lago resort, officials say
-

 Entertainment5 days ago
Dolores Catania Blasts Rob Rausch For Turning On ‘Housewives’ On ‘Traitors’
-

 Business5 days ago
Tesla avoids California suspension after ending ‘autopilot’ marketing
-
 NewsBeat8 hours ago
‘Hourly’ method from gastroenterologist ‘helps reduce air travel bloating’
-

 Politics6 days ago
Eurovision Announces UK Act For 2026 Song Contest
-

 Tech1 day ago
Anthropic-Backed Group Enters NY-12 AI PAC Fight
-

 NewsBeat23 hours ago
Armed man killed after entering secure perimeter of Mar-a-Lago, Secret Service says
-

 Crypto World5 days ago
WLFI Crypto Surges Toward $0.12 as Whale Buys $2.75M Before Trump-Linked Forum