

Crypto World
INJ Price Holds Critical Demand Zone After 95% Drop: Can It Repeat the 4,619% Rally?

TLDR:
- INJ is down roughly 95% from its macro high and now trades near the $2.70–$1.70 HTF accumulation zone.
- A high-timeframe fair value gap is active at current price levels, signaling a potential re-accumulation structure forming.
- The previous cycle saw INJ rally approximately 4,619% from a similar deep corrective and accumulation base phase.
- Analysts set bull market expansion targets at $80 and $200, with strict invalidation placed at a close below $1.10.
INJ is drawing renewed attention after declining approximately 95% from its macro cycle high. The token is currently trading near $2.96, placing it within a high-timeframe fair value gap.
Market participants are watching this zone closely as a critical accumulation area. The current price structure closely mirrors conditions that preceded a historic 4,619% rally.
Whether history repeats itself depends entirely on key technical levels holding firm on higher timeframes.
Technical Structure Suggests Re-Accumulation Phase Forming
INJ is presently trading inside a high-timeframe fair value gap following a prolonged corrective move. This imbalance zone is being monitored as a primary demand and absorption area by technical analysts.
The price range between $2.70 and $1.70 represents the active HTF accumulation zone for the asset. Continued demand within this range is drawing attention from traders tracking the longer-term structure.
A multi-year descending resistance trendline compression is also forming alongside current price action. Volatility has contracted noticeably, a condition that often comes before a strong expansion move.
Furthermore, a rounded base formation is developing within the imbalance zone at present levels. These combined technical conditions point toward a potential breakout setup building around current price.
Crypto analyst CryptoPatel shared a detailed breakdown of the setup on social media, stating that INJ is “trading inside a HTF FVG after a ~95% corrective move from its macro high.”
The structure is framed as an accumulation versus invalidation zone. The setup remains constructive as long as INJ holds above $1.10 on a high-timeframe close basis. A breach of that level would serve as strict invalidation for the entire thesis.
Historical Precedent and Macro Expansion Targets Under the Microscope
The 2023–2024 cycle for INJ delivered an impulsive rally of approximately 4,619% from its accumulation base. That advance followed a deep corrective phase before the asset moved into a parabolic expansion.
The current market structure bears a close resemblance to the conditions that preceded that historic move. As a result, analysts are drawing direct parallels between the two market cycles.
The 2024–2026 correction has since brought INJ down roughly 95% from its peak. This decline has repositioned the price back into what technicians describe as a re-accumulation phase.
The zone between $2.70 and $1.70 continues to serve as the primary area for order flow absorption. Meanwhile, the sub-$1.10 region is identified as a secondary demand zone if price invalidates the current setup.
Bull market expansion targets outlined in the analysis point to $80, followed by a macro projection of $200. These targets are contingent on INJ maintaining its technical structure above current support.
A high-timeframe close below $1.10 would fully negate the re-accumulation thesis. Until then, the setup remains one closely watched by technical traders and market observers alike.


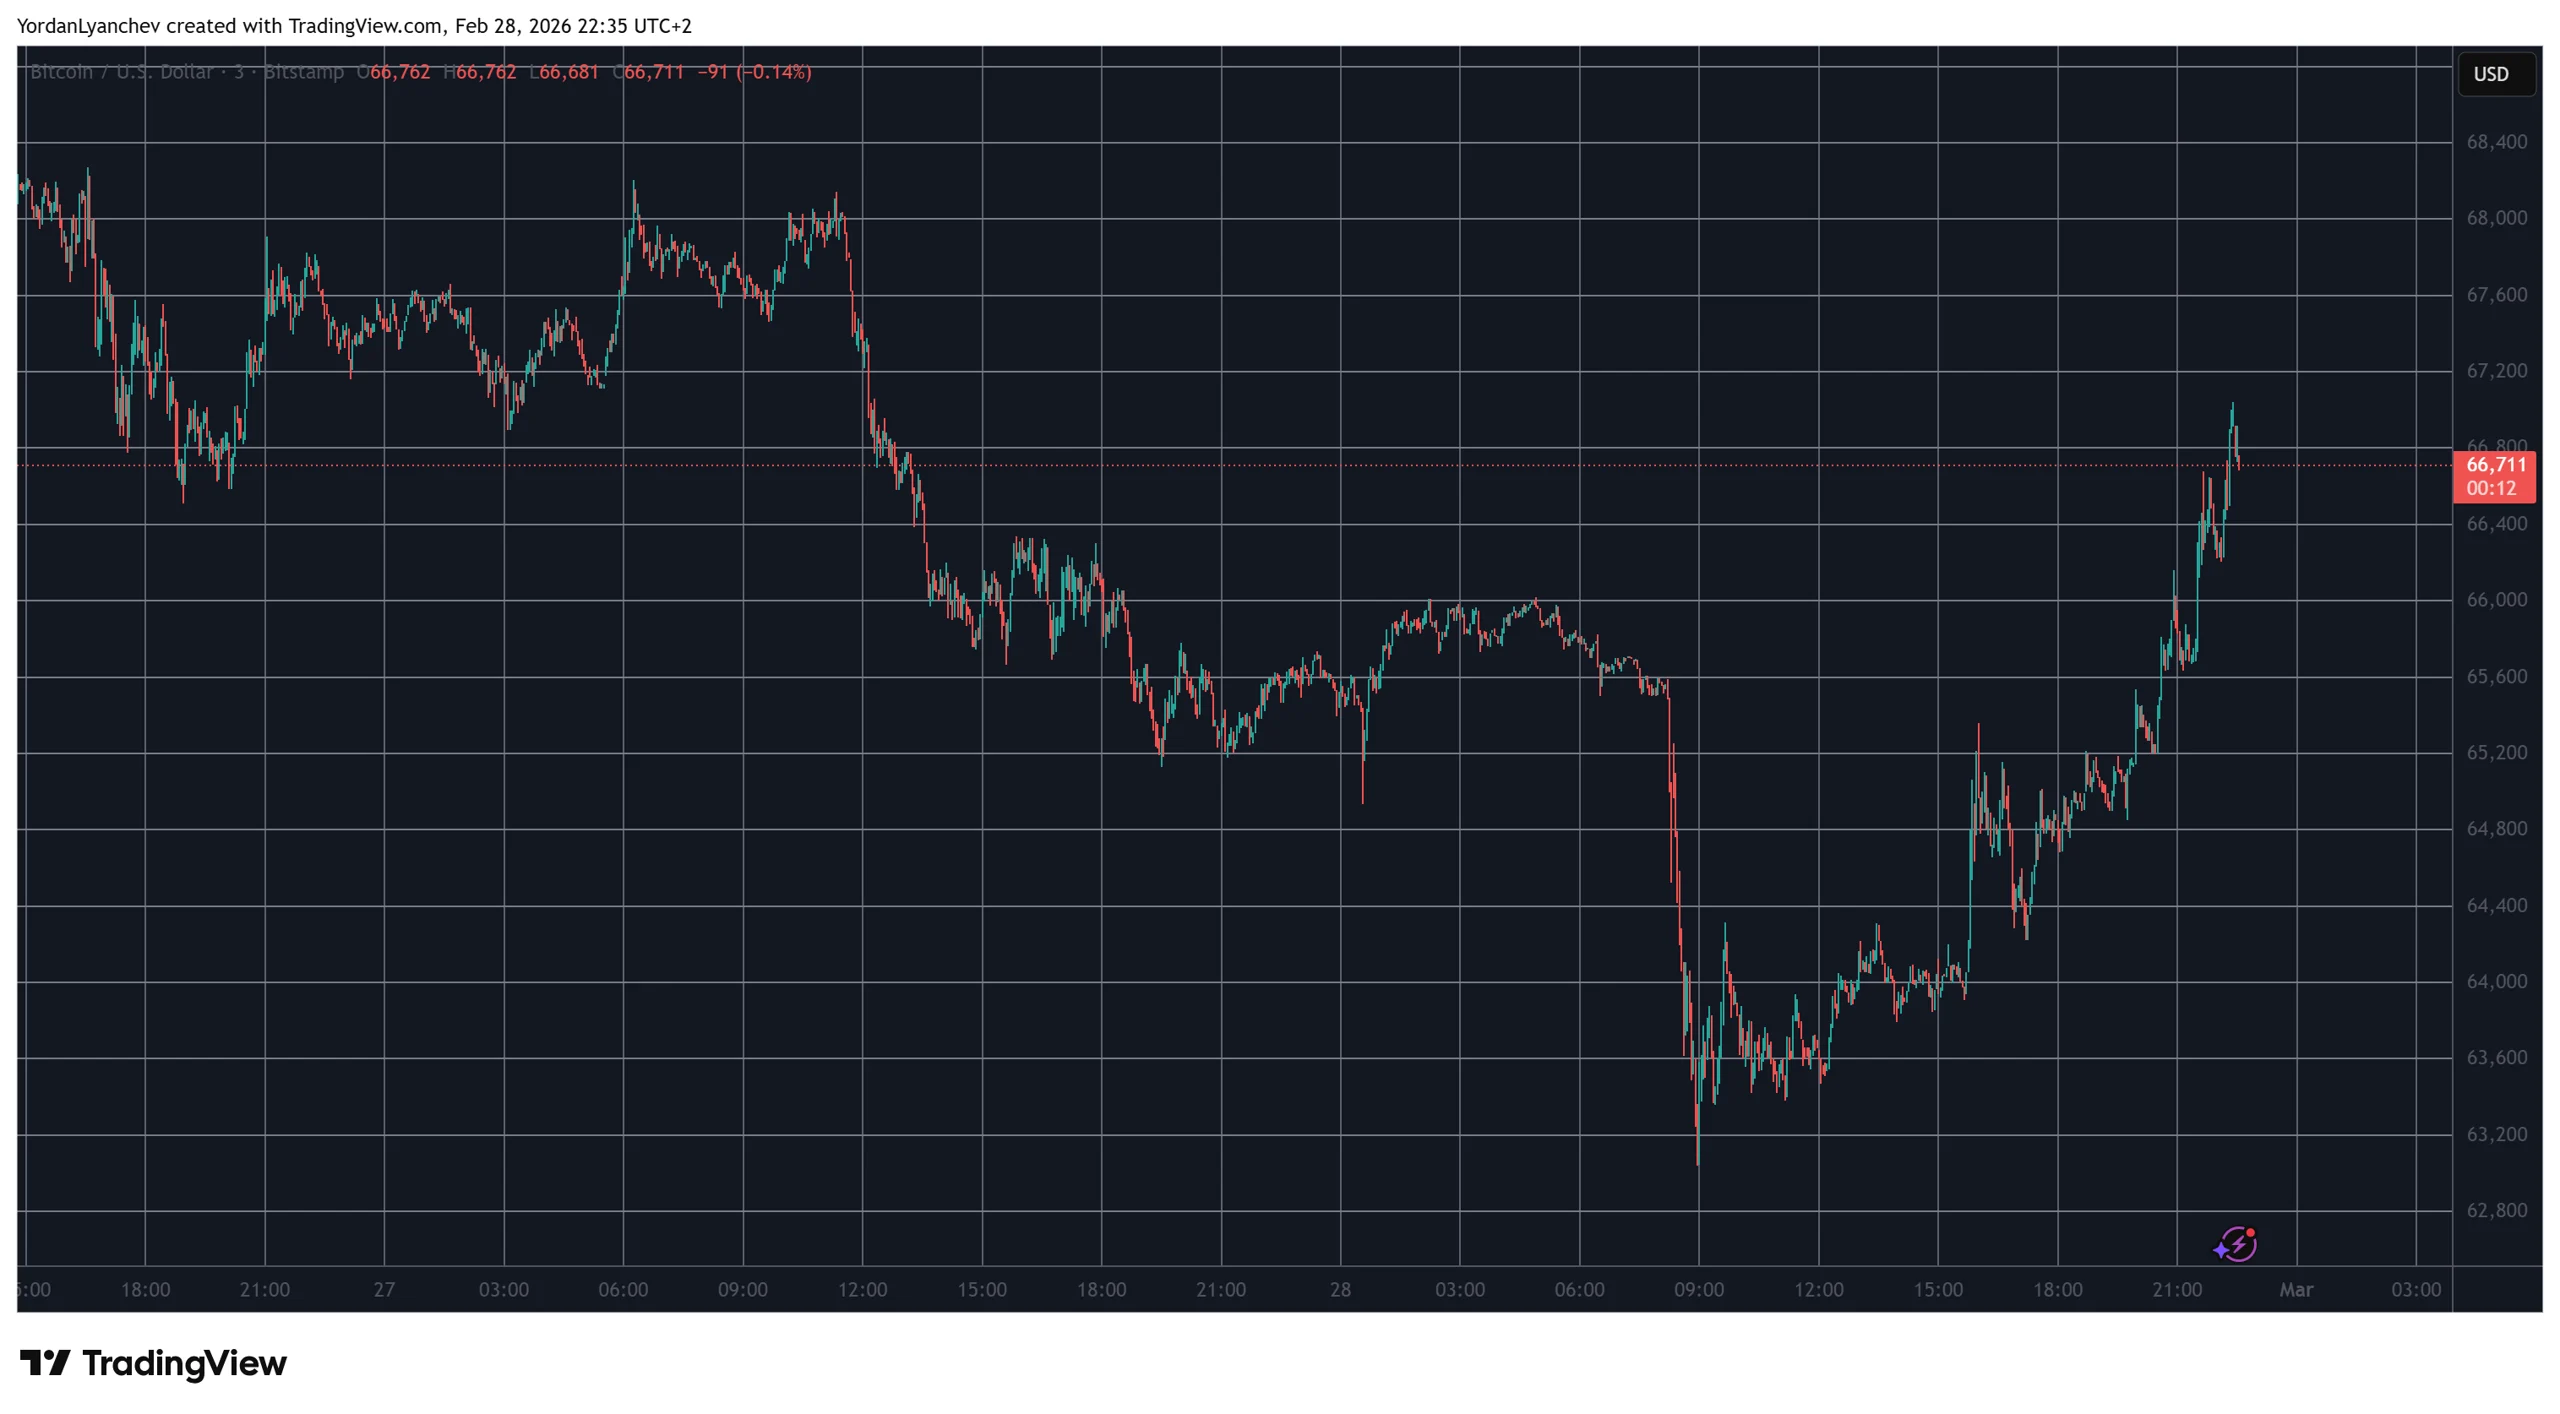
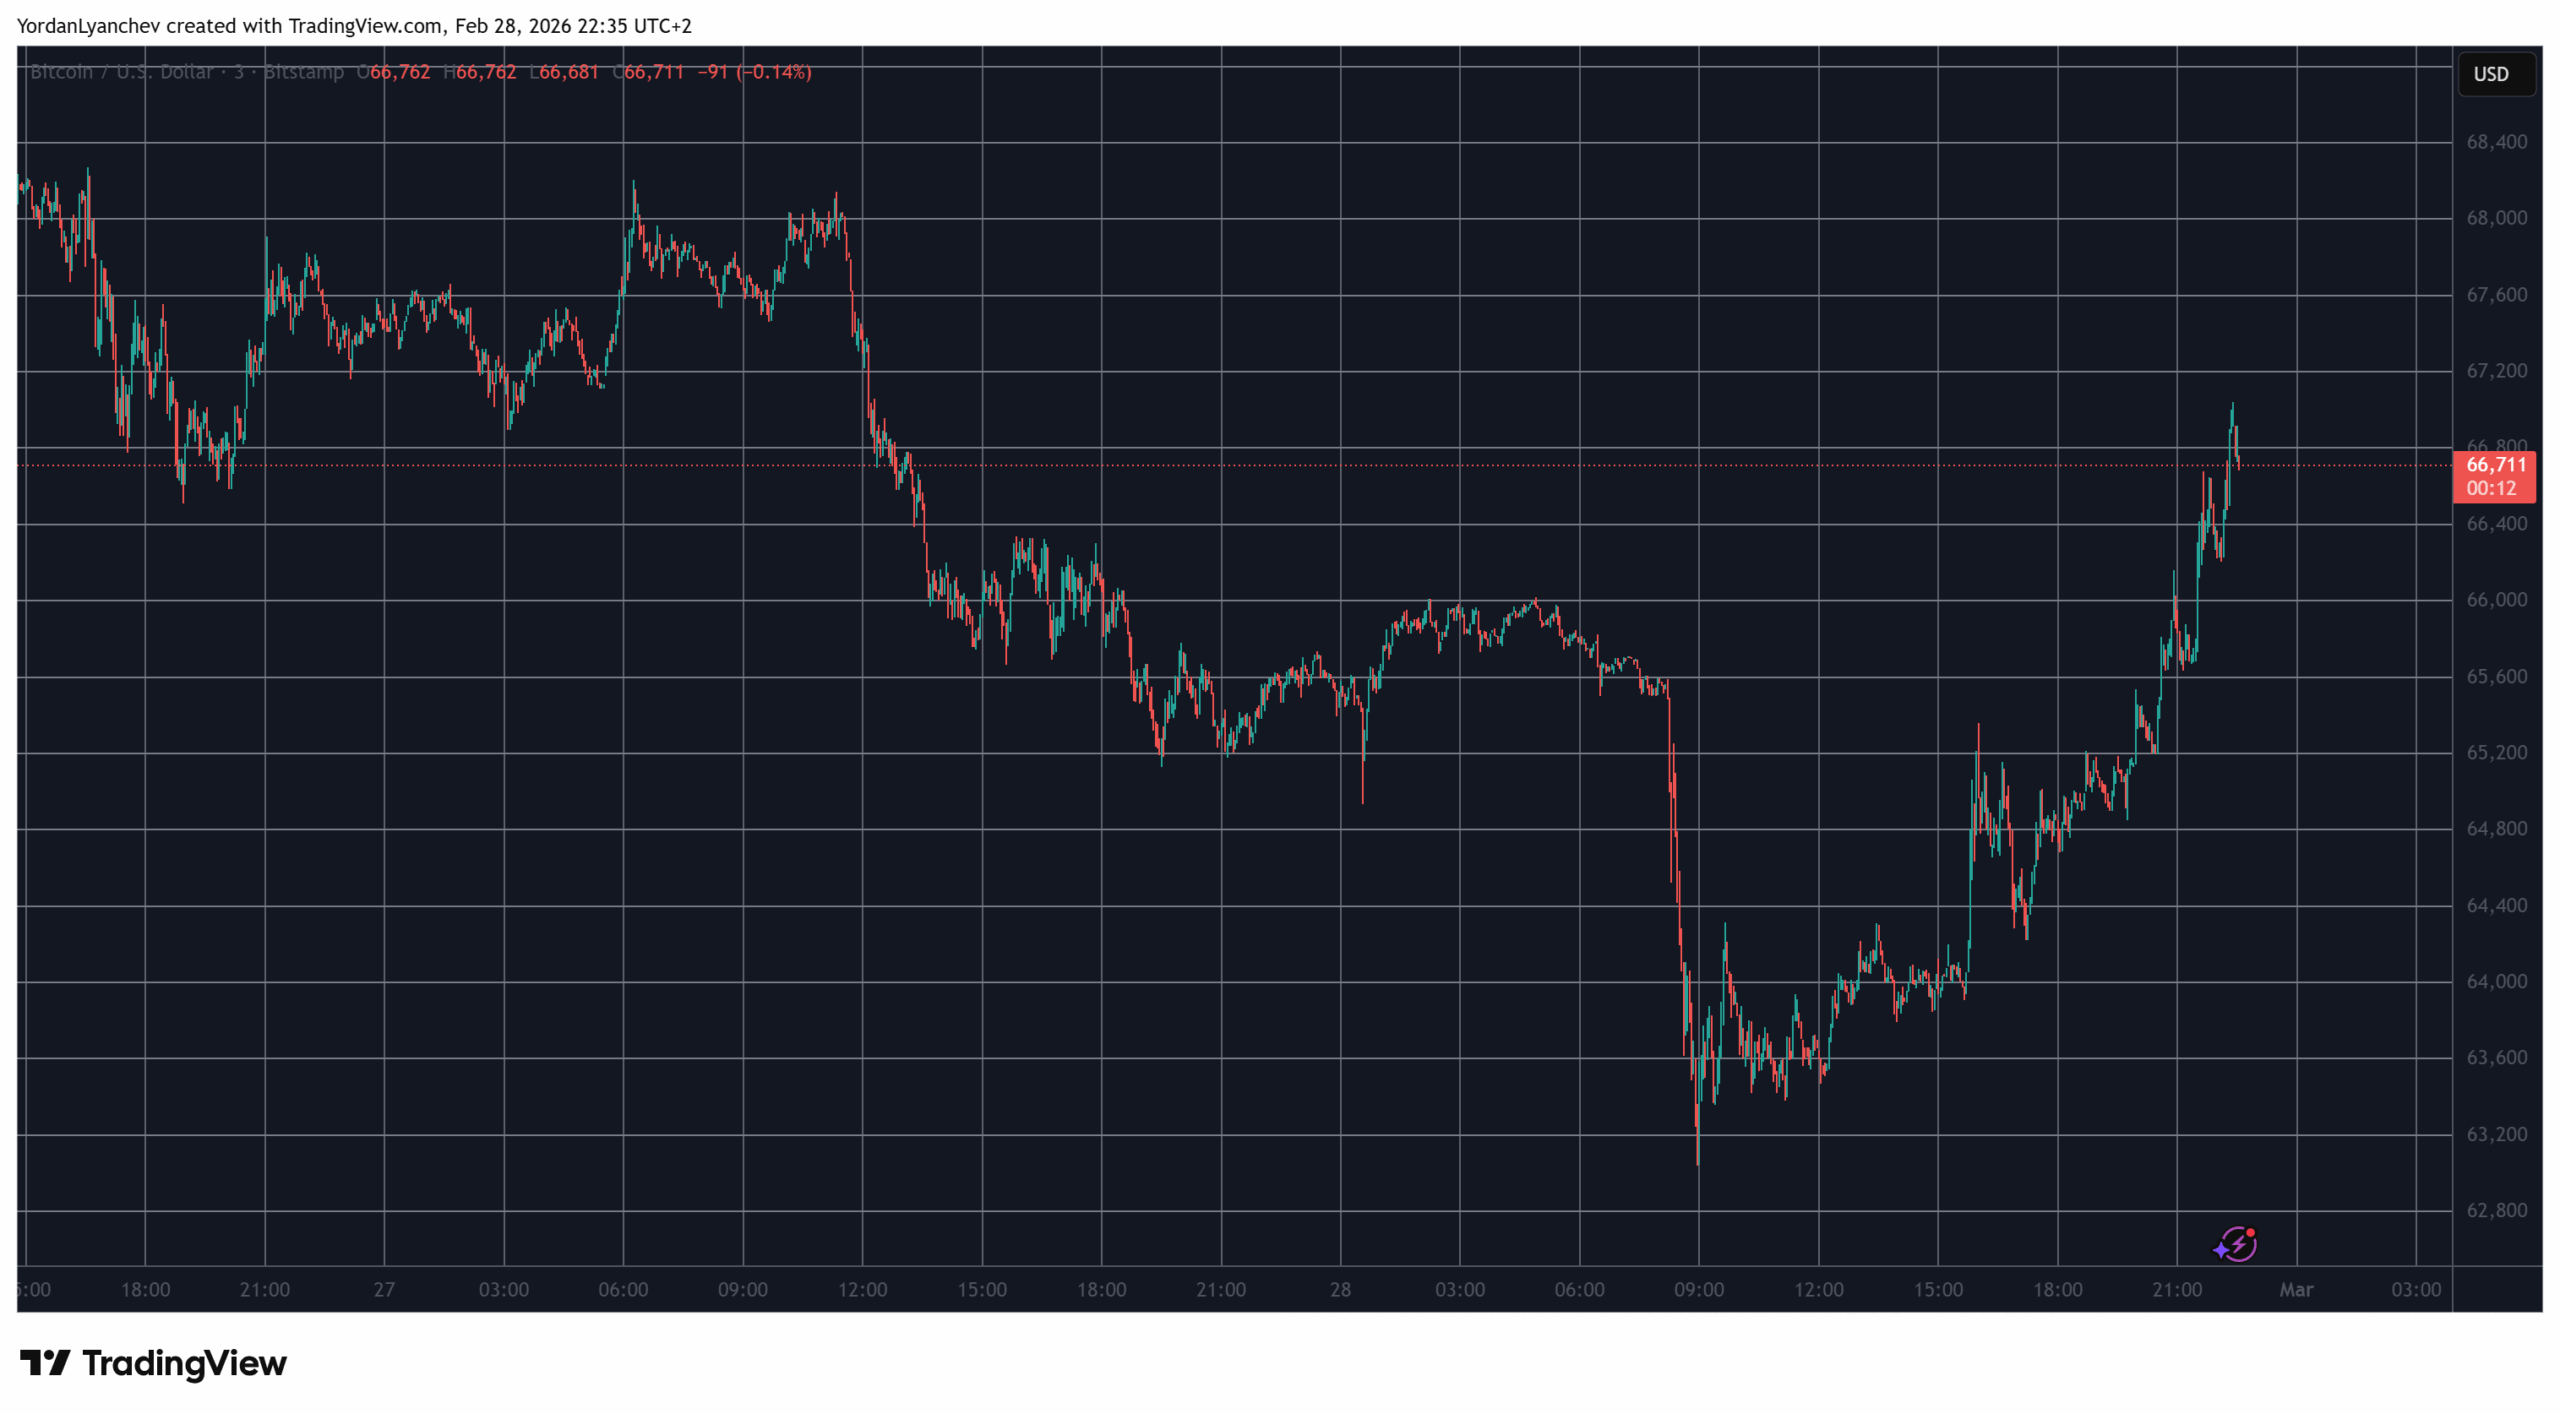
BTC has completely turned the tables around during this highly volatile day.
The intense volatility in the cryptocurrency markets continues as bitcoin just shot up to $67,000 after plunging to $63,000 this morning.
The most likely reason for all the Saturday fluctuations is the quickly escalating situation in the Middle East, and the latest reports hinting at a regime change in Iran.
It all started this morning when Israel and the USA carried out several attacks against Iran. The Middle East country retaliated against several nations in the region, including the UAE, Bahrain, Qatar, and Saudi Arabia.
In the following hours, more reports began to unravel, and the latest big development on the matter indicated that Iran’s supreme leader had been killed. So far, though, the information is coming only from Israeli sources and there’s no official confirmation.
US President Donald Trump also addressed the situation recently, warning that he could end it all in a matter of days and warned of further military actions if Iran doesn’t scale back on its nuclear development.
BREAKING: President Trump is floating several “off ramps” for Iran just hours after the strikes launched by Israel and the US, per Axios.
Trump says:
1. He can end the situation in “two or three days”
2. This would involve threatening Iran with further military action if they… https://t.co/xQf5c7nmjb
— The Kobeissi Letter (@KobeissiLetter) February 28, 2026
Since the cryptocurrency market is the only financial industry operating during the weekend, it endured significant volatility as the events unfolded. After the initial strikes, bitcoin plunged from $66,000 to $63,000 within minutes, and the altcoins followed suit.
You may also like:
However, it rebounded in the following hours and even jumped to $67,000 minutes ago after the reports about Khamenei’s death.
Binance Free $600 (CryptoPotato Exclusive): Use this link to register a new account and receive $600 exclusive welcome offer on Binance (full details).
LIMITED OFFER for CryptoPotato readers at Bybit: Use this link to register and open a $500 FREE position on any coin!
Crypto World
KAI Exchange Celebrates Satoshi Nakamoto’s Birthday on March 1 With 10,000 Traders Worldwide


[PRESS RELEASE – Dubai, United Arab Emirates, February 28th, 2026]
KAI Exchange, the world’s leading AI-native cryptocurrency trading platform, says it has received a mysterious message from Satoshi Nakamoto: “April 5th is not Satoshi Nakamoto’s birthday (that belongs to Changpeng Zhao); Satoshi’s real birthday is March 1st.”
Upon receiving this confidential message, KAI Exchange immediately decided to host the “Satoshi Nakamoto Birthday Bash” on March 1, inviting users to join in and become part of a historic moment.
Event Manifesto:
“March 1, 2026, marks the birthday of our beloved Satoshi Nakamoto. Seize this historic opportunity to create an unprecedented myth in Bitcoin history—the legend of 49 Chain Web4.
All future realities will follow the historical traces left on March 1, 2026! Pay tribute to the visionary spirit of Bitcoin founder Satoshi Nakamoto.”
During the event, KAI officially released a striking market forecast: the BTC/USAD trading pair on its platform is expected to challenge an all-time high of 4,927,000 on the day of the event, positioning itself as a market focal point.
The KAI operations team stated that this birthday celebration is not only a tribute to the spirit of Bitcoin but also an innovative exploration of the integration between artificial intelligence and the cryptocurrency market. Through AI-driven market predictions, community engagement, and festive reward mechanisms, KAI aims to deliver a trading experience that combines cutting-edge technology, active participation, and market insight for users worldwide.
As a centralized virtual asset exchange powered by AI at its core, KAI deeply integrates artificial intelligence across all aspects of its operations—from token selection and market trend identification to strategy execution and customer support—providing users with a fast, secure, and intelligent trading experience. Looking ahead, KAI will continue to explore the potential of integrating AI with finance, working hand in hand with users to build a new Web4.0 financial world driven by intelligence.
About USAD:
USAD, as KAI’s native stablecoin, operates on the TOK chain and is a dollar-pegged stablecoin backed by reserve assets. USAD provides rapid settlement and open access capabilities for the KAI platform, serving as a crucial financial cornerstone for the efficient operation of the platform’s ecosystem. USAD: Stable, Transparent, Born for Web 4.0.
For more information on how to participate and event details, please visit KAI’s official website at Kai.com.
Binance Free $600 (CryptoPotato Exclusive): Use this link to register a new account and receive $600 exclusive welcome offer on Binance (full details).
LIMITED OFFER for CryptoPotato readers at Bybit: Use this link to register and open a $500 FREE position on any coin!
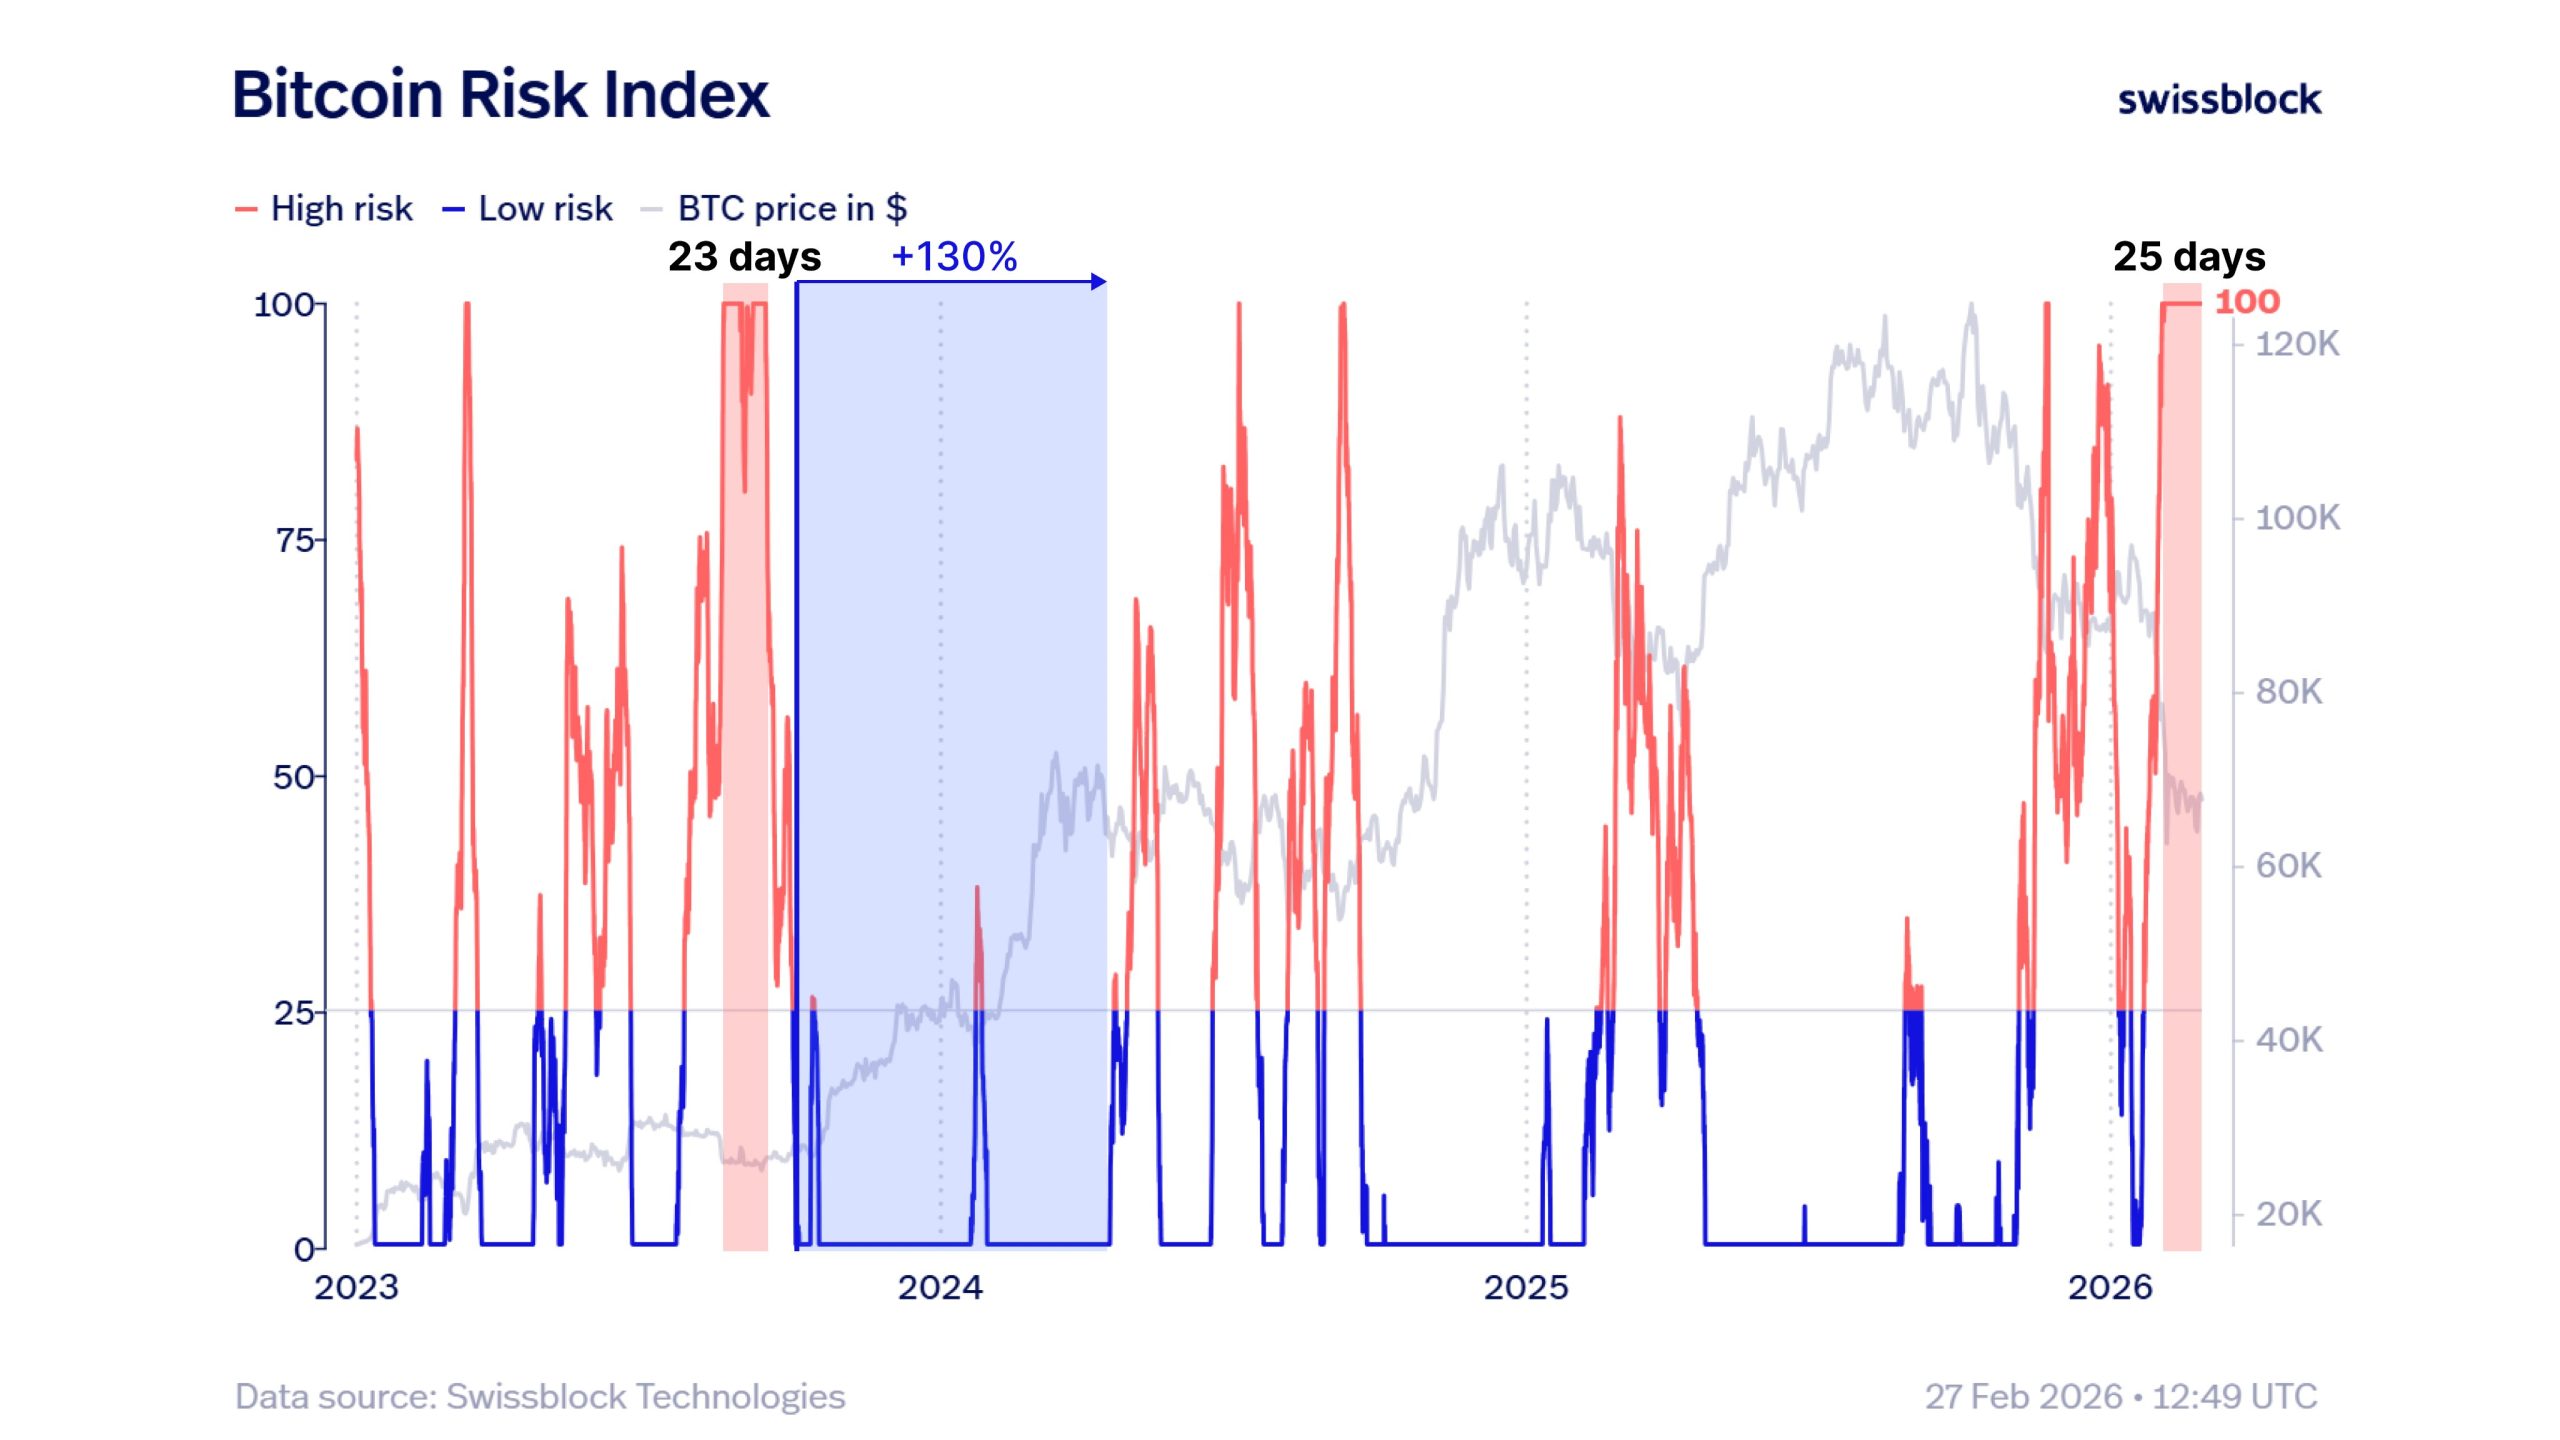
A Bitcoin (BTC) bottom signal that appeared in 2023, ahead of a 130% rally in 2024, has flashed again this week, raising the possibility that the price is nearing another bullish inflection point.
At the same time, the broader data of liquidity, exchange-traded fund (ETF) flows, and macroeconomic data changes the environment from two years ago, suggesting that the path forward may not mirror the previous cycle’s.
BTC bottom trigger appears without strong follow-through
Data aggregator Swissblock noted that Bitcoin has now logged 25 consecutive days in its “extreme high risk” zone, the longest stretch on record and above the 23-day peak seen in 2023. Historically, an extended stay in this zone has aligned with late-stage drawdowns or a bottom signal.

MN Capital founder Michaël van de Poppe also pointed to the BTC versus supply in the profit/loss chart, which shows the price interacting with levels that previously marked bottoming phases. In 2023, the shift from high risk to low risk coincided with the start of a powerful bullish expansion.

Trader positioning is not in sync with an uptrend. RugaResearch noted that 30-day apparent demand continues to flip between positive and negative. While the selling pressure has faded, sustained buying demand has not maintained its dominance.
Related: Bitcoin to $30K? Analysts debate when and at what price BTC will bottom
Deeper Bitcoin drawdowns take time
Macroeconomic newsletter Ecoinometrics highlighted that a BTC decline of this magnitude rarely resolves quickly. Excluding the 2020 COVID rally, which was supported by aggressive monetary policy intervention, the recoveries from 50% drawdowns developed over an extended period.

The ETF flow data reinforces the cautious tone. Since August, cumulative inflows into gold ETFs have surpassed spot Bitcoin ETF flows on a 90-day rolling basis. Over the same period, Bitcoin funds have posted negative flows on a 90-day average rolling basis, currently sitting at –$2.06 billion.
The inflation trends added further context. Ecoinometrics noted that the headline Personal Consumption Expenditures (PCE) sits near 2.9% year-on-year, with core near 3.0% and core services above 3.4%. The Federal Reserve targets PCE, and the recent trend has not shown a clear downward shift. Without easing expectations, the liquidity expansion looks limited.
The price levels frame the debate. CMCC Crest Managing Partner Willy Woo said that any short-term relief rally to $70,000 to $80,000 is likely to be met with another round of selling pressure, since “the broader regime is heavily bearish with both spot and futures liquidity deteriorating”.

Woo said that the $45,000 level aligns with the prior bear market. Below that, $30,000 and $16,000 mark the historical support, which is tied to longer-term trend preservation.
Related: Crypto taxes updated, BTC stuck below $70K: Month in charts
This article does not contain investment advice or recommendations. Every investment and trading move involves risk, and readers should conduct their own research when making a decision. While we strive to provide accurate and timely information, Cointelegraph does not guarantee the accuracy, completeness, or reliability of any information in this article. This article may contain forward-looking statements that are subject to risks and uncertainties. Cointelegraph will not be liable for any loss or damage arising from your reliance on this information.

The crypto treasury market is entering a phase of consolidation as a broad downturn tightens liquidity and pushes balance sheets toward NAV discipline. Industry executive Wojciech Kaszycki, chief strategy officer at BTCS, argues that the combination of cash-generating operations—such as validator services for blockchain networks and offerings in public and private credit—gives treasury firms a distinct advantage over those that merely accumulate crypto. The sector experienced a market-wide downturn in 2025, with many treasuries’ stock prices dipping below the book value of the crypto assets on their balance sheets, underscoring the appeal of scale and diversification in a price-sensitive environment. As the cycle remains challenged, strategic mergers and acquisitions are seen as a plausible path to accelerate recovery and create greater resilience.
Key takeaways
- The crypto treasury sector is likely to consolidate in 2025–2026 as firms seek scale to weather a protracted downturn and NAV pressure.
- Operating businesses that generate cash flow—such as validator services for networks and credit instruments—provide a durable income stream and a competitive edge over passive holders.
- Tokenized real-world assets, especially tokenized public and private credit, could become major revenue sources and usable collateral on DeFi platforms.
- RWAs are expected to grow over the next 24 months, with tokenization potentially expanding access to credit markets on blockchain rails.
- Public statements from leaders in the field, plus moves by index providers, signal a continued push to convert crypto treasuries into diversified, income-generating vehicles rather than pure asset pools.
Market context: The wider crypto market has faced liquidity strains and risk-off sentiment, influencing how treasury-focused firms balance crypto exposure with income-generating assets. Tokenized assets and DeFi-based lending and borrowing present new ways to monetize crypto holdings, but scale and governance remain critical concerns as regulators watch the sector closely.
Why it matters
For investors, the shift from pure custody to diversified, income-producing strategies in crypto treasuries could reshape risk profiles and yield expectations. Firms that blend crypto accrual with fixed-income and tokenized credit instruments may deliver steadier cash flows even when crypto prices underperform. This shift also underscores a broader trend toward integrating traditional finance-style revenue sources with blockchain-native assets, potentially broadening the investor base beyond hardcore crypto enthusiasts.
From a builder’s perspective, the push toward tokenized real-world assets and RWAs highlights a need for robust tokenization platforms, secure on-chain collateral mechanisms, and interoperable DeFi layers. If tokenized credit can be reliably originated, securitized, and audited, crypto treasuries could access new pools of capital while offering investors diversified exposure across both digital assets and traditional credit risk—and doing so with increased transparency and liquidity on-chain.
Policy and market infrastructure players are also paying attention. The debate over whether major indices should include crypto-focused treasuries or tokenized credit products continues, with MSСI and other index providers weighing the case for broader crypto exposure through fixed-income-like instruments, a stance that could influence flows and valuation benchmarks. The narrative is not just about price appreciation; it’s about building a durable ecosystem where crypto treasuries function as diversified financial platforms rather than speculative holdings.
What to watch next
- Watch for consolidation announcements among crypto treasury players as 2025–2026 market conditions evolve and NAV pressures persist.
- Track progress in tokenizing real-world assets and the adoption of tokenized public and private credit as DeFi collateral or liquidity channels.
- Monitor MSCI or other index providers’ commentary or actions regarding crypto treasury companies and RWAs, which could influence institutional access to the sector.
- Follow regulatory developments around tokenized debt, on-chain collateral standards, and cross-border credit instruments used by treasuries.
- Observe liquidity trends in DeFi lending and borrowing protocols linked to tokenized assets, which may shape demand for treasury-based credit products.
Sources & verification
- Interviews and comments from Wojciech Kaszycki, chief strategy officer at BTCS, regarding consolidation and the role of cash-flow-generating operations.
- Analysis of the 2025 market downturn affecting crypto treasury stock valuations relative to crypto holdings on balance sheets (referenced in related industry coverage).
- Research and discussion around tokenized real-world assets, particularly tokenized public and private credit, and their potential use as DeFi collateral.
- MSCI correspondence and potential considerations for including crypto treasury players or RWAs in its indices, as cited in industry discussions.
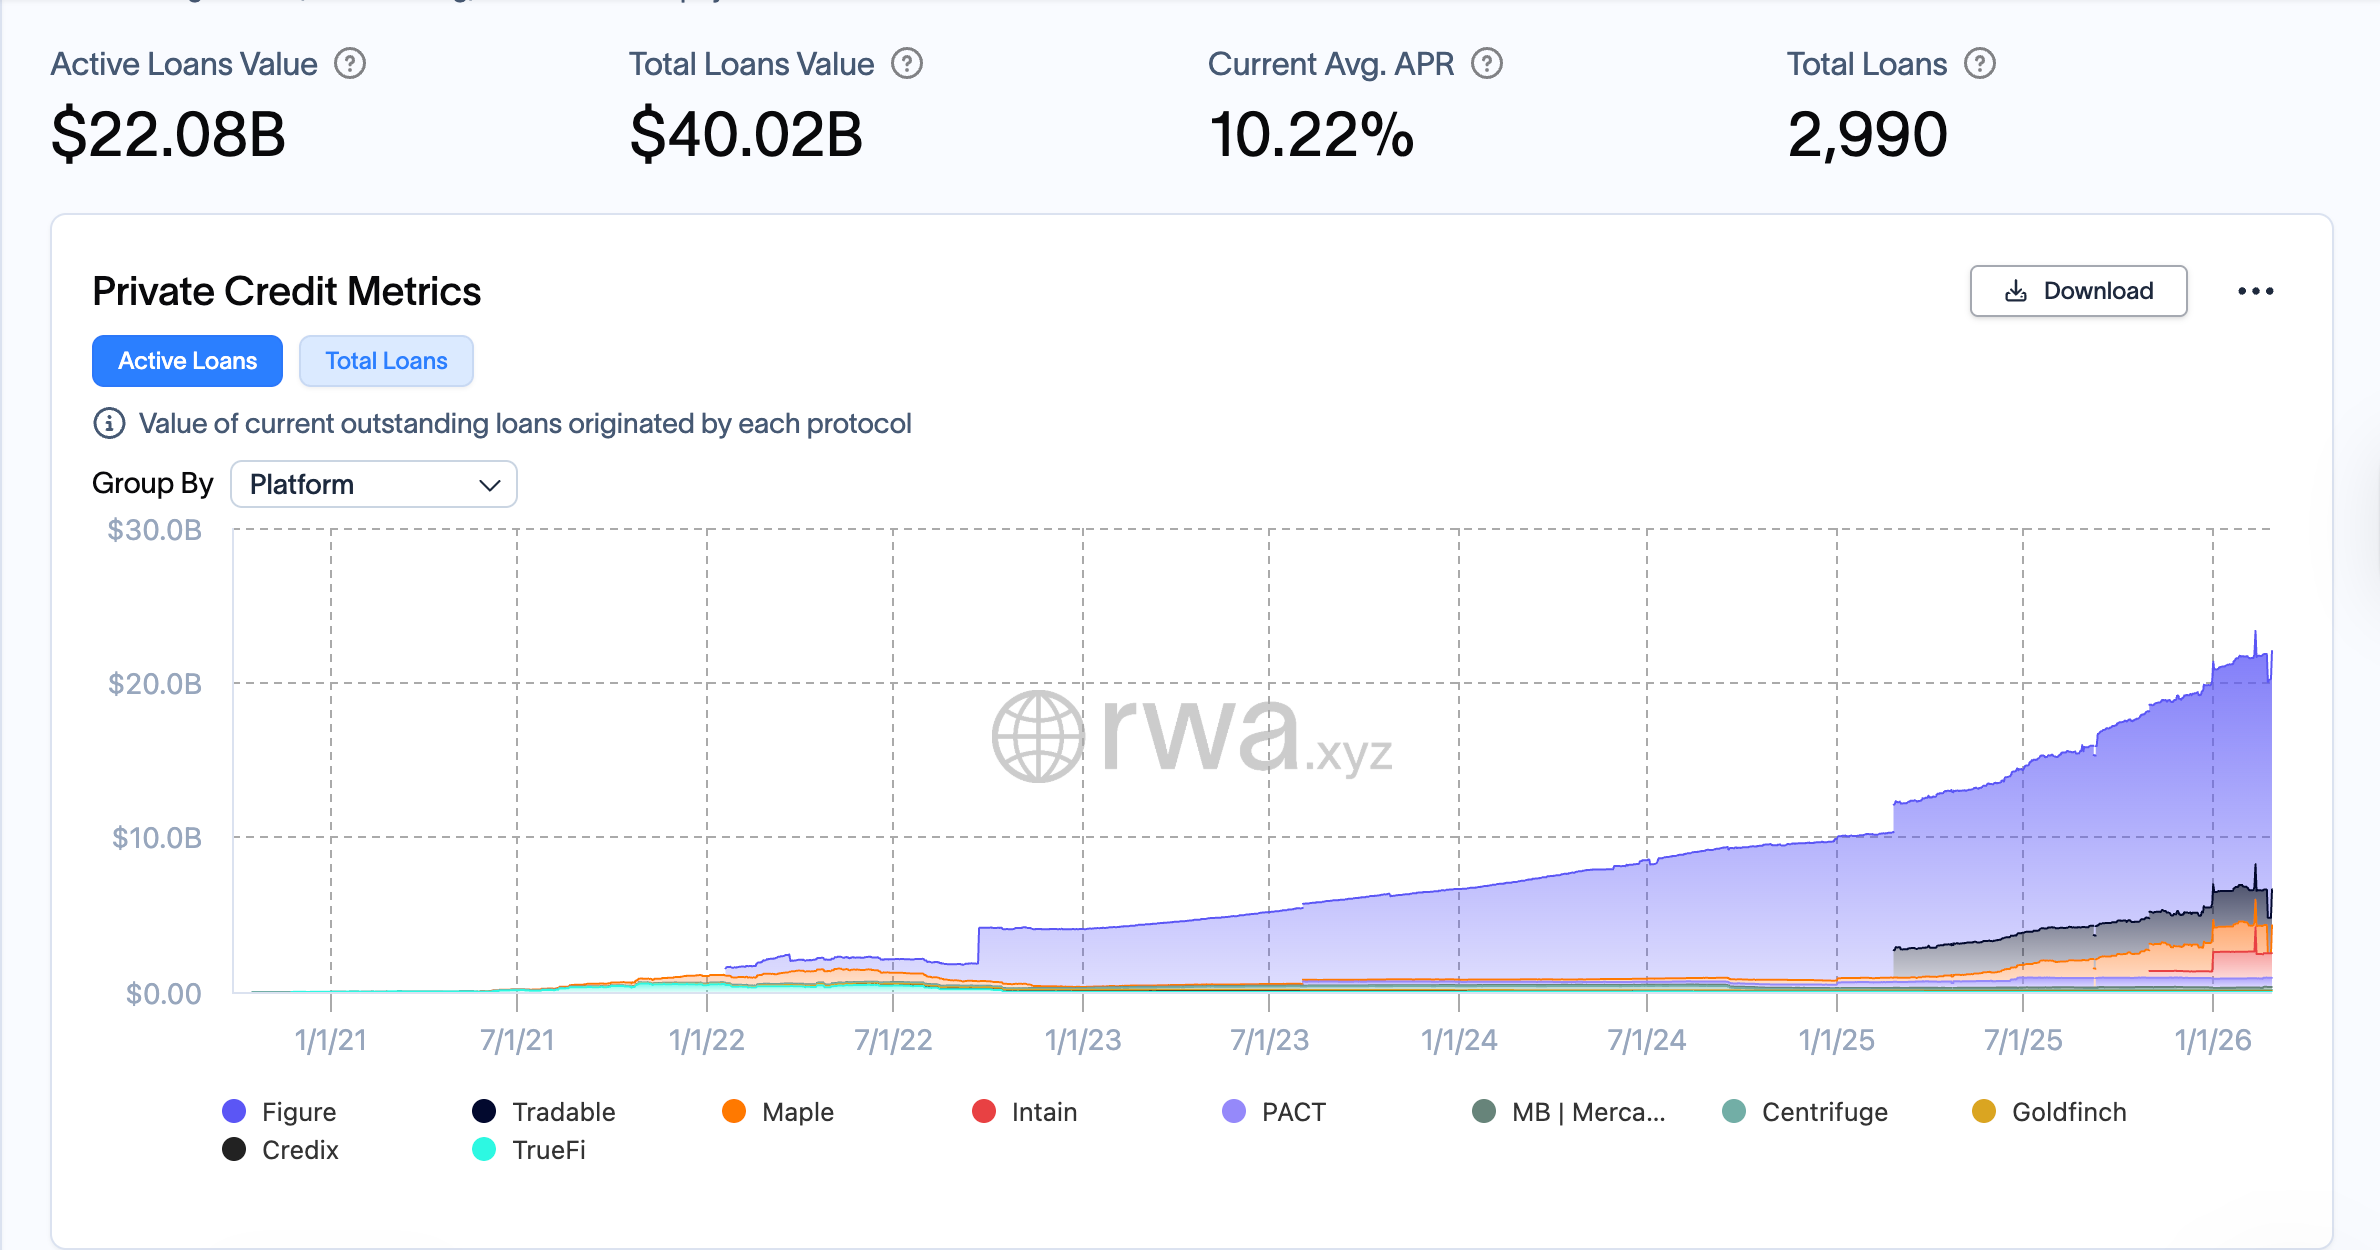
- RWA.XYZ private credit overview and related on-chain accessibility of tokenized credit markets.
Market reaction and consolidation in crypto treasuries
Bitcoin (CRYPTO: BTC) treasuries, the subset of crypto asset managers that hold substantial balances of digital assets while simultaneously running revenue-generating operations, stand at a crossroads. The central argument advanced by Kaszycki is that the operating backbone of treasury firms—validator services that secure and govern blockchain networks, and a suite of credit-related offerings—provides a recurring cash flow that pure hodling strategies cannot match. This cash flow, in turn, enables strategic investments in distressed peers and underperforming units, potentially at prices that reflect fear rather than fundamental value. In effect, the downturn could be seen not just as a bear market, but as a field test for structural resilience built on diversified income rather than price appreciation alone.
The narrative is reinforced by a recent market backdrop where many crypto treasuries traded below the net asset value of their crypto holdings, a situation described as a “market-wide downturn” in 2025. The phenomenon underscores the tension between asset prices and the underlying value of on-chain and off-chain earnings streams. It also foreshadows the possibility that consolidations—mergers or acquisitions that combine cash-generating platforms with asset-light traders—could reshape the competitive landscape. In practical terms, a merger between two nimble players with complementary business models can generate outsized gains relative to the sum of their parts. Kaszycki’s line that “two plus two equals six or more” captures a belief that coordination and scale can enable quicker defense and faster growth in a market where many players struggle to maintain NAV integrity.
On the revenue side, tokenized credit markets and RWAs emerge as a core theme. Public and private credit instruments, already a fixture in traditional finance, are increasingly being considered for tokenization on blockchain rails. The idea is that tokenized real-world assets could be used as collateral for DeFi lending or borrowing protocols, providing liquidity and yield diversification for treasuries while tethering crypto-native products to broader credit markets. The concept of tokenized credit is not new, but the expectation that it will expand meaningfully over the next 24 months reflects a broader shift toward on-chain monetization of real-world risk. A companion thread to this development is the growth of tokenized private credit, which is already being showcased by specialized platforms and research projects that map the space as a new frontier for treasury income streams.
In parallel, Strategy—widely regarded as the largest Bitcoin treasury operator—has leveraged fixed-income and credit-like instruments to offer investors economic exposure to Bitcoin through a range of securities. The firm’s approach, highlighted in communications with index providers, demonstrates how crypto treasuries are trying to blend regular income with crypto exposure and risk controls. This dual focus positions treasuries to respond to index-provider dynamics, with MSCI and similar bodies exploring the potential inclusion of crypto-based instruments in mainstream benchmarks. The ongoing dialogue around RWAs and fixed-income instruments signals a convergence between crypto treasury strategies and traditional financial product design, which could be a meaningful driver of adoption, capital formation, and governance clarity for a broader audience.
Looking ahead, the tokenization narrative is anchored by industry references to RWAs as a growth engine. The idea that tokenized assets—particularly tokenized credit—could eventually underpin a meaningful portion of treasury revenue is compelling, but it hinges on robust standards for on-chain settlement, risk management, and regulatory clarity. Market observers are watching for concrete progress in the next 12–24 months, including progress reports on RWAs, tokenization platforms’ capabilities, and credible case studies of on-chain collateral use in DeFi lending markets. The RWA.XYZ private credit overview serves as a signal that such workflows are not merely theoretical; they are being tested in real markets, with potential implications for liquidity, pricing, and risk dispersion across the crypto ecosystem.
Ultimately, the evolving picture of crypto treasuries reflects a broader trend toward financialization within the sector. While price cycles will continue to influence sentiment, the combination of cash-flow-generating operations, tokenized asset strategies, and disciplined NAV management could redefine the role of treasuries—from passive storage of value to active participants in a more complex, multi-asset financial landscape. The next chapters will likely be written by firms that can blend on-chain innovation with traditional risk controls, while keeping a clear eye on market cycles, regulatory developments, and the flow of capital between crypto markets and conventional finance.
The crypto treasury market is likely to consolidate this year amid the market downturn, as companies with operating businesses merge with or acquire those trading below net asset value (NAV), according to Wojciech Kaszycki, chief strategy officer of crypto infrastructure and treasury company BTCS.
Operating businesses, such as providing validator services for blockchain networks or offering public and private credit instruments, generate cash flow that give crypto treasury companies an edge over those that only accumulate crypto, Kaszycki told Cointelegraph.
This financial edge allows them to buy up companies treading water on their crypto investments or trading below the value of their crypto holdings, he said. Kaszycki added:
“If you consolidate with another player, sometimes two plus two equals six or more, you can win faster, because everybody in this market trading below net asset value is struggling.”
Crypto treasury companies experienced a market-wide downturn in 2025, with many companies’ stock prices dropping below the value of the crypto held on their balance sheets. The crypto treasury decline preceded the crypto market crash in October.
Related: Crypto Biz: A Bitcoin treasury shareholder revolt
Tokenized public and private credit instruments as a revenue stream for crypto treasuries
“In today’s world, credit instruments are one of the biggest financial instruments used worldwide,” Kaszycki told Cointelegraph.
Public and private credit instruments could also be tokenized on blockchain networks, Kaszycki said.
“I believe tokenized real-world assets (RWA), especially tokenization of public and private credit, is something that will grow a lot in the next 24 months,” he said.
These RWAs could be used as collateral on decentralized finance (DeFi) platforms, including lending or borrowing applications, he said.

Strategy, the biggest Bitcoin (BTC) treasury company in the world, offers credit-like and fixed-income instruments to the investing public.
The company cited its fixed-income instruments as one of the reasons that MSCI, an index provider, should include Strategy and other similar crypto treasury companies in its stock indexes.
“Strategy’s treasury operations are designed to provide investors with varying degrees of economic exposure to Bitcoin by offering a range of securities, including equity and fixed income instruments,” Strategy wrote in response to MSCI.
Magazine: ‘China’s MicroStrategy’ Meitu sells all its Bitcoin and Ethereum: Asia Express
Crypto World
Bitcoin is stuck in a rut but JPMorgan says new legislation could be the ultimate spark

Crypto markets have lacked conviction, as traders struggle to identify a catalyst strong enough to lift prices out of their current lull. Bitcoin has remained range-bound around mid-$60,000, while ether is trading around $2,000, and volumes across major exchanges have thinned.
The digital assets market is thirsty for a solid catalyst, and JPMorgan says it has identified one — market structure legislation in the U.S., called the Clarity Act.
“While sentiment remains negative in crypto markets, we continue to believe that a potential approval of the market structure legislation most likely by mid year could serve as a positive catalyst for crypto markets into the second half of the year,” analysts led by Nikolaos Panigirtzoglou said in a report.
While the market faces broader hesitation among both retail and institutional participants, regulatory ambiguity has also weighed on sentiment, leaving larger investors cautious about deploying new capital.
Market participants say that without tangible progress on a coherent regulatory framework, sidelined capital is unlikely to return in force. This is where the Clarity Act would be a decisive catalyst for the digital assets market, according to JPMorgan.
A comprehensive framework defining oversight, token classifications and exchange obligations would remove one of the biggest overhangs on the asset class: uncertainty. With clearer rules of the road, large asset managers, pension funds and corporate treasuries that have so far remained cautious could gain the confidence and compliance cover to increase allocations.
That wave of institutional participation, in turn, could deepen liquidity, compress volatility and unlock new product development, from structured offerings to broader tokenized assets.
A bill stuck in limbo
At its core, the proposed bill would define oversight across the Commodity Futures Trading Commission (CFTC) and Securities and Exchange Commission (SEC), classifying tokens as either digital commodities or securities.
The bank’s analysts said placing major tokens under CFTC jurisdiction would reduce compliance burdens and legal uncertainty. A “grandfather” clause would allow certain tokens tied to spot exchange-traded funds listed before Jan. 1, 2026, including XRP, solana, litecoin, hedera, dogecoin and chainlink, to be treated as commodities.
The proposal would also let new projects raise up to $75 million annually without full SEC registration, subject to disclosure rules. The analysts said that the grace period could revive onshore issuance, venture funding and deal activity that has shifted overseas.
However, the leading U.S. effort to establish the federal crypto rules has stalled in the Senate after months of talks and missed timelines, leaving the bill in limbo as lawmakers wrangle over key provisions.
A scheduled Senate Banking Committee markup was postponed in early 2026 after Coinbase (COIN), the largest U.S. crypto exchange, publicly withdrew its support for the bill, saying the current text could hamper innovation, weaken competition, and restrict features like stablecoin rewards.
Coinbase’s opposition exposed divisions among industry players and lawmakers, even as some analysts and banking voices say the bill’s core goals, clearer SEC/CFTC oversight and defined regulatory pathways, keep momentum alive.
Coinbase CEO Brian Armstrong said earlier this month that banking trade groups, rather than individual banks, were largely responsible for the stalled talks over U.S. crypto market structure legislation.
In a market still heavily driven by sentiment and flows, a decisive regulatory breakthrough could act as a powerful catalyst, the kind that doesn’t just steady prices, but potentially propels them sharply higher.
Read more: From Wall Street to Web3: This is crypto’s year of integration, Silicon Valley Bank says
Fresh U.S. and Israeli strikes on Iran have drawn new attention to a financial network Tehran has built in parallel to its battered banking system: bitcoin mining and a fast-growing stablecoin economy.
Iran legalized crypto mining in 2019, allowing licensed operators to use subsidized electricity in exchange for selling mined BTC to the central bank. Bitcoin has served as a tool for paying for imports and settling trade outside the dollar system, even if indirectly.
Estimates in recent years have put Iran’s share of global bitcoin mining power between 2% and 5%, though much of the activity operates out of public view.
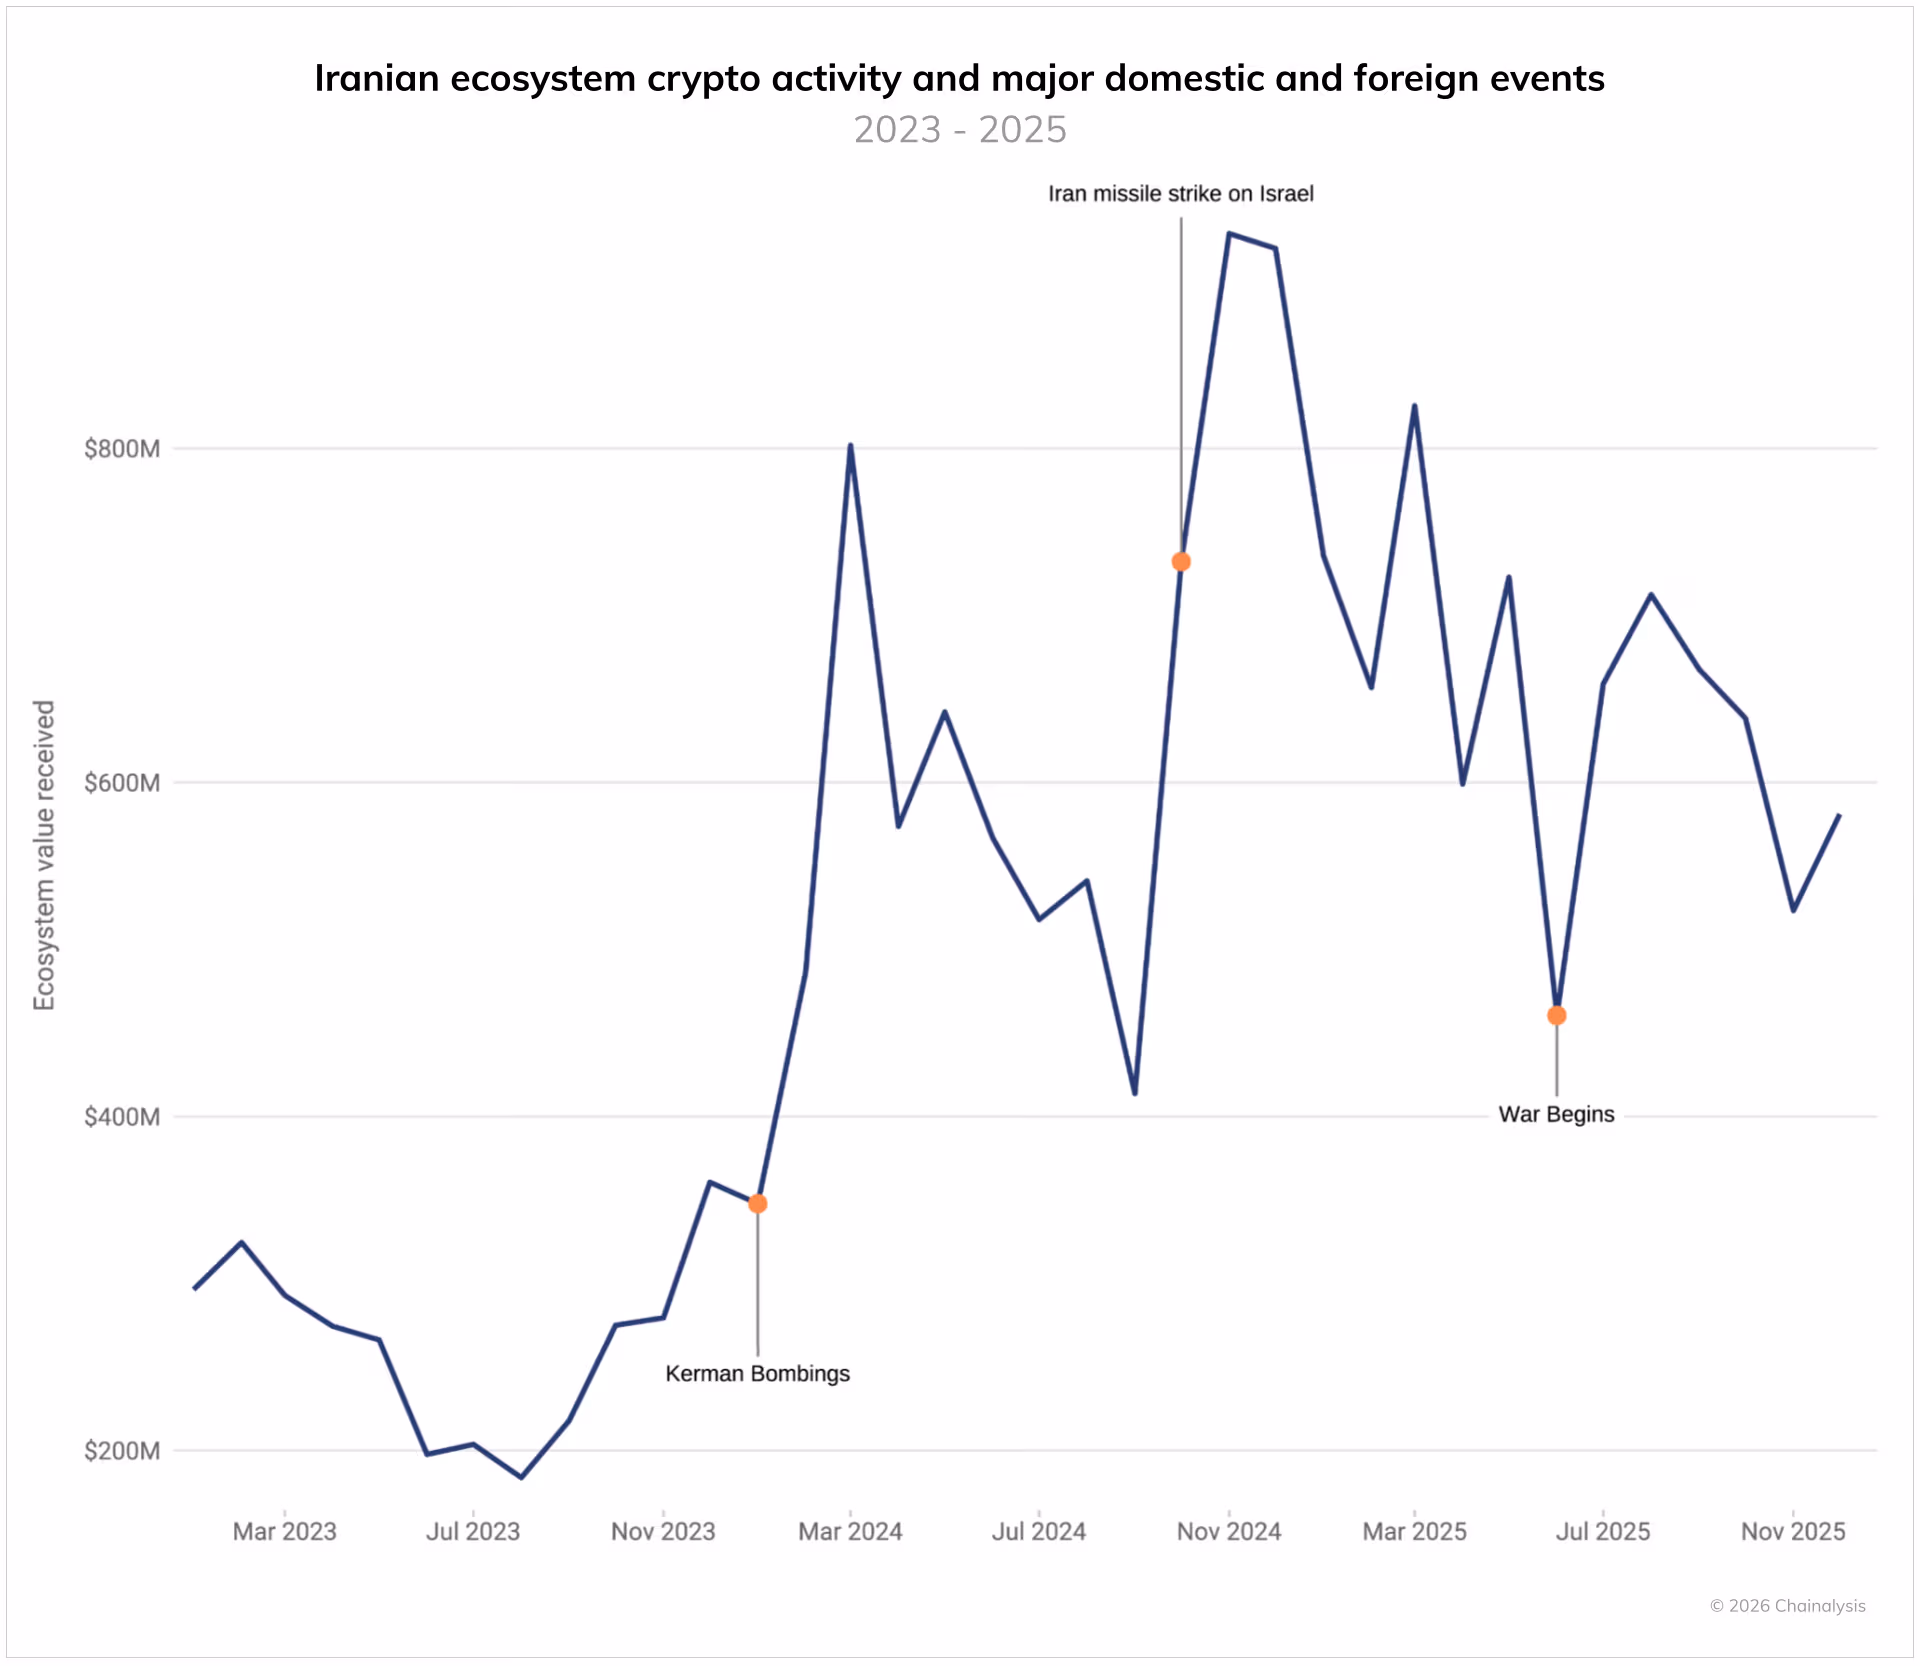
Blockchain analytics firm Chainalysis found that Iran’s crypto ecosystem reached $7.78 billion in 2025, growing faster than the year before. That figure is as large as the GDP of some smaller countries such as the Maldives, or Liechtenstein.
Activity often spiked around military clashes and domestic unrest, including last year’s 12-day conflict with Israel, according to Chainalysis.

The Islamic Revolutionary Guard Corps (IRGC), the primary branch of the country’s military, has since deepened its role in the space. Chainalysis estimates IRGC-linked addresses accounted for more than 50% of total Iranian crypto inflows in the fourth quarter of 2025, with over $3 billion in value received last year.
Those figures reflect only wallets publicly tied to sanctions listings, suggesting the true footprint may be larger.
Adoption mechanics
Stablecoins also play a key role.
Separate analysis by Elliptic found Iran’s central bank accumulated at least $507 million in USDT in 2025, likely to steady the rial and finance trade. That effort has mostly failed, with data showing that the rial has lost more than 96% of its value against the USD.

At the same time, ordinary Iranians have turned to bitcoin. During recent protests and an internet blackout, withdrawals from local exchanges to personal wallets rose sharply.
Read more: Iran’s rial collapse mirrors Lebanon’s crisis, driving citizens to bitcoin
If conflict disrupts power grids, mining output could dip in the short term. The Iranian state is believed to be mining BTC at around $1,300 per coin, which it then sells at current market prices. It’s unclear whether the state has maintained any bitcoin reserves, as there is no treasury dashboard and no official disclosure of holdings.
In practice, mining turns cheap domestic energy into an asset that can move across borders. A licensed miner mints new bitcoin and then sends them to the central bank of Iran. The bank can then transfer it to an overseas counterparty to pay for machinery, fuel or consumer goods without routing funds through U.S.-controlled banks.
While the transactions settle on a public blockchain, the counterparties can remain opaque.
The same pattern appears in stablecoins. USDT, which is pegged to the dollar, has become a standard settlement tool in sanctioned economies because it offers price stability and faster transfers than bitcoin.
However, it’s not always easy to hide such transactions. Crypto exchange Binance recently found itself embroiled in accusations that it fired investigators who raised concerns about funds moving through the exchange to sanctioned, Iran-linked entities. This led to nine U.S. Senate Democrats asking the Treasury and DOJ to probe Binance’s illicit finance controls.
Geopolitical risks
Chainalysis data shows that Iranian crypto activity correlates with political flashpoints, including missile exchanges and internal protests. During periods of unrest, exchange outflows rise as users pull funds into private wallets.
For the IRGC, crypto offers another channel to move value across its network of affiliates and commercial fronts. Chainalysis reported that inflows to IRGC-linked addresses totaled $2 billion in 2024 and exceeded $3 billion in 2025.
The renewed military campaign, which has seen the IRGC retaliate against U.S. bases in various countries in the Middle East, adds fresh risk to this system. Large mining operations require steady power. Iran has imposed seasonal bans in the past to ease strain on the grid.
A sustained conflict that damages infrastructure could reduce the hash rate or mining capacity tied to the country, though the global bitcoin network would likely adjust over time as miners elsewhere pick up the slack.
TLDR:
- OranjeBTC says repeated Instagram suspensions disrupt official investor communication and financial education efforts.
- The company attributes the removals to automated moderation rather than policy violations.
- CEO Gui Gomes appealed directly to Meta for a formal review and clarity.
- The case highlights friction between crypto education and social media enforcement systems.
Latin America’s largest Bitcoin treasury company has again lost access to its main social media channel. OranjeBTC confirmed that Instagram suspended its account for the third time without a clear explanation.
The company says it relies on the platform to reach more than 8,000 investors with financial education content. The incident raises questions about how automated moderation treats crypto-related communication.
OranjeBTC Reports Repeated Instagram Suspensions
OranjeBTC announced the latest suspension through its official X account, calling the action an apparent algorithm mistake.
The firm described Instagram as its primary channel for corporate updates and financial education. It said the account had no history of policy violations tied to harmful or misleading content.
The company explained that its posts focus on Bitcoin, finance, and public company disclosures. It stressed that the material is educational and intended for a growing investor base. OranjeBTC added that the repeated removals have disrupted routine communication with shareholders.
According to the company’s statement, the suspension occurred without prior warning or detailed justification. The firm asked for a formal review and clearer guidance from the platform. It also appealed to the broader crypto community to amplify the issue and seek visibility.
Chief executive Gui Gomes publicly addressed the situation on X.
Gui Gomes said the company uses Instagram as an official investor channel and not for promotion. He suggested the incident reflects automated moderation limits rather than deliberate enforcement.
Instagram Algorithm Errors Trigger Appeal to Meta for Review
Gomes directly tagged Meta in his post, asking for human review of the suspension. He argued that financial education about Bitcoin should not be treated as policy risk. His message emphasized the company’s role as a regulated public firm in Brazil.
The executive said this was the third attempt to restore the account after previous removals.
He framed the issue as part of a wider problem facing crypto educators on social platforms. Similar complaints have surfaced from other digital asset firms that rely on automated moderation systems.
OranjeBTC stated that its Instagram content avoids investment advice and focuses on awareness of Bitcoin and corporate developments.
The firm said it follows transparency standards required of public companies. It also said the account exists to serve investors, not attract speculative trading.
The company urged platform operators to improve clarity around enforcement rules. It maintained that repeated suspensions undermine trust in digital communication channels used by financial firms.
OranjeBTC said it will continue building its presence while waiting for a response from Instagram.
Crypto World
Why the next phase of stablecoin payments is all about user relationships and distribution


You can’t have missed the stablecoin vibe. While bitcoin and the rest of the crypto market are in the doldrums after falling from record highs in October, everyone else is talking about issuing tokens whose value is fixed, pegged to a real-world asset. Mostly the dollar.
Not only the dollar, of course. This week alone, AllUnity, a German joint venture between DWS, Galaxy, and Flow Trader, issued a Swiss franc-based token (CHFAU) and SBI Holdings and Startale Group introduced a yen version (JPYSC). Earlier this month, Agant said it’s working on a pound stablecoin, and Hong Kong said it plans to start handing out stablecoin licenses in March.
Then there’s the revelation that Mark Zuckerberg-led Meta (META) is looking to add stablecoin-based payment capabilities early in the second half of the year. The company famously tried and failed to introduce the Libra stablecoin, renamed Diem in 2019, in the face of stiff opposition from lawmakers and regulators.
But Meta’s proposed return to stablecoin-based payments later this year bears little comparison with Libra/Diem, according to the co-creator of Libra, Christian Catalini, who is now a professor at MIT and the founder of the MIT Cryptoeconomics Lab.
What’s different now, says Catalini, is that stablecoins are fading into the background, offered by multiple providers and becoming part of the payments infrastructure. The once-hyped businesses of stablecoin issuance and orchestration, or the coordination of payments across different blockchains and conversion between token and fiat for payment purposes, are becoming a commodity, he said.
“Not just Meta, but also Google, Apple, all of them will be using multiple providers, as is the case when they do disbursements of payments,” Catalini said in an interview with CoinDesk. “So I would expect the market to be commodified in the future, rather than a branded stablecoin. In a sense, it’s a sign that the market has matured.”
This sentiment was also voiced by Meta’s VP of communications, Andy Stone, who said the move to bring stablecoin payments back was simply “about enabling people and businesses to make payments on our platforms using their preferred method.”
Billions of users
The real competitive advantage in stablecoins, the moat that holds competitors at bay, now lies in distribution, said Catalini. Whoever owns the direct relationship with the end user will capture the most value. And Meta has billions of users across Facebook, WhatsApp and Instagram, almost 3.6 billion according to its most recent earnings report.
The focus on contacts and reach is a marked change from accruing value by delivering stablecoins to a wallet, or going from fiat to crypto and then back to fiat — the so-called stablecoin sandwich required for regular payment transactions.
This change has started to play out recently, with news about companies walking away from acquiring stablecoin orchestration companies.
It’s also good news for incumbents such as the card networks, fintechs, neobanks and some wallet firms who have an advantage because they actually own the touch point with the end user, Catalini pointed out. Stablecoin payments threaten to cut the lucrative interchange fees payment networks like Visa and Mastercard claim, but the card networks have a significant advantage when it comes to distribution.
“If [the card networks] can commoditize the rails and commoditize the assets, they will be able to defend their business,” Catalini said. “The commoditization of the assets is inevitable — there’s going to be many stablecoins and many banks will want their own — so the rails are where things will get interesting.”
Also in the fray is Stripe, Meta’s long-time payment partner whose CEO Patrick Collison joined Meta’s board of directors a year ago and is a potential vendor that Meta might enlist for its stablecoin project.
The payments giant’s aggressive crypto power plays are not to be underestimated: Stripe bought stablecoin specialist Bridge for $1.1 billion last year, and has built its own blockchain called Tempo.
Still, Catalini questioned whether other firms will flock to a competitor’s blockchain, even if it’s purportedly a public network.
“If you are another big payment service provider, would you want to build on Stripe’s Tempo? Probably not,” Catalini said. “It goes back to the key challenge of making these networks truly open and neutral, which is the entire point of crypto. But of course, it’s a hard one to actually deliver on from a practical perspective, unless you’re building on something already established like Ethereum, Bitcoin, or Solana.”
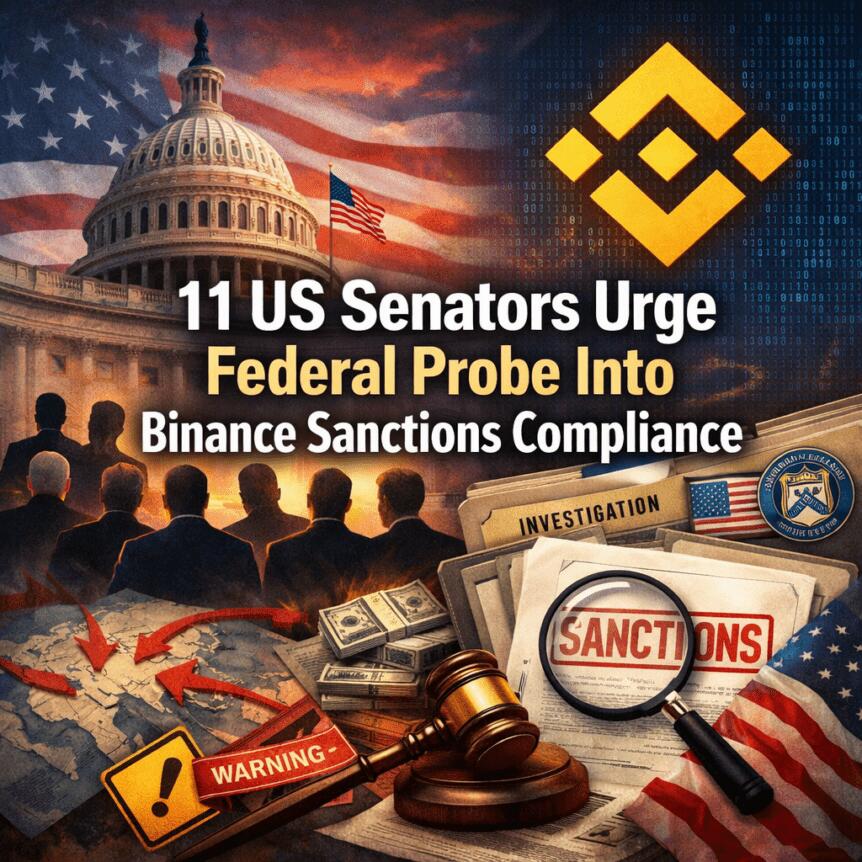
A bipartisan group of 11 United States senators has pressed federal authorities to scrutinize Binance’s compliance with sanctions and anti-money-laundering rules, citing escalating public scrutiny and a string of contentious reports. In a letter addressed to Treasury Secretary Scott Bessent and Attorney General Pamela Bondi, the lawmakers urged an expedited and thorough assessment of the exchange’s controls and its handling of prior settlement commitments reached in 2023. The missive highlights claims that roughly $1.7 billion in digital assets potentially flowed to Iranian entities tied to terrorism, and points to investigations into Iranian-based accounts and possible evasion of Russian sanctions. The document also notes claims that Binance’s internal responders who flagged suspicious activity faced dismissal, and that law-enforcement agencies have observed a downturn in cooperation from the firm on customer information requests.
Key takeaways
- Eleven U.S. senators asked multiple federal agencies to conduct a prompt, comprehensive review of Binance’s sanctions-and-AML controls and adherence to 2023 settlement terms.
- The letter references allegations of about $1.7 billion in digital-asset flows linked to Iranian entities tied to terrorism, including groups connected to the Houthis and the Islamic Revolutionary Guard Corps.
- Investigators reportedly identified more than 1,500 accounts accessed by users in Iran and possible activity aimed at evading Russian sanctions.
- According to the letter, some Binance staff who flagged suspicious transactions were dismissed, and law-enforcement agencies indicated Binance had become less cooperative in providing customer information.
- Senators warned that newer Binance products, such as payment cards in parts of the former Soviet Union and partnerships tied to stablecoin initiatives, could enable sanctions evasion.
Sentiment: Neutral
Market context: The escalation comes amid growing regulatory focus on exchange compliance and wider scrutiny of sanctions enforcement in crypto markets, with policymakers seeking clearer accountability for cross-border transactions and the robustness of AML controls during periods of heightened geopolitical risk.
Why it matters
The episode underscores the central role of major exchanges in economic sanctions enforcement and the delicate balance between fostering innovation and ensuring lawful conduct. As policymakers scrutinize Binance’s checks and balances, questions about transparency, information sharing with authorities, and the efficacy of enforcement mechanisms come to the fore. The stakes extend beyond one platform: they touch on the credibility of sanctions regimes in the digital asset era and the capacity of regulators to monitor rapidly evolving products, such as payments-linked services and stablecoin-related ventures, that could potentially be exploited for evading sanctions.
The discussions also spotlight the tension between operational secrecy in risk controls and the public interest in accountability. Binance has repeatedly faced questions about how it flags suspicious activity and how it collaborates with law enforcement. The senators’ letter maintains that a rigorous review is warranted not only to evaluate past settlements but to assess how future models—especially card-based products and cross-border partnerships—fit within the existing regulatory framework. In parallel, congressional inquiries have sought documents and internal records related to the exchange’s sanctions controls, signaling a broader push to obtain a clearer image of internal governance at a high-profile crypto venue.
What to watch next
- By March 13, agencies are asked to report on steps taken to examine Binance’s conduct, including the effectiveness of its sanctions controls.
- A congressional inquiry into Binance’s sanctions practices, led by Senator Blumenthal, is expected to yield new documents and testimony from the firm’s leadership.
- Regulators and prosecutors may press Binance for deeper disclosures around past settlements and the handling of suspicious activity reports.
- The exchange’s cooperation with investigators and its stance on Iranian-user activity will be tested as media coverage continues to surface conflicting narratives.
- Market participants will watch for regulatory signals that could shape the adoption and design of crypto-sanctions regimes, especially concerning new products and stablecoins tied to cross-border payments.
Sources & verification
- The letter from 11 senators to Treasury Secretary Scott Bessent and Attorney General Pamela Bondi requesting review of Binance’s sanctions controls: https://www.vanhollen.senate.gov/imo/media/doc/cvh_bessent_bondi_ltr_binance.pdf
- Binance denial of Iran-linked transaction allegations and assertion of cooperation with authorities, as reported to Cointelegraph: https://cointelegraph.com/news/binance-denies-iran-sanctions-report-fortune
- Senator Richard Blumenthal’s congressional inquiry into Binance, including a request for documents related to sanctions controls: https://cointelegraph.com/news/us-senator-probes-binance-iran-russia-sanctions
- Binance CEO’s response to coverage of Iran-related activity and criticisms of a Wall Street Journal report: https://cointelegraph.com/news/binance-ceo-legal-action-report-iranian-entities
Market reaction and key details
Regulators and lawmakers appear intent on mapping Binance’s risk controls against a backdrop of continued scrutiny of the broader crypto ecosystem. While Binance has touted its compliance efforts and stated that it does not permit Iranian users, public narratives surrounding these allegations continue to prompt questions about due diligence, cooperation with law enforcement, and the ability of large exchanges to detect and deter sanctioned activity. The dynamic highlights the ongoing tension between enterprise-level risk management and regulatory expectations as the crypto market seeks clarity on governance and accountability in a landscape that remains highly scrutinized by policymakers worldwide.
Why it matters
The episode reinforces the critical importance of robust sanctions-compliance infrastructures within major crypto platforms. As policymakers seek to close perceived gaps in enforcement and as new product lines expand cross-border capabilities, exchanges face intensified demands for auditable controls and transparent reporting. For users and investors, the developments illustrate the evolving regulatory environment that shapes how digital assets are traded, settled, and monitored for illicit activity. For builders and auditors, there is a clear signal that governance frameworks, risk controls, and cooperative compliance partnerships will be central to sustaining trust in a market that remains under close regulatory watch.
What to watch next
- Potential disclosures from Binance about internal governance, risk controls, and staff retention practices related to compliance investigations.
- Follow-up statements from the agencies expected to participate in the review and any public briefing on sanctions enforcement in crypto across the sector.
- Regulatory guidance or formal actions that could reshape product launches, especially in regions where new payment-card-type offerings are being rolled out.

Guardiola leads Ramadan inclusivity in Premier League

Erling Haaland injury latest as Pep Guardiola provides update and Man City sweat on fitness
With Netflix Retreat, Trump Ally Larry Ellison Will Soon Own Warner Brothers, HBO, CNN, CBS, Paramount, Discovery, And Part Of TikTok


-

 Politics7 days ago
Baftas 2026: Awards Nominations, Presenters And Performers
-

 Sports5 days ago
Women’s college basketball rankings: Iowa reenters top 10, Auriemma makes history
-

 Fashion1 day ago
Weekend Open Thread: Iris Top
-

 Business4 days ago
True Citrus debuts functional drink mix collection
-

 Politics5 days ago
Nick Reiner Enters Plea In Deaths Of Parents Rob And Michele
-

 Politics2 days ago
ITV enters Gaza with IDF amid ongoing genocide
-

 Crypto World5 days ago
XRP price enters “dead zone” as Binance leverage hits lows
-
Sports16 hours ago
The Vikings Need a Duck
-

 Business6 days ago
Mattel’s American Girl brand turns 40, dolls enter a new era
-

 Tech4 days ago
Unsurprisingly, Apple's board gets what it wants in 2026 shareholder meeting
-
 NewsBeat4 hours ago
Dubai flights cancelled as Brit told airspace closed ’10 minutes after boarding’
-

 Business6 days ago
Law enforcement kills armed man seeking to enter Trump’s Mar-a-Lago resort, officials say
-
 NewsBeat9 hours ago
The empty pub on busy Cambridge road that has been boarded up for years
-
 NewsBeat3 days ago
Manchester Central Mosque issues statement as it imposes new measures ‘with immediate effect’ after armed men enter
-

 NewsBeat3 days ago
Cuba says its forces have killed four on US-registered speedboat | World News
-
 NewsBeat5 days ago
‘Hourly’ method from gastroenterologist ‘helps reduce air travel bloating’
-

 Tech6 days ago
Anthropic-Backed Group Enters NY-12 AI PAC Fight
-

 NewsBeat6 days ago
Armed man killed after entering secure perimeter of Mar-a-Lago, Secret Service says
-

 Politics6 days ago
Maine has a long track record of electing moderates. Enter Graham Platner.
-
 NewsBeat4 days ago
Police latest as search for missing woman enters day nine