

Crypto World
Is the Bottom In for XRP? The Critical Levels You Need to Watch
XRP is still trading in a broader downtrend, and the rebound attempts keep getting capped at lower highs. The asset is now trying to establish a bottom near the lower part of the range, so the next move likely comes down to whether buyers can defend the recent floor and reclaim the first resistance band.
Ripple Price Analysis: The USDT Pair
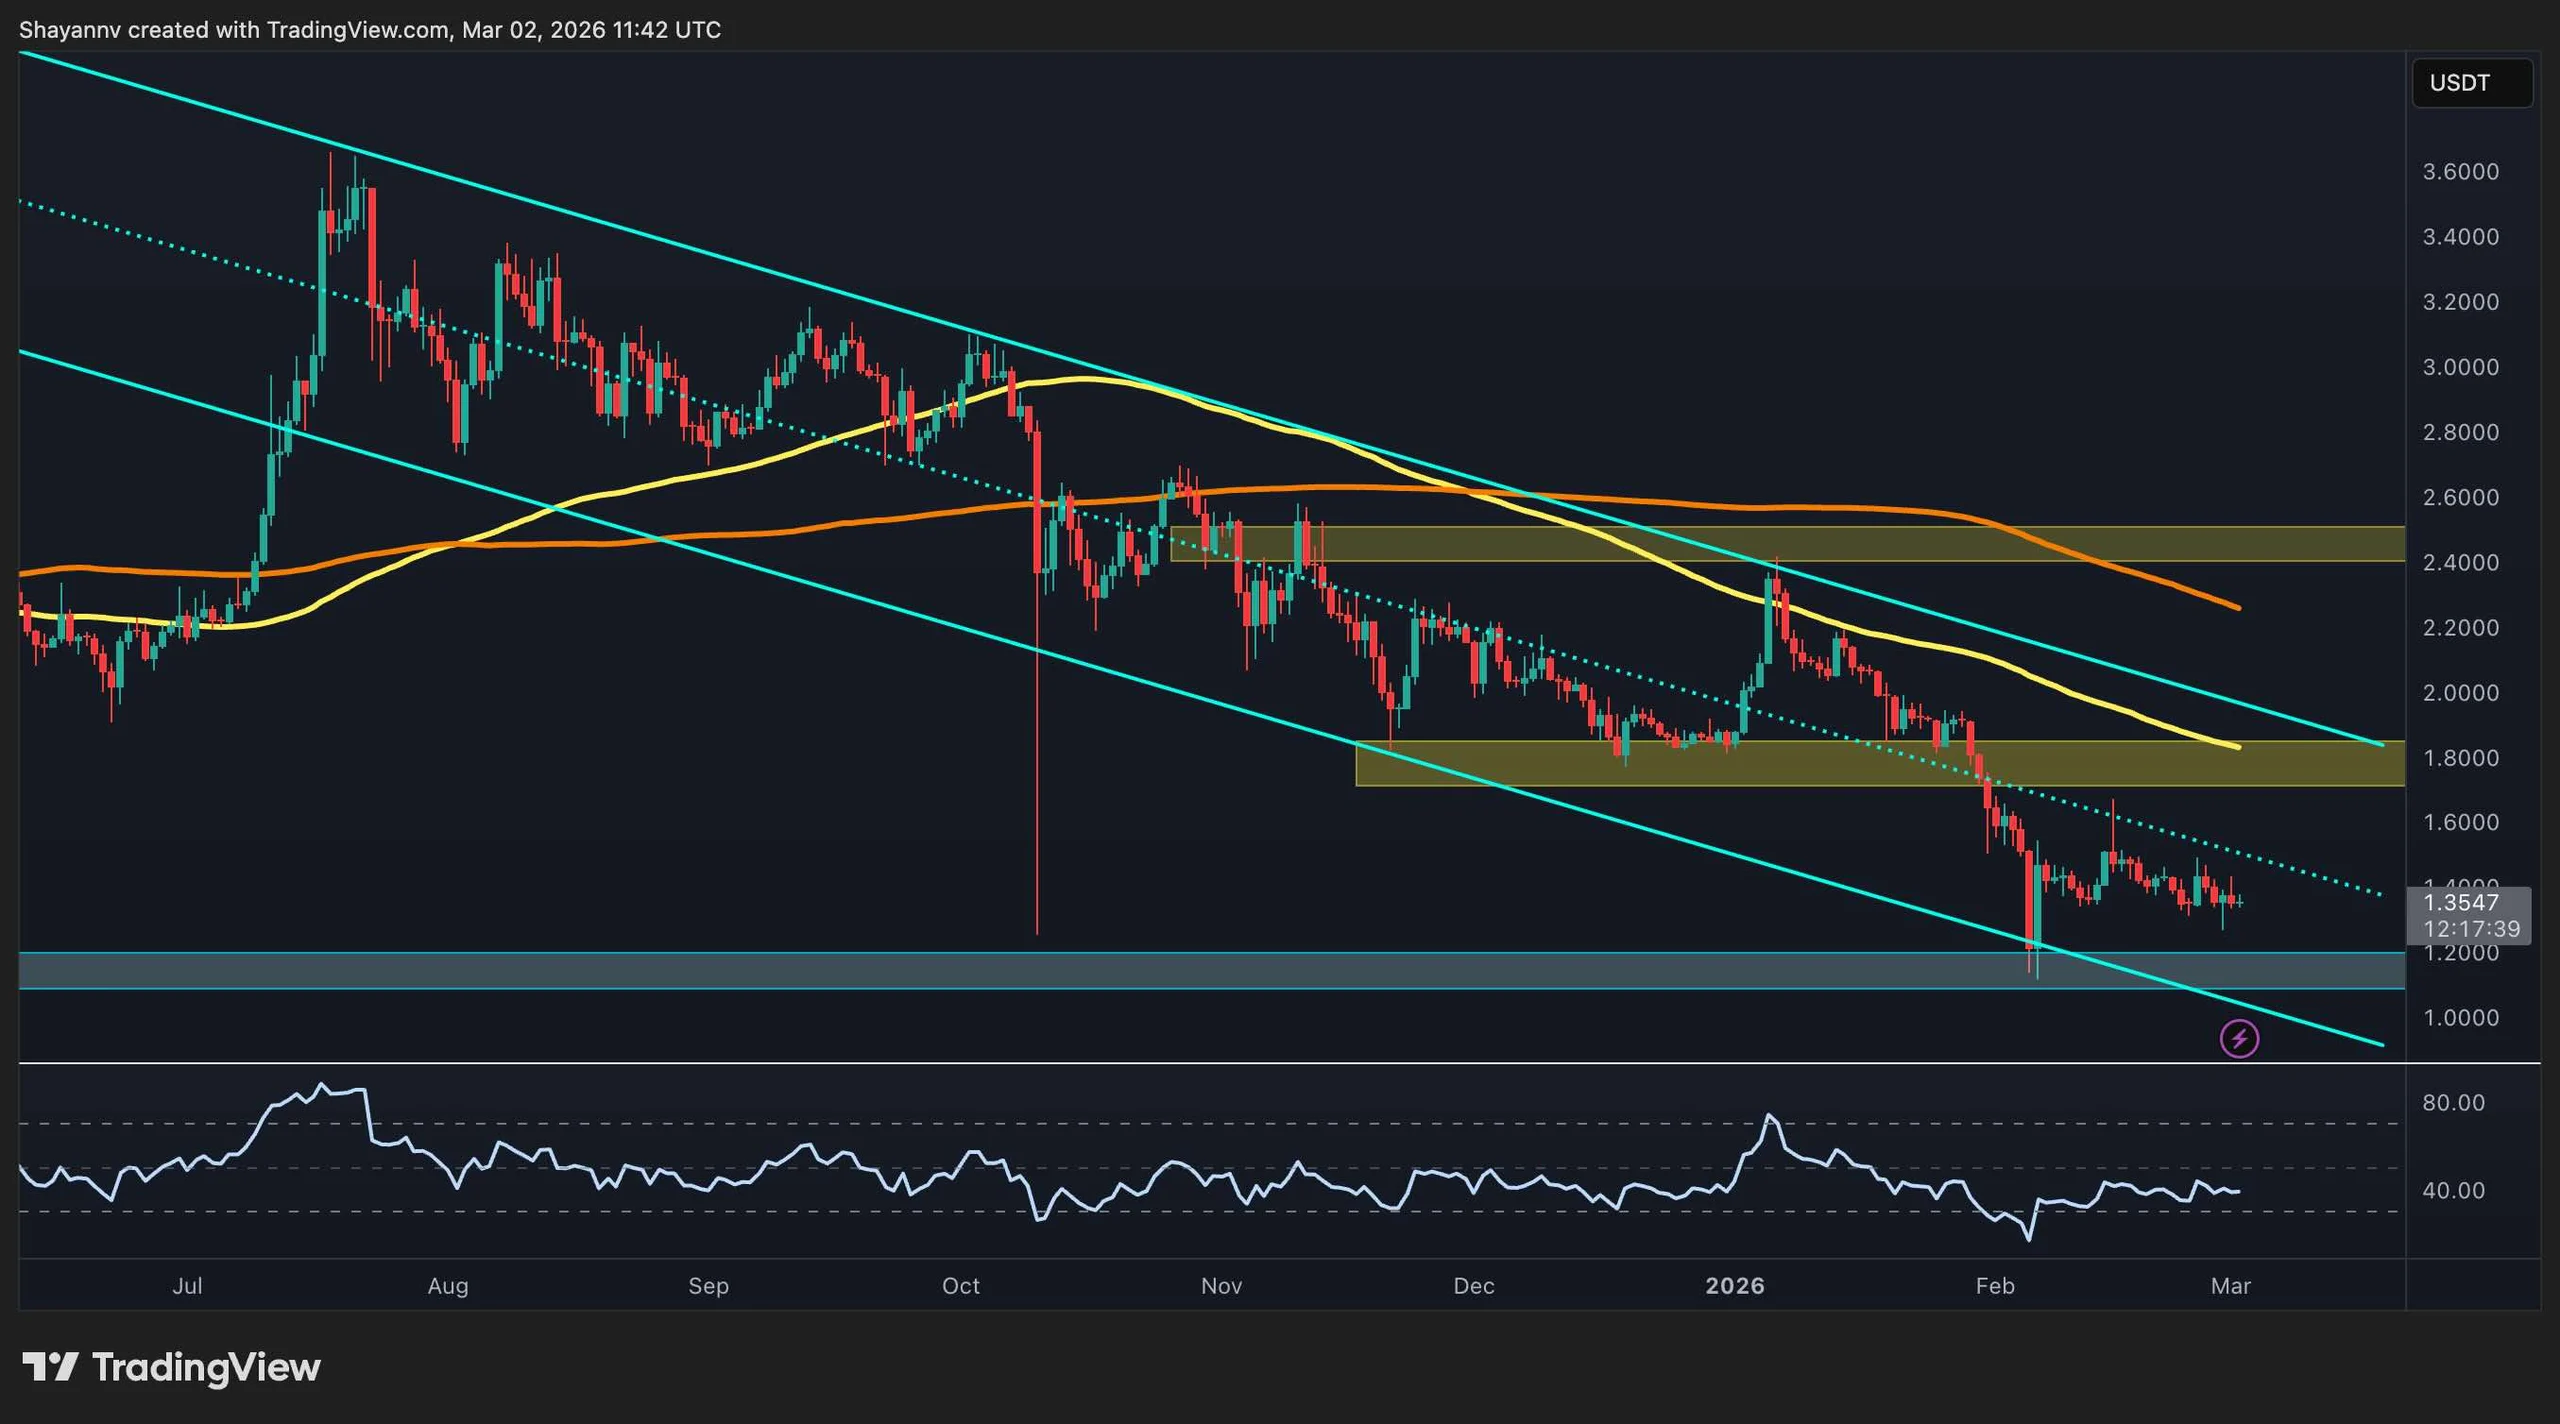
On the daily XRPUSDT chart, the trend remains bearish inside a descending channel, with the price holding below the 100-day moving average and the 200-day moving average. The most important overhead supply is the $1.80 zone, which has acted as a pivot area and now lines up with dynamic resistance from the moving averages and the channel structure.
Above that, the next heavier resistance level sits around $2.40 to $2.50, where sellers previously stepped in and where a larger trend shift would need to prove itself.
Support is concentrated around $1.20, which is the area that has been repeatedly defended after the recent flush. As long as XRP stays above this band, the market can keep forming a base and attempt a recovery leg. A clean daily breakdown below $1.20, however, would weaken the structure and increase the odds of a deeper drop toward the next support region near $1.00 or even lower.
The BTC Pair
On the daily XRPBTC chart, XRP is trading around 2,050 sats and still sits below key resistance levels and the key 100-day and 200-day moving averages, after failing to hold the prior recovery swings. The first resistance to watch is the 100-day moving average around 2,200, followed by the 200-day moving average around 2,400 sats.
These elements have repeatedly rejected the price and also overlap with the moving averages, acting as pressure from above. If XRP can reclaim that zone and hold it, the next upside target becomes the 2,500 to sats supply area.
The main support is also located near the 2,000 sats region, which has been tested multiple times and is clearly a line bulls are trying to defend. If the 2,000-sat level fails on a clean break and close, the next major demand pocket sits much lower around 1,400 to 1,500 sats. That is the type of move that usually happens when Bitcoin strength outpaces altcoins, so XRPBTC is still the key risk gauge for bulls here.

Binance Free $600 (CryptoPotato Exclusive): Use this link to register a new account and receive $600 exclusive welcome offer on Binance (full details).
LIMITED OFFER for CryptoPotato readers at Bybit: Use this link to register and open a $500 FREE position on any coin!
Disclaimer: Information found on CryptoPotato is those of writers quoted. It does not represent the opinions of CryptoPotato on whether to buy, sell, or hold any investments. You are advised to conduct your own research before making any investment decisions. Use provided information at your own risk. See Disclaimer for more information.

XRP (XRP) risked a further drop below $1 as its bearish technical setup converged with increased inflows to exchanges.
Key takeaways:
XRP faces overhead resistance at $1.42
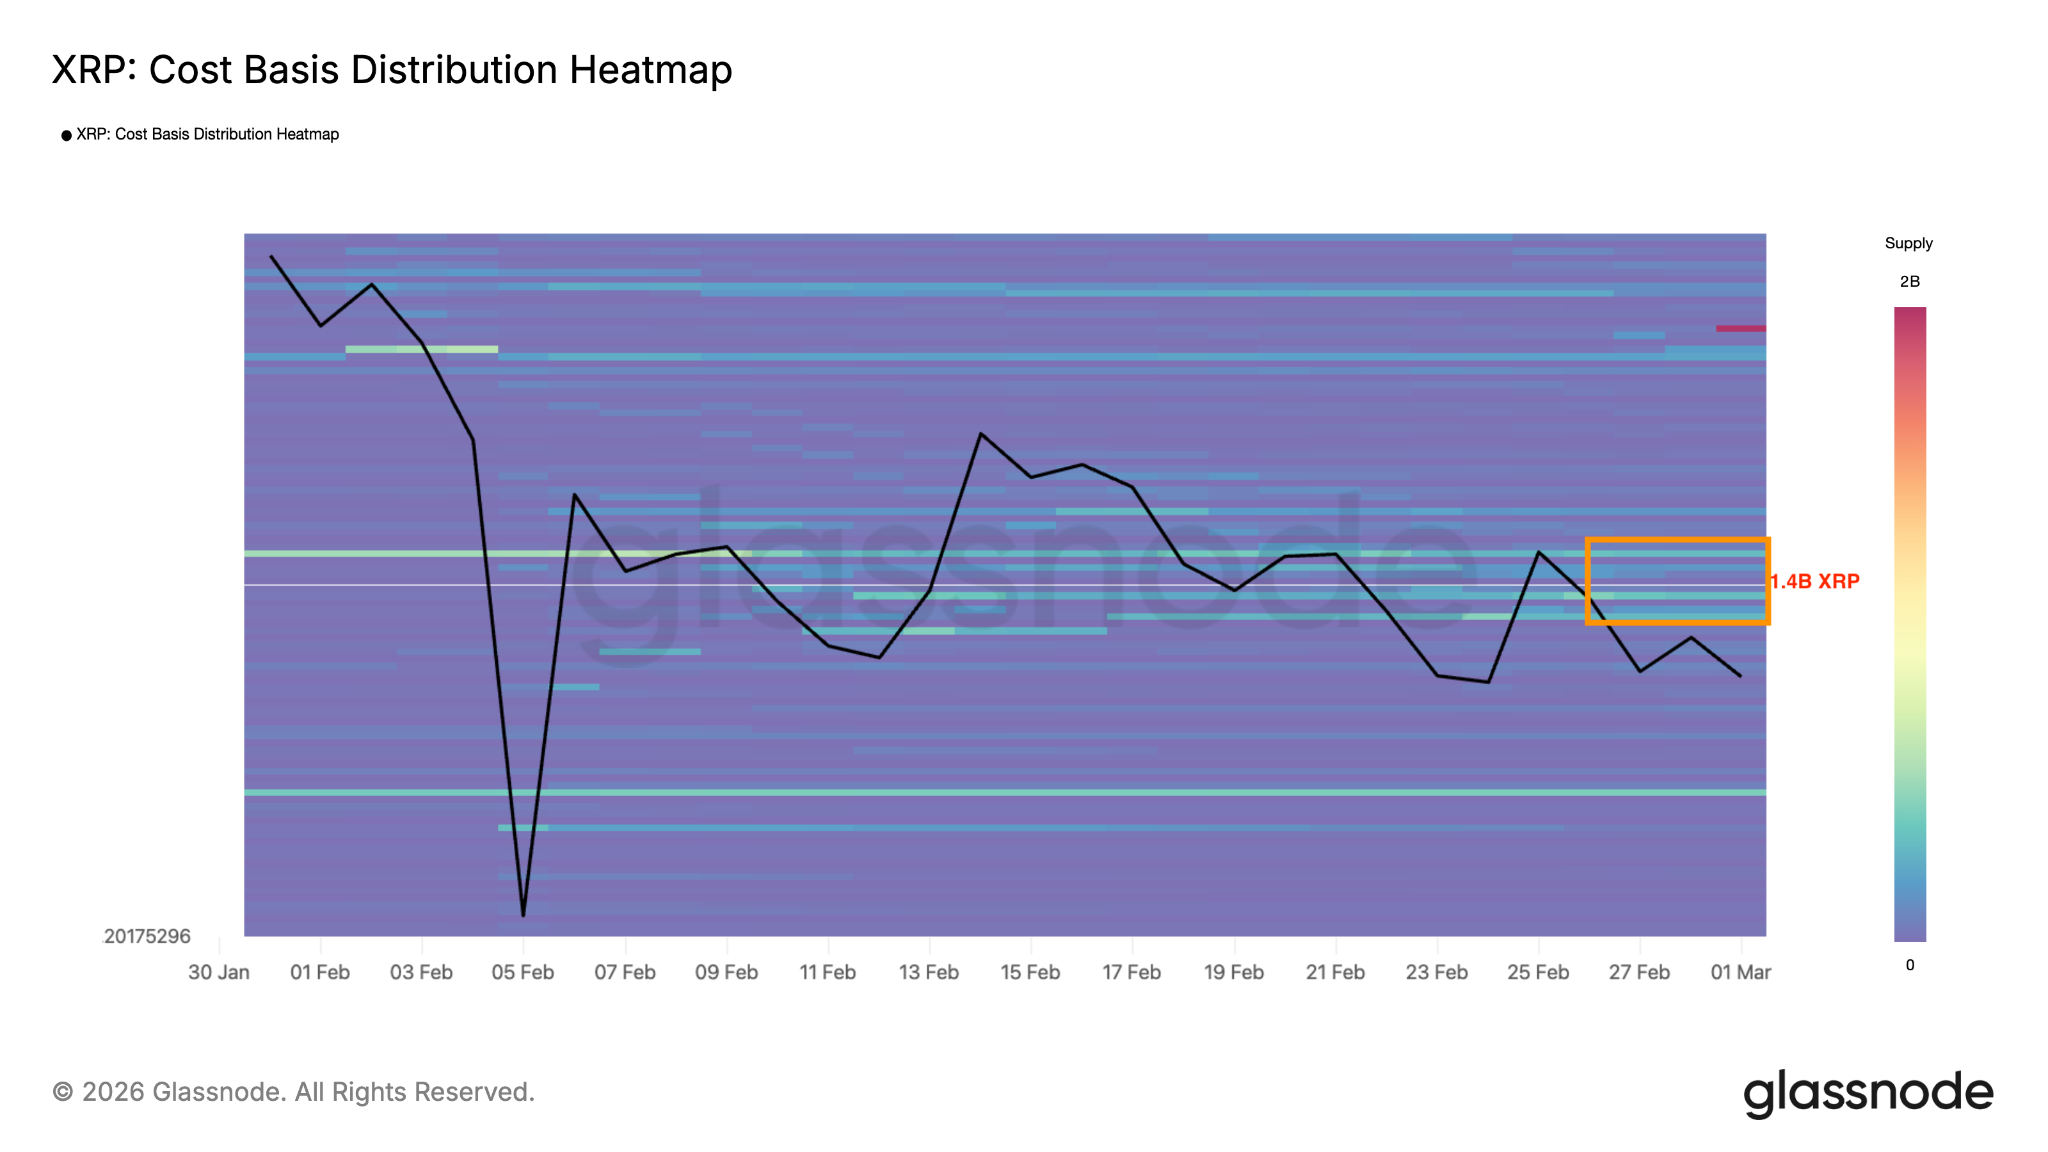
XRP’s 13% rally to $1.43 between Saturday and Sunday ran into a resistance wall at $1.39-$1.43, causing it to retrace to the current price of $1.34.
The cost-basis distribution heatmap shows that a large cluster of supply is within this area, where nearly 1.48 billion XRP were acquired over the last 30 days. This marks an area of stiff resistance for XRP, limiting upside potential.

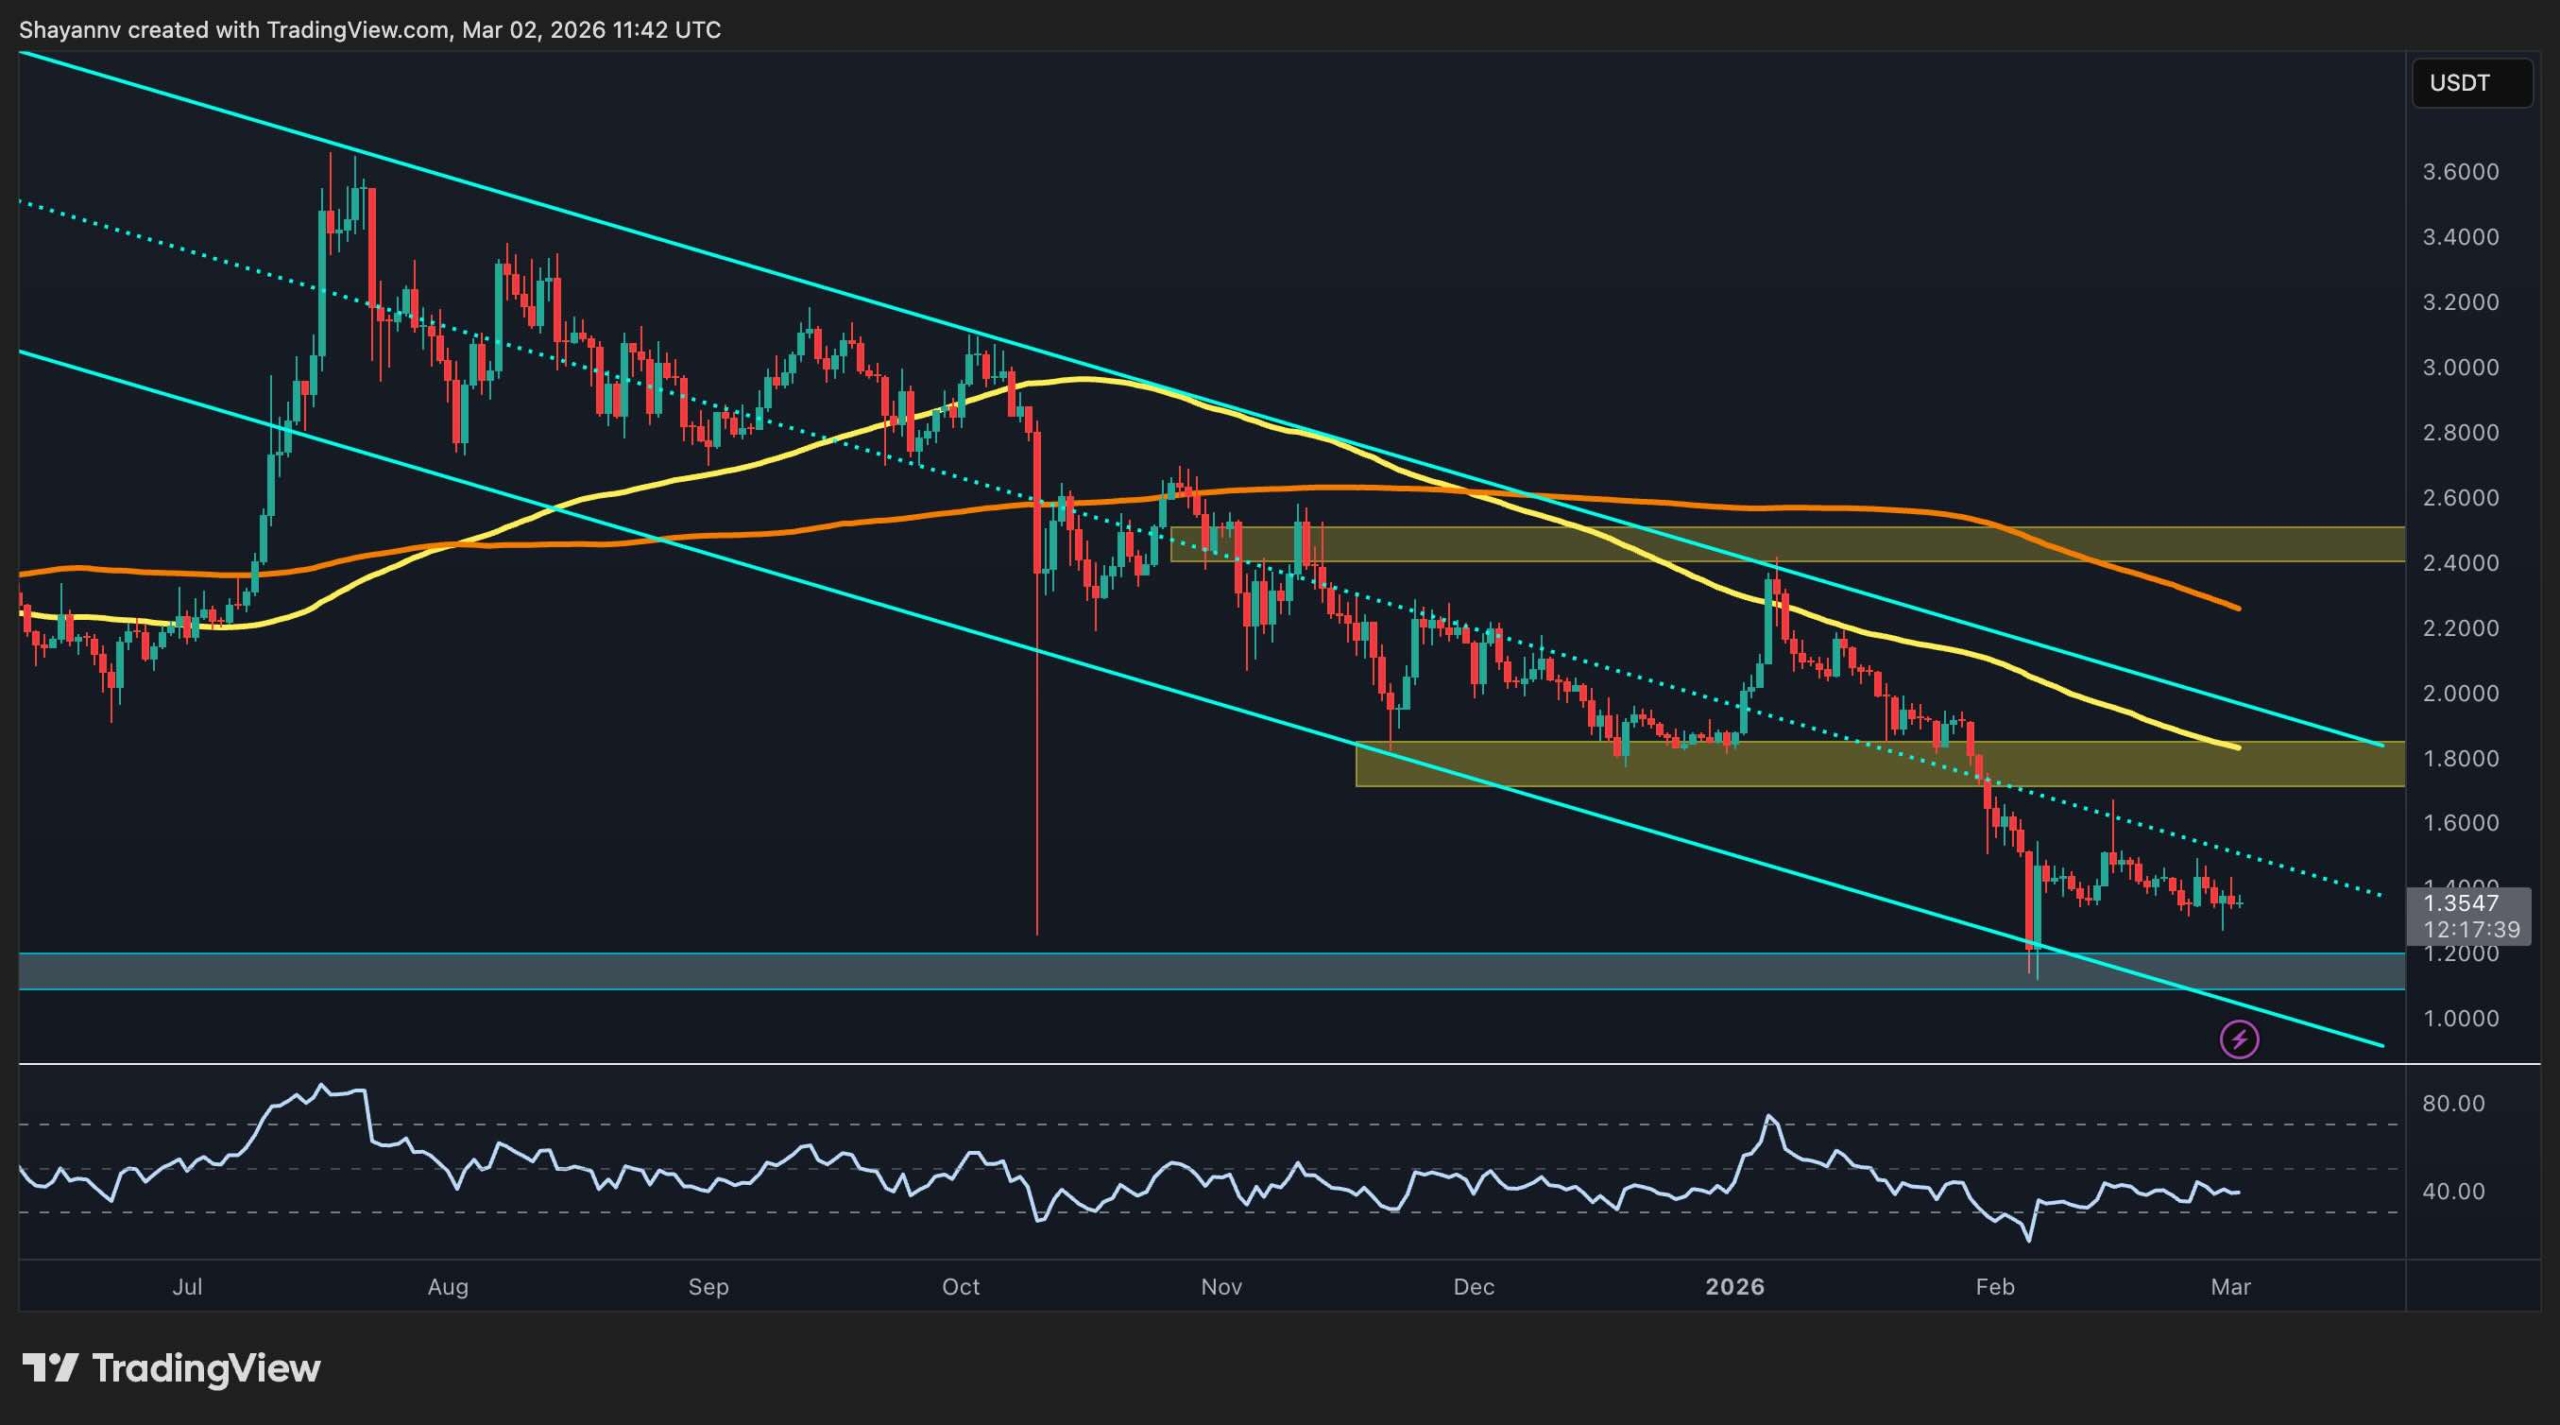
The daily XRP price chart below shows that this area coincides with the upper trend line of a symmetrical triangle, which has suppressed the price since Feb. 1.
Related: XRPL Foundation patches ‘critical’ flaw that almost made it to mainnet
The XRP/USD pair is trading below the lower trend line of the triangle at $1.35. A daily candlestick close below this level would validate the symmetrical triangle, clearing the path for a deeper correction.
The measured target of the prevailing chart pattern, calculated by adding the triangle’s height to the breakout point, is $0.95, about 29% below the current level.

As Cointelegraph reported, a break and close below the lower boundary of a falling channel at $1.20 puts the Feb. 6 low of $1.11 at risk of breaking down. XRP may then tumble to the psychological support at $1.
Analyst BitGuru commented on the support level at $1.20-$1.22, saying:
“If this base holds and buyers step in, a rebound toward $1.80–$2.20 could happen quickly, signaling the start of a recovery move.”

Meanwhile, the two-day chart also puts a drop to $0.80 in play, fueled by selling from whales.
XRP supply on exchanges rises
Over the past week, more than 472 million XRP, worth about $652 million, were transferred to Binance, marking the largest inflow to exchanges in February, according to data resource CryptoQuant.
The transfer of tokens to exchanges often signals a potential willingness to sell or at least to position liquidity closer to the market.
“Such inflows typically reflect a more defensive posture from investors holding XRP,” CryptoQuant analyst Darkfost said in a QuickTake note on Monday, adding:
“When the amount of flows like this are recorded, they can create the conditions for a sudden wave of selling pressure capable of impacting price action in the short term.”

As a result, XRP balance on Binance has grown to 2.73 billion tokens from 2.55 billion in mid-February. This represents a total increase of about 180 million (+7%) in less than three weeks.

Increasing XRP supply on exchanges is a classic bearish signal that can outpace demand, increasing sell-pressure.
This article does not contain investment advice or recommendations. Every investment and trading move involves risk, and readers should conduct their own research when making a decision. While we strive to provide accurate and timely information, Cointelegraph does not guarantee the accuracy, completeness, or reliability of any information in this article. This article may contain forward-looking statements that are subject to risks and uncertainties. Cointelegraph will not be liable for any loss or damage arising from your reliance on this information.
Crypto World
Nvidia Commits $2 Billion Investment to Lumentum (LITE) in Major AI Infrastructure Deal

TLDR
- Nvidia commits $2 billion capital investment in Lumentum alongside a multibillion-dollar agreement to purchase advanced laser technology.
- LITE shares climbed 7.6% during premarket hours Monday after the partnership was revealed.
- Lumentum serves as the exclusive laser provider for Nvidia’s SpectrumX and QuantumX AI networking equipment.
- Stifel analysts elevated their LITE price target from $480 to $800 while reaffirming their Buy recommendation.
- LITE shares have skyrocketed approximately 897% during the past 12 months, approaching the 52-week peak of $765.
Nvidia revealed a significant $2 billion capital commitment to Lumentum Holdings (LITE) on Monday, accompanied by a multibillion-dollar agreement to procure advanced laser technology components.
This strategic partnership represents Nvidia’s expanded effort to develop optical networking infrastructure critical for artificial intelligence systems.
The arrangement is structured as nonexclusive, providing Nvidia with preferential access to future production capacity for sophisticated laser components manufactured by Lumentum.
LITE shares surged 7.6% during premarket sessions. Trading later on Monday showed the stock elevated approximately 4.9%.
Shares currently trade close to the 52-week peak of $765, representing a remarkable climb of nearly 897% over the previous 12-month period.
Lumentum maintains an exclusive role within Nvidia’s manufacturing ecosystem. The company serves as the singular provider of laser components utilized in Nvidia’s SpectrumX and QuantumX AI networking platforms, which employ co-packaged optics technology — an innovative approach that positions optical components directly adjacent to semiconductor chips.
Nvidia’s $2 billion capital injection will fuel Lumentum’s research initiatives, expand manufacturing capabilities, and support ongoing operations. A portion of these funds will be allocated to constructing a new production facility on U.S. soil.
“Optical interconnects and advanced package integration are foundational to the next phase of AI infrastructure, as they unlock ultrahigh-bandwidth, energy-efficient connectivity across AI factories,” Nvidia said in a statement.
Analyst Upgrades Follow the News
Stifel elevated its LITE price objective to $800 from $480 on Monday, maintaining its Buy recommendation. The investment firm indicated it is bringing its projections into closer alignment with broader market consensus.
Stifel highlighted the recent certification of Lumentum EML laser technology at Fabrinet and Nvidia’s networking division performance as encouraging indicators for Lumentum’s immediate business prospects.
The investment firm anticipates networking requirements within AI infrastructure deployments will expand significantly throughout coming years, propelled by demand from agentic artificial intelligence applications and reasoning-centric network architectures.
Based on InvestingPro information, 18 financial analysts have adjusted their earnings projections upward for the forthcoming reporting period.
Stifel acknowledged, however, that valuation analysis indicates the stock price may exceed fundamental value at present trading levels.
Strong Recent Earnings Add to the Case
Lumentum additionally delivered robust fiscal second-quarter 2026 financial results, surpassing Wall Street consensus projections for both revenue generation and earnings per share metrics.
The company’s forward guidance for the third quarter substantially exceeded market analyst expectations.
In response to these results, Needham elevated its price objective to $550, Rosenblatt boosted its target to $580, and Stifel had previously increased its target to $480 — all firms maintained Buy recommendations.
LITE stock value has approximately doubled since Barron’s published favorable coverage of the company during early January, identifying Nvidia’s implementation of co-packaged optics technology as a significant growth catalyst.
The Nvidia investment partnership and purchasing commitment were publicly announced Monday, March 2, 2026.

Bitcoin (BTC) acts as a barometer for global fear, but the latest geopolitical flare-up, which has many fearing for WW3, has failed to break the asset’s bullish prospects.
While headlines scream conflict, Bitcoin is holding the $60,000 line, eyeing a liquidity-driven breakout rather than a capitulation event.
Traders are now pricing in resilience, looking past the initial volatility to the underlying supply mechanics that favor the bulls.
The market climaxed with a sharp dip near $63,000 over the weekend before buyers stepped in, rejecting lower lows.
This price action suggests the market is desensitizing to headline risk, shifting focus back to the monetary drivers that typically fuel Q4 rallies. It is a clash of narratives: geopolitical uncertainty versus undeniable on-chain strength.
- Bitcoin Exchange Reserves have dropped to levels not seen since 2018, creating a significant supply shock as demand creates a floor.
- Spot BTC ETF Inflows are absorbing retail panic selling, with institutional players treating dips as accumulation opportunities.
- Global Liquidity M2 is expanding again, historically a primary driver for crypto asset repricing regardless of news cycles.
Indicator 1: Bitcoin Exchange Reserves Signal Supply Shock
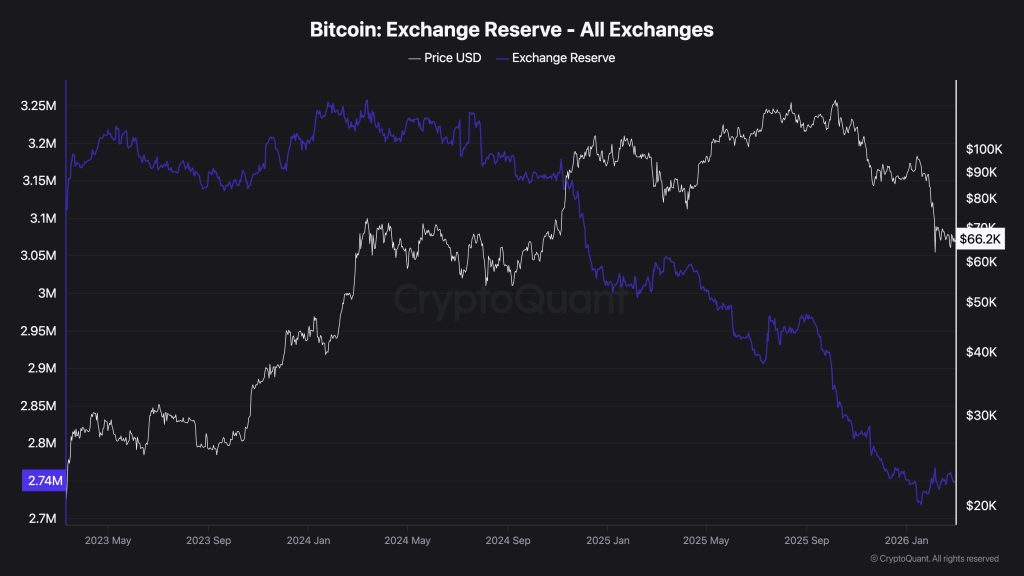
The most critical on-chain metric currently is the rapid depletion of Bitcoin Exchange Reserves. According to data from CryptoQuant, reserves have fallen to approximately 2.6 million BTC, the lowest level since 2018. This is a structural supply squeeze that cannot be ignored.

When coins leave exchanges, they move to cold storage or custody solutions, effectively removing them from the immediate sellable supply.
The implication is straightforward: fewer coins available for sale means it takes less buy volume to push prices higher. In previous cycles, sharp declines in exchange balances often preceded supply shock rallies.
This drain on liquidity suggests that while weak hands are selling into headline fear, long-term holders are moving assets off the ledger. We are witnessing a transfer of wealth from impatient retail traders to high-conviction entities who understand the scarcity mechanics of the halving year.
Discover: The best crypto to diversify your portfolio with
Indicator 2: Bitcoin (BTC) ETF Inflows vs. Spot Selling
Institutional demand continues to act as a massive buffer against spot market volatility. Despite the bearish sentiment on social media, Spot BTC ETF Inflows tell a different story.
Recent weeks have seen net inflows effectively neutralizing the selling pressure from short-term holders, with the last week generated net inflows of $787.3 million, according to data by SoSoValue.
So, funds like BlackRock’s IBIT continue to attract capital even as price action chops sideways. This divergence of falling price against rising inflows is a classic accumulation signal. Institutional accumulation is not slowing down; it is accelerating during dips.
Adding to this institutional bedrock, major financial players are deepening their infrastructure. Morgan Stanley has moved to hold client crypto directly, signaling that the smart money thesis remains focused on long-term adoption rather than short-term geopolitical noise.
Indicator 3: How Bitcoin is Breaking the Downtrend Despite WW3 Fears
Technically, Bitcoin is respecting critical levels. The weekend dip found support before reaching the psychological $60,000 barrier, a level many traders had eyed for aggressive longs.
Trader CrypNuevo noted on X that a trip to anywhere between $60,000 and $61,000 would be a prime long entry, but the market front-ran that level, showing eagerness to buy.
So my strategy for this week is: — CrypNuevo
Wait for Monday stock market opening reaction:
• If it's a bloodbath (unlikely imo), then I'll long Bitcoin around $61k-$60k ahead of de-escalation talk news.
• If it's a slight decline, sideways or pump, I won't long until later in the week.
 (@CrypNuevo) March 1, 2026
A clean break above $70,000 would invalidate the downtrending structure that has plagued the chart since March.
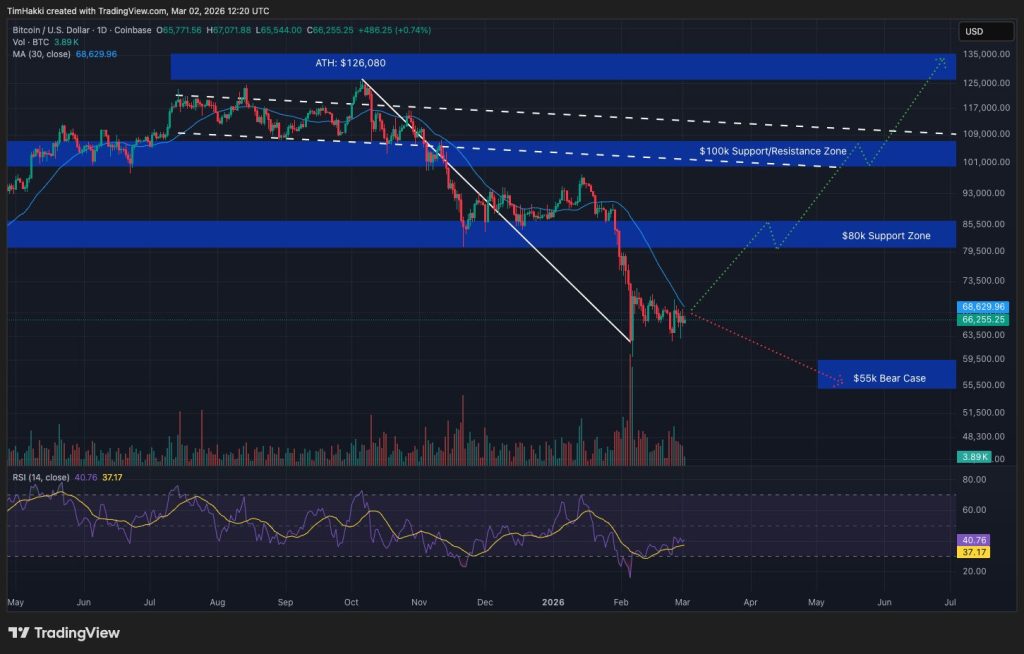
Support at $60,000 is the line in the sand; lose that, and the conversation shifts to $55,000 or lower. If Bitcoin can hold the line, the path back to six figures by Summer remains open.
Indicator 4: Global Liquidity and Central Bank Easing
Bitcoin is, above all else, a liquidity sponge. The current expansion of Global Liquidity M2, a measure of global liquidity that takes into account cash, checking and savings deposits, money market securities, and other near-cash assets, is the macro tailwind that bearish traders are overlooking.
As central banks from the ECB to the Fed signal or enact rate cuts, the cost of capital decreases, forcing money out of risk-free assets and into growth vehicles.
Historically, Bitcoin’s parabolic runs align perfectly with cycles of M2 expansion. We are currently in the early stages of a global easing cycle. While inflation data may cause temporary pauses in the Fed’s roadmap, the broader trend is clear: money printers are warming up.
Given the historic lag between M2 liquidity expansion cycles and Bitcoin bull markets, the injections hitting the system now will likely reflect in asset prices in Q4 2024 and Q1 2025.
Traders betting on a crash are effectively betting against the central bank liquidity cycle, a wager that rarely pays off in the crypto markets.
Discover: The best crypto to buy now
Indicator 5: Bitcoin Sees Geopolitical Resilience Despite WW3 Fears
The market’s reaction to recent Middle East tensions reinforces the “digital gold” narrative, albeit with high beta volatility.
While the initial reaction was a sell-off, Bitcoin rebounded swiftly after the shock, erasing nearly all losses within 48 hours. This V-shaped recovery is a hallmark of a resilient bull market structure.
Analyst consensus is shifting away from “World War Three” scenarios toward a contained conflict narrative, limiting the downside risk for risk assets.
However, the connection between energy prices and crypto remains tight. As oil prices react to Iran tensions, inflation expectations could tick up, complicating the Fed’s pivot. Yet, Bitcoin has shrugged off this correlation for now, trading more on idiosyncratic crypto flows than petrodollar dynamics.
Data from CoinGlass shows that the initial dip flushed out over-leveraged longs, resetting open interest to healthier levels. The market is now lighter, cleaner, and ready for organic price discovery without the weight of excessive leverage.
Ultimately, with institutional accumulation quietly putting a floor under price and Bitcoin Exchange Reserves draining, the path of least resistance appears to be upwards despite WW3 fears. The Bitcoin market has already priced in the conflict shock. Now it waits for the liquidity surge.
The post Bitcoin and WW3: 5 Key Indicators as BTC Eyes Global Liquidity Surge appeared first on Cryptonews.
Crypto World
Bitcoin miner turned Ethereum treasury firm stakes over $6B in ETH as BMNR shares slide and ether dips.


Bitmine Immersion Technologies (BMNR) on Monday reported purchasing nearly 51,000 more ETH tokens last week, increasing its holdings to 4.474 million.
“In the midst of this ‘mini crypto winter,’ our focus continues to be on methodically executing our treasury strategy and steadily acquiring ETH and in turn, optimizing the yield on our ETH holdings,” said Chairman Tom Lee.
The company said it now has 3,040,483 ETH staked, worth about $6 billion at current prices. Lee said annualized staking revenue stands at $172 million. At full scale, staking rewards could reach $253 million annually based on a 2.86% yield over the last seven days, Lee continued.
The company holds 4,473,587 ether (ETH), valued at $1,976 per token, along with 195 bitcoin and $868 million in cash, as well as a $200 million stake in Beast Industries and a $14 million investment in Eightco Holdings. Bitmine said its ether position represents 3.71% of Ethereum’s 120.7 million token supply.
Lee added that the firm is developing its Made in America Validator Network, or MAVAN, a staking platform slated for launch in early 2026. Bitmine said it is working with three staking providers as it builds the network.


Crypto prices are rebounding from their worst weekend levels in early U.S. trading on Monday alongside a sizable bounce in U.S. equity indices.
Roughly one hour into the session, the Nasdaq is down just 0.1% after futures at one point overnight had indicated a plunge of more than 2%. The S&P 500 and DJIA are also posting just very modest losses.
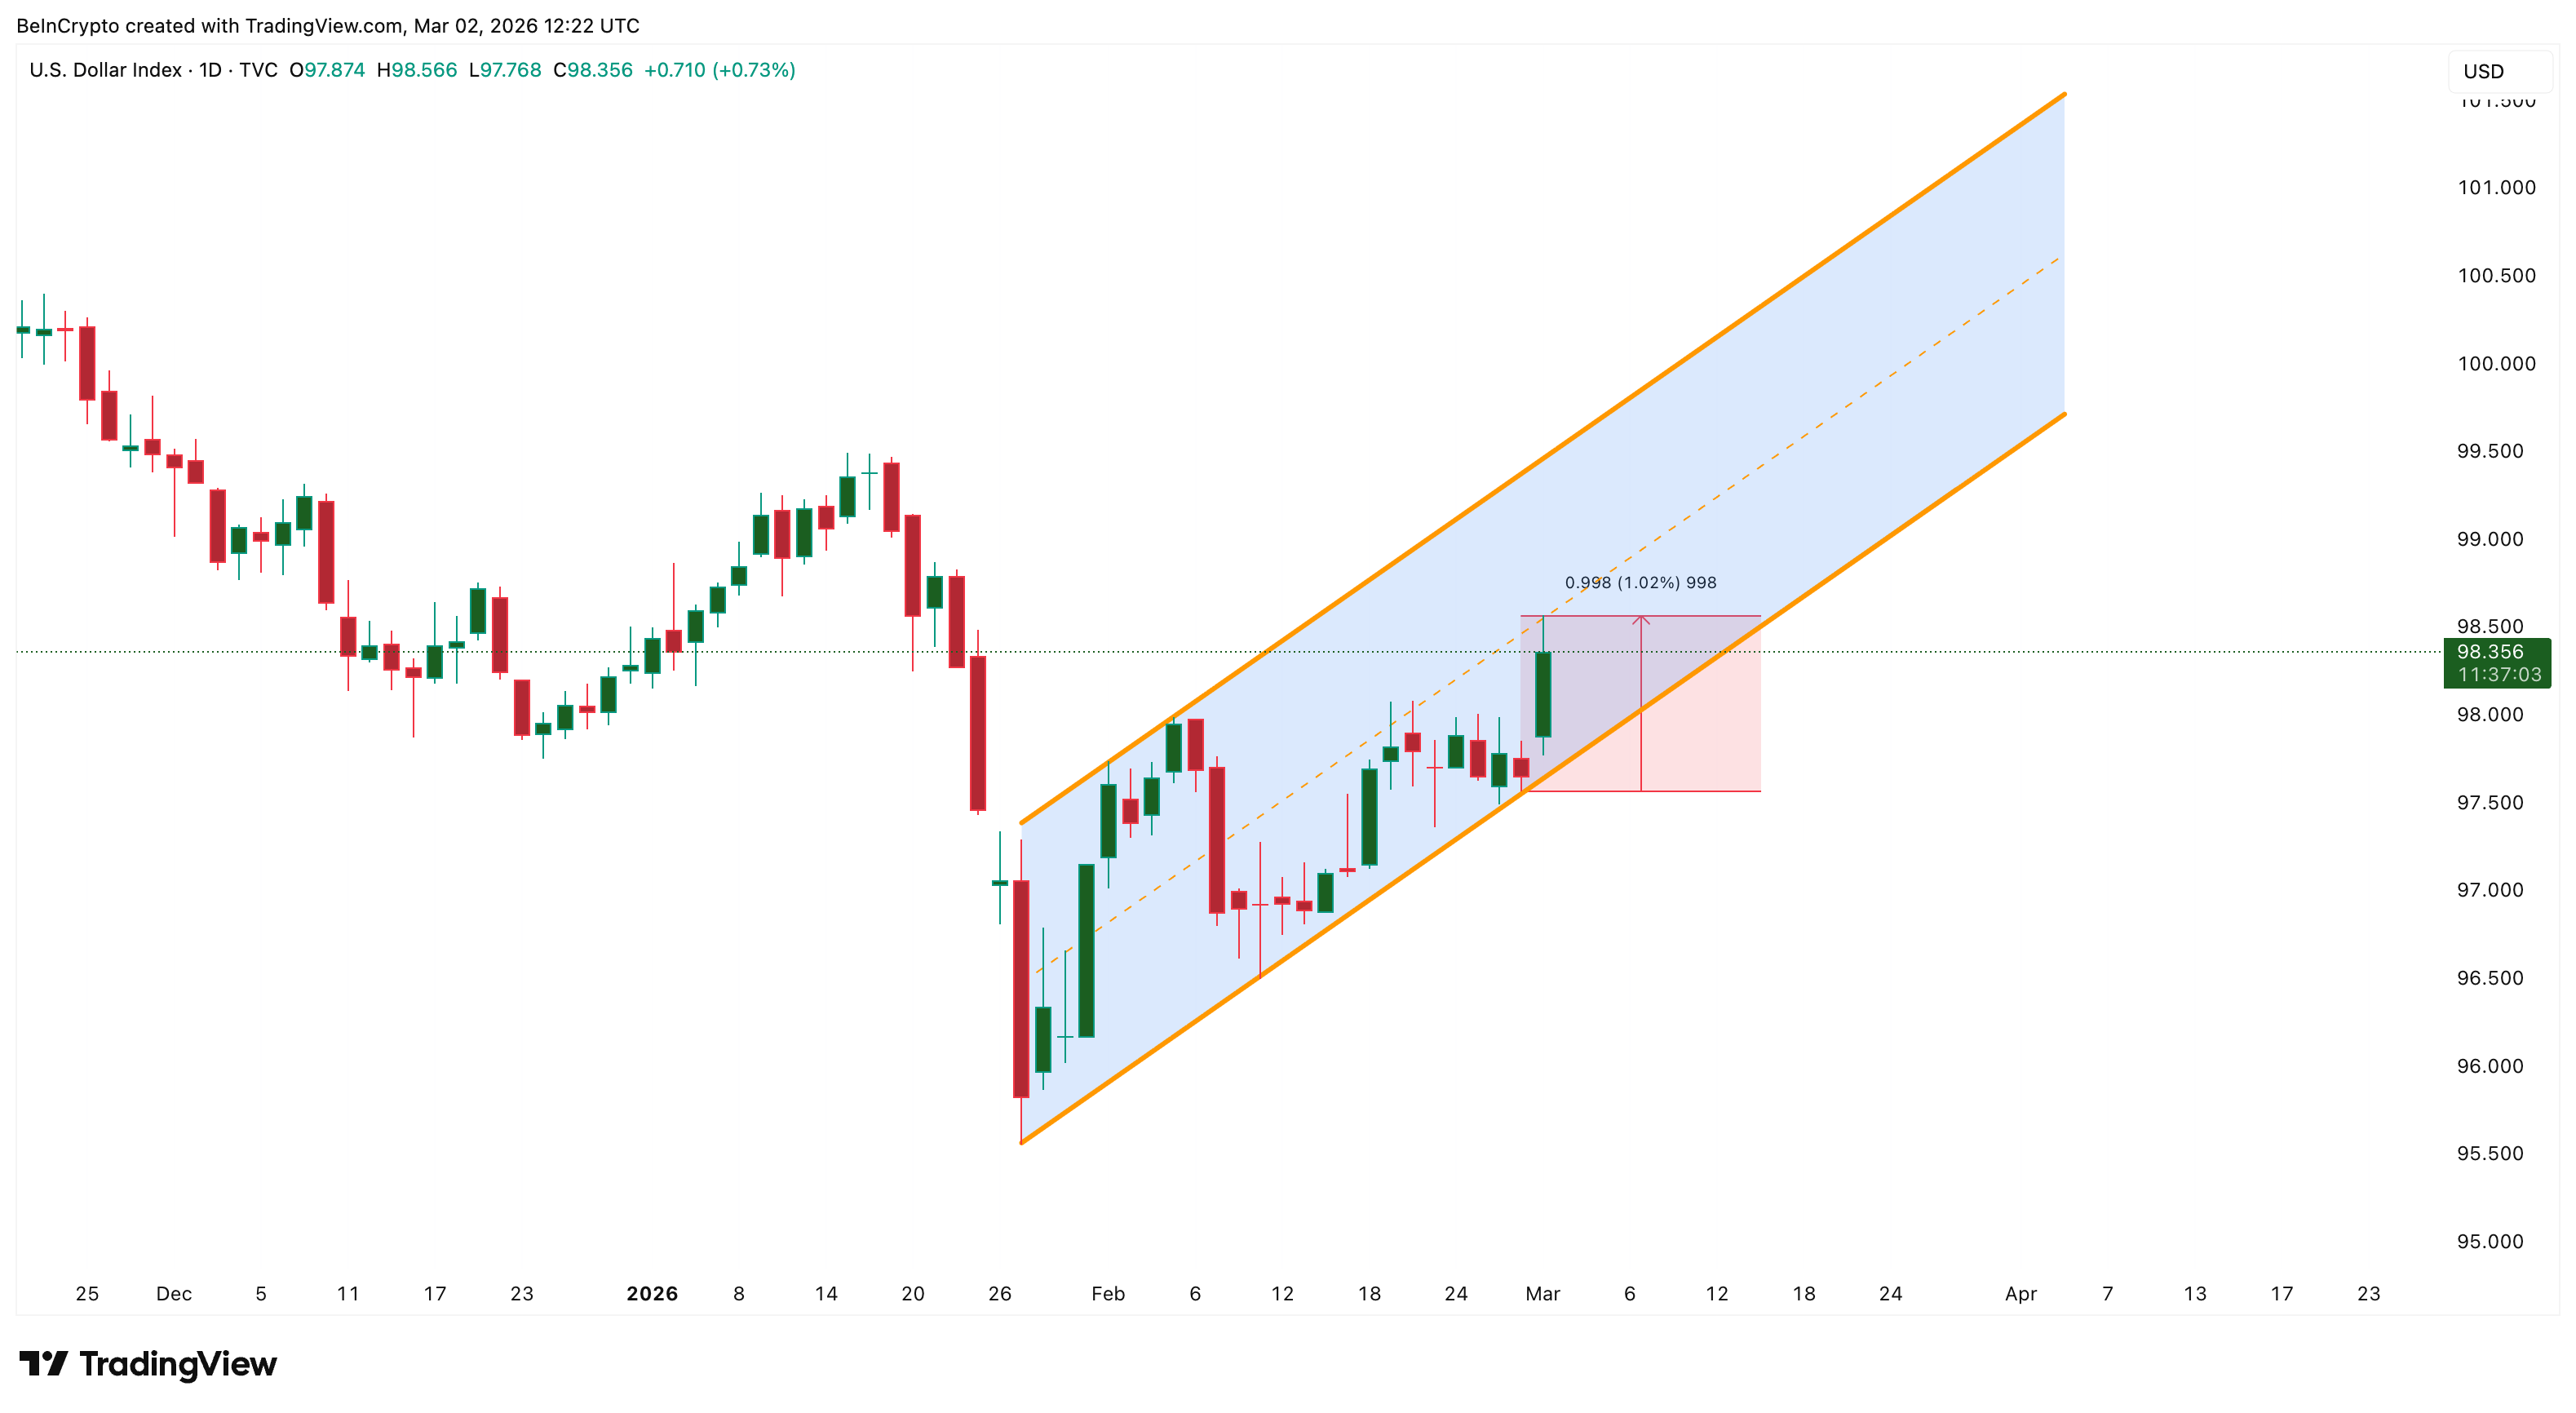
Gold remains higher by 2% and crude oil by 7%. The U.S. dollar index is having one of its strongest sessions in weeks, gaining 1%.
Bitcoin has moved up to $68,600, ahead 2.3% over the past 24 hours. Ether (ETH) is higher by 1.4%, with solana (SOL) and XRP (XRP) up similar amounts.
Crypto-related stocks are posting even larger gains, led by Circle’s (CRCL) 12% advance. Strategy (MSTR) is higher by 6% and Galaxy Digital (GLXY) by 4.7%.
On the macro side, the ISM manufacturing PMI came in at 52.4, for February, marking another month of sector expansion and the first consecutive run of prints above 50 since the fourth quarter of 2022. This follows Friday’s Chicago Business Barometer, which rose to 57.7 in February 2026 from 54 previously and well above expectations of 52.8. The reading signals only the second expansion since November 2023 and reflects the strongest pace of US activity growth since May 2022.
Against the backdrop of conflict in the Middle East, reaccelerating manufacturing activity, hotter-than-expected PPI data last week, and higher oil prices driven by geopolitical tensions, a March rate cut now appears effectively off the table ahead of the Federal Reserve’s March 18 meeting.
Normally, that might be considered a headwind for crypto prices, but it’s quite possible that markets had already priced in tighter than previously expected U.S. monetary policy.
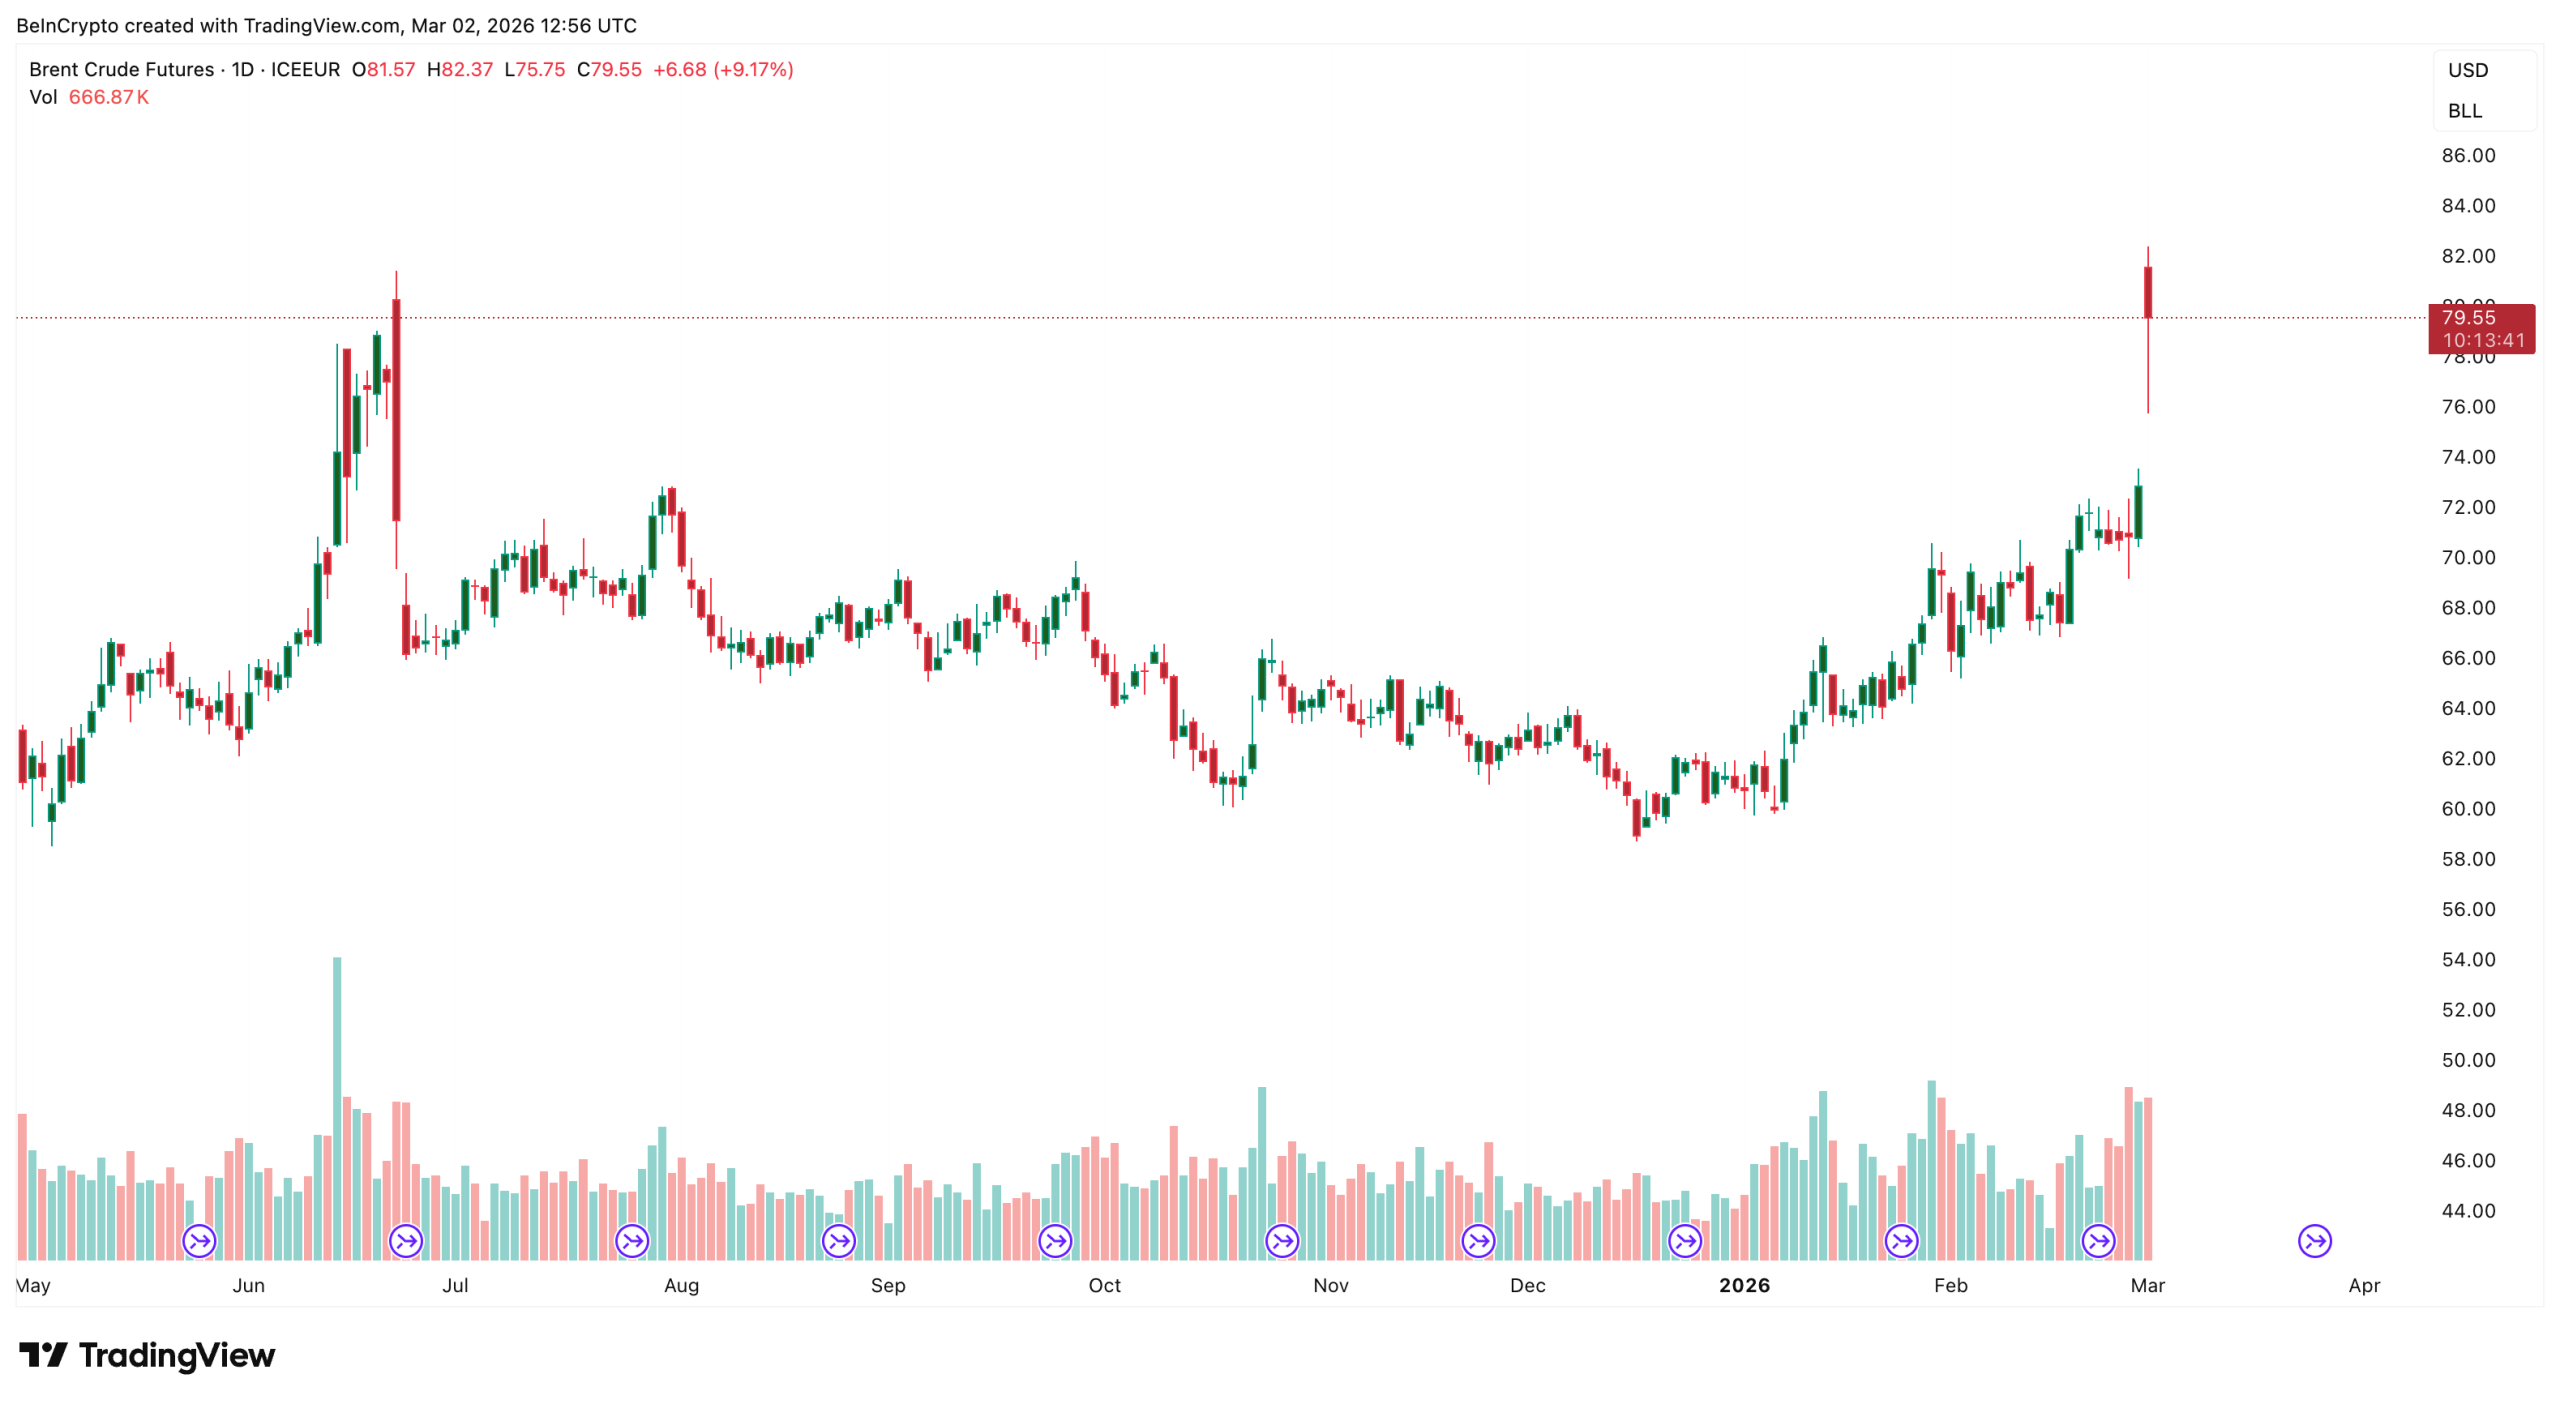
The oil price surged sharply this week after conflict in the Middle East pushed Brent crude futures (ICEEUR:BRN1!) to $82, marking its biggest shock in months. Brent is the global oil benchmark, widely used to price international crude, which makes it the clearest measure of the oil price reaction to geopolitical risk.
The breakout is tracked on the CFD (Contract for Difference) charts, which reflect price structure but not actual positions. However, futures data from ICE Futures Europe confirmed real traders entered the market, validating the oil price surge as both a geopolitical and positioning-driven move.
Oil Price Surge and Rising Dollar Create Early Stress at $82
The oil price jumped from around $72 to $82 after US-Israeli strikes on Iran. The retaliation raised fears of supply disruption through the Strait of Hormuz, a critical route carrying nearly one-fifth of global oil flows. This sudden repricing added a war premium, meaning traders pushed the oil price higher due to expected supply risk rather than immediate shortages.
This shock triggered a gap-up opening in Brent crude oil. Such moves often face early stress because markets tend to retest part of the jump before continuing higher.
That stress appeared near $82, as Brent crude oil corrected to $79.
The latest candle closed red with elevated volume. Volume in red indicates more trading occurred as the oil price corrected post-gap-up, indicating active selling pressure.

At the same time, the US Dollar Index (DXY), which tracks dollar strength against major currencies, has also been rising. Since oil trades globally in dollars, a stronger dollar makes oil more expensive for international buyers. A bearish sign.
But another key indicator shows the full picture. Open interest, often called OI, has risen sharply on Brent futures (ICEEUR:BRN1!). Rising open interest means new traders are entering the market rather than closing positions. This validates the short-term bullish bias.
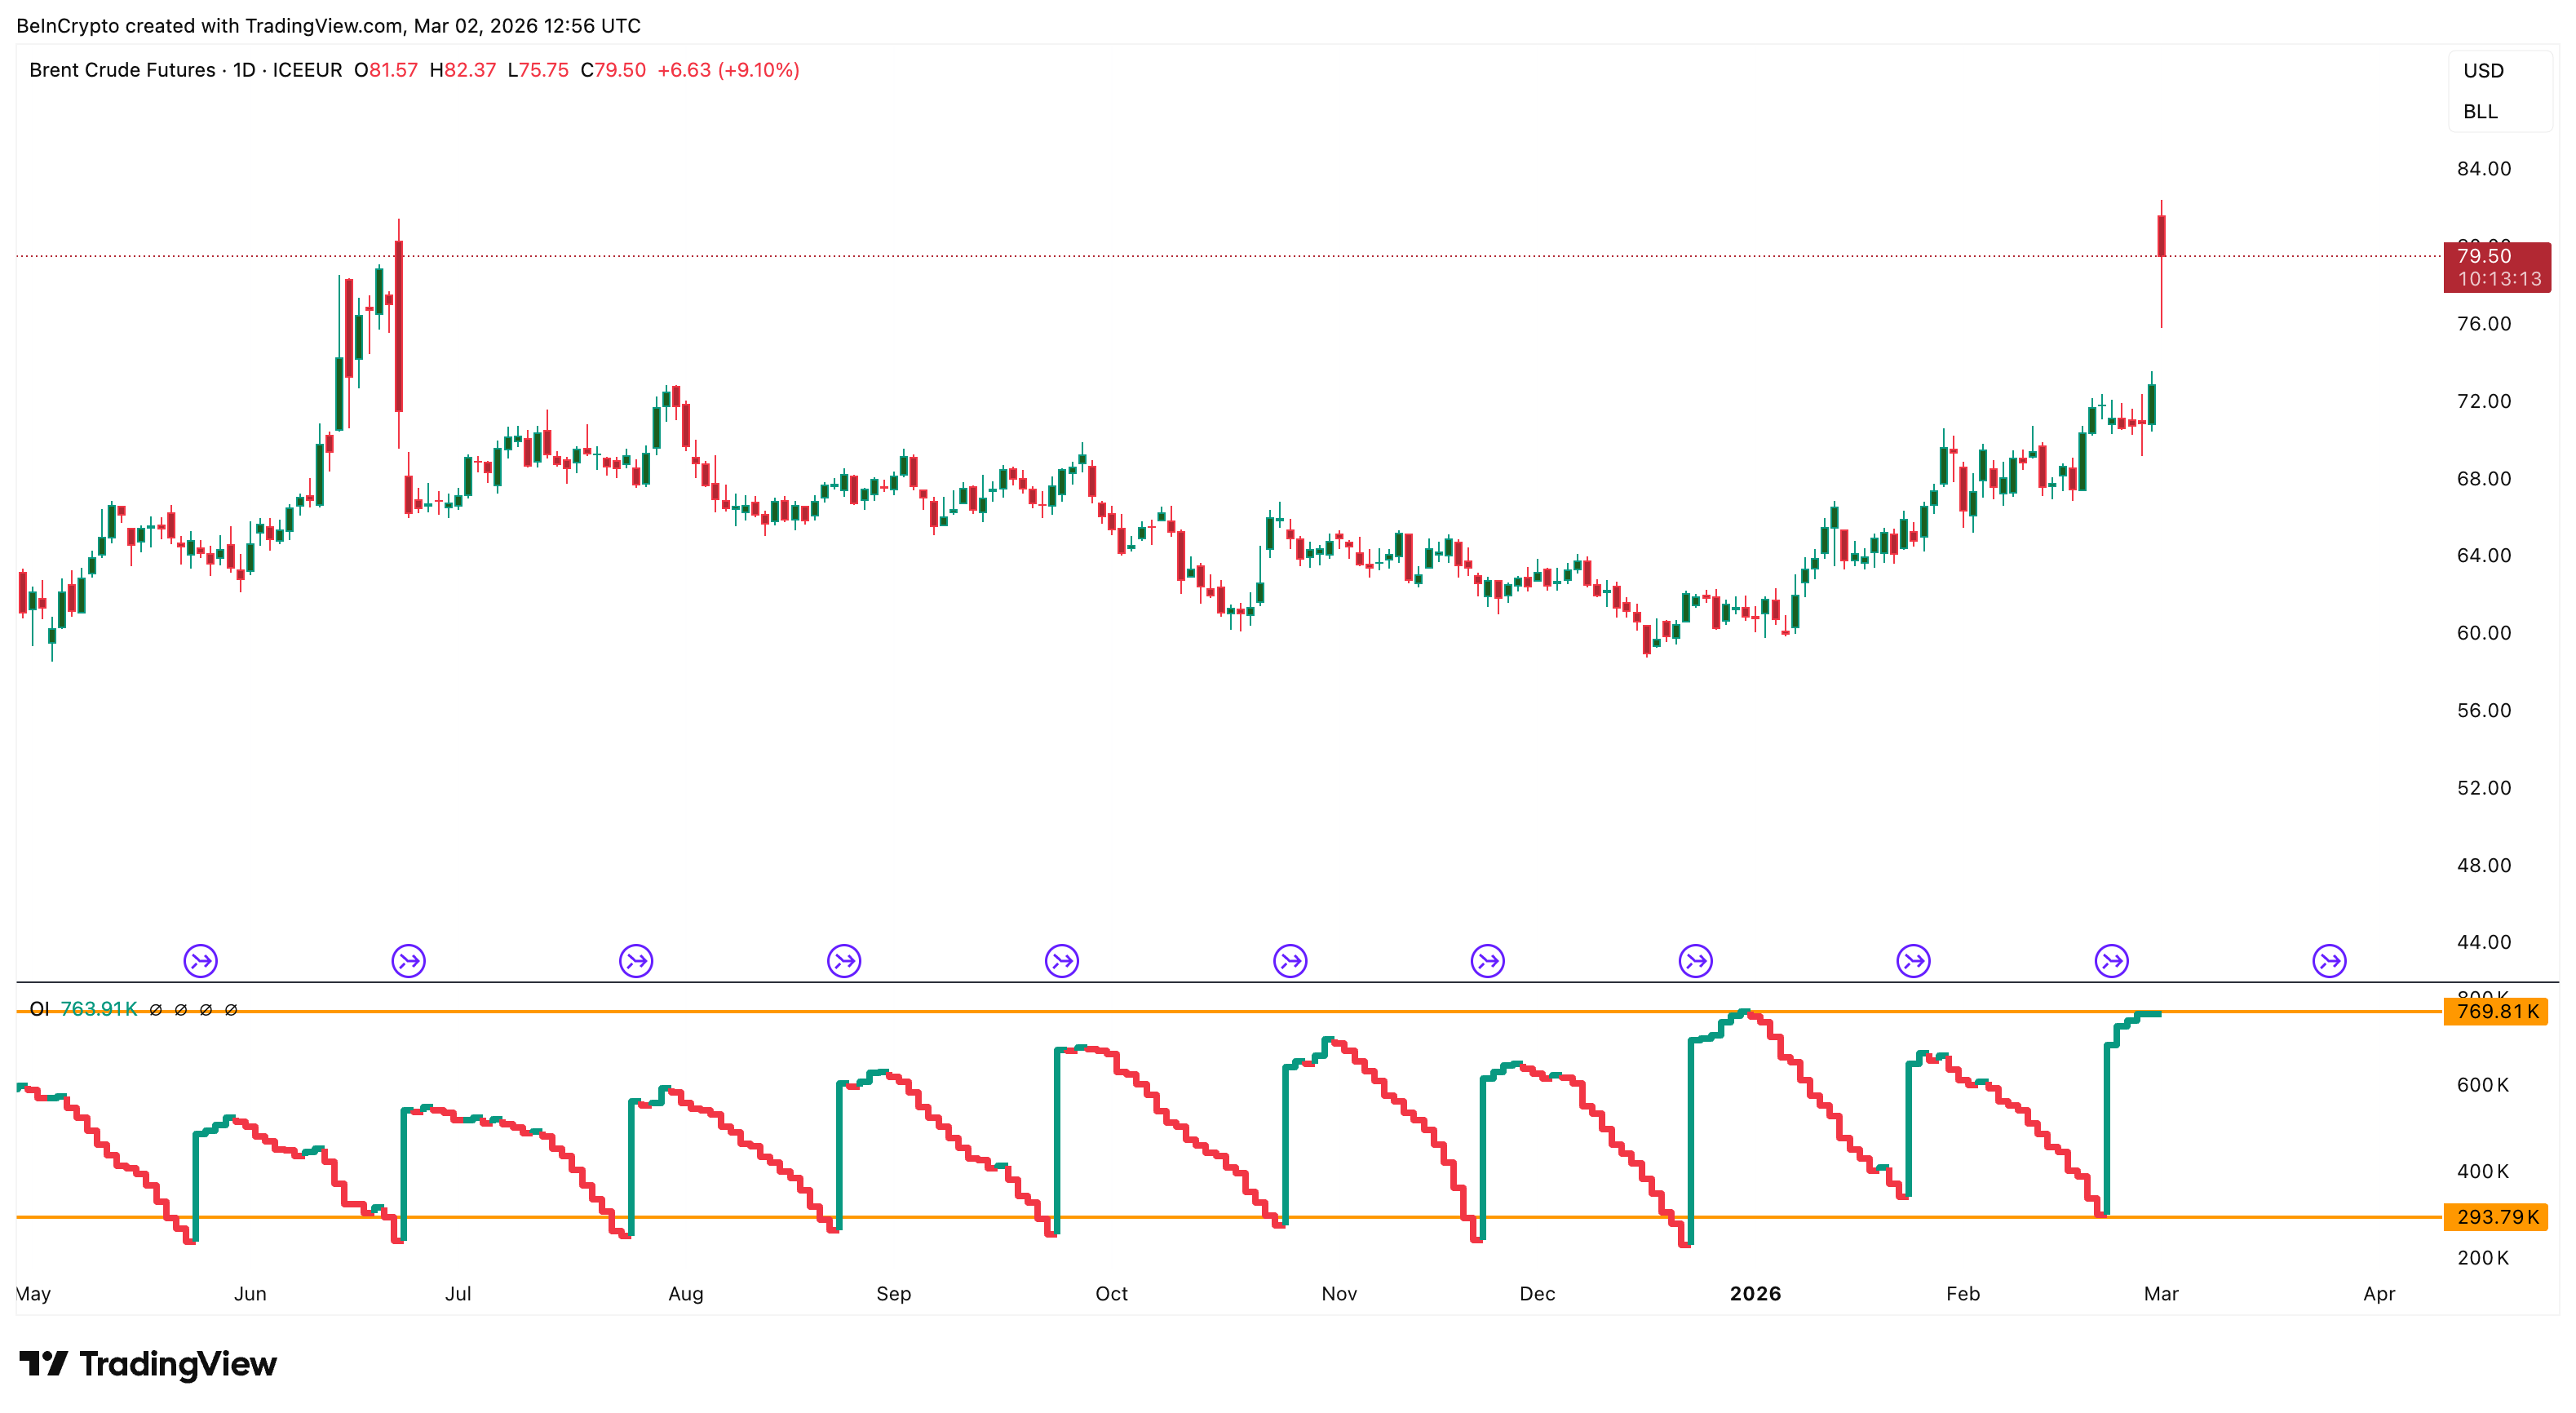
This shows the oil price is not falling due to a lack of interest. Instead, the market is absorbing selling while new positions continue building. However, traders need to keep an eye out for the flattening open interest.
Price rising while open interest is flat means the move is likely driven by short covering, not new buying, so the trend is weaker and may not sustain.
OPEC Supply Increase Adds Future Risk Even as War Drives Current Price
At the same time, OPEC, the Organization of the Petroleum Exporting Countries, announced it would increase production by 206,000 barrels per day starting in April. OPEC is a group of major oil-producing nations that control a large share of global supply.
Normally, a higher supply reduces the oil price because more oil becomes available.
However, the oil price continued rising because war risk affects supply immediately, while OPEC’s production increase happens later. This creates a conflict between short-term supply fears and longer-term supply growth.
The Strait of Hormuz remains central to this risk. Even the possibility of disruption is enough to keep traders cautious and maintain upward pressure on the oil price. This also explains why open interest has started to flatline and why selling pressure emerged after the gap-up opening, as traders remain cautious about chasing the oil price higher while the risk of sudden supply and macro shifts remains elevated.
Futures Positioning Shows Market Is Preparing for a Larger Oil Price Move
Futures positioning shows the oil price breakout is attracting strong participation. The sharp rise in open interest on Brent crude oil futures (ICEEUR: BRN1!), seen earlier, confirms that traders are actively opening new positions as volatility increases.
This positioning trend is spreading beyond traditional markets. Platforms like Aster, a crypto-based derivatives exchange, have launched oil perpetual futures.
The rise in oil trading on crypto platforms shows how widespread the positioning has become. It reflects broad positioning across financial markets.
Key oil price levels are tracked using the Brent crude CFD, while the Brent crude oil Futures are used to track volume and open interest.
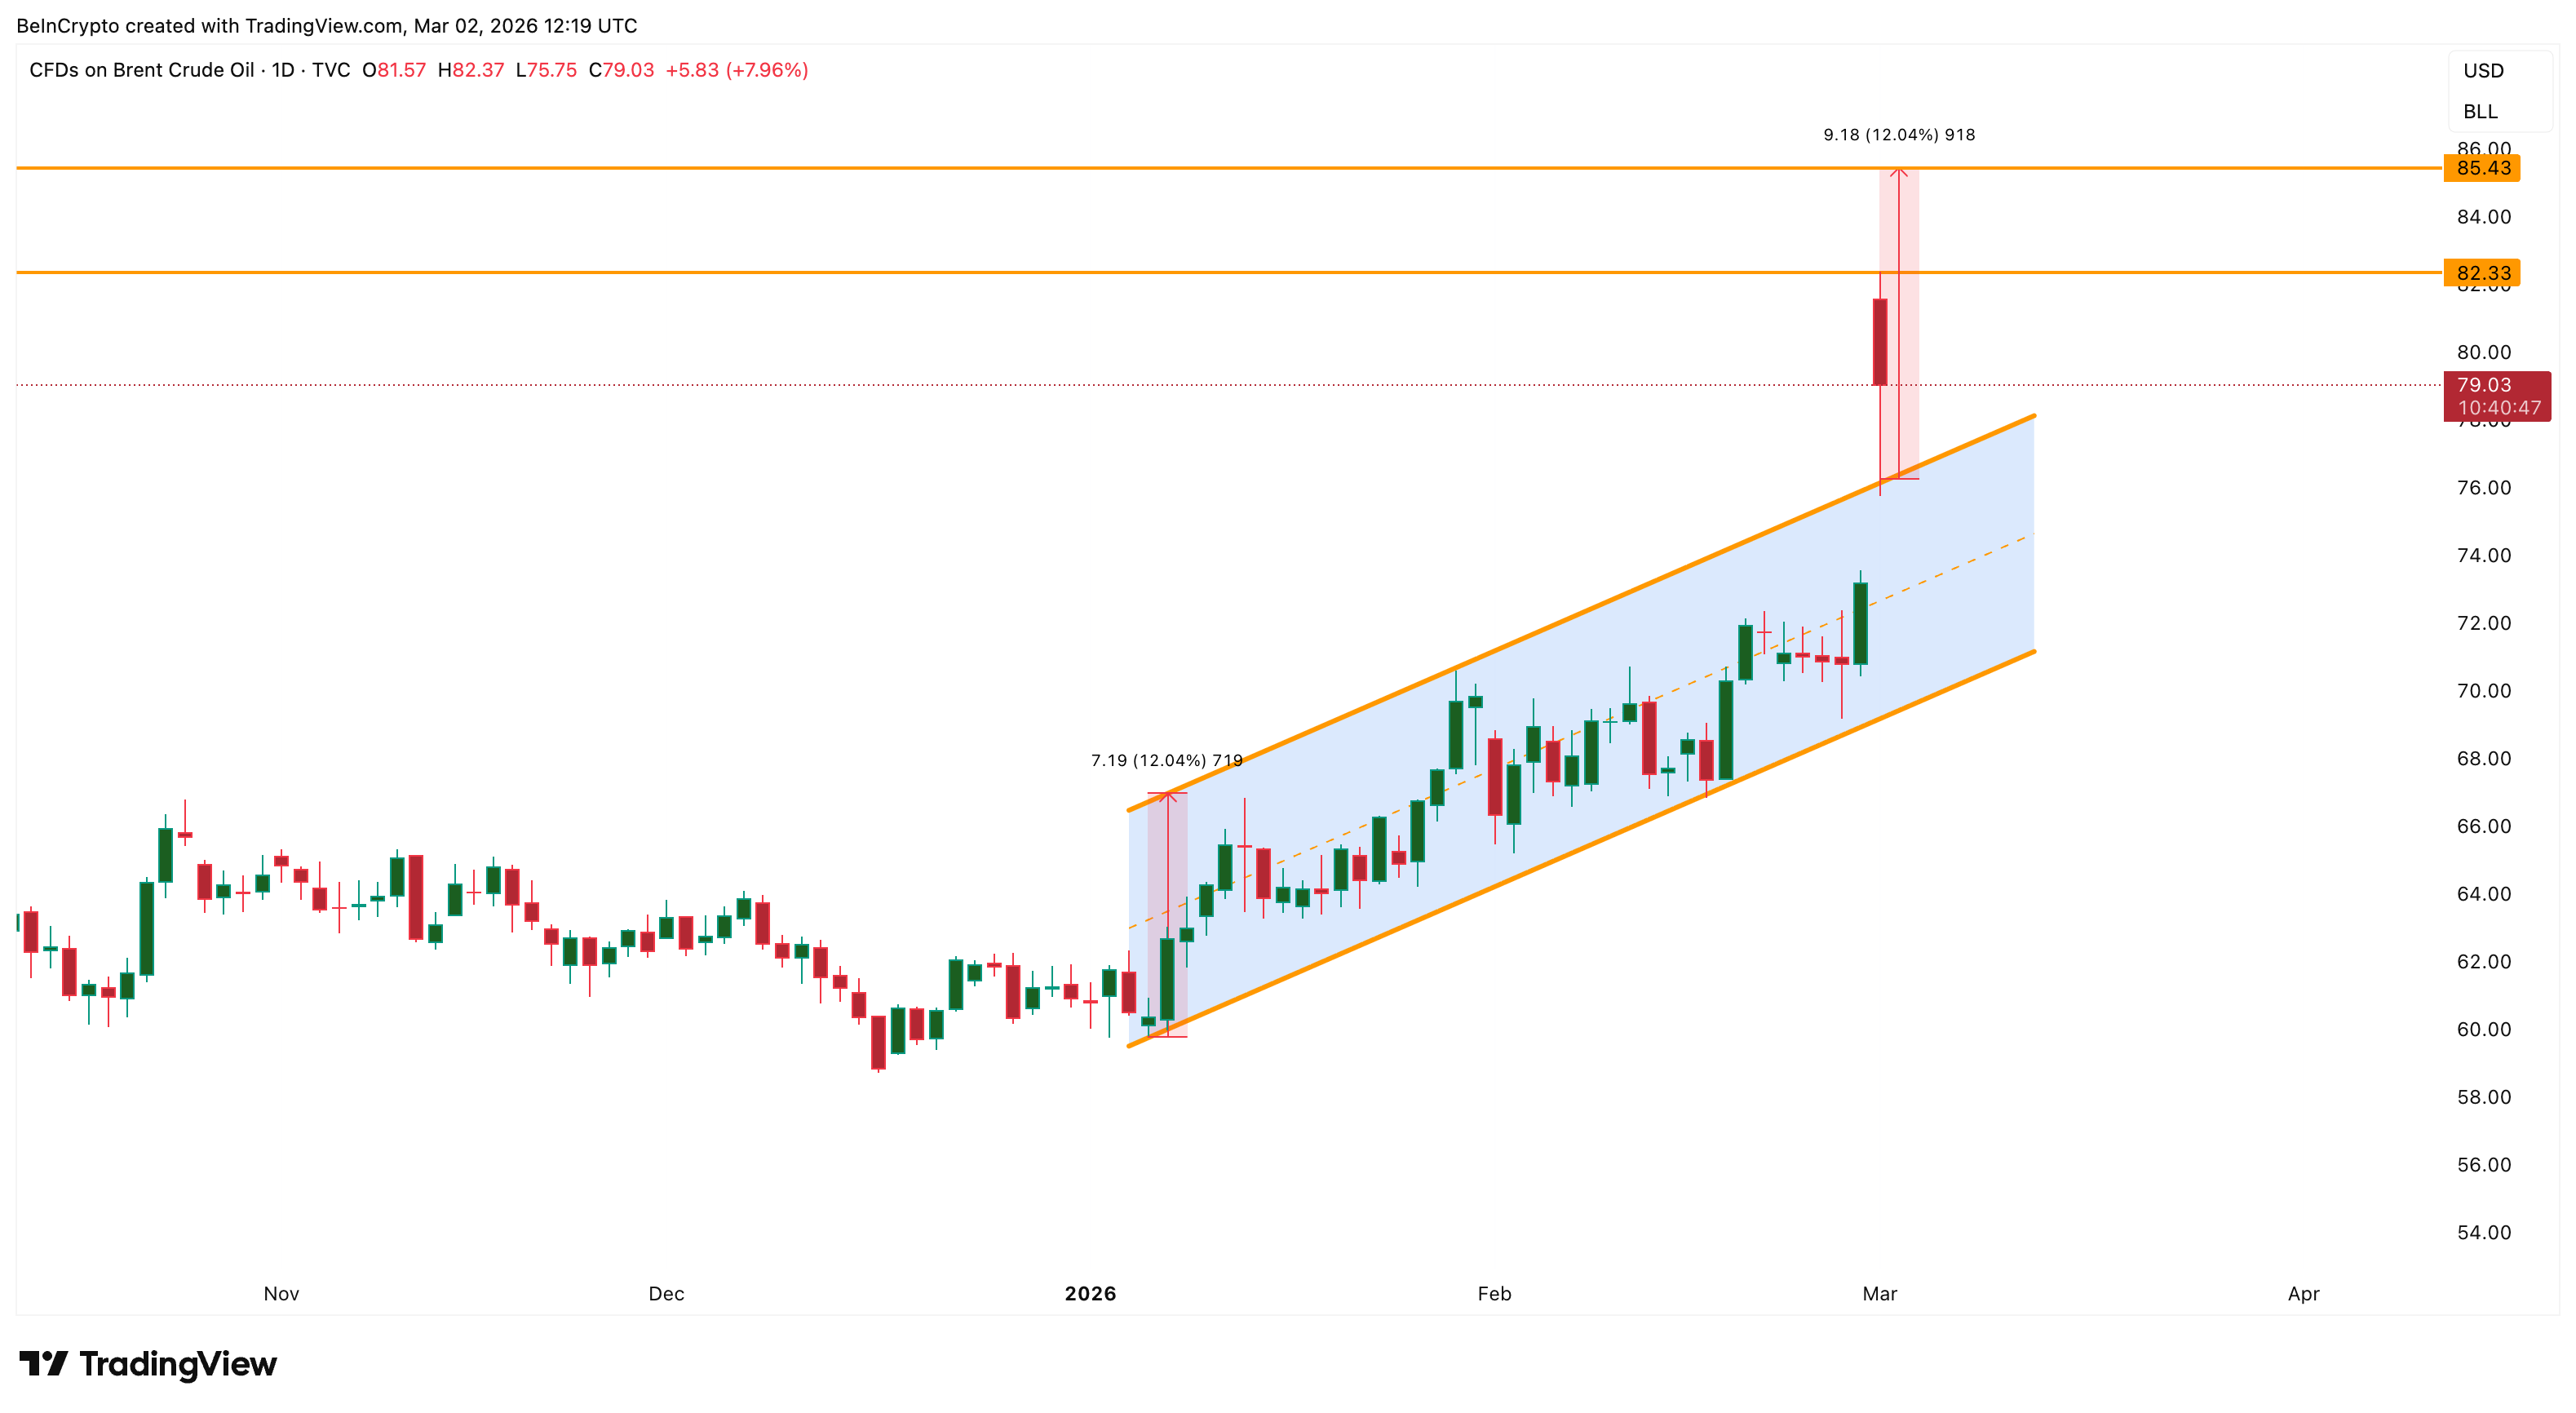
Per the chart, the first resistance remains $82, which aligns with the Fibonacci retracement (mentioned later).
If the oil price breaks above $82, the next target becomes $85, based on the ascending channel breakout projection. Above that, the next resistance levels appear at $93 and $104 if geopolitical risk continues. Adding to this current strength is the Exponential Moving Average (EMA) positioning.
This measures the average price over time while giving more weight to recent data, and recently confirmed a golden crossover where the 50-day EMA crossed above the 200-day EMA, a signal that previously preceded the latest upward move. The 100-day EMA is now rising toward the 200-day EMA, showing strengthening trend support.
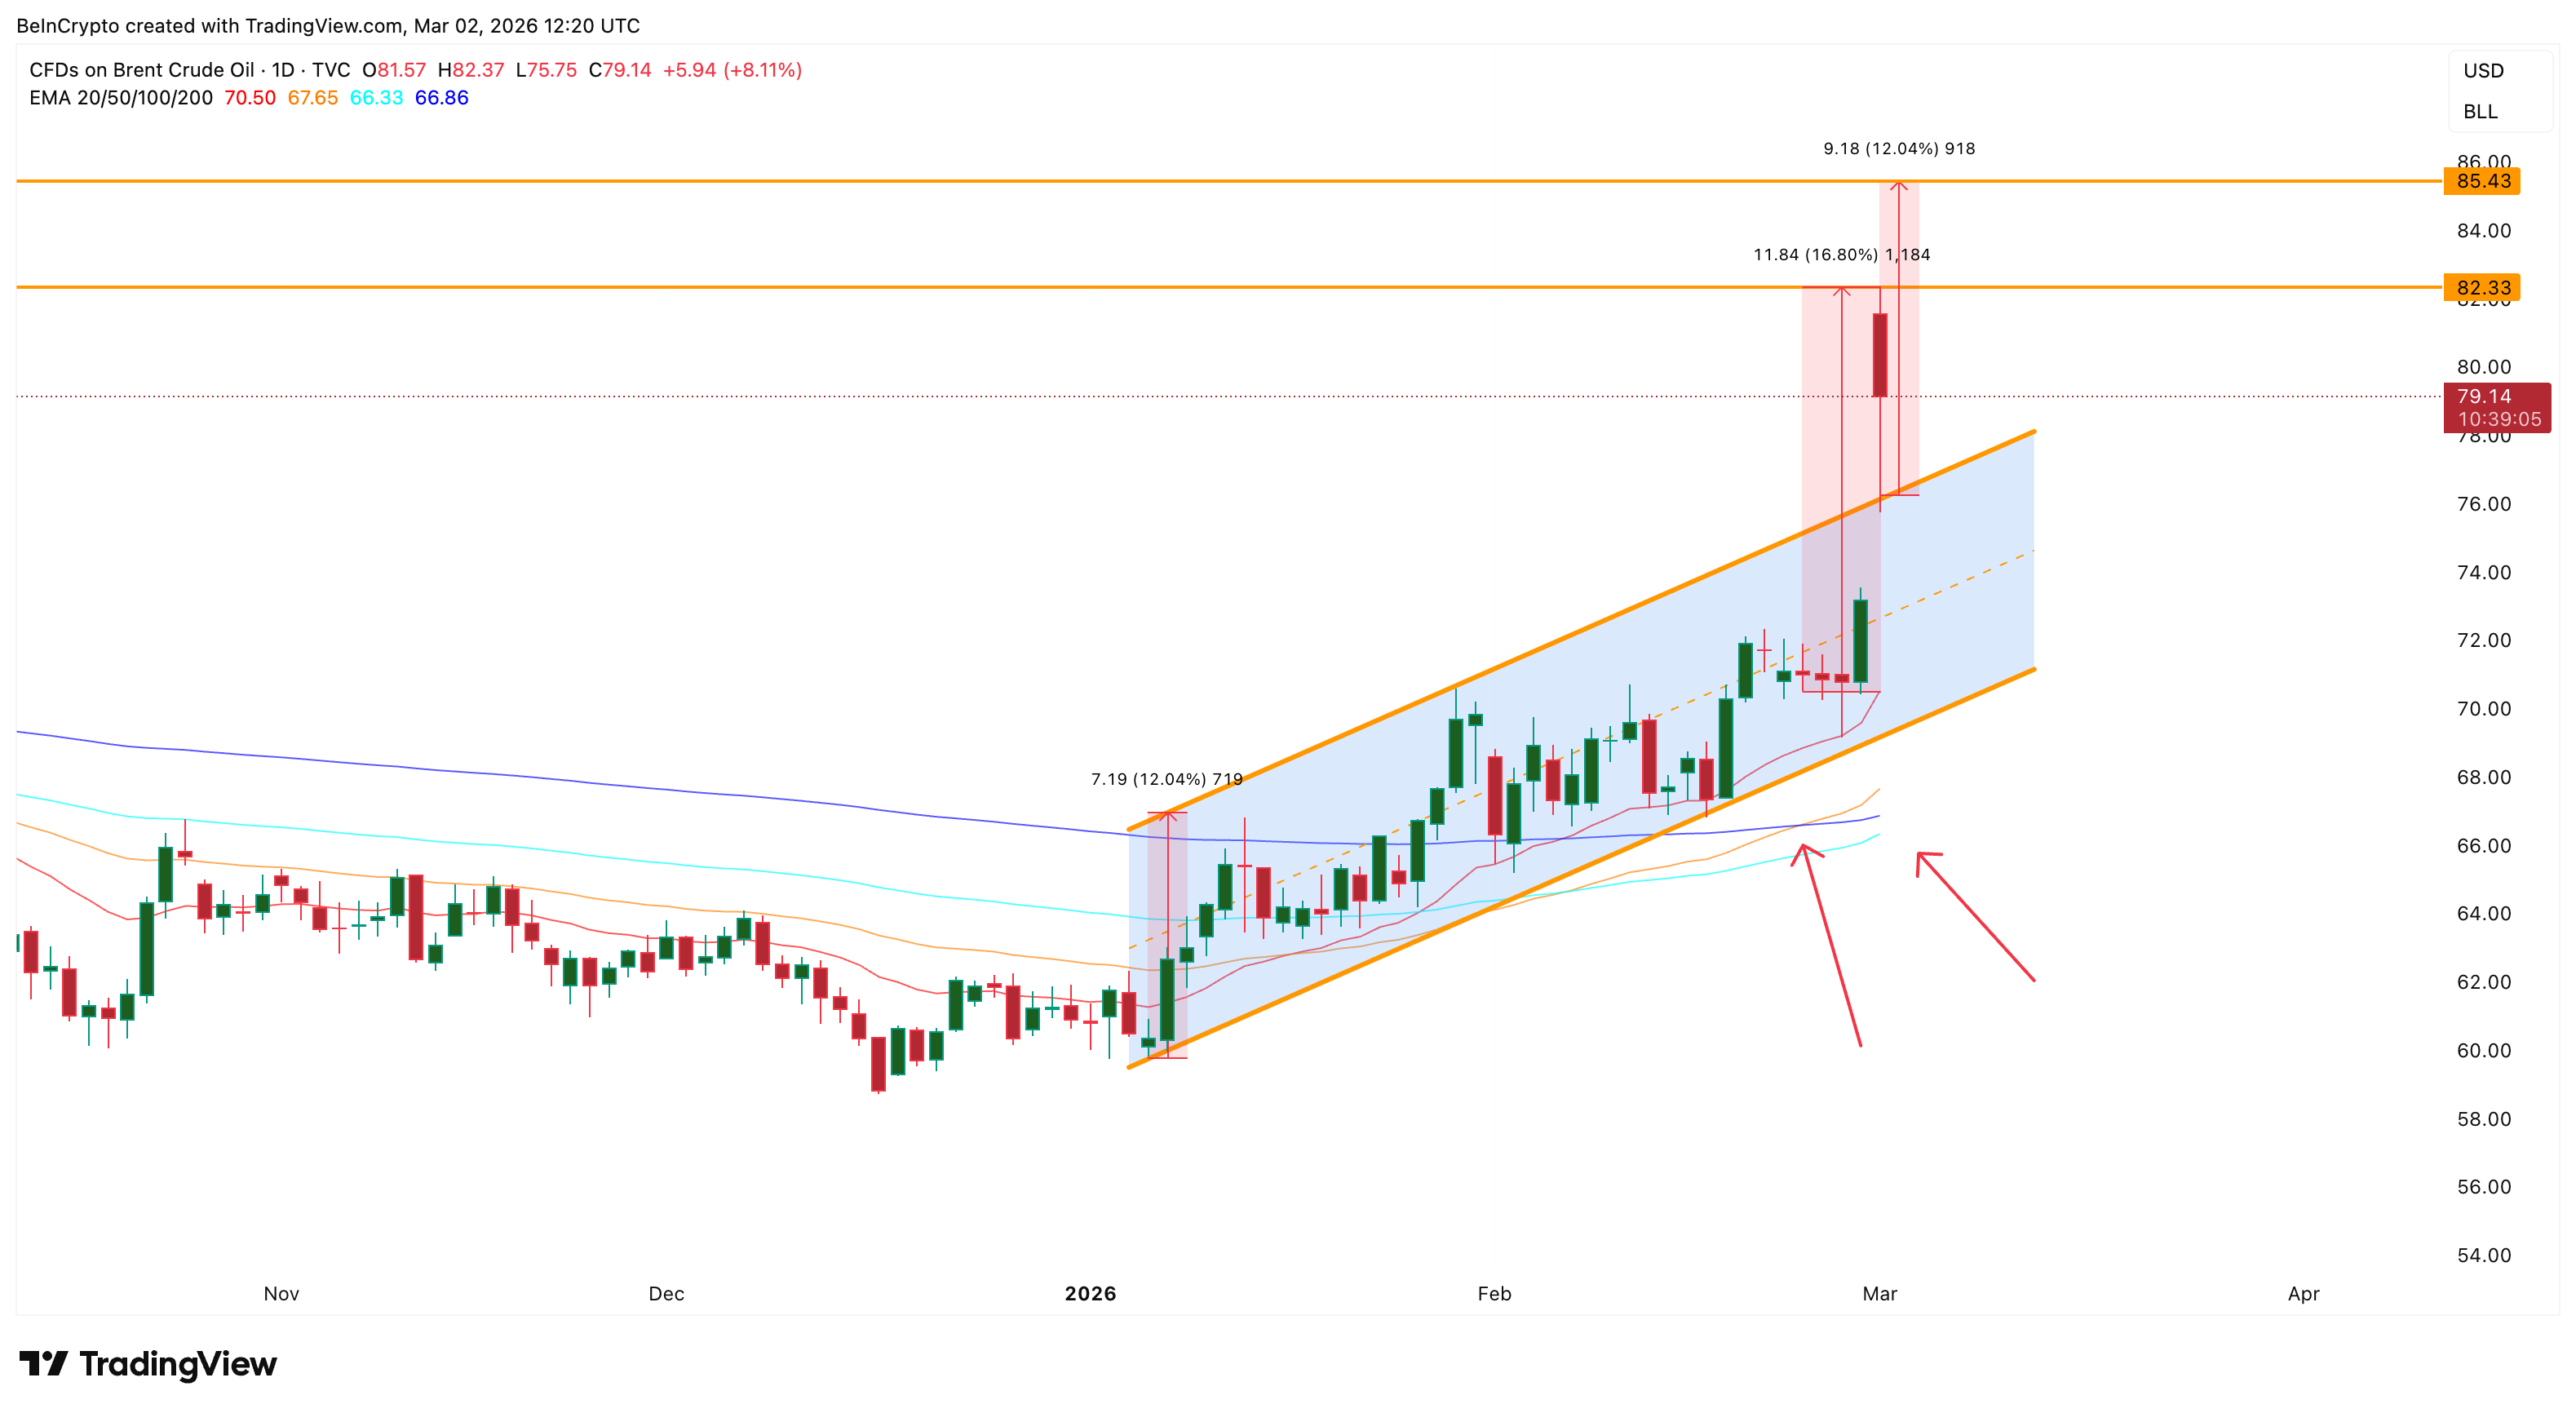
If that bullish crossover confirms, the $85 target, based on the ascending channel’s projection, might show up first.
However, the most important support level is $75.
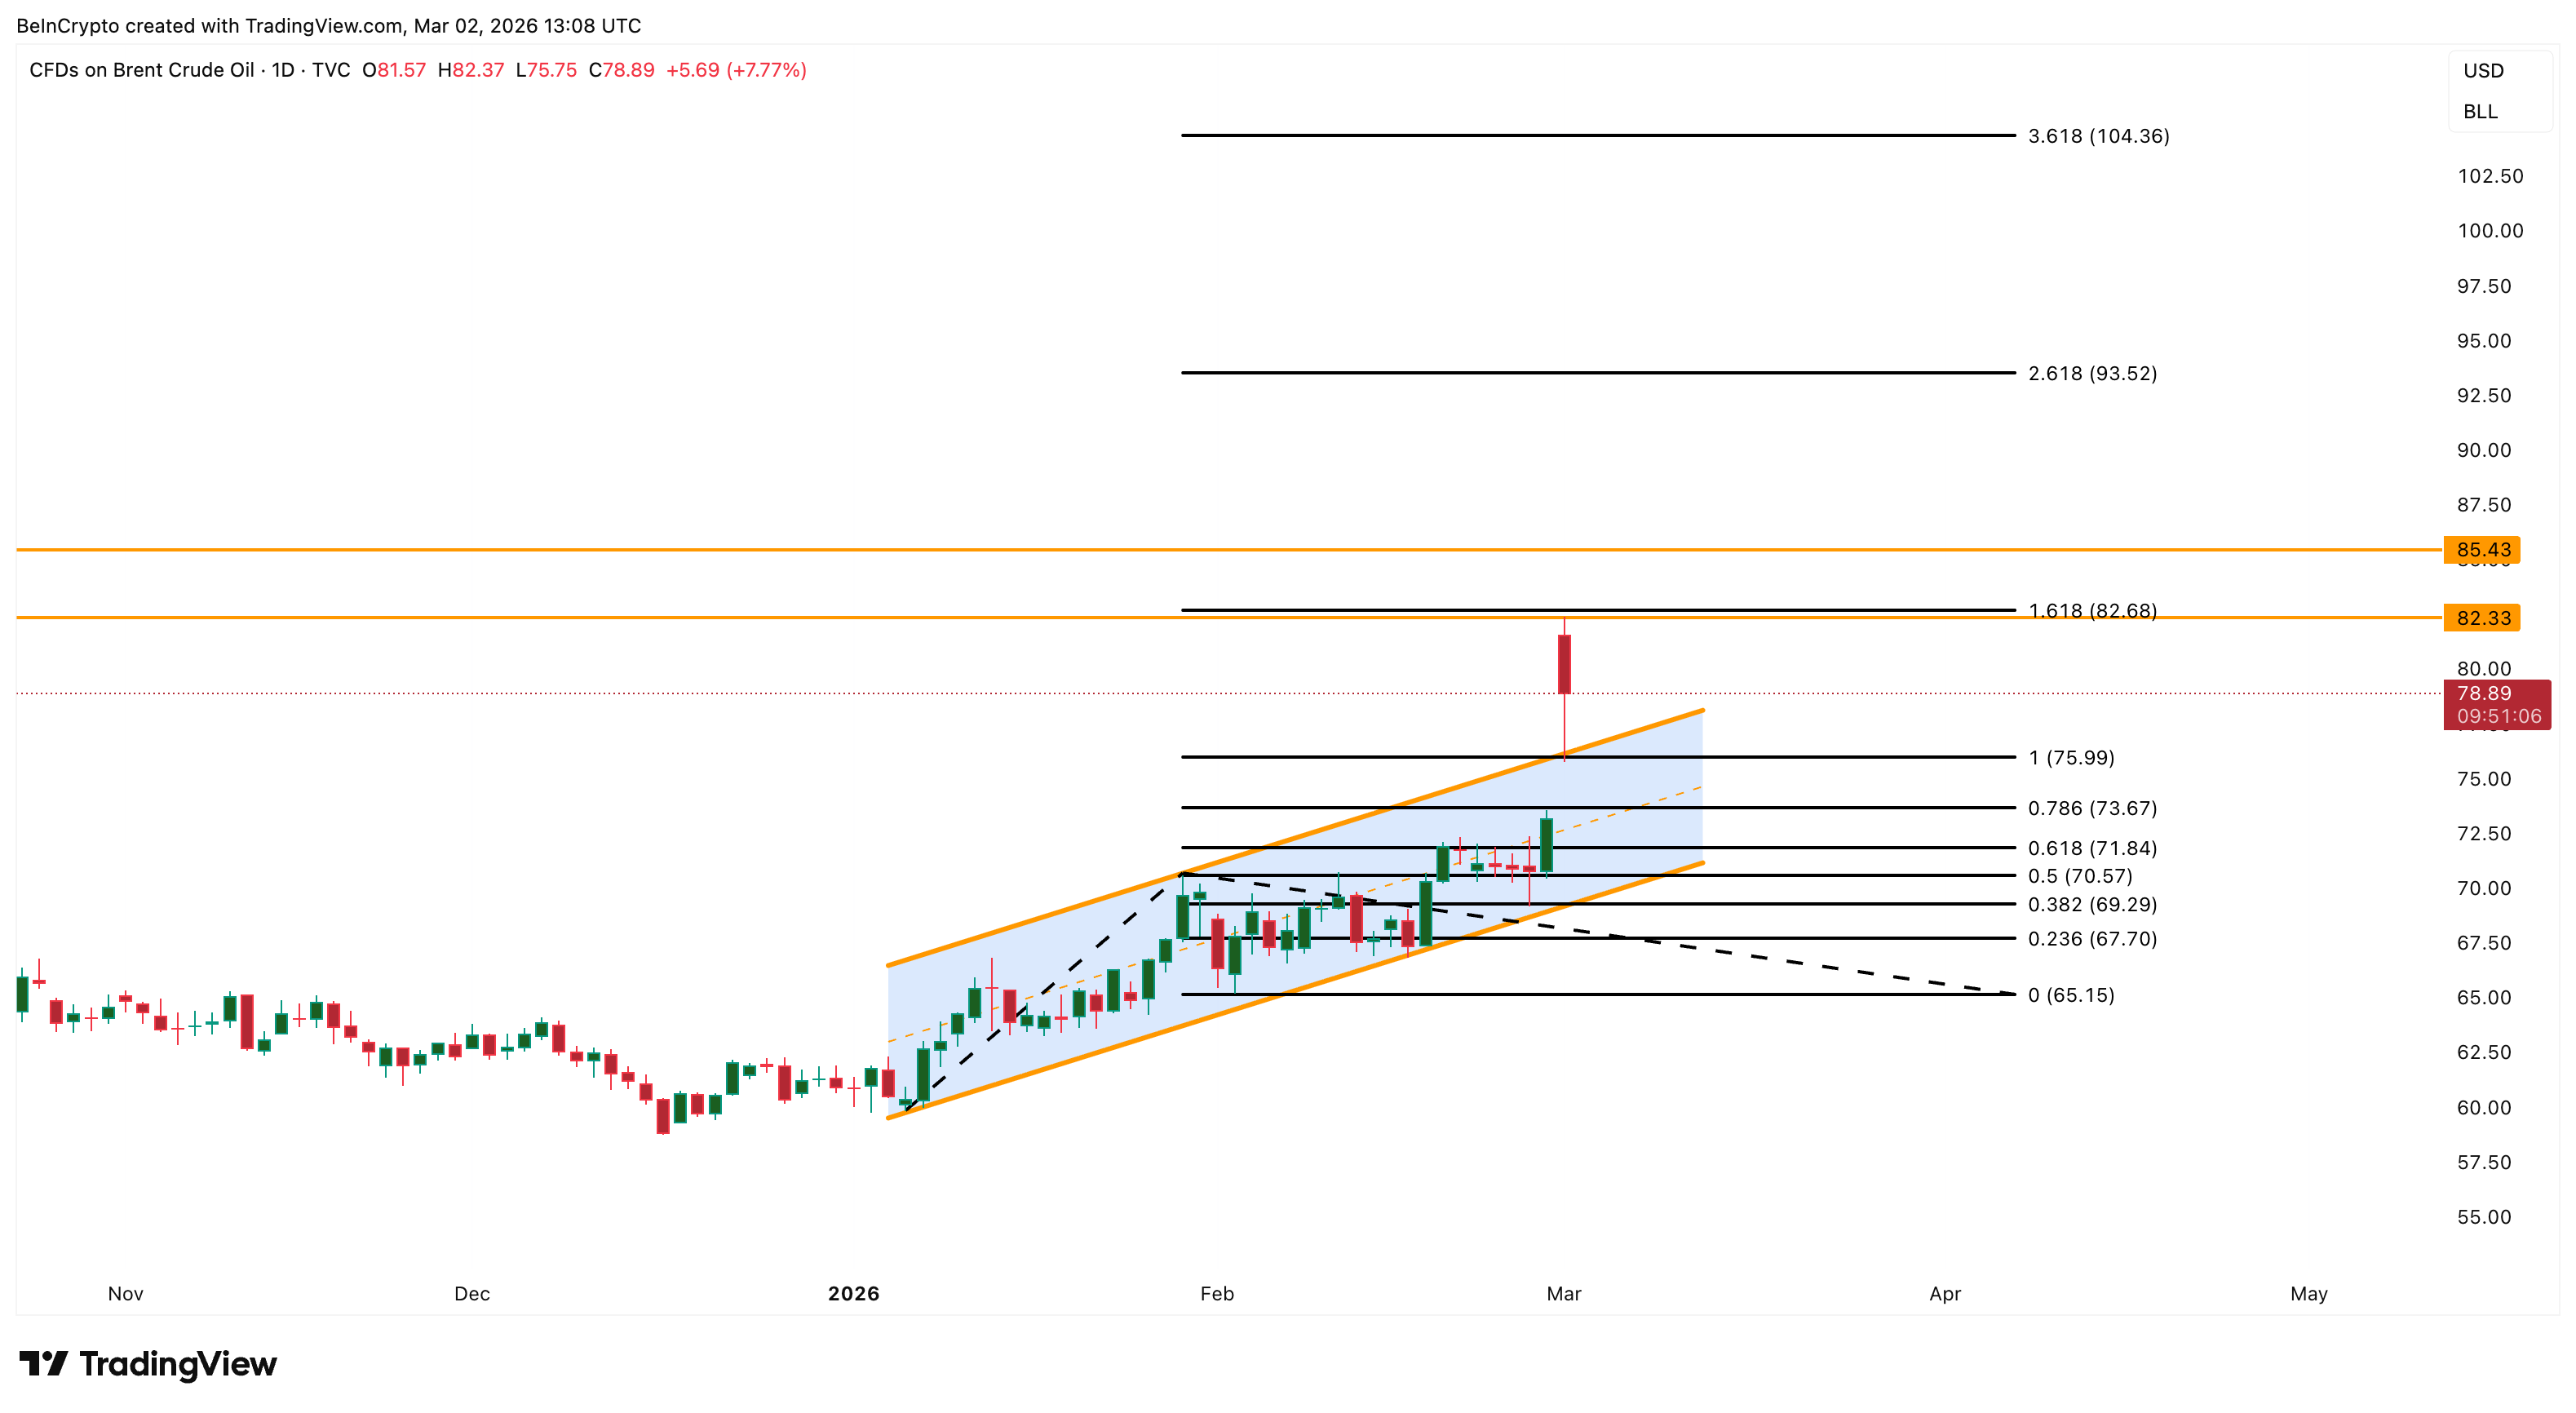
If the oil price falls below $75, it could decline toward $73 and $71. However, the bullish structure only weakens on possible peace talks and a dip under $67.


Institutional engagement with digital assets is no longer a uniform story. In recent years, major financial institutions have taken markedly different approaches to blockchain-based markets. Some have focused on tokenization, putting traditional instruments into programmable form. Banks, meanwhile, have explored tokenized deposit models and internal settlement rails as well as issuing their own digital assets like stablecoins.
Amid the growing wave of institutional capital entering digital assets, the more revealing question is not who participates, but how participation is governed inside the institution. Regulatory requirements, operational standards, and internal conviction often determine whether a strategy moves forward or stalls.
Speaking exclusively with BeInCrypto at Liquidity Summit 2026 in Hong Kong, Samar Sen, Head of International Markets at Talos, shared how those internal dynamics play out when institutions evaluate digital asset opportunities.
Adoption Requires More Than Rules
According to Sen, regulatory clarity remains the most decisive factor in institutional participation. He noted that progress across jurisdictions has helped reduce uncertainty, but clear rules remain essential for large-scale adoption.
“We’ve seen a lot of advancements in regulation all over the world,” Sen acknowledged.
While once the dominant concern, infrastructure has matured significantly. Institutional-grade custody, execution platforms, and portfolio management systems now operate across major markets, addressing many of the operational gaps that previously slowed adoption.
Yet even where regulatory frameworks have advanced, and infrastructure is in place, in many institutions, the remaining hurdle is internal. He said:
“There may be management that is still evaluating the underlying tech or still need some time to get around understanding the potential of the tech to revolutionize finance.”
That hesitation often reflects unfamiliarity rather than outright resistance, he added. For institutions built on decades of precedent, conviction takes time. As a result, digital asset initiatives can stall even when the external conditions appear favorable.
The Compliance Checklist Behind Institutional Trust
When asked what signals actually build trust for institutions evaluating crypto counterparties, Sen pushed back on the idea that visibility alone carries weight. While he acknowledged that industry gatherings and brand presence may help with awareness, institutional trust is earned differently.
“Typically, what builds trust will be, first of all, licensed or regulated entities within their jurisdictions,” Sen said.
He also added that institutions look for demonstrable internal controls, such as SOC 2 Type II certifications, audit trails, and operational safeguards. Track record also matters, particularly if leadership has experience in traditional finance and has built a reputation for delivering under regulatory scrutiny.
Peer adoption plays a role as well. Institutions often look outward, assessing who else is using the same infrastructure and how widely it has been adopted across the industry. He explained:
“If you’re a big bank, and you go to talk to a vendor to provide you with technology, if that vendor is providing that technology to some of your peers and competitors, that’s another way that can establish some kind of trust.”
Not All Institutions Move at the Same Speed
Although regulatory clarity and operational safeguards form the foundation, institutions are not entering digital assets uniformly. Sen described three distinct profiles emerging in the market.
Some organizations act as early movers. These firms understand the structural shift underway in capital markets and are willing to commit resources ahead of full certainty. They tend to invest in building internal digital asset teams and engage proactively with new infrastructure providers.
Others take a more measured approach. These fast followers prefer to wait for clearer regulatory direction or proof of concept before scaling exposure. Their risk appetite is lower, and they often rely on external validation before committing capital.
Then there are institutions that remain behind the curve. In some cases, leadership has yet to develop conviction around the underlying technology. In others, digital asset initiatives exist but lack internal coordination, resulting in fragmented or misaligned strategies.
Sen noted that institutions should not be expected to move in lockstep. He added that different risk tolerances and internal mandates shape the pace of adoption.
“And that’s okay because with digital assets and the underlying technology, there are many entry points to participate in the asset class, to get comfortable with the new providers and ecosystem participants. We are here to help navigate that.”

While regulation continues to loosen around crypto in the United States, largely thanks to a president who accepts bribes via his own meme and stablecoins, the opposite is occurring in China.
Indeed, dozens of Chinese nationals have taken to social media to report that just putting “Dogecoin” or “USDT” in the memo field of a transfer ends with the bank account being frozen — and the individuals have almost no recourse for their money getting unfrozen thereafter.
Drastic difference in banking regulations
Despite the near total normalization of buying, selling, trading, and creating cryptocurrencies in the US — including a stablecoin endorsed and partially owned by the president — China and its retail banks have taken on a much stricter set of rules and regulations.
In one instance, according to a site called Techub.info in China, two clients of China Construction Bank (the third largest bank in the world) had their accounts frozen after transferring a mere 250 yuan, or $35, between one another with the memo “Dogecoin this week.”
After sending the money the bank flagged the transfer under its virtual currency control risk management program.
Rednote users warn Chinese citizens
On Rednote, users are sharing the story with words of warning for others in China: never put bitcoin, virtual currency, any memecoin, or USDT as the reason for a fund transfer or you will absolutely face an account freeze.

Read more: China’s Regulation 42 forces Tether to kill its CNHT stablecoin
They add that the only way to get one’s bank account unfrozen is to prove to to bank officials that money wasn’t in fact used to purchase cryptocurrencies, write a statement as to why a cryptocurrency was referenced, and wait for the statements to be reviewed.
The entire process can take weeks to occur, if the account is unfrozen at all.
Needless to say, Chinese citizens are being more cautious than ever before when it comes to using their bank accounts for cryptocurrency trading.
Got a tip? Send us an email securely via Protos Leaks. For more informed news and investigations, follow us on X, Bluesky, and Google News, or subscribe to our YouTube channel.


Check out which tokens may plummet by 90% if such a scenario unfolded.
The global geopolitical tension escalated over the weekend after the USA and Israel carried out mutual attacks on Iran, creating a sudden surge of uncertainty that quickly spread across the region and beyond.
The military operation struck many targets and eventually led to the liquidation of Ali Khamenei (the supreme leader of the Asian country). Iran retaliated against several nations in the region, including the UAE, Bahrain, Qatar, and Saudi Arabia. The American president, Donald Trump, warned that the war may continue for up to four weeks, while leading European economies (some of which are nuclear powers), such as France, Germany, and the UK, have hinted that they may “defend their interest” and join the conflict soon.
Right now, the world is watching the Middle East with growing concern, as the risk of a wider conflict and even a potential World War III seems more real than it has in years. Beyond the countless human lives this devastating event would claim, it would also send shockwaves through global financial and crypto markets. To explore the potential impact, we asked four of the most popular AI-powered chatbots which digital assets would be hit the hardest if such a scenario unfolded.
Small Alts, Memes, and More
ChatGPT started with a disclaimer, stating that a world war will not be just “bad news” but cause a “systemic liquidity shock.” It predicted that such a conflict would lead to immediate market panic, with equities dumping and credit freezing. In that kind of environment, crypto would get hit just as hard as everything else.
The chatbot suggested that small-cap altcoins are at the highest risk because they have thin liquidity, few real buyers, and heavy retail exposure. It alerted that cryptocurrencies, whose market capitalization is under $100 million and whose use-cases are dubious, may collapse by up to 90% in a World War III scenario.
Another sector that may experience a real carnage is the meme coin niche. According to ChatGPT, tokens like PEPE, BONK, WIF, and FLOKI can plummet to zero since they are sentiment-driven and notorious for their enhanced volatility:
“In a true risk-off event like a global war, speculative appetite collapses first, and liquidity in meme tokens can disappear within hours.”
Google’s Gemini agreed with ChatGPT’s assumption. It forecasted that such a major conflict could have a devastating effect on small and mid-cap altcoins and meme coins due to mass panic selling and total lack of buyers.
You may also like:
Perplexity focused specifically on the biggest meme coins by market cap, Dogecoin (DOGE) and Shiba Inu (SHIB), estimating they would likely suffer the most due to their “extreme sensitivity to risk-off sentiment and lack of fundamental utility.”
Grok, the chatbot integrated within X, presented a rather different thesis. It claimed that stablecoins like Tether’s USDT and Circle’s USDC could be among the biggest victims due to their connection to the American dollar:
“Stablecoins are pegged 1:1 to fiat currencies like the USD, backed by reserves in banks, Treasuries, or other assets. In WW3, if major economies like the US face hyperinflation, debt defaults, or banking freezes (as seen in historical wars), these reserves could become worthless or inaccessible. In a global war, peg breaks could lead to total devaluation, turning them into “digital IOUs” for a collapsing dollar.”
How About BTC?
All four chatbots we consulted argued that Bitcoin would plunge substantially immediately after a potential announcement of a global war, but would remain the most resilient asset in the crypto sector. They also suggested that, despite the initial shock, BTC could recover its losses relatively quickly compared to the rest of the market.
“BTC would likely drop sharply alongside other risk assets as investors rush to liquidity. However, if the conflict leads to monetary instability or aggressive money printing, BTC could recover faster than most altcoins as its decentralziation and “digital gold” narrative regain strength,” ChatGPT stated.
Binance Free $600 (CryptoPotato Exclusive): Use this link to register a new account and receive $600 exclusive welcome offer on Binance (full details).
LIMITED OFFER for CryptoPotato readers at Bybit: Use this link to register and open a $500 FREE position on any coin!
The highest level of margin utilization by US traders in history has, unfortunately, led to historic underperformance in crypto prices as speculators re-learned timeless wisdom: leverage works both ways.
After spending 2025 through January 2026 building their largest leveraged positions in history, bets on digital assets have unraveled with unnerving speed.
In January 2026, US margin debt had surged to a record $1.28 trillion — its ninth consecutive monthly increase and a 50% rise from April 2025. That financial leverage added bids to crypto assets which made new all-time highs in May, July, August, and October 2025.
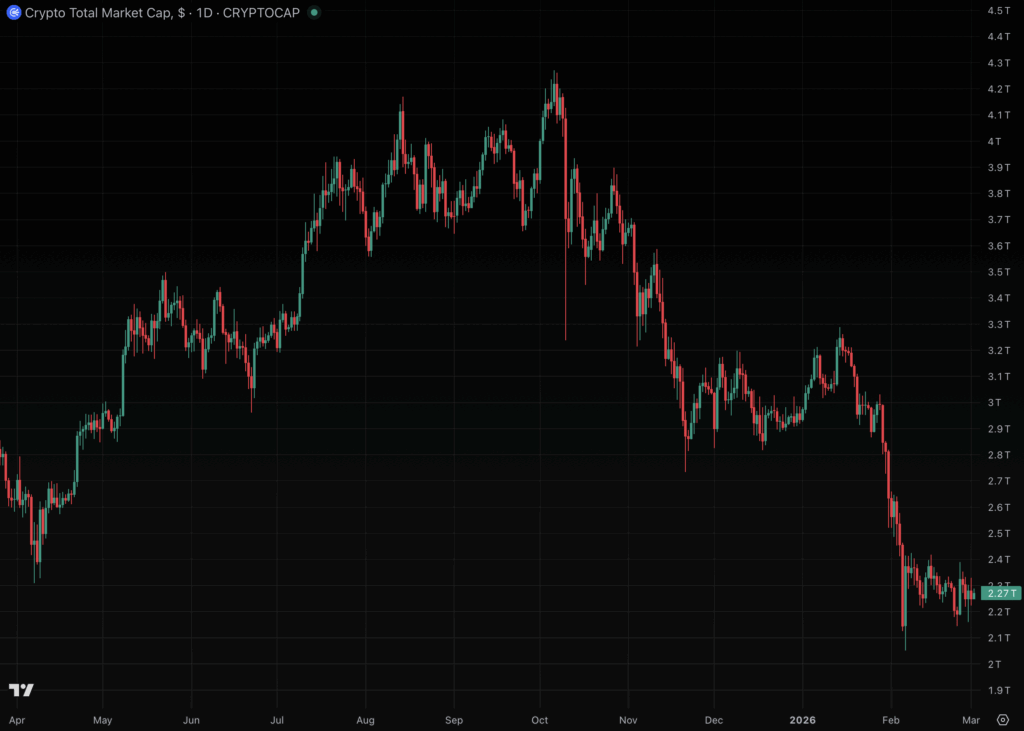
Then, despite investors continuing to pile on more margin debt than ever, prices collapsed 47% and shed $2 trillion in combined market capitalization as a sector rotation to AI and precious metals ensued.
Crypto losses since October are staggering.
US margin debt increased $53 billion from December to January alone. Worse, the ratio of margin to real disposable personal income exceeded 6.0% in January for the first time on record.
That ratio measures more financial leverage in January 2026 relative to income than the dot-com mania.
Leverage-fueled demand flows into crypto instruments like bitcoin (BTC) futures, spot and leveraged ETFs, call options, and publicly traded crypto companies. Although more leverage can amplify gains, it also amplifies crashes.
Although traditional margin statistics are an incomplete measure of total systemic risk on crypto, which has vast quantities of opaque exchanges and trade data APIs controlled by offshore entities with little to no regulatory oversight, it can nonetheless inform some analysis about the causes of crypto volatility.
A supernova of crypto leverage that wiped out $2 trillion
Some crypto derivatives traders spent mid-2025 building their largest leveraged positions in history, then watched all of their paper gains evaporate.
Aggregate crypto futures open interest peaked above $220 billion on October 6, 2025. Within a week, the industry began to crash and never looked back.
October 10 produced more than $19 billion in total liquidations across exchanges, according to CoinGlass data — the single largest day of forced closures in crypto history.
Many saw Binance as a convenient scapegoat.
Read more: Crypto traders consider lawsuits after $600B market meltdown
Record-setting volatility continued amid record-setting margin levels. On February 5, 2026, another flash-crash drove BTC from $73,000 to $62,000 and wiped out 10-figure position values within a single day.
Worst day of realized losses from BTC liquidations
Glassnode estimated that February 5’s crash produced $3.2 billion in realized losses from liquidated BTC trades — the largest single-day realized loss in Glassnode’s recorded history that surpassed even October 10, 2025, the FTX bankruptcy in November 2022, or the May 2022 collapse of Terra/Luna.
By late February, crypto’s margin trading hangover had set in.
CoinGlass’ Crypto Fear & Greed Index fell to five out of 100 — a never-before-seen rating that exceeded its Three Arrows Capital bankruptcy low of six in June 2022, and its COVID-19 low of seven in March 2020.
As of writing, the index still remains near historic lows at nine, or “extreme fear.”
Losses amid record margin levels have also drawn out spot BTC from US ETFs. Specifically, spot BTC ETFs lost $4.5 billion in net outflows through the first eight weeks of 2026, according to Investing.com.
The leveraged unwind of Strategy
Adding insult to injury, software company-turned-leveraged BTC acquirer Strategy became the most-shorted large cap stock in the US last month, according to data from FactSet cited by multiple outlets.
The company held 717,722 BTC over this weekend, purchased at an average cost near $76,020 per coin. With BTC trading in the mid-$60,000s, the company faces unrealized losses in the billions.
Margined short-sales against Strategy and its BTC, in this case, have actually stood out as a rare success story amid crypto’s margin mania of January 2026.
Leverage always works both ways. Although US margin debt at $1.28 trillion is an incredible headline, the real story is that leverage has seeped into every layer of crypto valuations — from listed securities in brokerage accounts to perpetual swap venues in tax havens.
With losses liquidating collateral and forcing cascading sales, each layer’s losses have been feeding the next since October.
Got a tip? Send us an email securely via Protos Leaks. For more informed news, follow us on X, Bluesky, and Google News, or subscribe to our YouTube channel.

Emergency services on scene after woman dies in Bolton
William Blair reiterates Ocular Therapeutix stock rating on trial data

XRP Price May Drop Another 30% Amid Increased Exchange Inflows

Smart energy pays enters the US market, targeting scalable financial infrastructure

Why Israel is blocking foreign journalists from entering

Bitcoin: We’re Entering The Most Dangerous Phase

Vitalik Buterin Is Selling His ETH: What It Means for Ethereum

Financial products Vs Purpose #FinancialPlanning#MoneyManagement#PersonalFinance#InvestmentTips

This is an official collection of Claude plugins from Anthropic for financial services workflows
-

 Sports7 days ago
Women’s college basketball rankings: Iowa reenters top 10, Auriemma makes history
-

 Politics7 days ago
Nick Reiner Enters Plea In Deaths Of Parents Rob And Michele
-

 Fashion3 days ago
Weekend Open Thread: Iris Top
-

 Business6 days ago
True Citrus debuts functional drink mix collection
-

 Politics4 days ago
ITV enters Gaza with IDF amid ongoing genocide
-

 Tech2 days ago
Unihertz’s Titan 2 Elite Arrives Just as Physical Keyboards Refuse to Fade Away
-
Sports2 days ago
The Vikings Need a Duck
-

 Crypto World6 days ago
XRP price enters “dead zone” as Binance leverage hits lows
-

 NewsBeat5 days ago
Cuba says its forces have killed four on US-registered speedboat | World News
-
 NewsBeat2 days ago
Dubai flights cancelled as Brit told airspace closed ’10 minutes after boarding’
-

 Tech6 days ago
Unsurprisingly, Apple's board gets what it wants in 2026 shareholder meeting
-
 NewsBeat5 days ago
Manchester Central Mosque issues statement as it imposes new measures ‘with immediate effect’ after armed men enter
-
 NewsBeat2 days ago
The empty pub on busy Cambridge road that has been boarded up for years
-

 NewsBeat1 day ago
‘Significant’ damage to boarded-up Horden house after fire
-

 NewsBeat2 days ago
Abusive parents will now be treated like sex offenders and placed on a ‘child cruelty register’ | News UK
-
 NewsBeat6 days ago
Police latest as search for missing woman enters day nine
-

 Entertainment8 hours ago
Baby Gear Guide: Strollers, Car Seats
-

 Business4 days ago
Discord Pushes Implementation of Global Age Checks to Second Half of 2026
-

 Business4 days ago
Only 4% of women globally reside in countries that offer almost complete legal equality
-
 Tech3 days ago
NASA Reveals Identity of Astronaut Who Suffered Medical Incident Aboard ISS