

Crypto World
Ethereum Price Prediction March 2026: Bearish, But With Hope
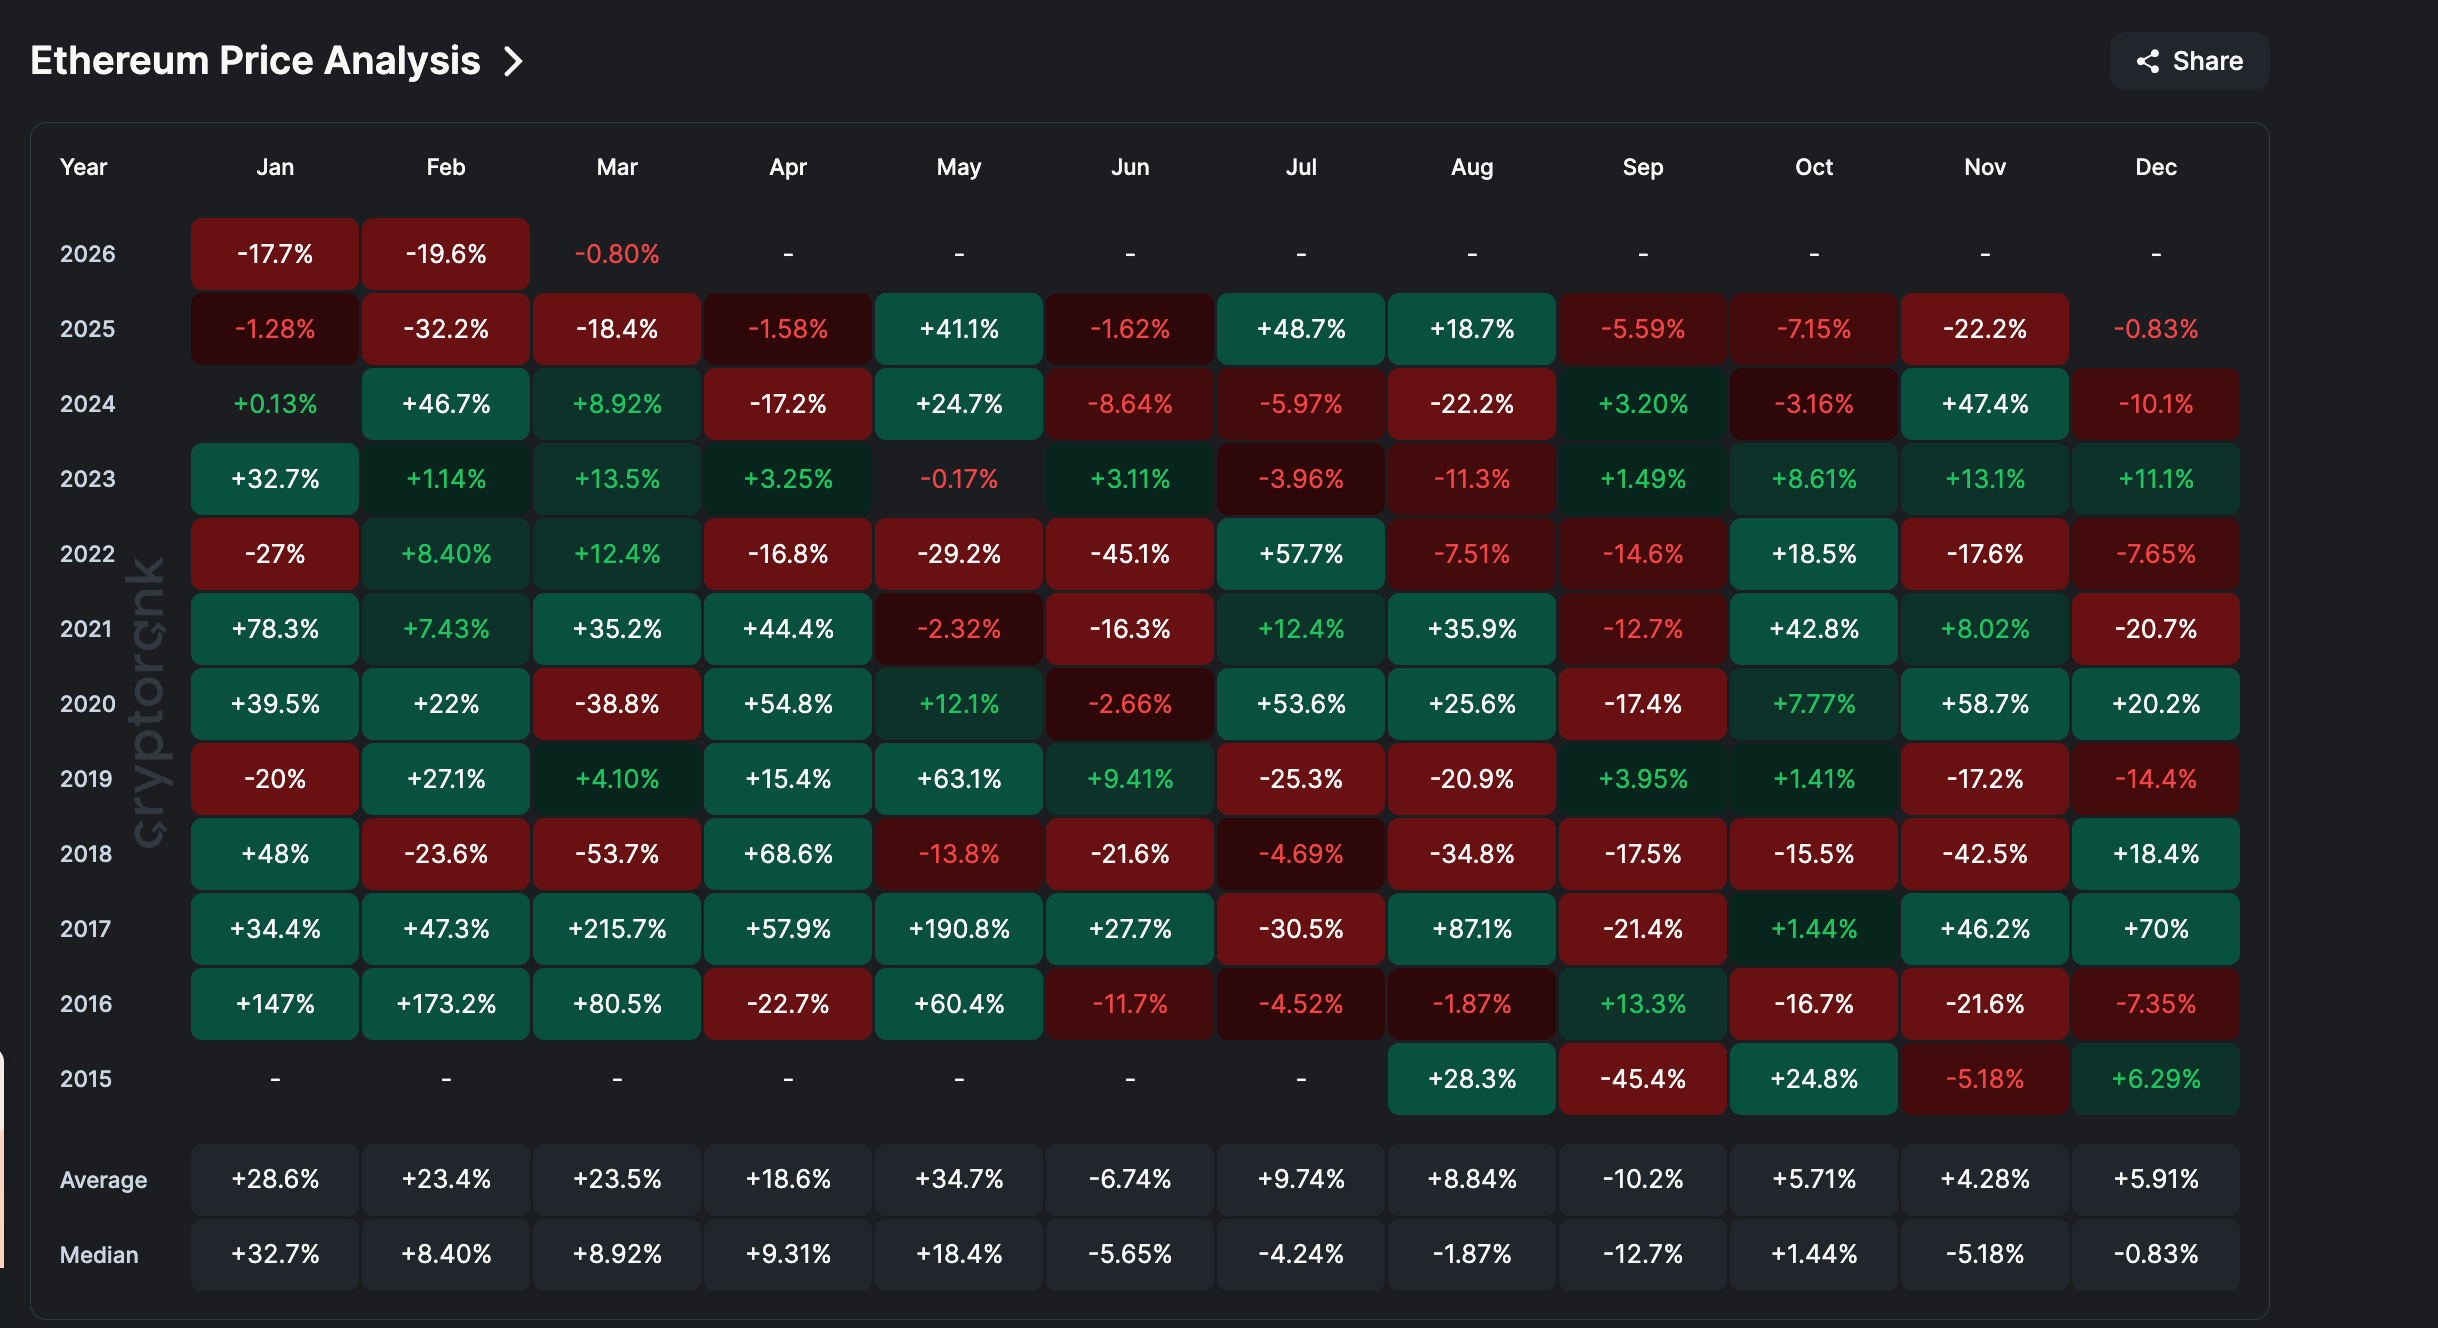
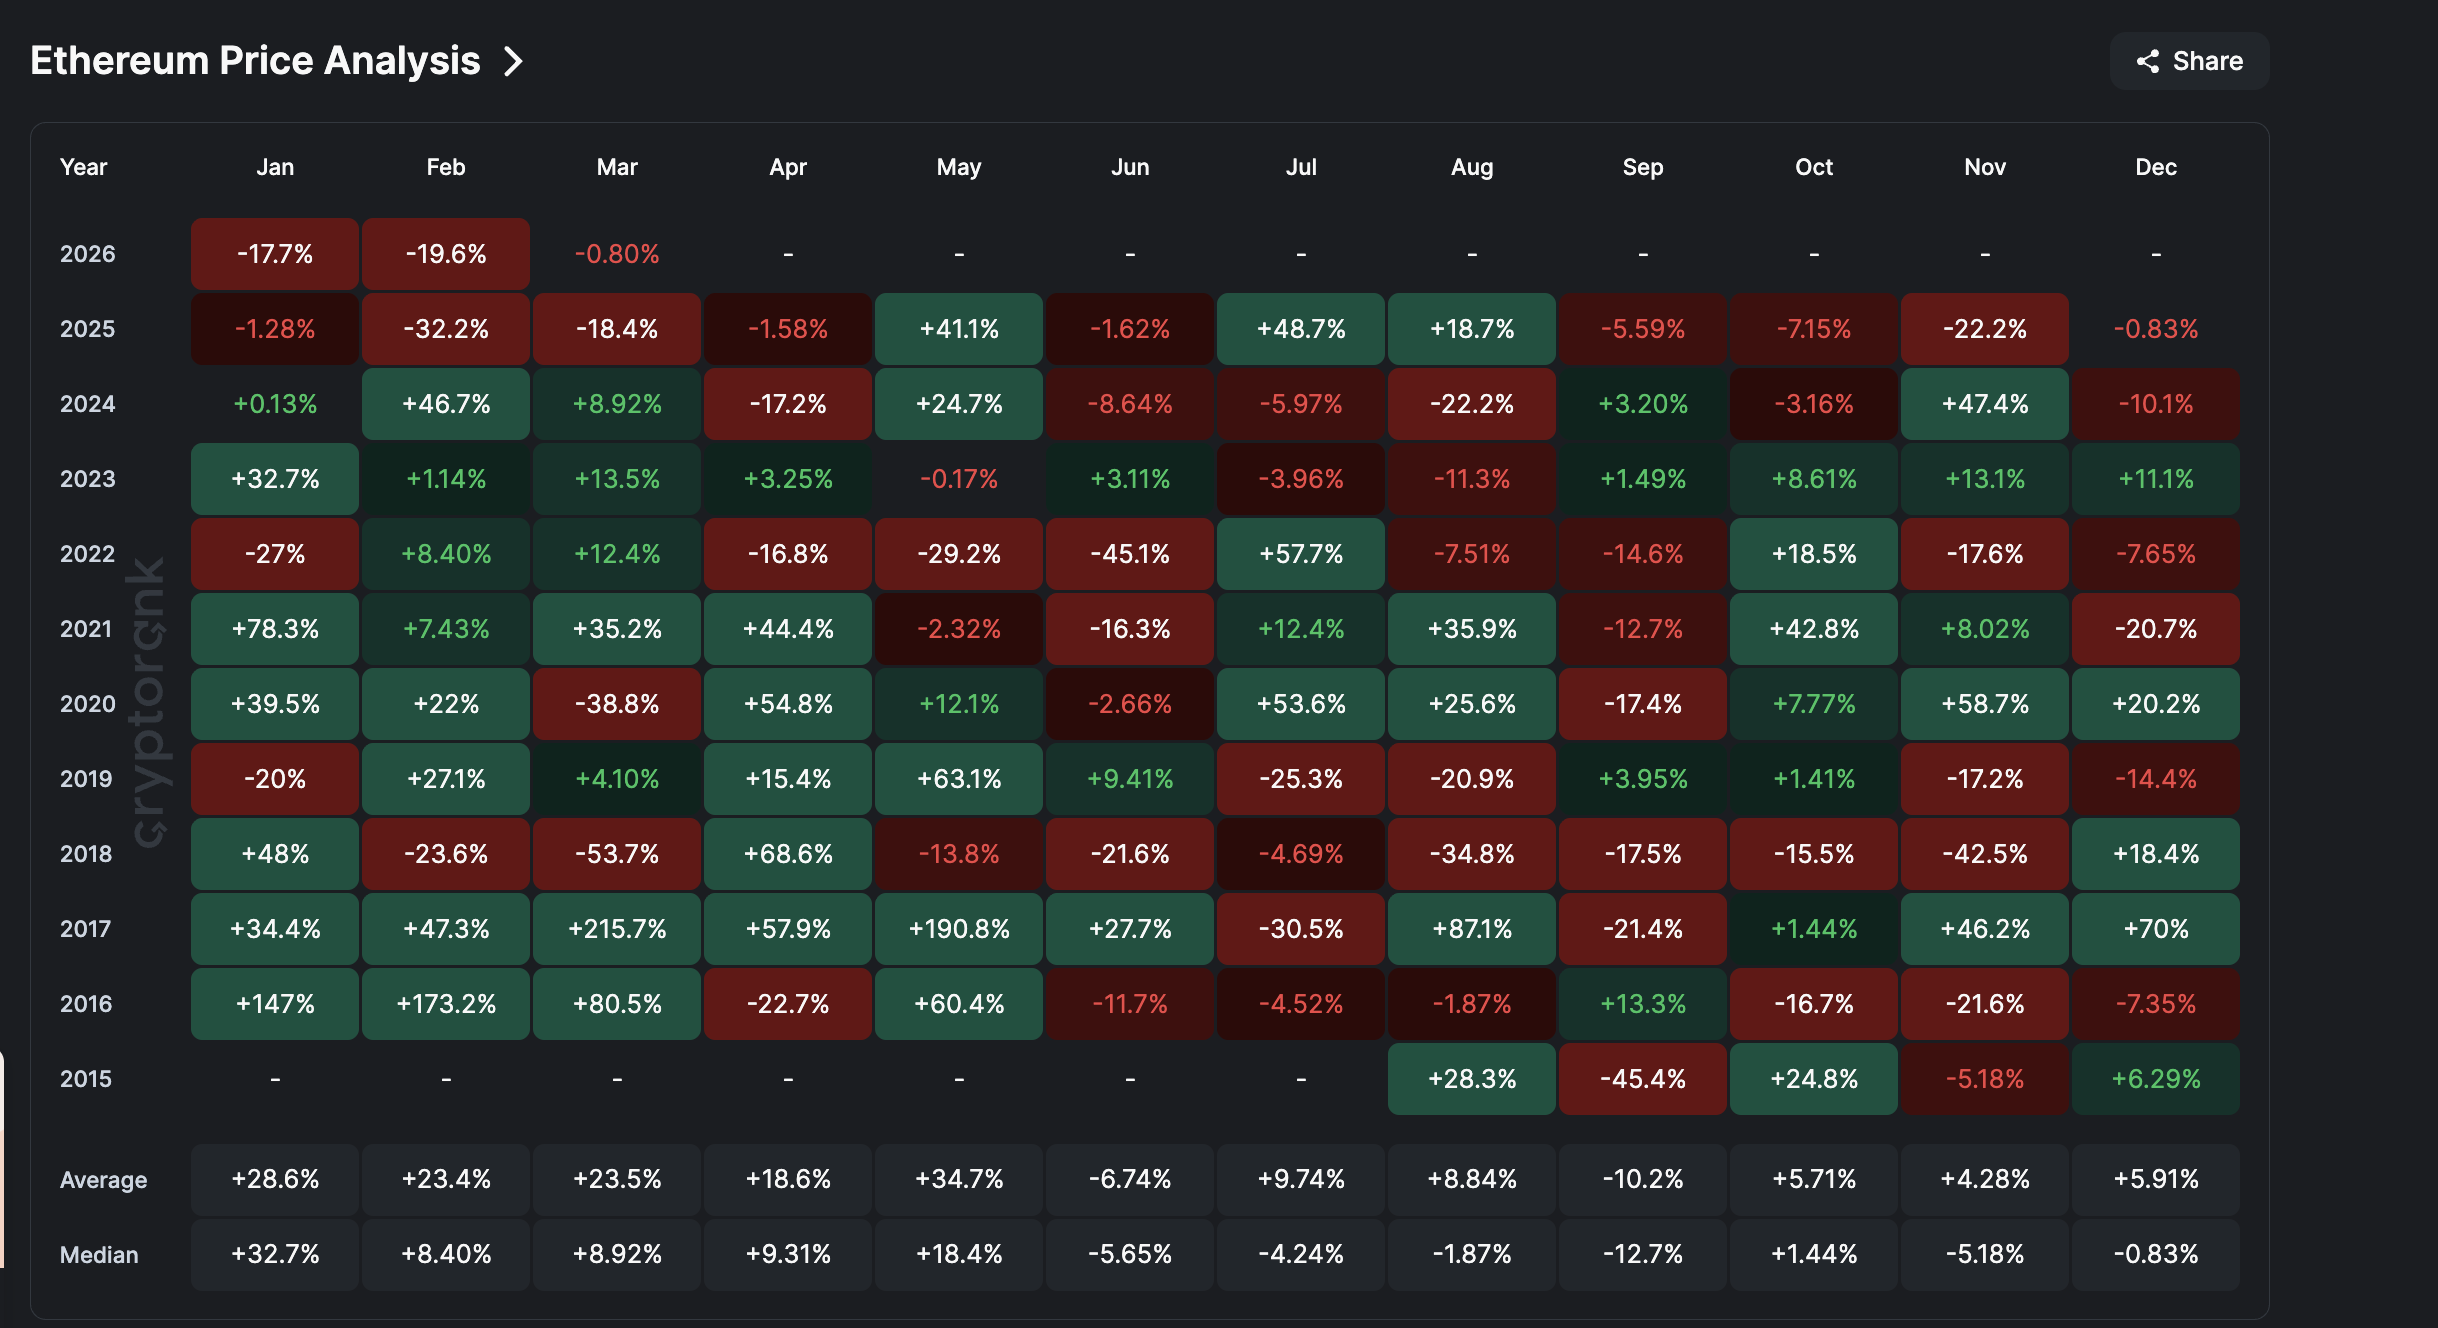
The Ethereum price enters March after a brutal February that delivered close to 20% losses. ETH has now posted six consecutive red months starting from September 2025, a streak unprecedented in the token’s history. If March finishes in the red, it would extend to seven months, further cementing this as the longest sustained decline Ethereum has ever seen.
While March historically carries a median return of nearly 9% for ETH, the current setup suggests history may offer little guidance. Here is what the data shows.
The Weekly Chart Has Already Broken Down
Even February 2025, which saw a 32% decline, immediately saw a recovery attempt over the next few months. This time, the selling has been relentless, and the weekly chart explains why. Six straight months of red, excluding March (just formed), is no mean bearish feat.
Want more token insights like this? Sign up for Editor Harsh Notariya’s Daily Crypto Newsletter here.
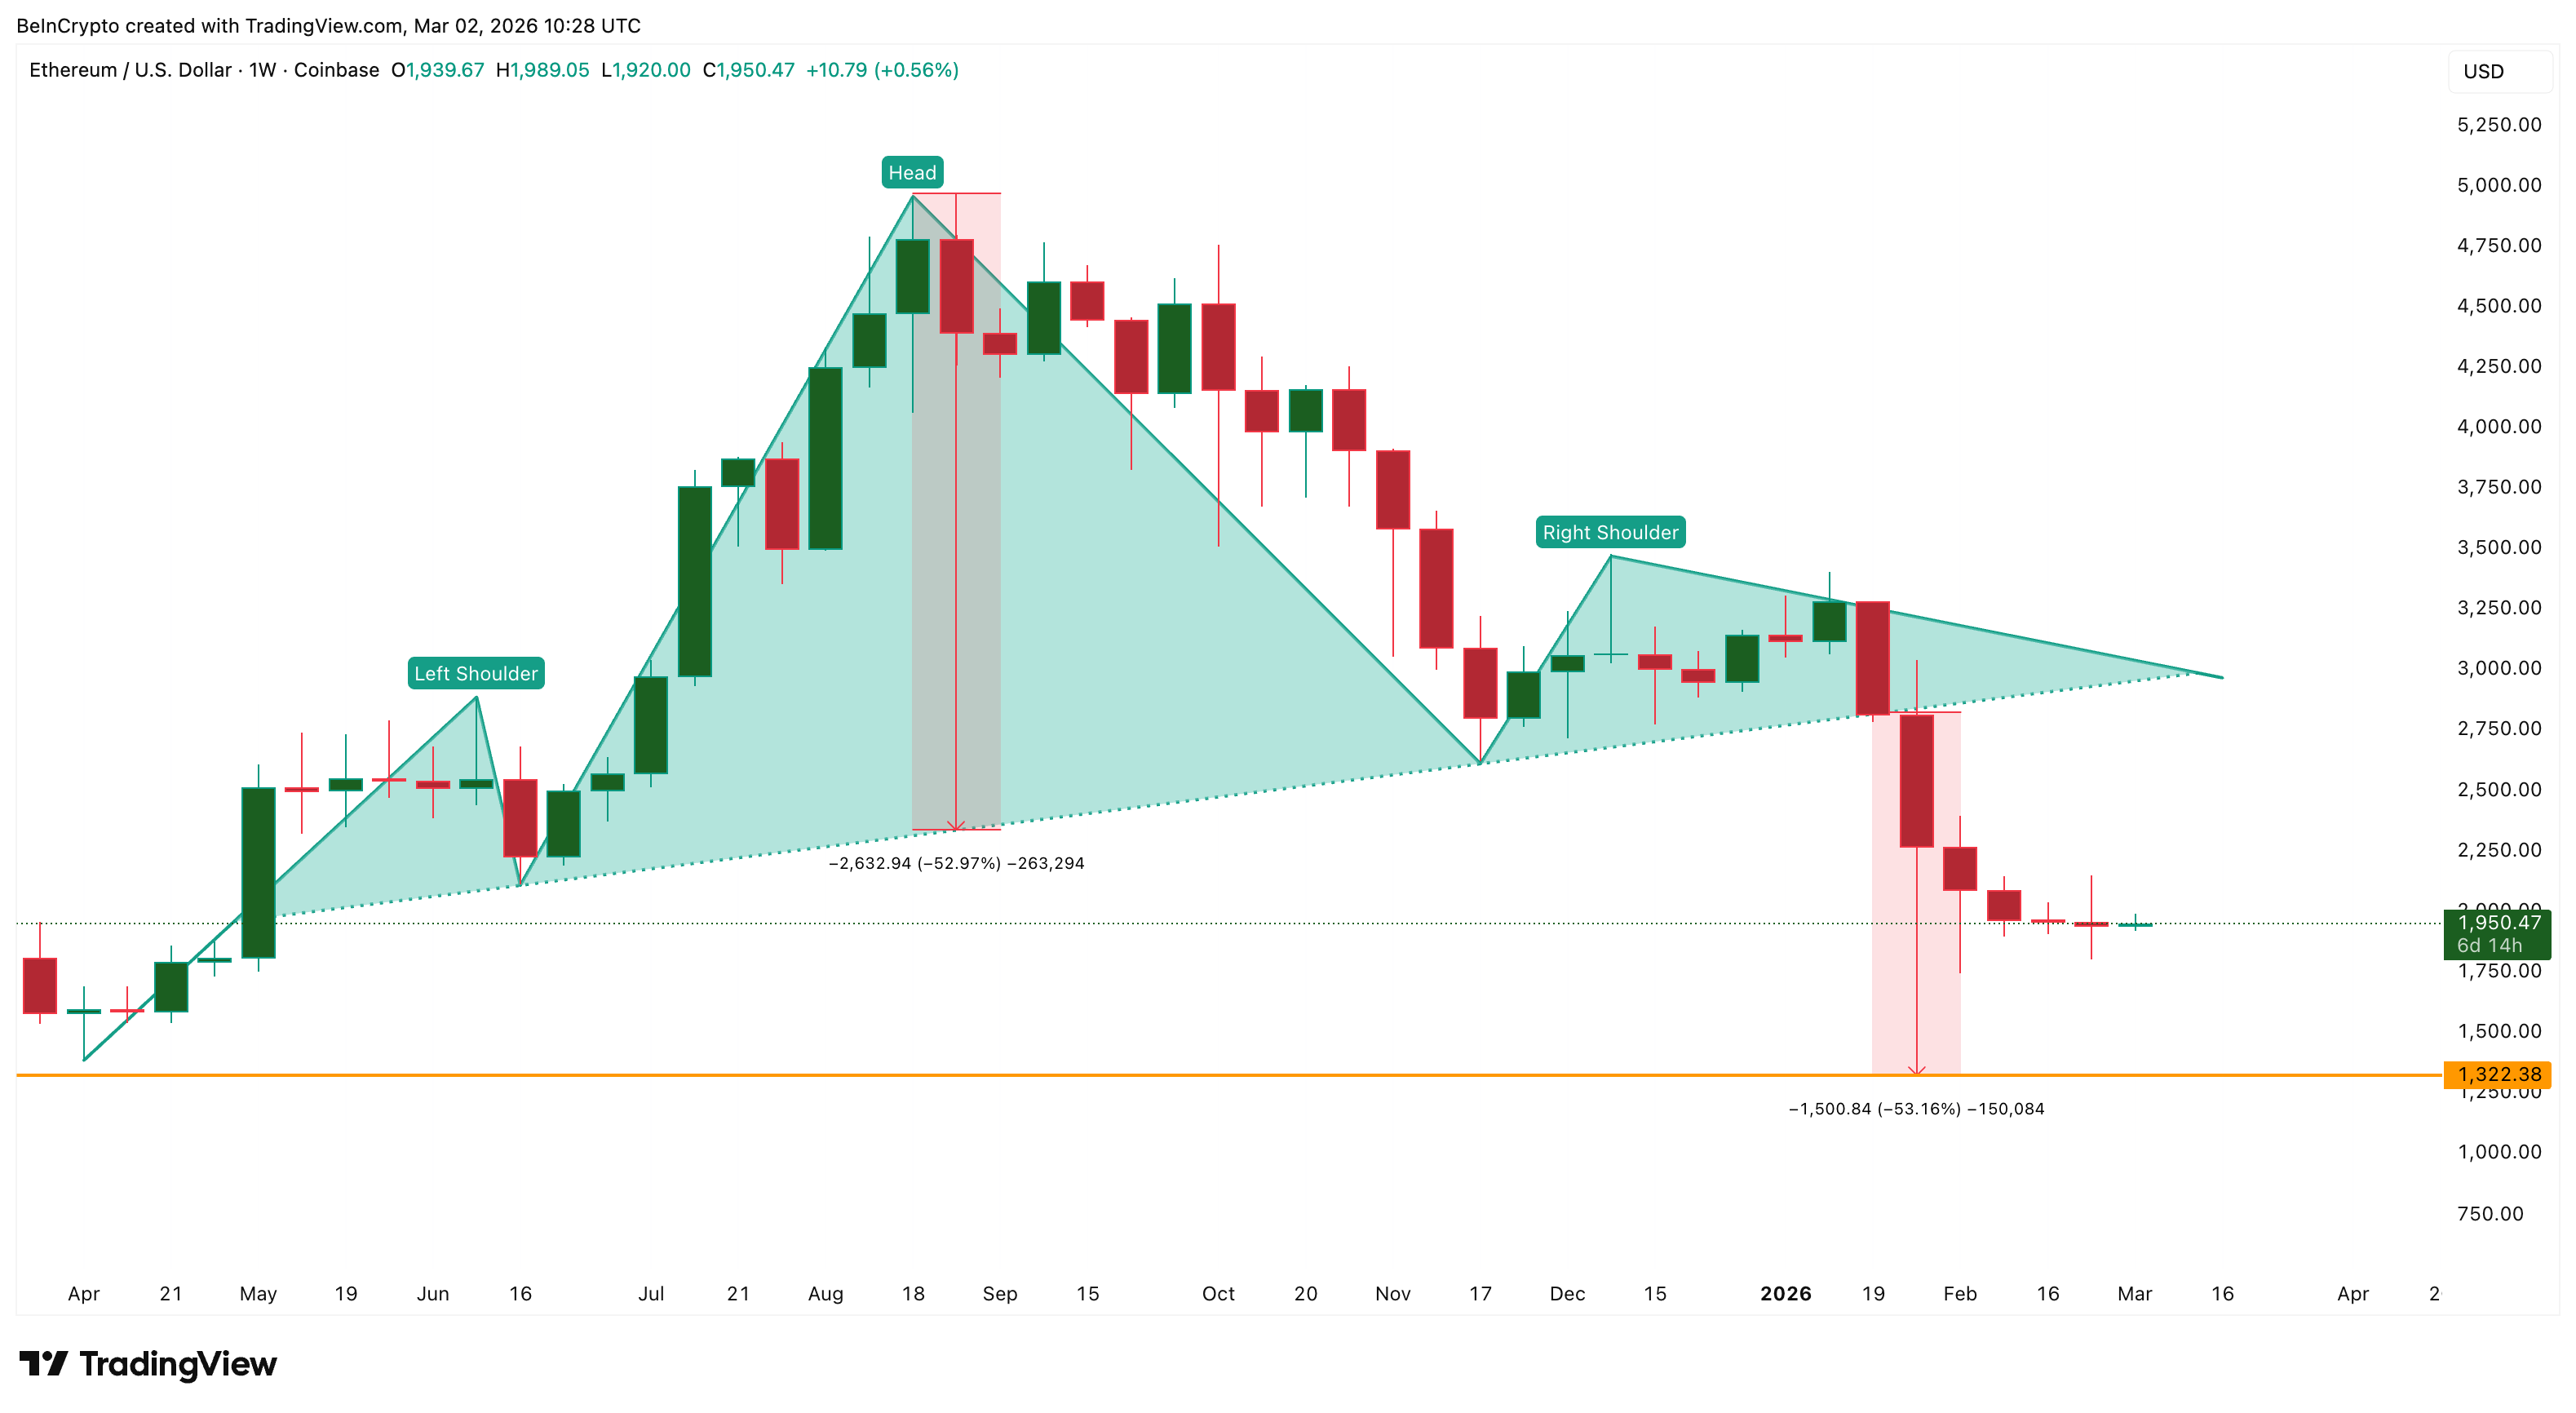
Since April 7, 2025, the Ethereum price has been trading within a head-and-shoulders pattern. It is a bearish reversal structure in which a central peak (the head) is flanked by two lower peaks (the shoulders). The breakdown confirmed in early January 2026, and it was not a minor dip. It was a structural break.
The measured move from this pattern projects a roughly 53% decline from the breakdown line, targeting approximately $1,320. While that level has not yet been reached, the pattern remains active and unresolved.
Making matters worse, two additional bearish crossovers are forming on the weekly Exponential Moving Averages (EMAs), which smooth price data to highlight trend direction.
The 50-period EMA is closing in on the 100-period EMA, and the 20-period EMA is approaching the 200-period EMA. The last confirmed crossover — when the 20 EMA crossed below the 50 EMA in early January — preceded a 46% correction.
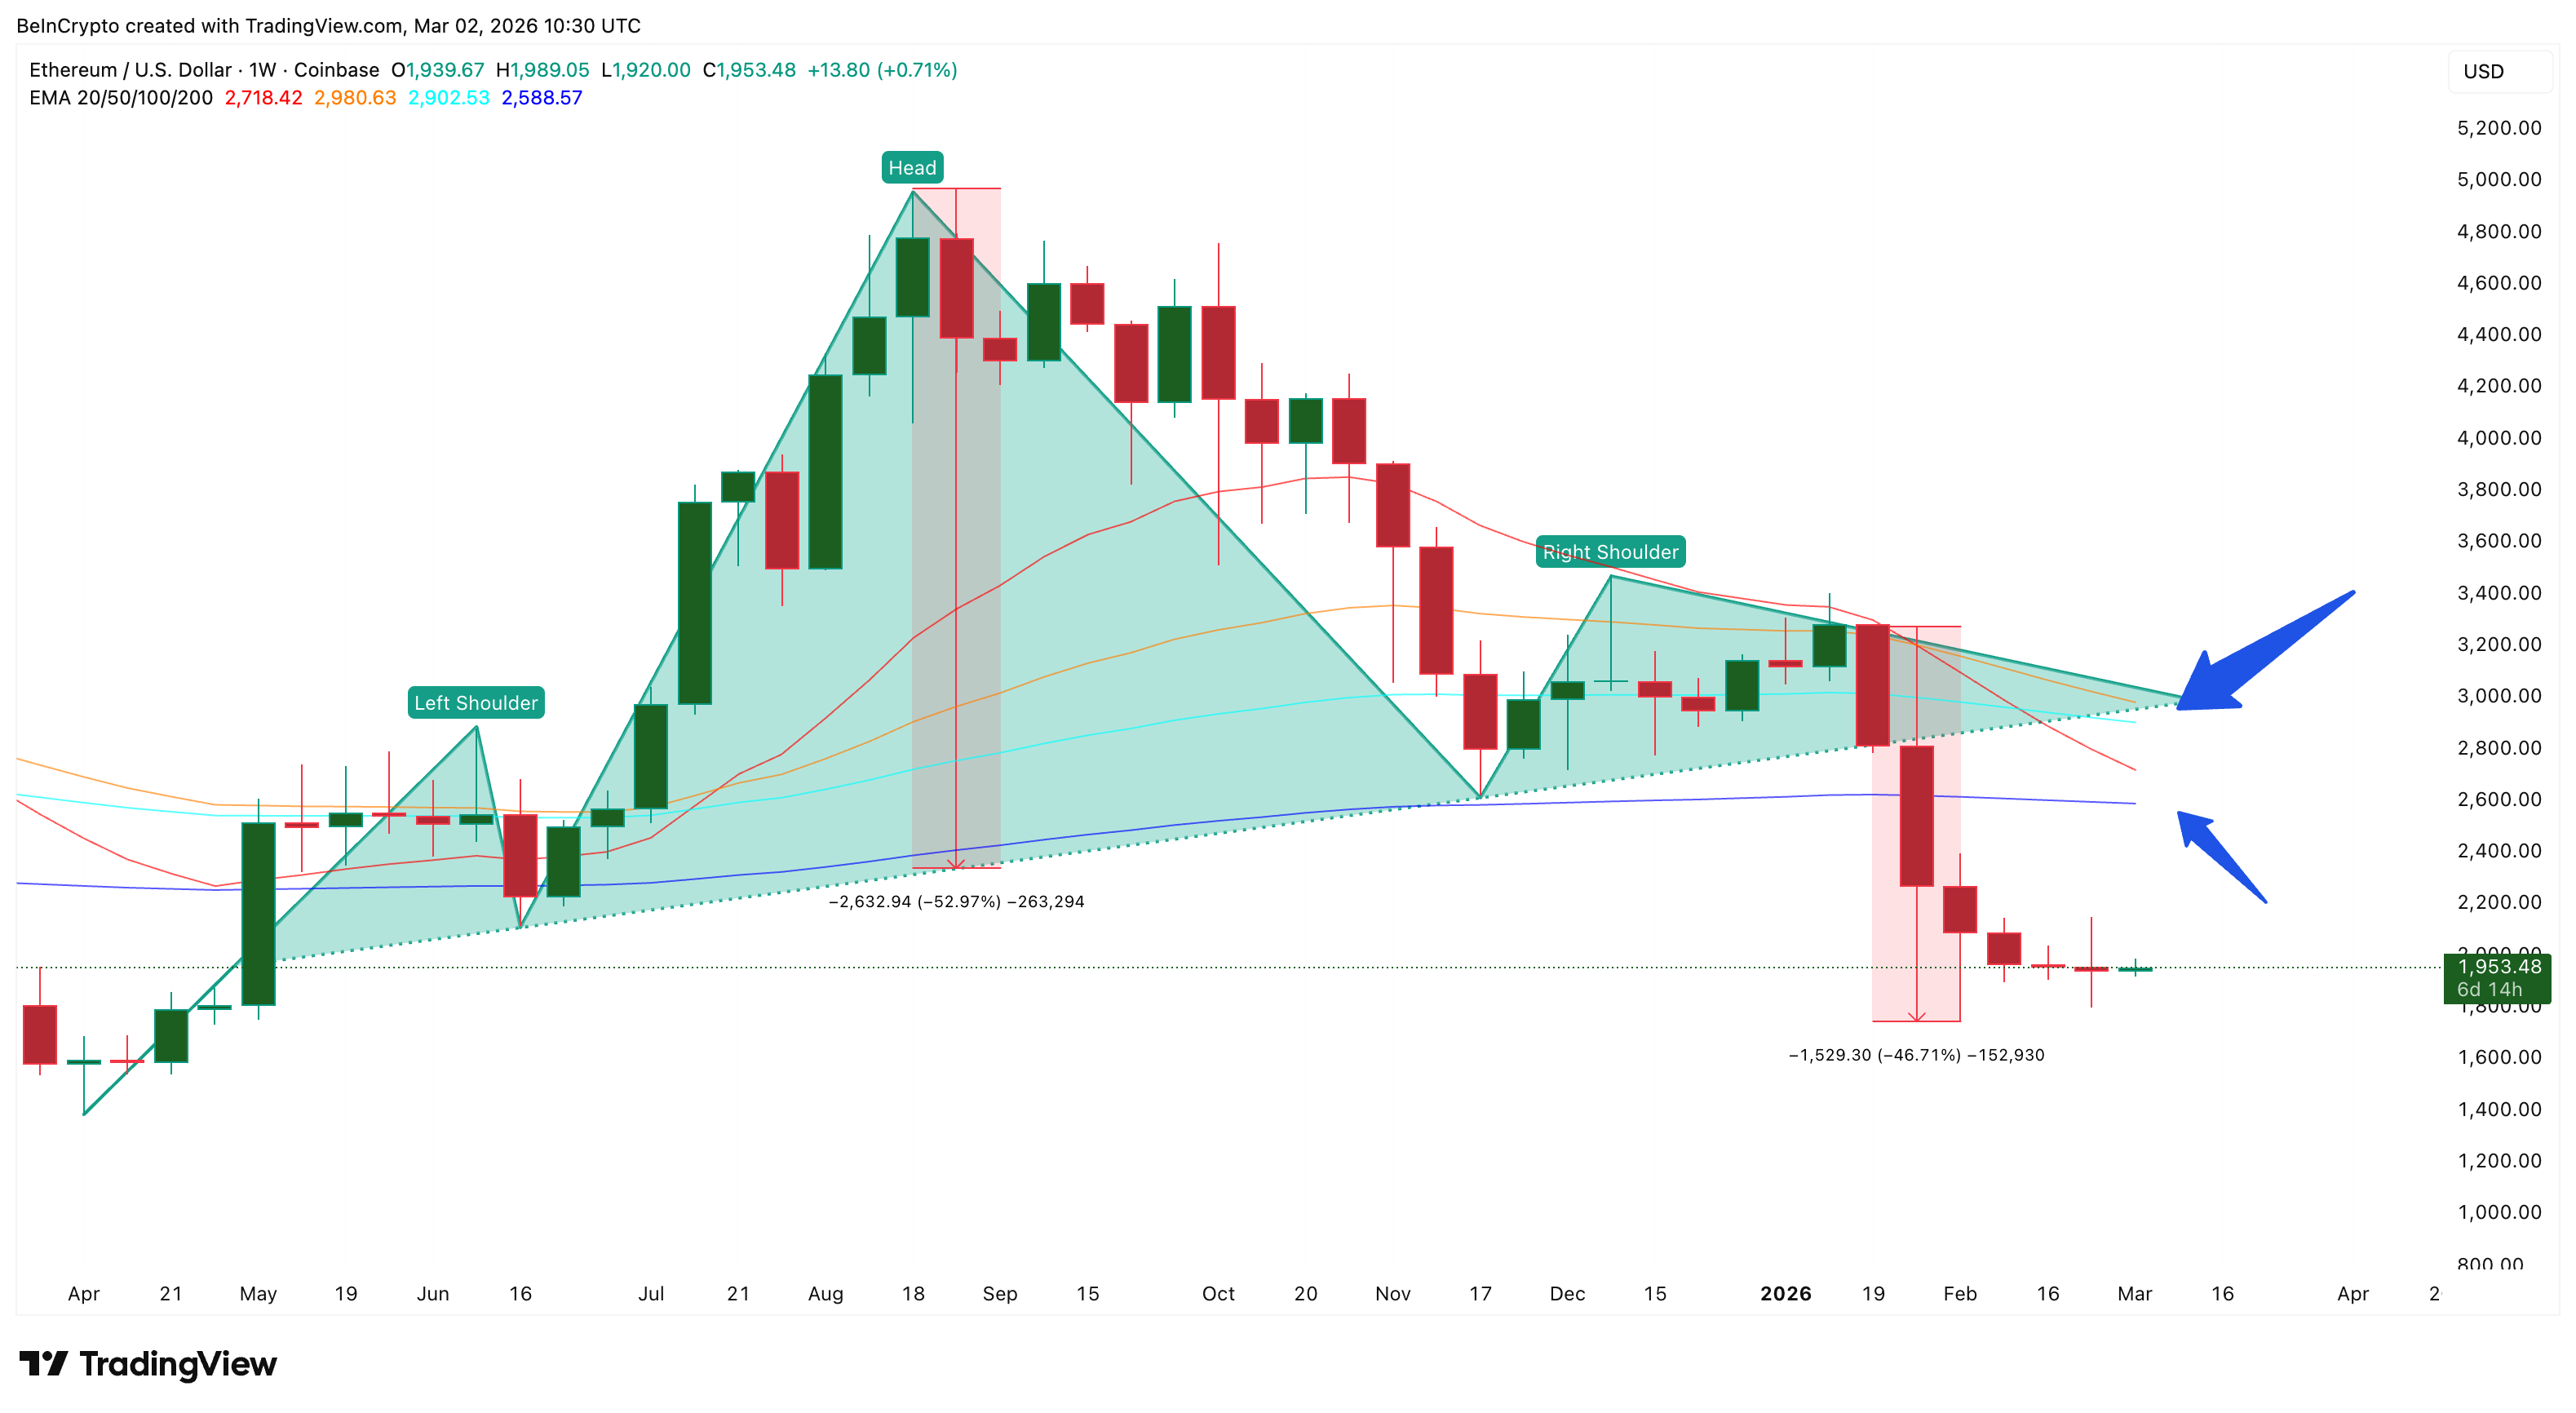
If these new crossovers confirm, they would reinforce the bearish trend on the higher timeframe.
Ethereum ETF Outflows Offer No Institutional Floor
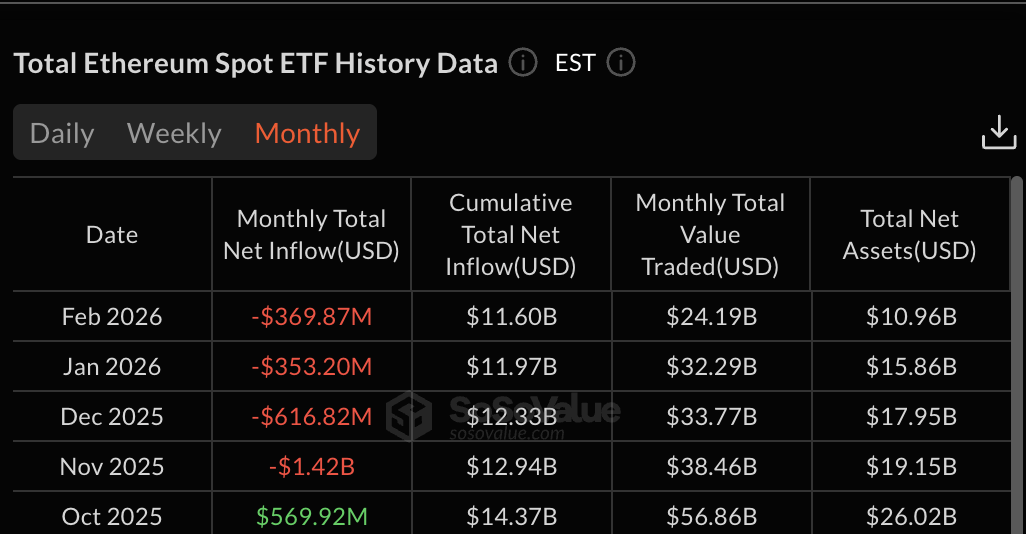
Unlike Bitcoin, where spot ETF outflows have been steadily declining, Ethereum’s ETF picture is deteriorating. February recorded $369.87 million in net outflows — higher than January’s $353.20 million. This reversed the improving trend that had briefly offered hope when January’s outflows shrank compared to December’s $616.82 million.
This marks four consecutive months of outflows since November 2025, when $1.42 billion exited. The last positive inflow month was October 2025 at $569.92 million.
For the Ethereum price, this means there is no institutional demand floor forming heading into March. The capital that once supported ETH through ETF channels is withdrawing, and unlike Bitcoin, the bleeding is not slowing down.
HODLers Are Buying, But The Plot Thickens
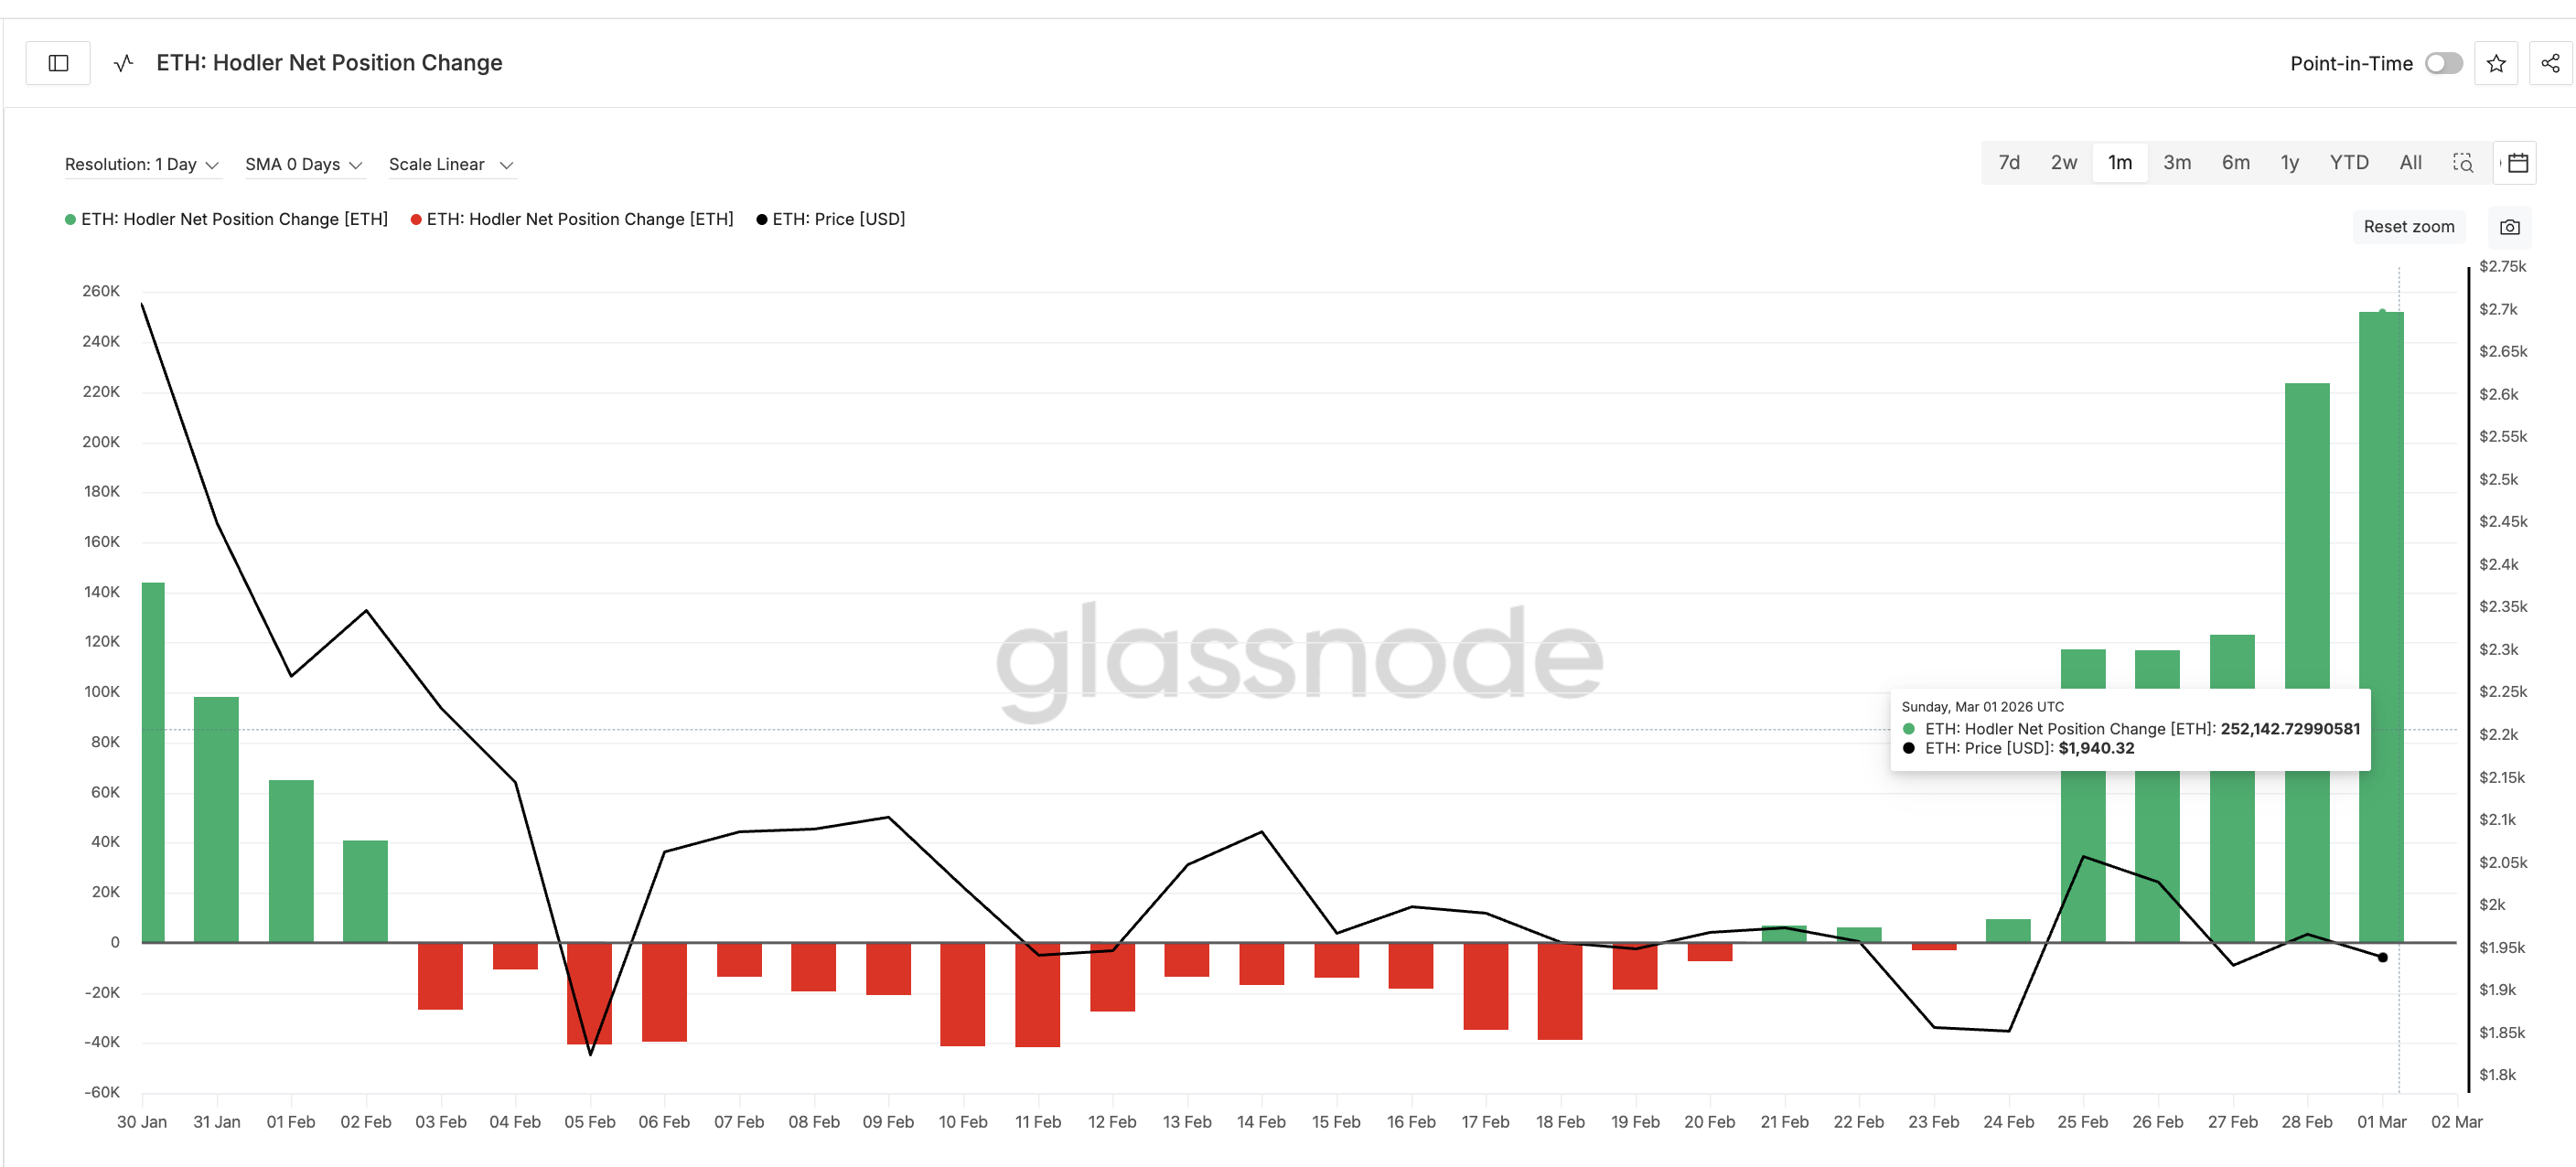
Against this bearish backdrop, one on-chain metric stands out. Ethereum hodlers — wallets that have held ETH for 155 days or more — have sharply increased their buying. On February 21, the hodler net position change metric was a modest +6,829 ETH. By March 1, it surged to +252,142 ETH, a massive 3,500% spike that on the surface looks like strong conviction.
But context complicates this signal. The last major hodler buying spell began on December 26, 2025, when the Ethereum price was around $2,920. They kept accumulating as the price climbed to $3,350 by January 14. Then the weekly EMA crossover triggered, and the price began falling sharply. Hodlers continued buying through the decline. Their net position only turned negative on February 2, when the price had already dropped to $2,340.
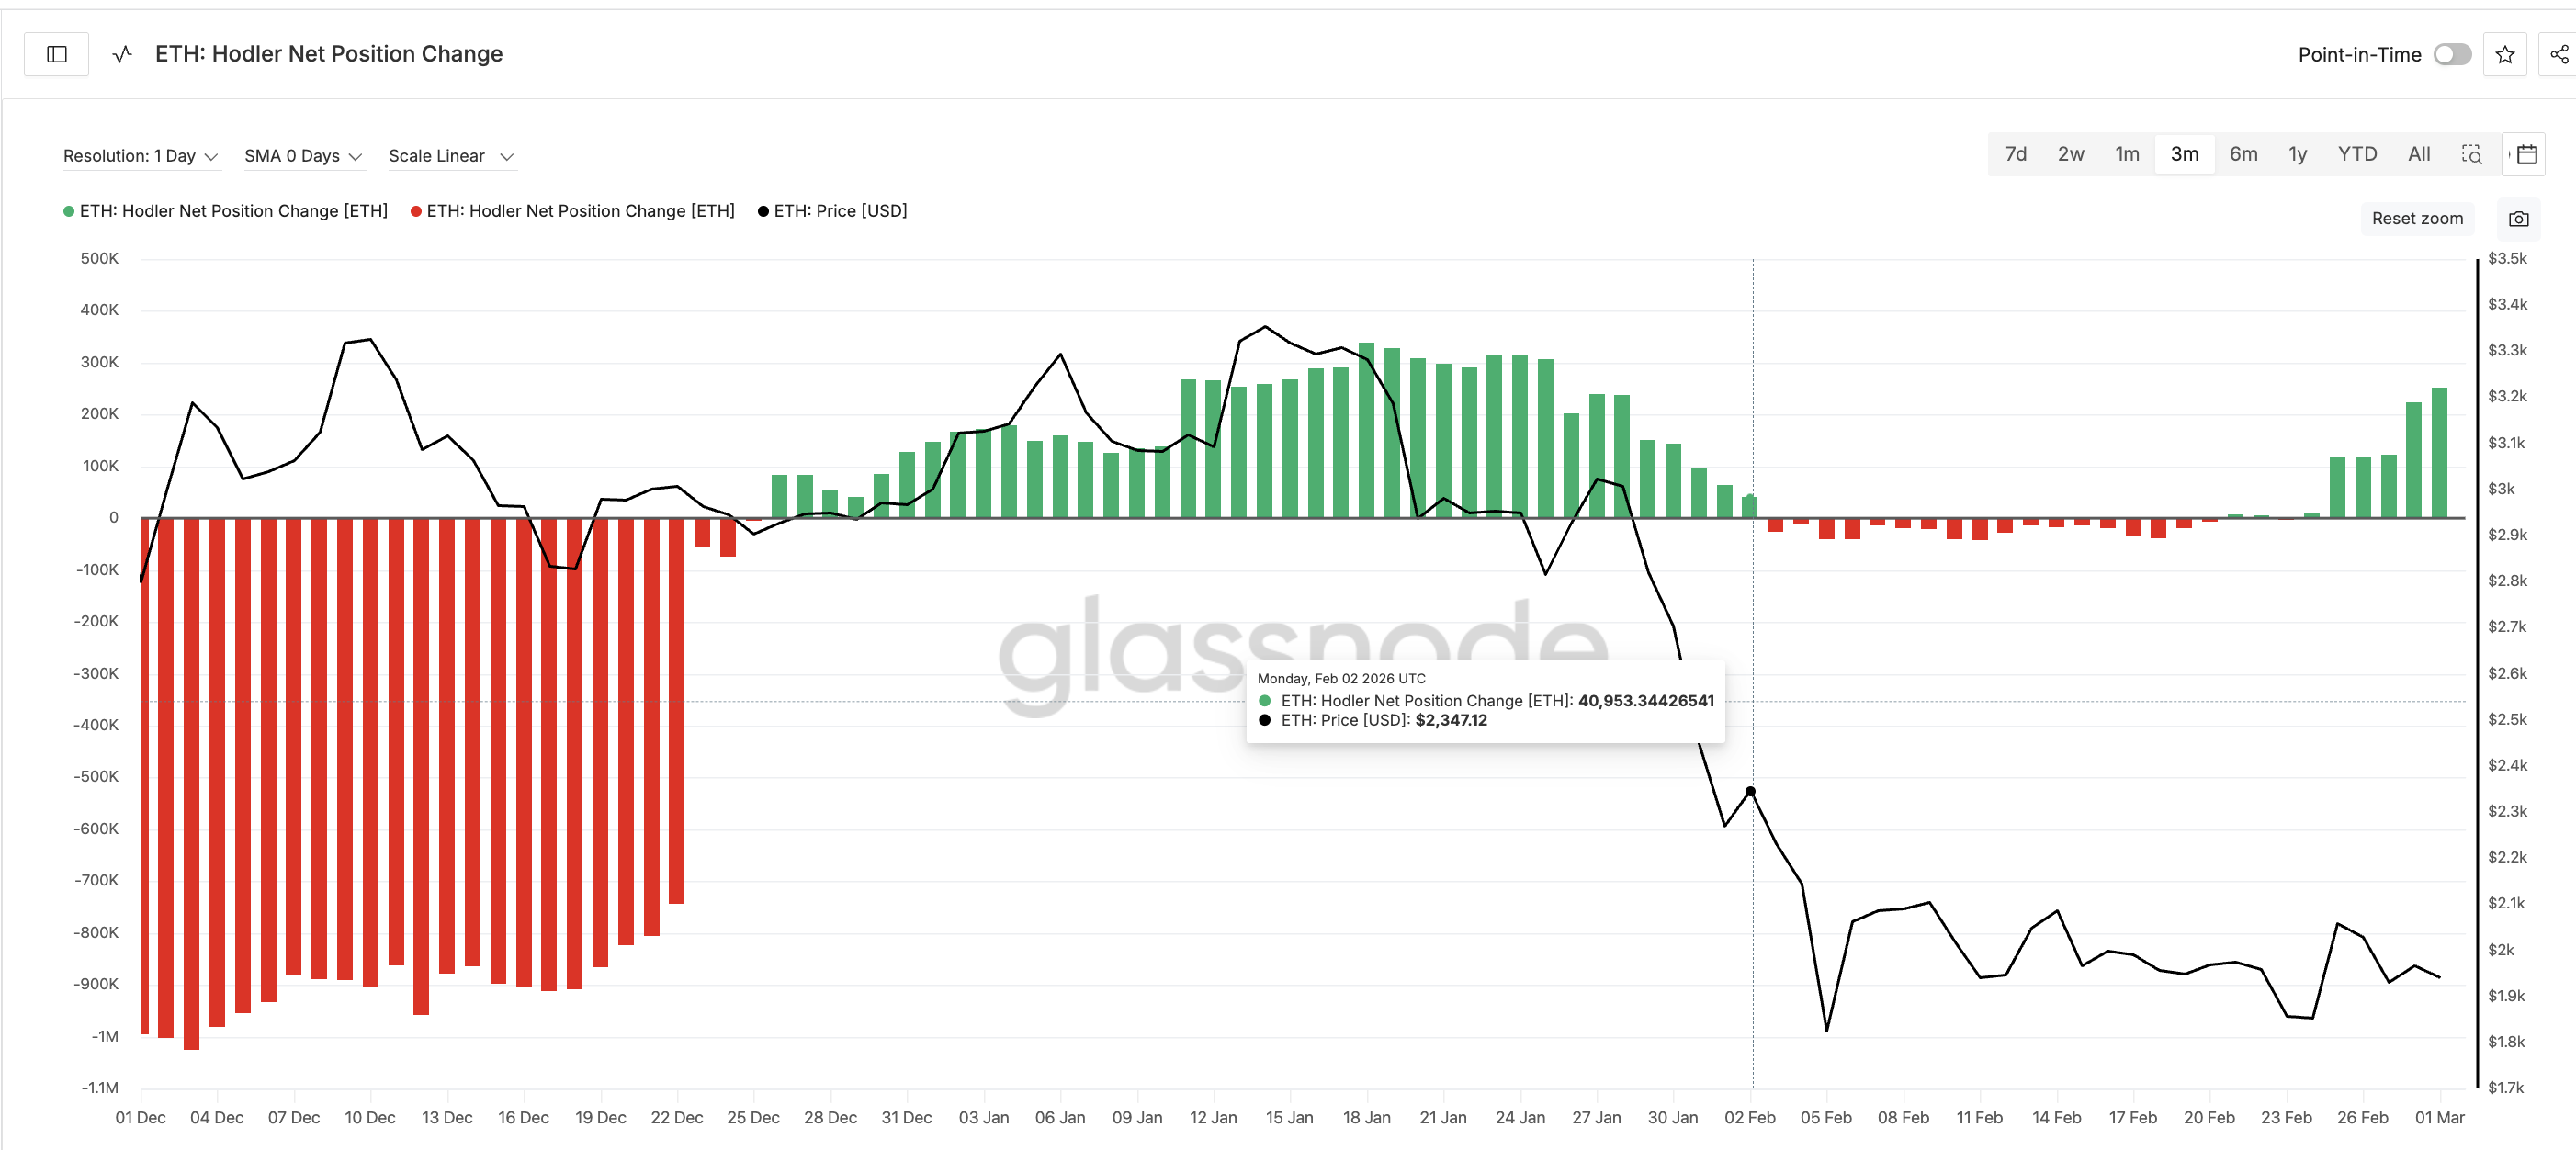
Many of these hodlers are therefore likely trapped between $2,340 and $3,350. The current buying surge may not represent fresh bullish conviction but rather an attempt to average down and break even. Retail investors should be cautious about following this signal blindly — the motivation behind the buying may be survival, not strategy.
But There Is a Reason They Are Buying; And the Key Ethereum Price Levels to Watch
If hodlers are trapped, why are they increasing exposure now, in a weak market? The 12-hour chart may hold the answer.
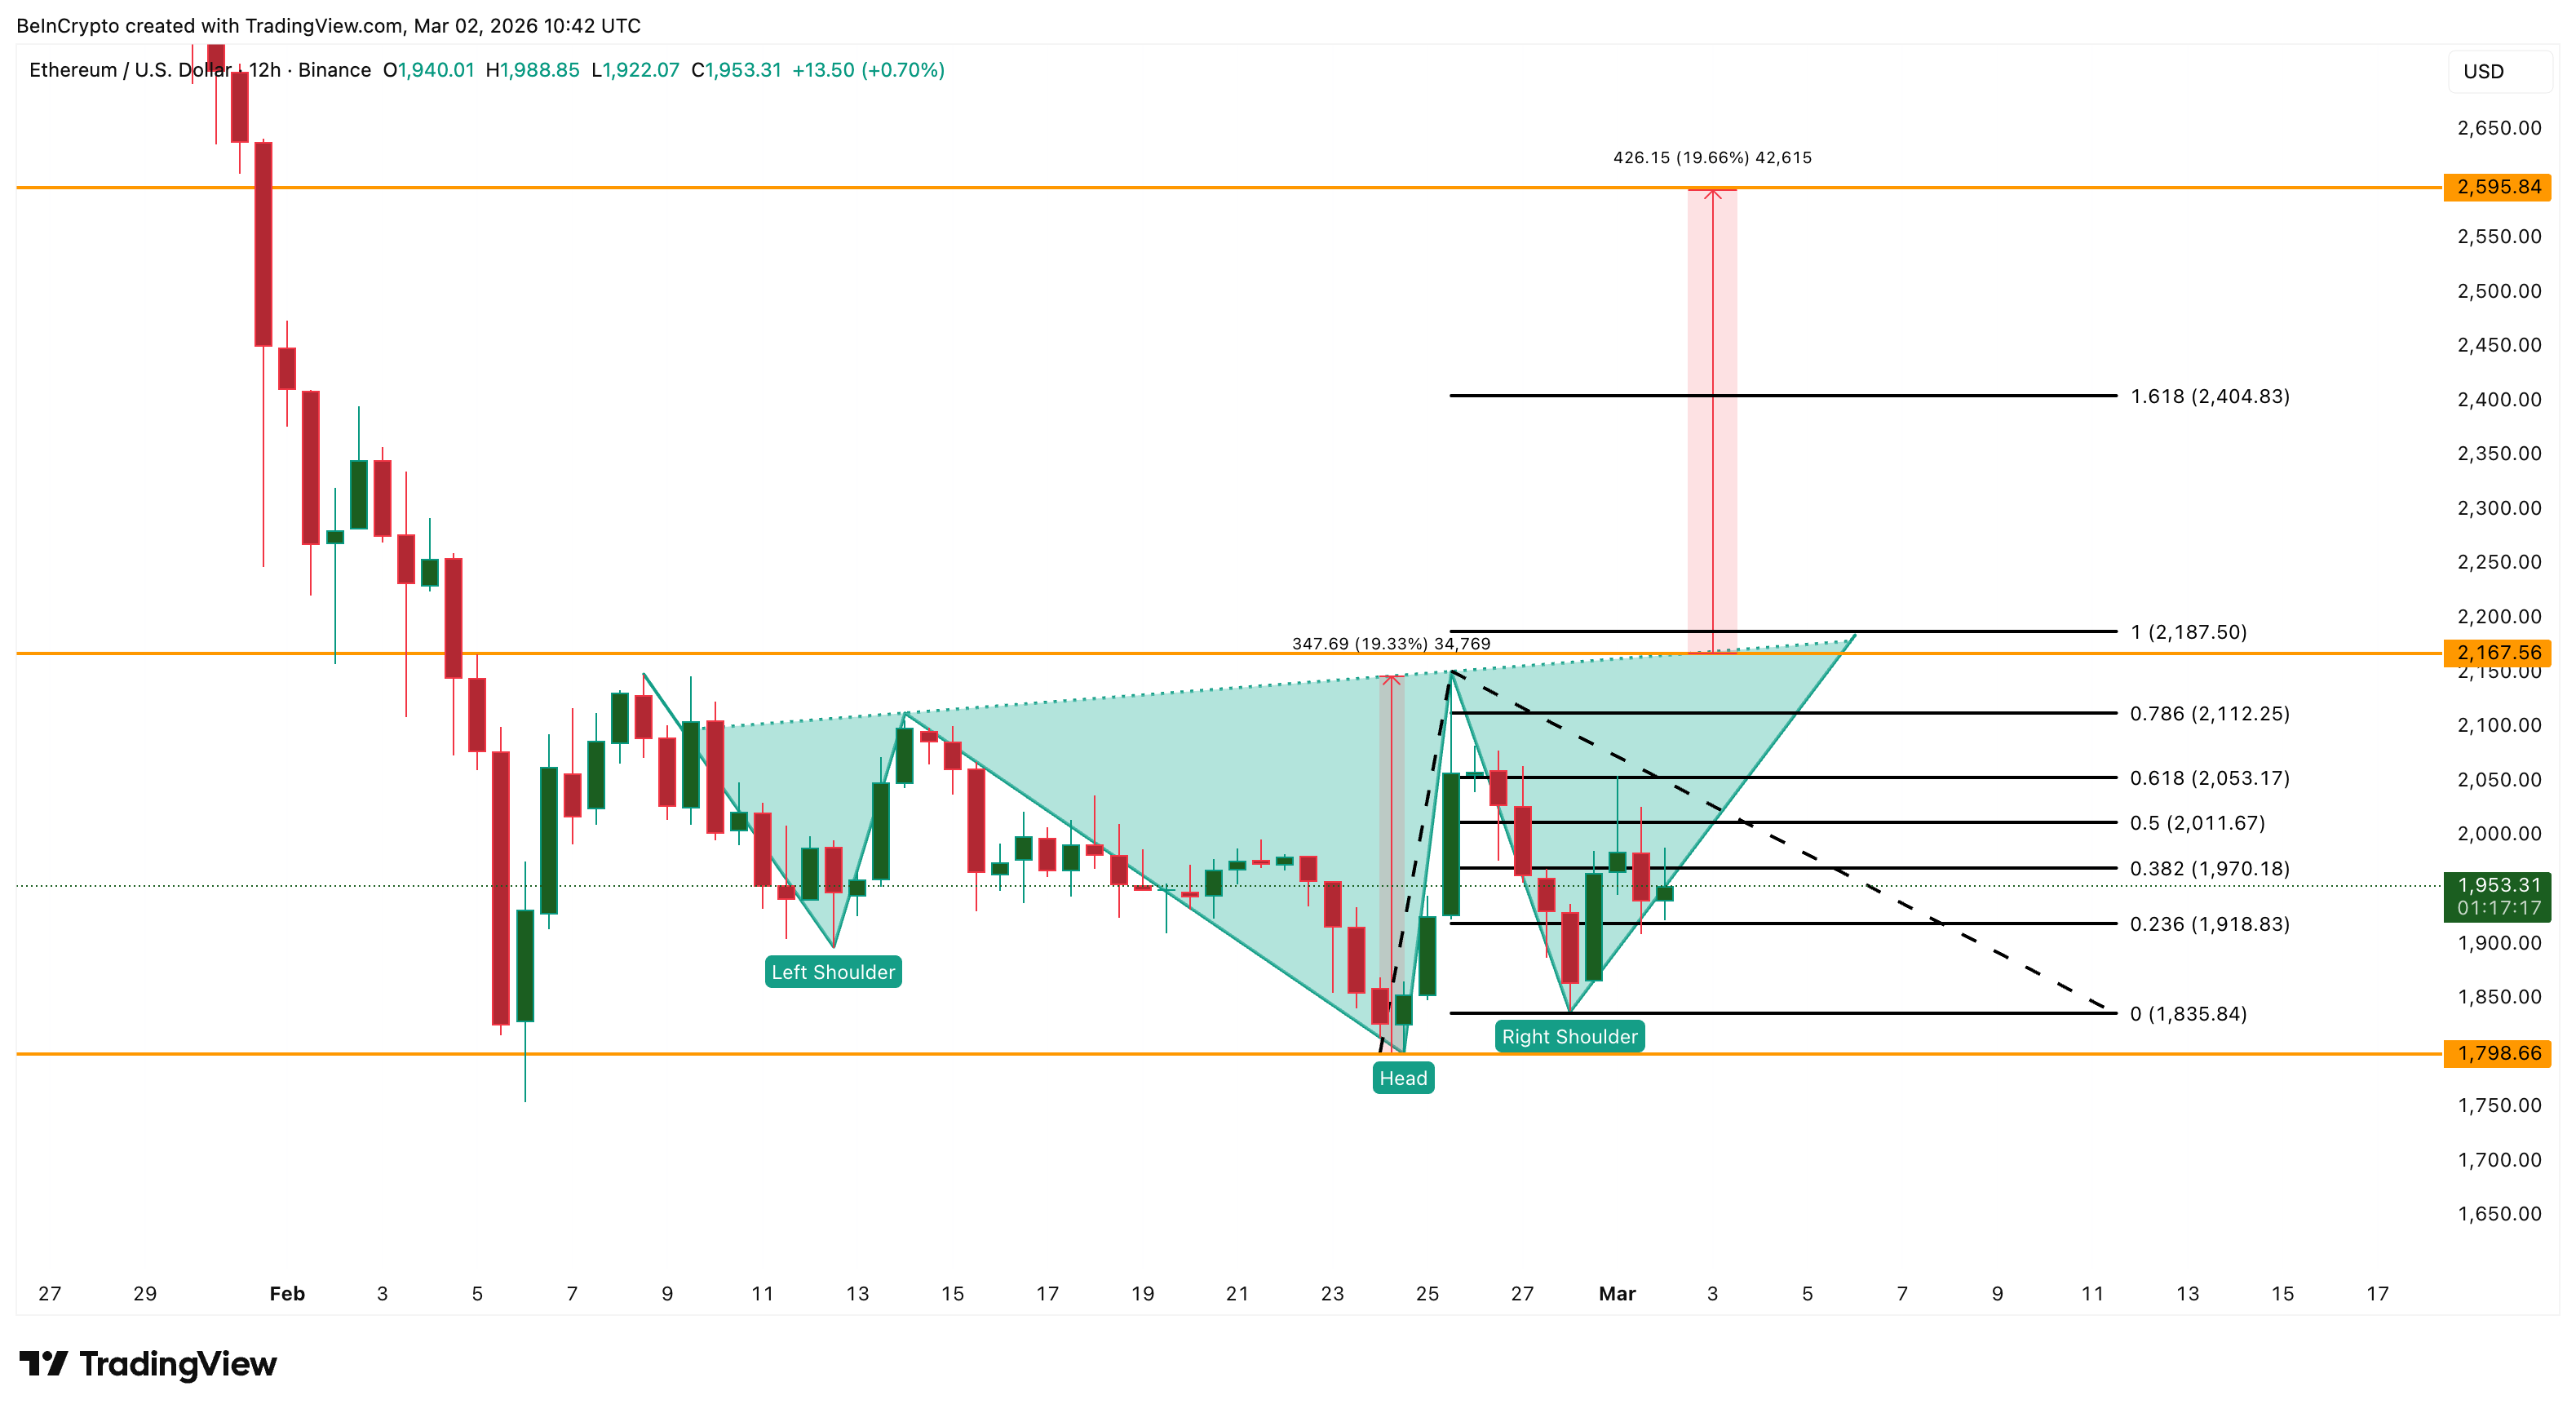
Between February 12 and February 28, the Ethereum price printed a lower low while the Relative Strength Index (RSI) — a momentum oscillator — printed a higher low. This forms a bullish divergence, a signal that selling momentum is weakening even as the price drops. That divergence has already triggered a bounce, with the Ethereum price rallying approximately 11.7% from the lows.
More importantly, this bounce is shaping an inverse head and shoulders pattern on the 12-hour chart; a bullish reversal structure. This is likely what hodlers are positioning for — a short-term breakout that could help them recover losses from the January trap. The technical setup is real, and the RSI divergence has already been validated by the initial bounce.
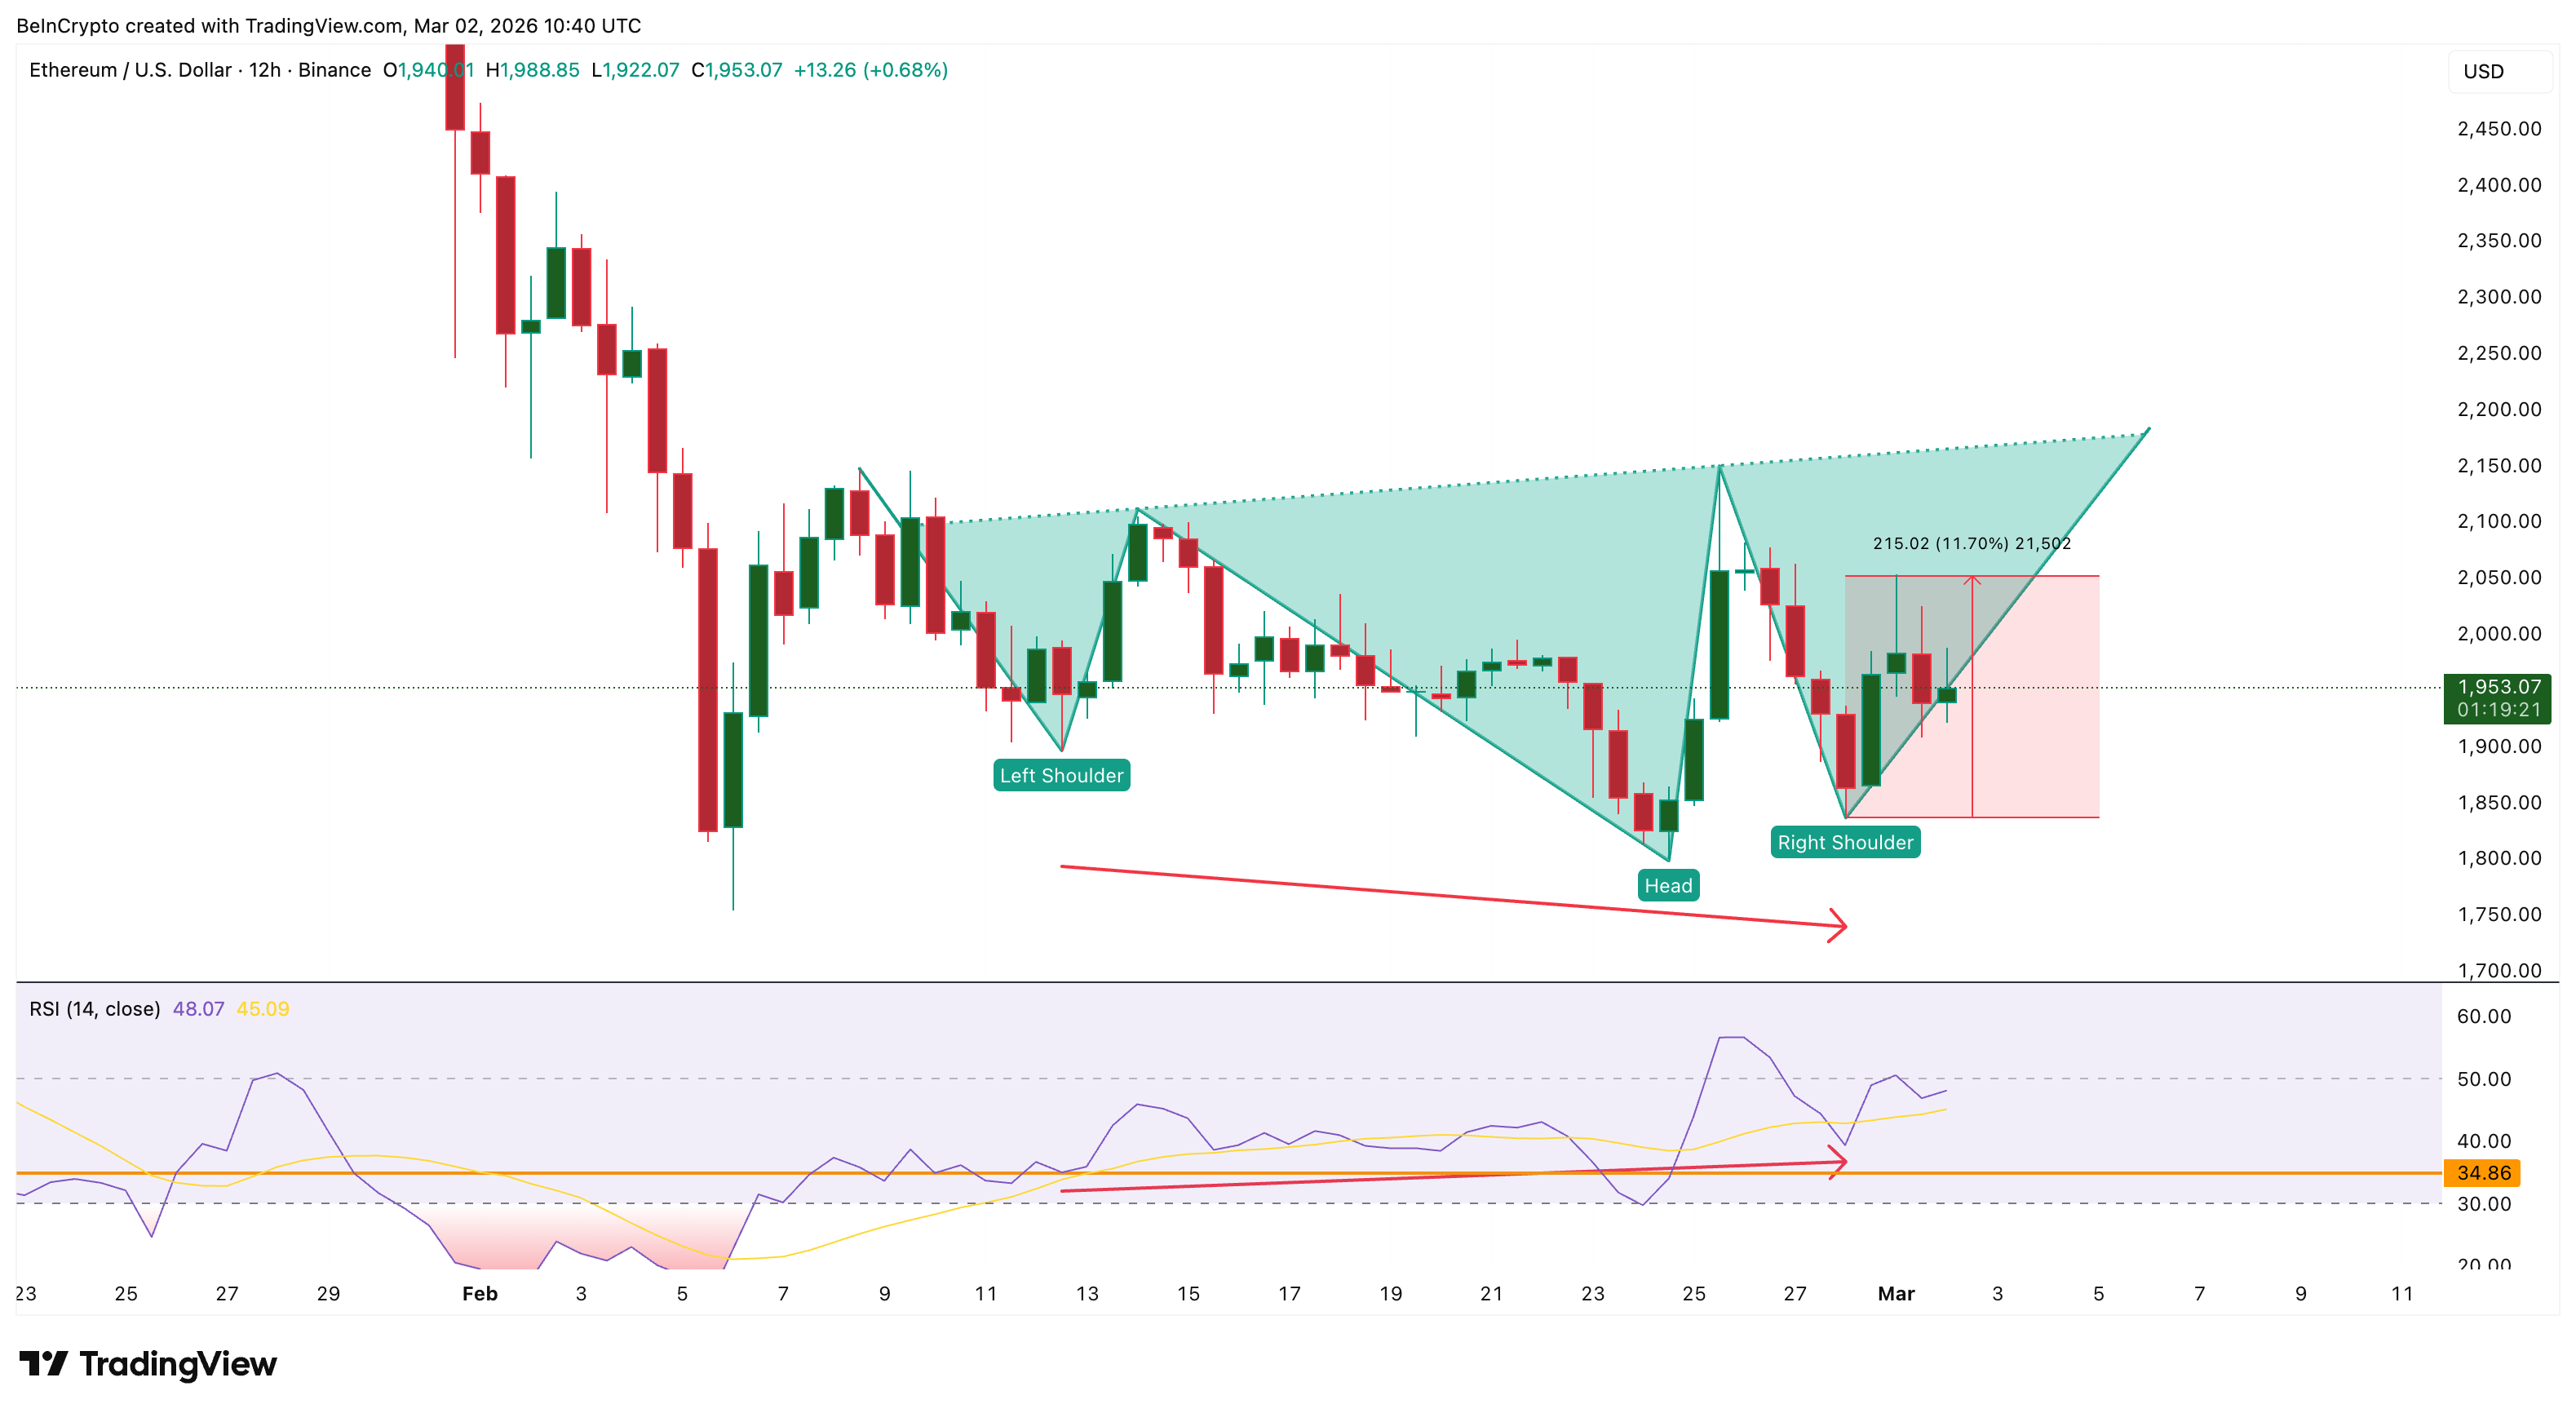
The neckline sits around $2,160–$2,180. If the Ethereum price closes above this level, the measured move projects a roughly 19% rally, targeting approximately $2,590. Before that, the Fibonacci extension levels at $2,050 and $2,400 would serve as intermediate resistance zones.
On the downside, a drop below $1,830 weakens the inverse head and shoulders. A close below $1,790 invalidates the bounce thesis entirely, and the weekly head and shoulders reasserts dominance — placing the $1,320 target back in focus.
The most probable path for March mirrors Bitcoin’s setup: a bounce attempt driven by the 12-hour structure and hodler accumulation, followed by renewed pressure as the weekly trend remains firmly bearish.
The bounce is real, but it is fighting against a much larger breakdown.


The crypto app Pump.fun is taking a significant step beyond its meme-coin roots, announcing broad new trading support that allows users to buy and sell a wider array of tokens directly within the platform.
Summary
- Pump.fun now lets users trade a range of assets including WBTC, USDC, Ethereum (via Wormhole), and other launchpad tokens inside the app.
- The expansion responds to over 1.5M downloads and demand for more diverse on-chain trading without leaving the platform.
- Earlier in 2026, the platform introduced a Trader Cashback model to redirect fees toward active traders, reshaping its fee structure.
From meme coins to Bitcoin: Pump.fun broadens asset support
Previously known primarily as an on-chain Solana memecoin launchpad and token-creator hub, Pump.fun has exploded in popularity thanks to easy coin generation and speculative trading. Over 1.5 million downloads underscore its rapid adoption, and growing user demand for more trading utility has pushed the company to evolve.
In a post shared on social platforms, Pump.fun said that for the first time, users can trade not just its native Pump fun coins, but a broader selection of assets, including WBTC, USDC, Ethereum (via Wormhole), and other launchpad tokens.
The update aims to reduce friction for users who previously had to leave the app to access other assets, consolidating trading activity in one interface. This marks a shift from Pump.fun’s early role as a creator-centric ecosystem, where anyone could spin up a token in minutes, toward a more versatile trading environment.
The push toward supporting mainstream crypto alongside meme tokens comes amid broader changes in Pump.fun’s fee and incentive structure. Last month the platform rolled out a “Trader Cashback” model, letting creators choose whether trading fees benefit deployers or active traders, an effort to reward volume and participation more fairly.
While the platform remains known for speculative assets and memecoins, this expansion could attract more serious traders and bolster liquidity, positioning Pump.fun as more than just a meme-token generator.
Whether broader token support alters user behavior or stabilizes markets will be closely watched across the crypto community.
Bitcoin’s recent price behavior could indicate that crypto selling pressure has begun to wane — though analysts warn there are not yet signs of a reversal from a bear market.
“Bitcoin failed to accelerate lower on risk-off headlines, a signal that downside pressure may be losing momentum,” said 10x Research in a market update on Tuesday.
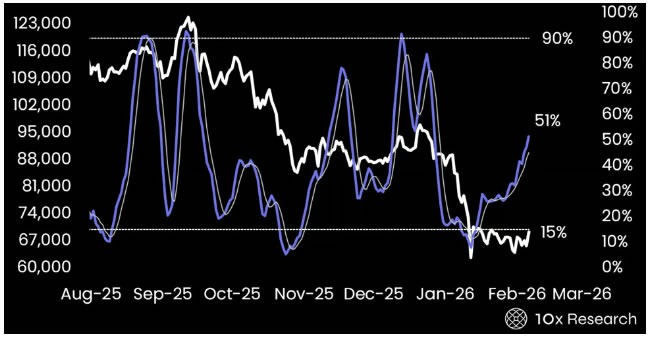
The analysts noted that Bitcoin (BTC) was reclaiming the 20-day moving average near $68,500, and Bollinger Bands were tightening, with conditions “forming for potential range expansion.”
BTC returned to just above $70,000 on Coinbase in late trading on Monday but had retreated to $68,400 at the time of writing, according to TradingView.
The $62,500 level has held on three separate tests, “reinforcing it as meaningful support,” the analysts said.
At the same time, “bullish divergences are emerging,” with both RSI [relative strength index] and stochastic indicators trending higher, “early signs that momentum may be stabilizing even within a broader bearish structure.”

A tactical shift but no structural reversal
The analysts concluded that the evidence “points to a meaningful tactical shift, but not yet a confirmed structural turn.”
Volatility is compressing, ETF flows have strengthened, and the Coinbase discount has disappeared, “these are not characteristics of a market accelerating into a fresh leg lower,” they said.
“However, our broader allocation framework still classifies Bitcoin as being in a bear market regime, meaning any bullish exposure remains tactical rather than structural.”
Related: Crypto analyst says Bitcoin selling pressure is nearly exhausted
Justin d’Anethan, head of research at Arctic Digital, told Cointelegraph on Tuesday that there have been a lot of macro and crypto-native events that have pushed the price down, but lately, “we’ve moved from frantic to somewhat measured,” which bodes well for “a consolidation, accumulation, or at least, a range-bound time.”
“The fact that selling pressure isn’t having that much impact despite tariffs, prospect of a war, or previously disappointing rate cut expectations seems to say that sellers themselves are exhausted or that there are genuine buyers averaging in at these levels.”
Deeply negative funding rates caused a price bounce
Meanwhile, Bitrue research lead Andri Fauzan Adziima told Cointelegraph that Bitcoin’s downside momentum is fading but said it was “primarily due to deeply negative funding rates” on derivatives markets.
This has created “overcrowded short positions in perpetual futures and triggered a classic short squeeze as price bounced sharply from $63,000 lows, forcing heavy liquidations and easing selling pressure through tactical relief.”
Negative funding rates mean that short sellers are paying the longs to maintain their positions.
He added that no confirmed trend reversal has occurred yet “because structural inflows remain absent, macro catalysts are lacking,” and the broader downtrend from the all-time high “persists with fragile liquidity and resistance ahead.”
Magazine: Telegram avoids Philippines ban, yen carry trade now onchain: Asia Express

CoinShares reported $1 billion weekly turnaround, driven by Bitcoin buying and renewed investor appetite across major markets.
Investment products tied to digital assets recorded $1 billion in net inflows last week, reversing a five-week run of $4 billion in outflows. CoinShares said that no single macro event explains the change. Instead, previous price softness, technical breakdowns, and renewed buying activity among major Bitcoin holders appear to have supported the rebound.
Market participants have recently focused more on identifying buying opportunities than on scaling back their exposure.
Global Crypto Funds Recover
According to the latest edition of CoinShares’ Digital Asset Fund Flows Weekly Report, weekly fund flows were dominated by Bitcoin, which brought in $881 million. At the same time, short Bitcoin products drew $3.7 million. Ethereum attracted $117 million, its strongest weekly performance since mid-January, although both assets remain in net outflows for the year.
Solana, on the other hand, posted $53.8 million for the week and $156 million year-to-date. Chainlink gained $3.4 million over the past week, while XRP and Sui added $1.9 million and $0.4 million, respectively. Multi-asset products were the only segment to see withdrawals, with $6 million exiting.
Regionally, sentiment was largely consistent. The United States led with $957 million in new investment. Canada, Germany, and Switzerland added $34.1 million, $31.7 million, and $28.4 million, respectively. Hong Kong recorded $6.8 million, while Brazil brought in $3.2 million.
Geopolitical Shock
Since the ETF flows last week, there has been a sharp deterioration in geopolitical conditions. On Monday, crypto markets remain largely range-bound amid escalating geopolitical tensions, particularly involving Iran. An initial US strike on Iran over the weekend pushed Bitcoin toward about $63,000 and Ethereum below $2,000 before prices pulled back into established trading ranges.
Approximately $300 million of long positions were liquidated when the news broke, a significant but contained amount, which, according to QCP Capital, suggests positioning was already reduced in the days before the event. The firm noted that this could also mean that investors are treating Bitcoin less as a “weekend macro hedge” and considering alternatives such as tokenized gold, which trades 24/7 and has seen increased risk-off interest.
You may also like:
Options markets showed a spike in very short-term volatility but otherwise reacted moderately, which indicates traders may have been relatively well positioned for possible volatility given warning signs during the prior week. QCP pointed to a similar event last June, when BTC dipped on geopolitical news but recovered and later rallied. Options flow data also revealed buyers of call contracts with expiration later in March, which is consistent with some participants gearing up for a rebound.
“Despite price action looking fairly constructive, we remain cautious as tensions and uncertainty continue to build. The conflict is still in its early stages, and it’s premature to conclude whether it will remain contained or evolve into a broader regional confrontation involving other Gulf states.”
Binance Free $600 (CryptoPotato Exclusive): Use this link to register a new account and receive $600 exclusive welcome offer on Binance (full details).
LIMITED OFFER for CryptoPotato readers at Bybit: Use this link to register and open a $500 FREE position on any coin!
The XRP Ledger has slipped in the global ranking of real-world asset tokenization protocols, signaling fresh pressure in a fast-growing market. Recent data places the network outside the top ten chains by on-chain RWA value. The shift highlights rising competition as multiple blockchains race to secure institutional tokenization flows.
XRP Ledger Loses Ground in RWA Rankings
The XRP Ledger now ranks 11th among blockchain networks by tokenized real-world asset value. Data from DeFiLlama shows the chain holds about $61.86 million in RWA market capitalization. This update pushed the network out of the top ten list.
Meanwhile, Plume Network overtook XRP Ledger with $74.02 million in tokenized assets. The change reflects steady inflows to emerging RWA-focused chains. As a result, XRP Ledger lost visibility in a sector it aims to dominate.
The broader tokenization market continues to expand across major layer one networks. Ethereum leads the sector with more than $13.3 billion in on-chain RWA value. Other chains, including BNB Smart Chain, Solana, Arbitrum, and Aptos, hold multi-billion dollar positions.
Ripple Labs Expands Tokenization Efforts on XRPL
Despite the ranking drop, Ripple Labs continues to push tokenization initiatives on the XRP Ledger. The company has introduced network amendments to improve asset issuance and compliance features. These upgrades aim to attract more institutional issuers to the chain.
Ripple Labs recently facilitated the tokenization of $280 million worth of diamonds on the XRPL mainnet. The move added a significant real-world asset category to the ecosystem. It also demonstrated the network’s capacity to support high-value commodities.
Over the past year, Ripple Labs has formed partnerships to expand enterprise adoption. The firm has targeted asset managers and fintech companies seeking blockchain settlement tools. Through these efforts, Ripple aims to strengthen XRPL’s long-term RWA footprint.
RWA.xyz Data Highlights Contrasting Market Views
While DeFiLlama shows a modest valuation, RWA.xyz presents a different assessment of XRPL activity. The platform estimates more than $1.9 billion in tokenized products on the network. This discrepancy underscores differences in tracking methodologies across analytics providers.
Earlier reports indicated that XRP Ledger surpassed Solana in certain tokenization metrics. Those figures reflected asset representation rather than strict on-chain market capitalization. As a result, platform definitions shape how each ranking appears.
The competition for RWA dominance continues to intensify across blockchain ecosystems. Developers across multiple chains now optimize compliance, custody, and settlement tools. Consequently, XRP Ledger faces a more crowded field as tokenization gains global traction.
Real-world asset tokenization has emerged as a central theme in blockchain adoption strategies. Financial institutions increasingly test blockchain rails for bonds, commodities, and funds. Therefore, market share in this segment carries strategic weight.
XRP Ledger entered the tokenization race early, yet rivals have accelerated deployments. Larger ecosystems currently benefit from deeper liquidity and broader developer bases. Even so, XRPL stakeholders continue to position the chain for future growth.
The latest ranking shift reflects short-term metrics rather than structural retreat. However, sustained inflows into competing networks could reshape long-term positioning. For now, XRP Ledger operates in a market where scale and execution define leadership.

BTC swings about 8% in hours after Iran strikes, stays on a 5‑month losing streak as Hayes ties prolonged conflict to future Fed easing.
Summary
- BTC slid from roughly $68k toward $63k on Feb. 28 airstrikes, then rebounded near $68k after reports of Khamenei’s death, an intraday swing of about 8%.
- BTC is on track for a 5th consecutive monthly loss, its longest red streak since 2018, with February down about 14–15% and price nearly 48% off the $126k peak.
- Hayes argues every major US Middle East campaign since 1985 has been followed by Fed easing; he plans to scale into BTC only after clear rate cuts or renewed QE.
BitMEX co-founder Arthur Hayes published an analysis on March 1 examining potential connections between U.S. military involvement in Iran and cryptocurrency markets, according to his essay.
Hayes outlined what he characterized as a four-decade pattern of U.S. intervention in the Middle East followed by Federal Reserve monetary easing. The analysis suggested that extended U.S. engagement in conflict could increase the probability of Fed rate cuts or expanded money supply to finance military operations, which Hayes projected could affect Bitcoin prices.
The essay referenced historical precedents, including the 1990 Gulf War, when Federal Open Market Committee minutes from August of that year stated that “events in the Middle East had greatly complicated the formulation of an effective monetary policy,” preceding rate cuts later that year. Hayes also cited the Federal Reserve’s emergency meeting following the September 11, 2001 attacks, when then-Chair Alan Greenspan reduced rates by 50 basis points, referencing a “heightened degree of fear and uncertainty” affecting asset prices.
Cryptocurrency markets responded to recent geopolitical developments during weekend trading hours when traditional financial markets were closed. Bitcoin declined sharply within minutes of initial reports of strikes on February 28, according to market data. The asset subsequently reversed direction following reports regarding Iranian Supreme Leader Ayatollah Ali Khamenei’s death.
Hayes’ analysis noted that every U.S. president since 1985 has conducted military operations in the Middle East, with subsequent financial impacts addressed through monetary policy adjustments.
“The longer Trump engages in the extremely costly activity of Iranian nation-building, the higher the likelihood the Fed lowers the price and increases the quantity of money to support Pax Americana’s latest bout of Middle Eastern adventurism,” Hayes wrote in the essay.
Bitcoin has recorded five consecutive months of losses, a streak last observed in 2018, according to market data.
Hayes recommended a cautious trading approach given uncertainty regarding the duration of U.S. engagement and market tolerance levels. The former BitMEX CEO suggested that optimal purchasing opportunities for Bitcoin and other cryptocurrency assets would occur after the Federal Reserve implements rate cuts or resumes quantitative easing measures to support government objectives in Iran, rather than during initial conflict periods.
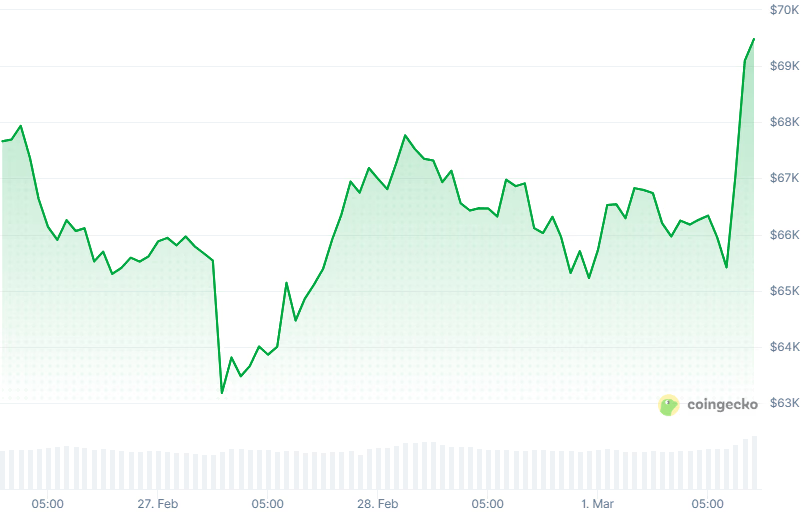
After dropping over the weekend, total crypto market capitalization is up 3.5% to $2.43 trillion.
Crypto markets are starting the week in the green despite the ongoing conflict in the Middle East, with most major altcoins posting gains.
Bitcoin (BTC) is trading at around $69,000, up nearly 5% over the past 24 hours, after reaching as high as $70,100 earlier in the day. Meanwhile, ETH and SOL are up 4% at $2,050 and $87, respectively, and BNB is up 3% on the day.

The overall crypto market capitalization is up 3.5% at $2.43 trillion, according to Coingecko.
The rebound comes after crypto markets initially sold off sharply over the weekend as the U.S. and Israel conducted a series of airstrikes against Iran, killing its head of state and high-ranking military commanders. Iran subsequently retaliated against its U.S.-allied neighbors, sparking fears of a wider war.
Most of the Top 100 digital assets posted gains over the last 24 hours.
Top gainers include Near Protocol (NEAR), MORPHO, and Ethena (ENA), which rallied 14%, 12% and 10%, respectively.
Polygon (POL) and Canton (CC) are today’s biggest losers, down around 3%.
Around 112,000 leveraged traders were liquidated for $437 million in the past 24 hours, according to CoinGlass. Bitcoin accounted for $182 million, while ETH positions made up $114 million.
Elsewhere, U.S. stocks reversed pre-market losses to trade relatively unchanged on the day, while precious metals pulled back. Gold is changing hands at $5300/oz, while silver fell 7% to $87/oz.

✨ AI Summary
- Telegram has transformed into a robust platform for interactive applications and games, with businesses leveraging its low-friction entry to digital gaming ecosystems
- To successfully launch a Telegram game, structured planning, scalable architecture, and reliable development processes are essential
- Understanding the target audience, gameplay concept, user acquisition strategy, and monetization approach is crucial before embarking on development
- Telegram supports various game formats, including tap-to-earn games for rapid user growth, strategy and simulation games for deeper engagement, and utility-based games for functional purposes
- A well-designed architecture comprising a Telegram bot interface, backend services, databases, and integrations is necessary for stability and scalability.
Telegram has evolved from a messaging application into a powerful distribution platform for interactive applications and games. With millions of users interacting daily with bots and mini-apps, businesses are increasingly viewing Telegram as a low-friction entry point into digital gaming ecosystems. Compared to traditional mobile app stores, Telegram allows faster deployment, simplified onboarding, and direct user engagement.
However, successfully launching a Telegram game requires more than building a simple bot. Businesses need structured planning, scalable architecture, and reliable development processes. Companies that treat Telegram games as serious digital products instead of just experimental tools are the ones that achieve sustainable growth.
This guide explains how businesses can launch a Telegram game successfully and why many organizations choose to work with a professional Telegram game developer or hire a Telegram game development company to reduce risk, accelerate deployment, and get successful results.
Reasons Behind the Rapid Growth of Telegram Games
Telegram games have become increasingly popular because they remove many of the barriers associated with traditional game distribution. Users do not need to install applications, create accounts, or complete lengthy onboarding processes. Games can be accessed instantly through Telegram chats and mini-app interfaces.
Businesses are attracted to Telegram games for several strategic reasons:
- Instant user access without app downloads
- Lower user acquisition friction
- Global reach through Telegram’s user base
- Integrated social engagement features
- Faster product launch timelines
Telegram also provides built-in communication channels that allow developers to engage users directly. Notifications, community groups, and automated messaging create continuous engagement opportunities. These advantages make Telegram an attractive platform for startups and enterprises looking to launch new gaming products efficiently.
What Businesses Need Before Launching a Telegram Game
Prior to hiring Telegram mini game development services, businesses should define clear objectives and product requirements. Many Telegram game projects fail because teams begin development without a well-defined strategy.
Successful projects typically start with clarity in the following areas:
- Target audience definition
- Core gameplay concept
- User acquisition strategy
- Monetization approach
- Technical requirements
- Growth expectations
Businesses should also determine whether the game will function as a marketing tool, a revenue-generating product, or part of a larger digital ecosystem. This decision plays a significant role in affecting both development scope as well as technical architecture. A structured planning phase helps reduce development delays and prevents costly redesigns later.
Types of Telegram Games Businesses Can Launch
Telegram supports multiple game formats, allowing businesses to opt for models that best align with their objectives.
1. Tap-to-Earn Games
Tap-to-earn games are among the most popular Telegram formats. Players interact with simple mechanics such as tapping or clicking to accumulate points or rewards. These games typically feature:
- Simple gameplay mechanics
- Quick user sessions
- High retention potential
- Viral sharing features
- Reward-driven engagement
Tap-to-earn models are particularly effective for rapid user growth.
2. Strategy and Simulation Games
More advanced Telegram games include strategy mechanics and simulation-based gameplay. These games encourage longer engagement sessions and deeper player involvement. These games often include:
- Resource management systems
- Player progression mechanics
- Leaderboards
- Competitive elements
- Seasonal events
Strategy-based games typically generate stronger long-term retention.
3. Utility-Based Telegram Games
Some Telegram games serve functional business purposes beyond entertainment. These games may be part of loyalty programs or digital ecosystems. A few examples include:
- Reward-based engagement platforms
- Community participation games
- Promotional campaigns
- Brand engagement tools
Utility-driven games often align closely with business objectives.
Telegram Game Architecture Overview
Behind the simple user interface of a Telegram game lies a structured technical architecture. Proper architecture design ensures stability and scalability as user numbers grow. A typical Telegram game architecture includes several key components:
1. Telegram Bot Interface
The Telegram bot acts as the primary interface between users and the game. It handles commands, user interactions, and message flows. Bot responsibilities include:
- User authentication
- Command processing
- Gameplay interactions
- Notifications
- Event triggers
Efficient bot design is essential for smooth gameplay experiences and this is where a professional Telegram game developer comes to the rescue.
2. Backend Services
Backend services manage game logic and store player data. These systems ensure that gameplay remains consistent across sessions. Backend services typically include:
- Game logic processing
- User data storage
- Progress tracking
- Event management
- Leaderboard calculations
Scalable backend architecture is critical for handling large numbers of concurrent users.
3. Databases
Databases store player progress, achievements, and activity history. Reliable data storage ensures consistent gameplay and prevents data loss. Typical database functions include:
- Player profiles
- Game progress tracking
- Inventory management
- Session history
- Analytics data
High-performance databases improve responsiveness and stability.
4. APIs and Integrations
Telegram games often integrate with external systems to extend functionality. Some of the major integrations include:
- Payment systems
- Analytics platforms
- Reward systems
- Wallet integrations
- CRM tools
Integrations allow Telegram games to operate as part of broader digital ecosystems.
From Idea to Launch: Building Telegram Games That Scale
Telegram Mini Game Development Services Explained
Professional telegram mini game development services cover the full lifecycle of Telegram game creation. Businesses working with experienced teams gain access to structured development processes and technical expertise. The major services include:
- Game concept development
- Bot architecture design
- Backend development
- UI/UX design
- Analytics integration
- Performance optimization
- Deployment support
These services help businesses launch stable and scalable games without managing complex technical workflows internally.
Step-by-Step Guide for Launching a Telegram Game
Top-rated Telegram mini game development services follow a structured development process that improves launch success and reduces technical risks.
Step 1 — Discovery and Planning
The project begins with defining requirements and technical scope. Teams align on gameplay mechanics and system architecture. This step includes:
- Feature definition
- Technical planning
- Timeline estimation
- Architecture decisions
- Risk assessment
Step 2 — Prototype Development
Versatile Telegram game developers usually build an early version of the game to validate gameplay mechanics. Prototype development includes:
- Core gameplay loop
- Basic bot interactions
- Initial UI design
- Functional testing
This stage confirms that the concept works before full development begins.
Step 3 — Full Development
During this phase, the complete game is built and integrated with backend systems. Development typically includes:
- Gameplay implementation
- Database setup
- API integrations
- UI improvements
- Performance optimization
Step 4 — Testing and Optimization
Testing ensures that the game performs reliably under real-world conditions, which includes:
- Load testing
- Bug fixing
- Performance tuning
- Security validation
Step 5 — Launch and Scaling
After launch, teams monitor performance and optimize user experience. Post-launch work includes:
- Analytics monitoring
- Gameplay improvements
- Feature updates
- Infrastructure scaling
Common Mistakes to Avoid While Launching Telegram Games
Many Telegram game launches fail because teams underestimate technical complexity. Some of the most common mistakes include:
- Building without scalable backend systems
- Ignoring analytics integration
- Poor user onboarding
- Weak gameplay loops
- Inadequate testing
Avoiding these mistakes significantly improves launch success. When you plan to hire a Telegram game development company with proven expertise in this field, these mistakes are dealt with in the right way to ensure a successful launch.
Timeline Expectations
Telegram games can be launched faster than traditional mobile games. However, realistic timelines still matter. Typical development timelines include:
- Basic games: 3–5 weeks
- Mid-scale games: 6–10 weeks
- Complex games: 10–16 weeks
Timelines depend on features, integrations, and architecture requirements. Working with experienced teams typically reduces development delays.
Why Businesses Hire Professional Telegram Game Developers
Many businesses choose to hire professional Telegram game developers instead of building internal teams since they provide:
- Proven development workflows
- Faster deployment timelines
- Reliable architecture
- Performance optimization
- Post-launch support
Experienced developers play a pivotal role in avoiding costly technical mistakes and ensure a successful launch.
Choosing the Right Telegram Game Development Company
Selecting the right partner is critical for long-term success. Businesses planning to hire a telegram game development company should evaluate both technical capabilities and delivery experience. Key factors to evaluate include:
- Experience building Telegram games
- Scalable architecture expertise
- Backend development capabilities
- Analytics integration experience
- Post-launch support services
Antier, with its several years of experience and expertise, tends to follow a structured development process that is more likely to deliver reliable results and hence the selection should be made accordingly.
Final Thoughts
Telegram games offer businesses a powerful way to reach global audiences with minimal friction. However, successful launches require structured planning, scalable architecture, and experienced development teams.
Organizations that treat Telegram games as strategic products rather than quick experiments are more likely to achieve sustainable growth. Working with an experienced Telegram game development company like Antier allows businesses to launch faster while reducing technical risks and ensuring long-term scalability.
Frequently Asked Questions
01. Why are businesses interested in launching games on Telegram?
Businesses are attracted to Telegram games due to instant user access without app downloads, lower user acquisition friction, global reach, integrated social engagement features, and faster product launch timelines.
02. What are the key factors for successfully launching a Telegram game?
Successful launches require structured planning, scalable architecture, reliable development processes, and a well-defined strategy that includes target audience, gameplay concept, user acquisition, monetization, and technical requirements.
03. How does Telegram facilitate user engagement for games?
Telegram provides built-in communication channels such as notifications, community groups, and automated messaging, allowing developers to engage users directly and create continuous engagement opportunities.

One of Nasdaq’s options exchanges, Nasdaq MRX, has filed to offer cash-settled, binary-style contracts on the Nasdaq-100 Index, adding to a wave of Wall Street firms testing the prediction market waters.
Nasdaq, the firm behind the second-largest stock exchange by market capitalization, is looking to offer “Outcome Related Options” for yes-or-no bets, priced between 1 cent and $1, according to its filing to the US Securities and Exchange Commission on Monday.
The offering would allow traders to take binary positions on events linked to the Nasdaq-100 and Nasdaq-100 Micro indexes — not on outcomes related to other events, such as sports, culture, or politics.
Some of the most notable stocks in the Nasdaq-100 include Nvidia (NVDA), Apple (AAPL), Microsoft (MSFT), Amazon (AMZN), Google (GOOGL), Meta (META) and Tesla (TSLA).

SEC approval could see it enter a booming market alongside the likes of Polymarket and Kalshi, while crypto trading platforms like Coinbase and Crypto.com are also integrating prediction markets.
Other Wall Street players, such as the Intercontinental Exchange, CME Group and Cboe Global Markets, have also invested in the space or signaled an intention to launch their own prediction market-style offerings.
CME Group’s partnership with American gambling company FanDuel will enable traders to bet on markets outside of finance, while Cboe’s offering will be focused on finance and economic contracts.
Crypto asset manager Bitwise also filed with the SEC last month to launch “PredictionShares” exchange-traded funds that seek to hold event contracts tied to the 2028 US presidential election, while GraniteShares and Roundhill also made similar filings in February.
Related: Kalshi founder provides update on Iran’s Khamenei market carveout
Prediction markets became one of the hottest use cases in crypto last year and have consistently surpassed $10 billion in monthly trading volume. Polymarket and Kalshi have been aggressively marketing their products to retail users in recent months despite some regulators seeking to restrict the industry.
Nasdaq wants its prediction offering on several platforms
Nasdaq is also looking to offer Outcome-Related Options on other Nasdaq options exchanges, including Nasdaq NOM and Nasdaq PHLX.
Nasdaq MRX uses a first-come, first-served system and does not pay trading incentives. In contrast, Nasdaq NOM and Nasdaq PHLX incorporate pricing models that can reward participants for adding liquidity.
Magazine: IronClaw rivals OpenClaw, Olas launches bots for Polymarket — AI Eye
Crypto World
NEAR token jumps 17% after ‘Confidential Intents’ launch, outpaces privacy tokens sector

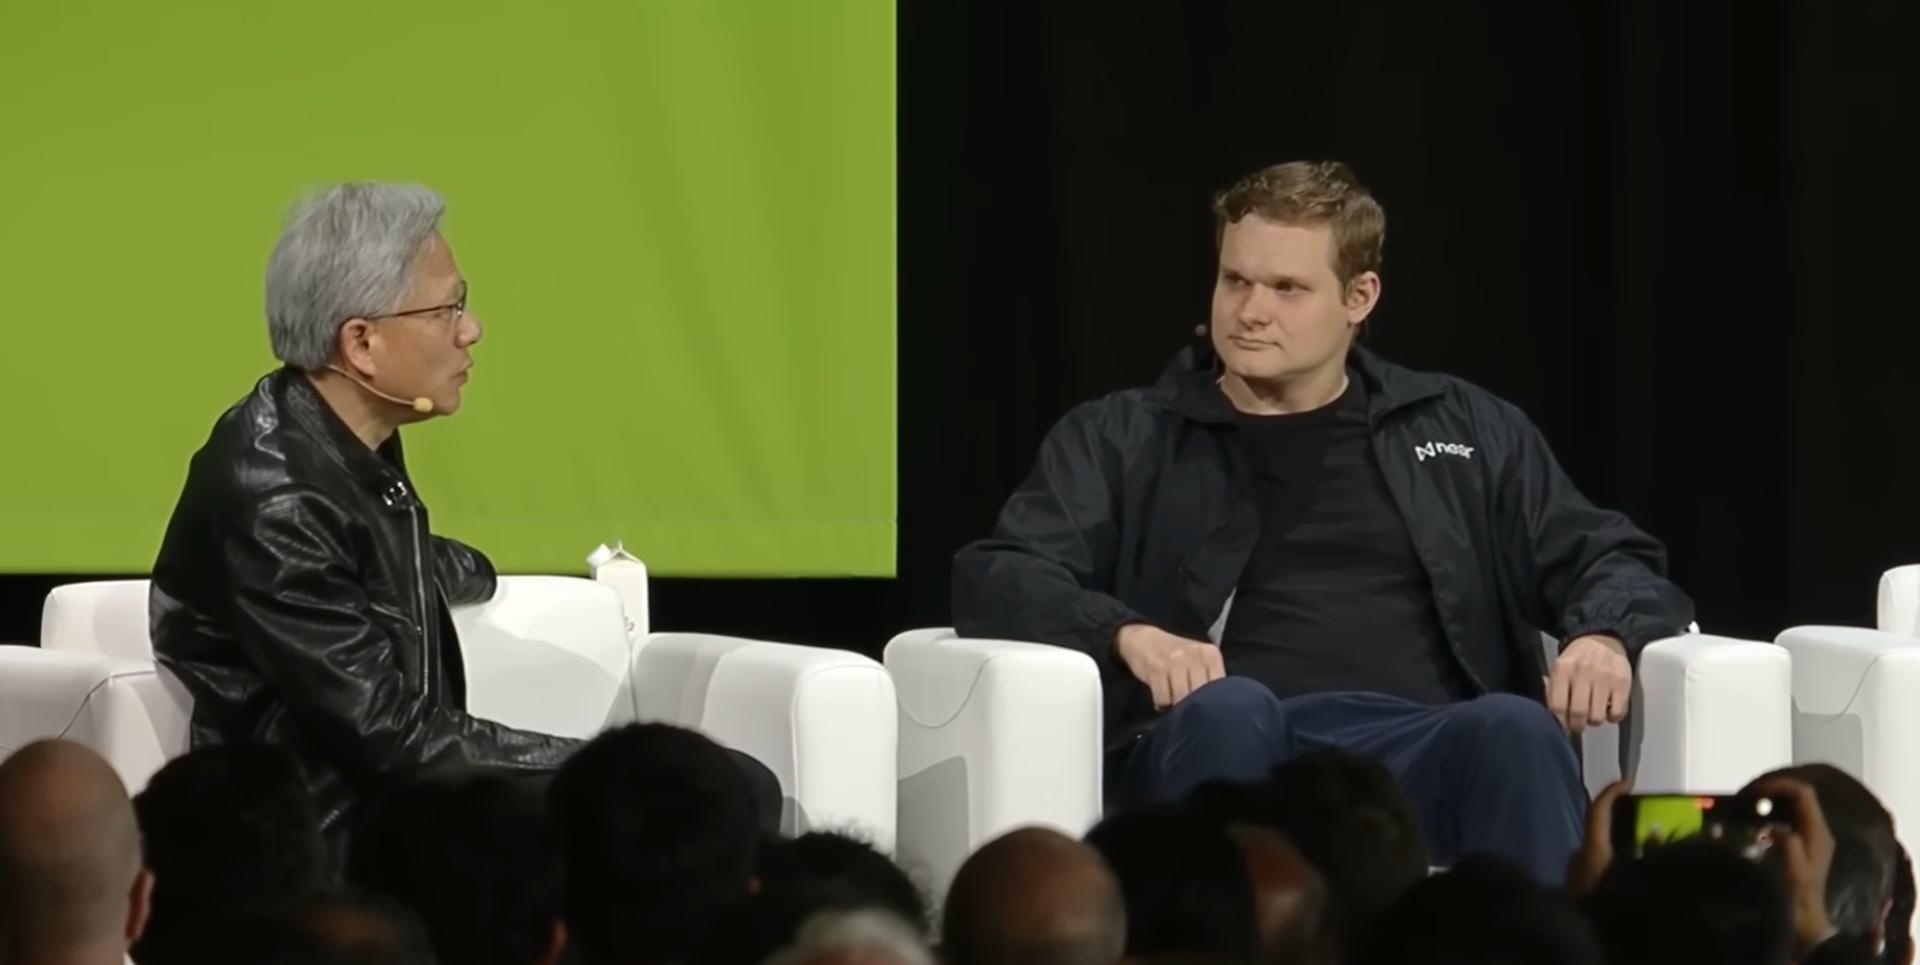
NEAR token climbed as much as 17% after launching “Confidential Intents,” a new private execution layer designed to shield trades from public view, extending a 40% weekly rally and outperforming both the CoinDesk 20 Index and the broader privacy token sector.
The feature was first unveiled last week at NEARCON in San Francisco, as previously reported by CoinDesk, and officially went live today.
It routes transactions through a private shard linked to NEAR’s mainnet, according to technical documentation on NEAR’s blog, allowing users to toggle into confidential accounts to avoid front-running and sandwich attacks.
Unlike privacy coins such as Monero or Zcash, which are designed to hide transaction details by default, NEAR’s system offers optional confidentiality focused on trade execution, keeping only specific transfers and positions out of public view while preserving auditability for law enforcement.
NEAR wrote that the product is aimed squarely at institutions wary of broadcasting trading strategies on transparent ledgers.
Onchain transactions are visible before they settle, exposing order size, timing, and direction to bots that can trade against users.
That dynamic has long enabled so-called maximal extractable value, or MEV, strategies that act as a hidden tax on traders. By shifting execution of trades into a less visable environment, Confidential Intents is designed to keep transfers and cross-chain position management out of the public mempool
Unlike fully opaque privacy chains, NEAR’s system offers selective disclosure within a compliance-aware framework, positioning the product as a bridge between traditional finance expectations and onchain settlement.
Still, onchain data curated by DeFiLlama shows NEAR’s base-layer fees remain limited relative to its roughly $1.8 billion market capitalization.
That suggests investors are betting the confidential execution layer could draw institutional-sized flow onto the network, rather than responding to a sharp increase in current revenue.


XRP slips about 4% in 24h as $652m flows to Binance amid Iran‑linked risk‑off move.
Summary
- Around 472m XRP (≈$652m) moved to Binance in a week, the largest February inflow stretch, coinciding with US–Iran tensions.
- XRP trades roughly $1.3–$1.4, down about 4% daily and over 35% year‑on‑year, while 24h volume holds near multi‑billion levels.
- On‑chain data shows clustered late‑February exchange inflow spikes, signaling defensive positioning and potential short‑term sell‑side pressure.
XRP (XRP) exchange inflows to Binance have risen sharply, creating potential sell-side pressure as geopolitical tensions involving the United States, Israel and Iran escalate, according to CryptoQuant contributor Darkfost.
The exchange received more than 472 million XRP over the past week, representing what Darkfost described as the largest inflow stretch recorded on Binance for XRP during February, according to data shared by the analyst.
The market reaction intensified following weekend escalations in the Middle East, when strikes were launched shortly after the close of traditional financial markets, Darkfost stated. The timing amplified uncertainty across risk assets, with cryptocurrency markets reacting to the geopolitical developments, according to the analysis.
Chart data shared by Darkfost shows a cluster of unusually large inflow bars in late February, including several daily spikes well above prior February levels, while XRP’s price remained relatively unstable.
“Such inflows typically reflect a more defensive posture from investors holding XRP,” Darkfost wrote. “When large amounts of tokens move onto exchanges, it often signals a potential willingness to sell or at least to position liquidity closer to the market.”
Large transfers onto exchanges often precede increased liquidations or discretionary selling, particularly during broader risk-off periods, according to market observers. The transfers do not confirm outright selling, but shift substantial supply closer to the market during a period of elevated uncertainty.
“When amounts of flows like this are recorded, they can create the conditions for a sudden wave of selling pressure capable of impacting price action in the short term,” Darkfost stated.
The analyst noted that traders should monitor “whether it reflects the start of a broader distribution dynamic on XRP or simply short-term panic movements triggered by geopolitical uncertainty.”
During periods of geopolitical stress, traders typically reduce directional exposure and move assets into venues where they can exit quickly if volatility increases, according to market analysts.

Target (TGT) Q4 2025 earnings

Pump.fun moves beyond meme coins with new trading update
Josh Duhamel shares how Fergie has 'different views of the world' than him


-

 Fashion3 days ago
Weekend Open Thread: Iris Top
-

 Politics4 days ago
ITV enters Gaza with IDF amid ongoing genocide
-

 Tech2 days ago
Unihertz’s Titan 2 Elite Arrives Just as Physical Keyboards Refuse to Fade Away
-

 Business6 days ago
True Citrus debuts functional drink mix collection
-
Sports3 days ago
The Vikings Need a Duck
-

 Crypto World7 days ago
XRP price enters “dead zone” as Binance leverage hits lows
-
 NewsBeat3 days ago
Dubai flights cancelled as Brit told airspace closed ’10 minutes after boarding’
-

 Tech6 days ago
Unsurprisingly, Apple's board gets what it wants in 2026 shareholder meeting
-

 NewsBeat5 days ago
Cuba says its forces have killed four on US-registered speedboat | World News
-
 NewsBeat5 days ago
Manchester Central Mosque issues statement as it imposes new measures ‘with immediate effect’ after armed men enter
-
 NewsBeat3 days ago
The empty pub on busy Cambridge road that has been boarded up for years
-

 NewsBeat2 days ago
‘Significant’ damage to boarded-up Horden house after fire
-

 NewsBeat2 days ago
Abusive parents will now be treated like sex offenders and placed on a ‘child cruelty register’ | News UK
-
 NewsBeat6 days ago
Police latest as search for missing woman enters day nine
-

 Entertainment22 hours ago
Baby Gear Guide: Strollers, Car Seats
-

 Business5 days ago
Discord Pushes Implementation of Global Age Checks to Second Half of 2026
-

 Business4 days ago
Only 4% of women globally reside in countries that offer almost complete legal equality
-
 Tech4 days ago
NASA Reveals Identity of Astronaut Who Suffered Medical Incident Aboard ISS
-

 Crypto World6 days ago
Entering new markets without increasing payment costs
-
Politics2 days ago
FIFA hypocrisy after Israel murder over 400 Palestinian footballers