

Crypto World
Crypto-paid ‘revenge for hire’ ring busted in South Korea


South Korean police have arrested a series of individuals believed to be acting as hired agents committing what authorities describe as “private revenge” attacks, which have involved vandalism and threatening behavior directed at private residences.
Summary
- Multiple suspects in “private revenge” vandalism have been arrested by police in Gyeonggi Province.
- Investigators say the suspects were paid in cryptocurrency and acted on instructions via Telegram.
- Police are pursuing higher-level coordinators as part of the ongoing investigation.
South Korean police arrest agents in series of “private revenge” vandalism cases
According to reports, the most recent arrest was carried out on March 1 by the Suwon District Court, which issued a warrant for a man in his 20s identified only as Im on charges of property damage and criminal trespass.
Prosecutors allege that on the evening of February 22, the suspect entered an apartment building in Dongtan New City, Gyeonggi Province, where he allegedly sprayed red lacquer on the front door of a resident’s home and scattered trash on the floor.
Police say the suspect also distributed dozens of leaflets defaming the alleged victim and broadcasted excrement at the scene.
Police say they are pursuing leads on the person or network believed to have instructed the group through the encrypted messaging app Telegram, suggesting an organized effort behind the vandalism. All of the suspects arrested so far reportedly told investigators that they were paid between 500,000 and 1,000,000 won (about $380 – $760) in cryptocurrency for carrying out the acts.
Earlier arrests include another man in his 20s detained after entering a multi-family home in Sanbon-dong, Gunpo City on February 24 and spraying the front door with lacquer while leaving threatening materials.
Prosecutors said the suspect’s behavior and materials suggested coordination with others giving instructions.
Authorities are also reviewing a December incident in Pyeongtaek involving similar criminal behavior. Police have linked that case and the recent ones to overlapping methods and are continuing to investigate possible connections and higher-level coordinators.
Officials say the crimes illustrate how social media and encrypted platforms can be misused to organize and incentivize harassment, and they have pledged to track down those orchestrating the campaign.


OKX has just introduced a native AI layer on OnchainOS, its developer-focused onchain platform, designed to enable AI agents to act autonomously on blockchain networks.
The layer bridges traditional decentralized tooling with machine-native automation for trading, wallet management, payments and market data access.
More on OnchainOS
OnchainOS is the onchain toolkit and execution environment built by OKX’s Web3 team, intended to support developers and automated agents across multiple blockchain networks.
The platform ties together wallets, real-time market data, trading interfaces, and programmable execution in a single framework that AI agents can call into.
Unlike basic smart contract SDKs or standalone APIs, the goal of this AI layer is to let agents perform entire workflows (from reading prices to executing transactions) without developers wiring together separate components. It unifies familiar building blocks such as wallet infrastructure, liquidity routing, and onchain data feeds into a cohesive execution stack.
OKX says OnchainOS already supports more than 60 blockchain networks and aggregates liquidity across 500+ decentralized exchanges (DEXs), all while sitting on proven infrastructure that handles billions of API calls and high volumes of trading activity.
What the AI Layer Offers Developers and Agents
The new capabilities are grouped into a set of core modules that developers can build with:
- Wallet functionality: Agents can query balances, send transactions, and retrieve cross-chain history.
- Autonomous payments: Using the x402 pay-per-use protocol, agents can initiate and settle transactions without manual intervention and, in certain cases, with zero gas costs on OKX’s X Layer.
- Smart trading: Aggregated routing across hundreds of DEXs enables agents to source best prices for swaps and execute trades.
- Structured market data: Real-time onchain data feeds covering tokens, transfers, trades, and account information help agents decide when and how to act.
- DApp Connect: Direct integration of OKX Wallet into any decentralized app, expanding connectivity options.
These building blocks are designed to work together so that simple instructions can produce complex autonomous results. For example, an agent connected to OnchainOS could be instructed in plain language to swap ETH for USDC if a price threshold is reached, handling everything from price monitoring to execution onchain without further human input.
Multiple Access Paths for Builders
OKX offers three main ways developers and teams can integrate with OnchainOS:
- AI Skills: Agents interact through human-friendly descriptions of what they want to do, bypassing low-level API wiring.
- MCP (Model Context Protocol): A direct connection between OnchainOS and AI agent frameworks or LLM applications, meaning models like Claude Code, Cursor or OpenClaw can call onchain functionality natively.
- Open API: For developers who want detailed programmatic control, direct RESTful access to every capability is available.
Why Is This Big
Agents capable of autonomously operating onchain promise to reduce manual overhead for trading, arbitrage, portfolio rebalancing and data-driven decisions. While AI wallets today might handle simple tasks like sending tokens or checking prices, OnchainOS focuses on orchestrating multi-step workflows that combine market insight with execution logic – all within a unified system.
This could accelerate experimentation in algorithmic trading, liquidity management strategies, onchain risk monitoring, or dynamic portfolio rules – areas where developers have previously had to piece together separate APIs and feeds.
The Broader Context
The launch comes amid a period of growing interest in the mix of AI and blockchain. Coverage on this upgrade noted that the AI layer builds on OKX’s existing wallet and DEX infrastructure, pulling everything into a single execution framework for agents operating cross-chain.
OnchainOS’ scalability and reliability metrics, such as sub-100ms response times and sustained throughput at scale, are highlighted by OKX as foundational to supporting autonomous operations over time.
What’s Next?
OKX says OnchainOS with the new AI layer is available now to developers worldwide. Documentation and starter guides have been published to help builders deploy their first AI agents and decentralized applications using the toolkit.
TLDR
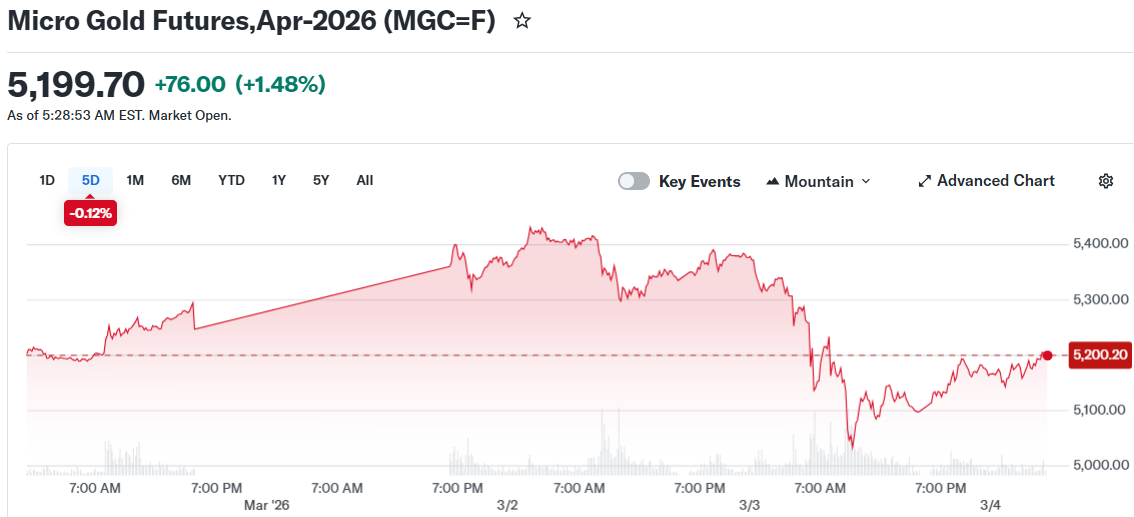
- The precious metal plunged almost 5% before staging a 2% recovery as bargain hunters stepped in
- Dollar strength, with gains of approximately 1.5% this week, is limiting gold’s upward momentum
- Geopolitical tensions between the US and Iran are boosting safe-haven flows while simultaneously elevating crude prices
- Higher energy costs are intensifying inflation concerns, dampening prospects for Federal Reserve monetary easing
- Market participants now see 80% probability of multiple rate reductions this year, down from complete certainty of two cuts just days ago
The gold market experienced dramatic volatility as prices plummeted on Tuesday before staging a notable recovery Wednesday morning, with market participants balancing geopolitical risk appetite against greenback appreciation.

Spot gold advanced 1.6% to reach $5,171.89 per ounce during late London trading hours. This rebound followed a substantial 4.5% decline in the prior session, marking one of the most significant single-day retreats in recent trading history.
The yellow metal reached unprecedented heights above $5,595 per ounce during the final weeks of January. Year-to-date gains have approached 20%.
The previous session’s downturn resulted from a significant rally in the US Dollar Index, which climbed nearly 1.5% across two trading days to touch six-week peaks. Dollar appreciation typically pressures gold valuations by making the commodity costlier for international purchasers.
Portfolio rebalancing also contributed to selling pressure, as certain investors liquidated gold holdings to offset deficits elsewhere in their investment allocations.
Silver experienced an even sharper correction, falling over 8% Tuesday before rebounding 4.1% to $85.38 during Wednesday’s session. Platinum decreased 10% before recovering 2.8% to settle at $2,148.50 per ounce.
Iran Conflict Drives Safe-Haven Demand
The US-Israeli military operations against Iran have entered their fifth consecutive day. Israeli forces conducted additional strikes on Tehran Tuesday, targeting a facility in Qom where religious leaders had assembled to select a replacement for Supreme Leader Ayatollah Ali Khamenei, as reported by Israel’s Kan News. Iran’s semi-official Mehr news agency acknowledged the strike but indicated the structure was vacant during the attack.
The escalating conflict has created turbulence across worldwide financial markets and sustained elevated investor anxiety. Concerns regarding expanded regional destabilization continue mounting as Iran has threatened retaliation following American military actions against Iranian-affiliated installations.
Shipping activity through the Strait of Hormuz, a critical chokepoint handling approximately one-fifth of global oil and natural gas transport, has ground nearly to a standstill. President Trump announced the US would supply naval protection and insurance coverage for oil vessels navigating the strategic waterway, though maritime industry representatives characterized the solution as incomplete.
Rising Oil Prices Complicate Rate Cut Expectations
Elevated crude prices are intensifying inflation projections. This development is reducing the likelihood that central banking institutions, particularly the Federal Reserve, will implement rate reductions in the near term.
Market participants currently assign 80% probability to multiple quarter-point Fed rate cuts materializing this year. Just last Friday, financial markets had fully incorporated expectations for two rate reductions.
Elevated interest rate environments present challenges for gold since the asset generates no yield.
According to CFTC records, money managers’ net bullish positions in gold have declined since late January to approach decade-low levels. Market analysts suggest this diminished positioning may establish a floor for potential price declines.
In China, government PMI statistics indicated manufacturing sector contraction, while independent survey data revealed better-than-anticipated expansion, creating contradictory indicators from the planet’s second-largest economy.
Remember: Preserve all tokens like [[EMBED_0]], [[IMG_0]], [[LINK_START_0]], [[LINK_END_0]], [[SCRIPT_0]], [[FIGURE_0]] etc. exactly as they appear. These are placeholders for embeds, images, and links that must not be changed.


TLDR
- Adidas projected 2026 operating profit of €2.3 billion, falling short of the €2.72 billion analyst consensus estimate
- The sportswear giant faces approximately €400 million in combined pressures from U.S. tariffs and foreign exchange challenges
- Shares declined approximately 7–8% during Frankfurt trading session after the guidance release
- 2025 fiscal year performance was robust — operating profit surged 54% to €2.06 billion alongside record-breaking revenue of €24.8 billion
- Bjorn Gulden’s tenure as CEO was extended until 2030, while the company announced plans to raise dividends by 40% to €2.80 per share
Adidas posted impressive 2025 numbers, but the market’s focus has shifted forward — and the outlook has left shareholders disappointed.
The German athletic apparel giant announced record annual revenue of €24.8 billion, representing approximately 5% growth, while net income jumped 75% to reach €1.34 billion. Operating profit climbed 54% to €2.06 billion, significantly exceeding the company’s initial guidance range of €1.7–1.8 billion from the beginning of last year.
When adjusted for currency fluctuations, revenue expanded 13%, with double-digit percentage increases recorded across every market and distribution channel. The company’s gross margin strengthened by 0.8 percentage points, reaching 51.6%.
The fourth quarter also demonstrated strength. Currency-neutral revenue increased 11% to €6.1 billion, with the direct-to-consumer segment posting double-digit growth throughout all geographic regions. Gross margin expanded by 1 percentage point to 50.8%, while operating profit more than doubled, hitting €164 million.
So what triggered the 7–8% share price decline?
The answer lies in forward guidance. Adidas projected 2026 operating profit at approximately €2.3 billion — substantially below the Visible Alpha analyst consensus estimate of €2.72 billion. RBC Capital Markets analyst Piral Dadhania characterized this as suggesting a 15% consensus earnings reduction “at face value.”
Tariffs and Currency Take a Bite
The company identified a combined €400 million challenge stemming from U.S. tariff policies and adverse foreign exchange fluctuations. Adidas produces a significant portion of its merchandise in Asian nations now facing U.S. import duties, creating greater exposure compared to certain competitors. Additionally, a strengthening euro relative to the dollar has diminished the value of international earnings.
Deutsche Bank characterized the guidance for operating income and profit margins as “slightly weaker-than-expected.”
The implied operating margin for 2026 — approximately 8.5–8.8% — would fall short of Adidas’s own 10% medium-term objective, according to RBC’s analysis.
Regarding revenue, Adidas forecasted currency-neutral growth in the high-single-digit percentage range for 2026, representing roughly €2 billion in additional sales. North America and Greater China are anticipated to drive growth, with low-double-digit percentage expansion projected for both markets.
Mid-Term Outlook Offers Some Comfort
Adidas also unveiled a multi-year strategic plan, projecting high-single-digit revenue growth and mid-teens operating profit compound annual growth rate (CAGR) spanning 2026–2028.
Morgan Stanley observed that this type of medium-term guidance is “relatively rare” and indicated it serves to “soften the blow” of the near-term shortfall. With shares trading at approximately 13x 2026 earnings when results were announced, the investment bank adopted a more constructive perspective on the broader trajectory.
The company also proposed raising its dividend by 40% to €2.80 per share — signaling confidence in cash flow generation despite near-term challenges.
CEO Bjorn Gulden’s contract received an extension through 2030. RBC described this as “reassuring,” highlighting his comprehensive knowledge of the sports industry. Gulden, who assumed leadership in 2023 following the controversy surrounding the Ye collaboration, has consistently exceeded the guidance targets he established at the beginning of each fiscal year.
Adidas also revealed intentions to appoint Nassef Sawiris as chairman.

The dollar strengthened as geopolitical tensions in the Middle East intensified. Heightened uncertainty traditionally boosts demand for safe-haven assets and dollar liquidity, supporting the US currency against a range of peers. An additional factor remains the resilience of US macroeconomic indicators, which limits expectations of an imminent easing of the Federal Reserve’s monetary policy.
Amid the escalation of the conflict, investors are reducing risk exposure and reallocating capital into more defensive instruments. As a result, volatility has increased and capital inflows into dollar-denominated assets have strengthened, while traditional safe-haven currencies are showing a mixed reaction.
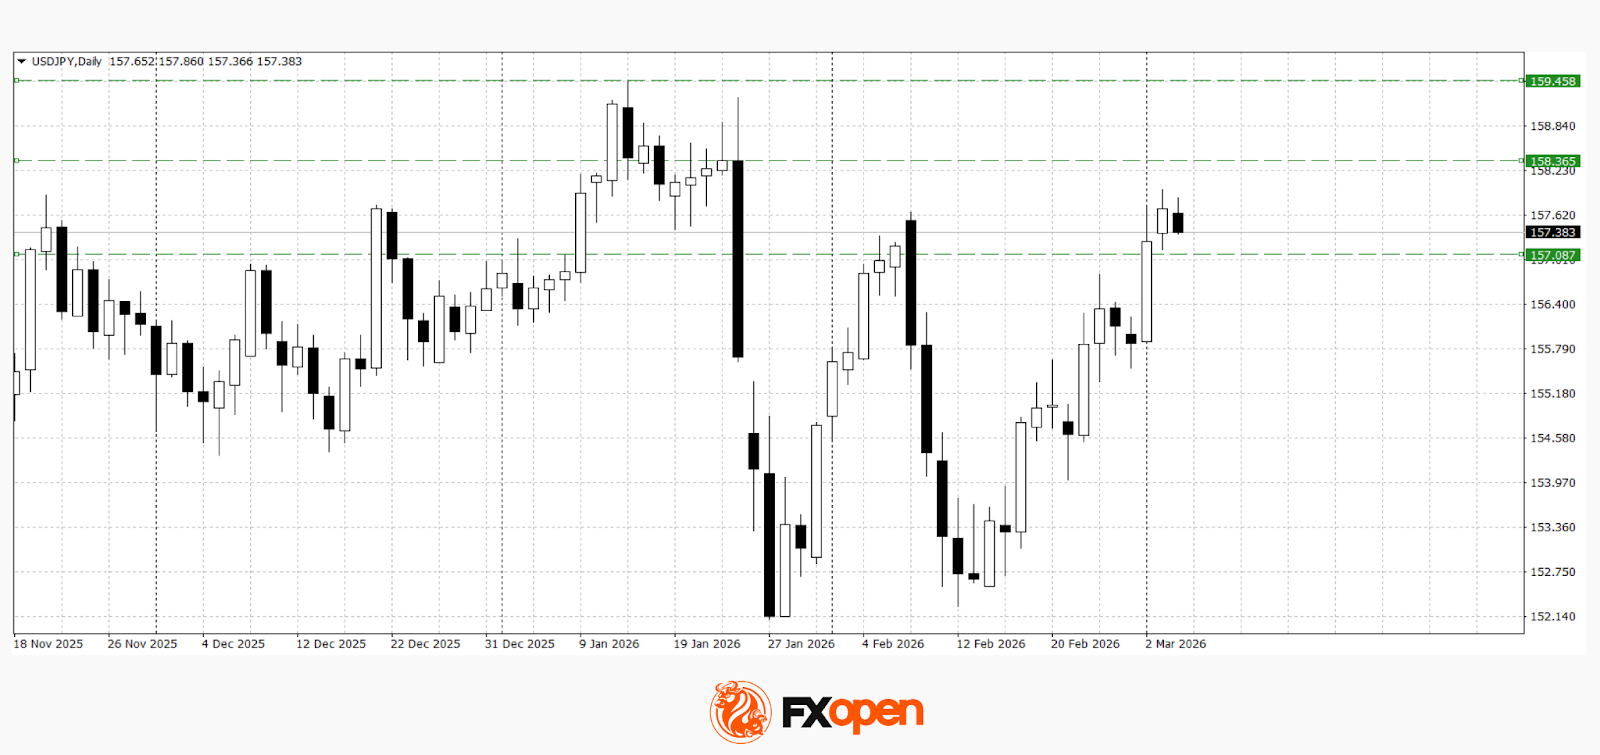
USD/JPY
The USD/JPY pair maintains its upward structure and is approaching the year’s highs in the 158.40–159.50 range. Despite the yen’s status as a “safe-haven asset”, the dollar retains the advantage due to higher US Treasury yields and stable expectations regarding the Federal Reserve’s policy rate. Should geopolitical tensions continue to intensify, a spike in volatility and a sharp correction towards 157.00 are possible; however, momentum currently remains on the dollar’s side.
Key events for USD/JPY:
- today at 15:15 (GMT+2): US ADP non-farm employment change;
- today at 16:45 (GMT+2): US services sector business activity index;
- today at 17:00 (GMT+2): US ISM non-manufacturing PMI.
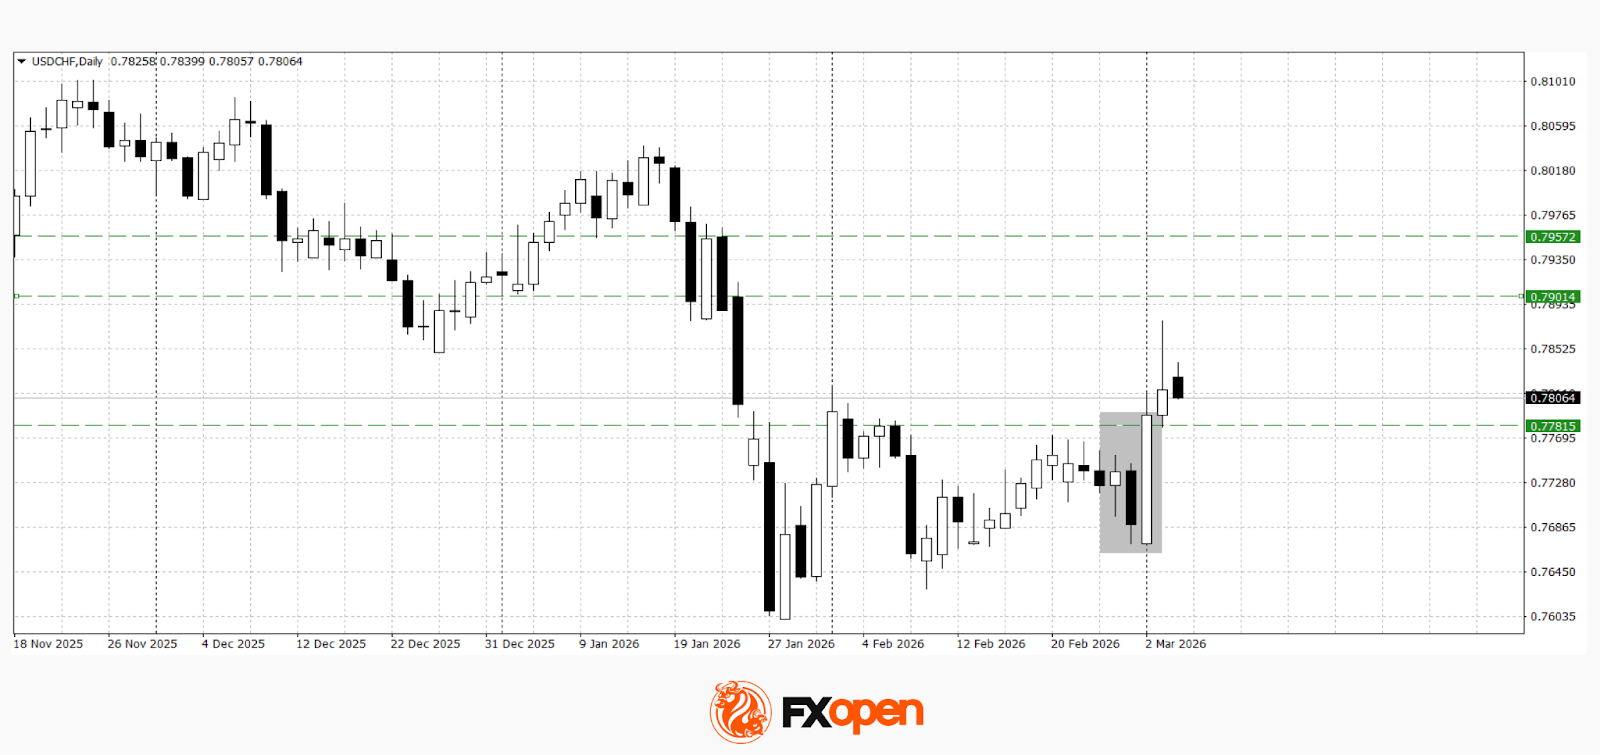
USD/CHF
The USD/CHF pair is showing moderate dollar strength, although price action remains relatively restrained due to the Swiss franc’s “safe-haven” status. Nevertheless, technical analysis of USD/CHF suggests potential upside towards 0.7900–0.7950, as a “bullish engulfing” pattern has formed and been confirmed on the daily timeframe. The bullish scenario would be invalidated by a confident move below 0.7780.
Key events for USD/CHF:
- today at 09:30 (GMT+2): Switzerland consumer price index;
- today at 11:30 (GMT+2): Swiss National Bank press conference;
- tomorrow at 10:00 (GMT+2): Switzerland unemployment rate (seasonally adjusted).
Trade over 50 forex markets 24 hours a day with FXOpen. Take advantage of low commissions, deep liquidity, and spreads from 0.0 pips (additional fees may apply). Open your FXOpen account now or learn more about trading forex with FXOpen.
This article represents the opinion of the Companies operating under the FXOpen brand only. It is not to be construed as an offer, solicitation, or recommendation with respect to products and services provided by the Companies operating under the FXOpen brand, nor is it to be considered financial advice.

US spot Bitcoin ETFs posted mixed trading flows on Tuesday, reflecting a nuanced backdrop for the U.S. ETF market as investors weighed short-term liquidity against broader risk-off sentiment. Data from SoSoValue showed that overall spot BTC ETFs drew a net inflow of $225.2 million, highlighting sustained appetite for direct exposure to the benchmark cryptocurrency even as the sector remains choppy. The standout contributor was iShares Bitcoin Trust (IBIT), which logged substantially larger inflows, helping offset redemptions across other products. The week’s numbers come as crypto traders monitor a delicate balance between inflows, price action, and evolving macro risk signals.
The latest weekly snapshot reveals that IBIT brought in about $322.4 million in fresh funds, while competing vehicles posted smaller outflows: Fidelity Wise Origin Bitcoin Fund (FBTC) shed roughly $89.3 million, and Grayscale Bitcoin Trust ETF (GBTC) reduced by about $28.2 million. Those figures helped shape a broader trend in the sector: inflows across the board still exist, but buyers must contend with a spectrum of product-specific dynamics and issuer strategies that influence demand on a week-to-week basis. The net effect was a positive tilt for spot BTC, even as the distribution of flows across issuers remained uneven.
aggregating data from Farside, the week’s tally lifted total ETF inflows to $683.3 million, following last week’s $787.3 million, marking the first stretch of positive flows after five consecutive weeks of outflows that had drained nearly $4 billion from the sector. In other words, while the broader ETF complex remains choppy, a subset of products continues to attract fresh capital, underscoring a segmented demand pattern rather than a unanimous bet on spot BTC exposure.
Investors have shown caution in the current environment, with market sentiment reflecting geopolitical concerns that have weighed on risk appetite. The broader crypto market has endured a period of uncertainty, and Bitcoin’s price action over the past week has been modest but persistent. CoinGecko tracks Bitcoin’s price trajectory, noting that the asset advanced about 5.4% over the last seven days, a gain that has helped stabilize some investors’ expectations even as overall sentiment remains tenuous.
Ether fund flows turn negative amid market uncertainty
Across the broader suite of crypto-linked ETFs, Ether (ETH) funds moved into negative territory, registering about $10.8 million in net outflows. The shifting fortunes of ETH-focused products reflect a risk-off tilt that tends to nudge investor capital away from second-largest asset classes when macro headlines or flow dynamics shift abruptly.
Meanwhile, other tokens found pockets of support. XRP (CRYPTO: XRP) funds recorded inflows of roughly $7.5 million, while Solana (CRYPTO: SOL) funds attracted about $1 million. These modest, yet positive, numbers hint at targeted demand for specific layer-1 and smart-contract ecosystem tokens, even as larger market participants remain selective about the broader risk profile in the current environment.
The mixed picture across ETFs comes as geopolitical frictions in the Middle East weigh on investor sentiment, a headwind that has kept risk assets sensitive to headline risk and macro shifts. The Crypto Fear & Greed Index, a gauge of market sentiment, dipped to 10 on Wednesday after a brief uptick to 14, signaling persistent concern among traders about near-term price direction and liquidity conditions.
Industry voices continue to frame the debate around Bitcoin’s medium-term potential. Notably, Ray Dalio, the American billionaire and head of Bridgewater Associates, reiterated cautions about Bitcoin on the All-In Podcast, arguing that Bitcoin’s privacy features, potential quantum risks, and relatively small market size constrain its appeal as a form of money. “I think Bitcoin has received a lot of attention, but as a form of money, it’s small compared with gold. There is only one gold,” he remarked, underscoring a skeptical view of Bitcoin’s monetary role in a diversified portfolio.
But the rebuttal from Bitcoin proponents was swift and sharp. Matt Hougan, chief investment officer at Bitwise, countered the critique with a message of long-term opportunity. In an X post, he framed the current critiques as part of Bitcoin’s evolving story, arguing that the very factors some critics point to—privacy, scalability, and market size—are precisely the issues that, in time, could unlock greater adoption and price discovery. “Some hear criticism; I hear opportunity,” Hougan wrote, later adding: (blockquote) “These are the reasons Bitcoin is 4% the size of gold. If these critiques did not exist, Bitcoin would already be around $750,000 per coin. I invest in Bitcoin in part because I am confident these things will change over time.” (blockquote)
Market context
The inflows into spot BTC ETFs come amid a broader layer of caution in crypto markets, where liquidity has sometimes tightened even as certain products attract fresh capital. The latest movements suggest a nuanced demand environment: investors are buying targeted exposure via IBIT while other ETF products experience outflows, a pattern that may reflect issuer-specific strategies, product design, and perceptions of regulatory clarity. The weekly data align with a transitional moment for crypto ETFs, as participants weigh macro signals alongside ongoing debates about market structure, custody, and the evolving regulatory landscape.
Overall, the week’s flow story mirrors a market that is neither bullishly insistent nor narrowly bearish, but rather focused on selective exposures and risk management in the face of a mixed macro backdrop. The BTC price rally, while meaningful, has not translated into a universal reallocation of risk toward crypto assets, suggesting that investors are evaluating spot exposure within a broader, multi-asset framework rather than chasing a single narrative.
Why it matters
For investors, the evolving ETF landscape matters because it shapes how accessible crypto exposure is in traditional portfolios. The outsize influence of IBIT on inflows demonstrates that the equity ETF ecosystem can steer capital toward digital assets, especially when other products experience withdrawals. The divergence between IBIT’s inflows and outflows elsewhere also highlights how issuer dynamics, fund structure, and liquidity provision can influence the speed and direction of capital flows into crypto markets.
From a market-building perspective, these flows contribute to price discovery mechanisms by providing more on-exchange visibility for spot BTC exposure. They also signal to market participants that there remains a persistent demand for regulated, transparent access to cryptocurrency markets—a factor that could shape future product development and regulatory dialogue. Yet the concurrent outflows in ETH ETFs and persistent caution about macro risk emphasize that the crypto ecosystem remains highly mosaic, with different tokens and vehicles trading on their own set of fundamentals and investor appetites.
For builders and researchers, the data underline the importance of robust analytics around ETF performance and issuer behavior. The fact that inflows are not evenly distributed across products suggests that investors are weighing product design, cost structures, and track records when deciding where to allocate. This could influence the way new spot BTC funds are pitched and the type of liquidity arrangements that underpin these products, particularly as the market contends with ongoing questions about custody and settlement in regulated environments.
What to watch next
- Upcoming weekly ETF flow reports from SoSoValue and Farside to see if IBIT’s momentum persists or if redemptions reemerge in other issuers.
- Next price action for Bitcoin following inflow spikes, with monitoring of the 7–14 day horizon to assess whether flows translate into sustained price gains.
- ETF-specific inflow changes for Ether, XRP, and Solana to understand whether ETH outflows reverse or persist and whether selective demand broadens beyond BTC.
- Updates to market sentiment gauges, including the Crypto Fear & Greed Index, to gauge whether risk appetite improves alongside price movements.
- Public commentary and regulatory developments related to spot BTC ETFs and broader crypto market structure to assess potential implications for future flows.
Sources & verification
- SoSoValue data on US spot Bitcoin ETF inflows and outflows.
- Farside data detailing ETF flows by issuer (IBIT, FBTC, GBTC).
- CoinGecko price data for Bitcoin’s seven-day performance.
- Alternative.me Crypto Fear & Greed Index readings.
- All-In Podcast interview with Ray Dalio and related commentary.
- Matt Hougan’s X post defending Bitcoin and outlining long-term opportunities.
- Jane Street-linked discussion referenced in the Magazine feature.
What the numbers say about the market’s current state
In a week characterized by mixed ETF flows and cautious sentiment, the crypto market continues to demonstrate resilience in some segments while showing fragility in others. The surge in spot BTC ETF inflows driven by IBIT indicates that demand for regulated, on-exchange exposure remains a meaningful driver of liquidity. Yet the broader pattern—outflows in Ether funds, mixed signals from major asset classes, and a Fear & Greed Index pinned in the lower echelons—suggests that confidence is not universally restored. As market participants weigh these dynamics, performance will likely hinge on the interplay between issuer strategies, macro headlines, and the ongoing discourse around crypto market infrastructure and governance. The environment remains one of careful repositioning, rather than a decisive reallocation, as investors aim to balance risk, diversification, and potential upside in a still-evolving regulatory landscape.
Key figures and next steps
With IBIT leading the charge on spot BTC inflows and last week’s overall inflow tally signaling a potential shift after a prolonged period of outflows, market observers will be watching whether this week’s numbers sustain the momentum or fade as macro headlines shift. The spread between inflows and outflows across competing BTC ETFs highlights a nuanced market where product design and issuer behavior can materially influence capital allocation. As always, traders should balance the pursuit of structured exposure with an awareness of broader risk signals, including price action and sentiment proxies like the Fear & Greed Index.
XRP has faced a period of sideways momentum over the past month, with its price consolidating between key levels. This range-bound movement suggests that the altcoin has been struggling to break free from the pressure that led to its current consolidation.
Given the ongoing market conditions, XRP could face further decline before any potential recovery.
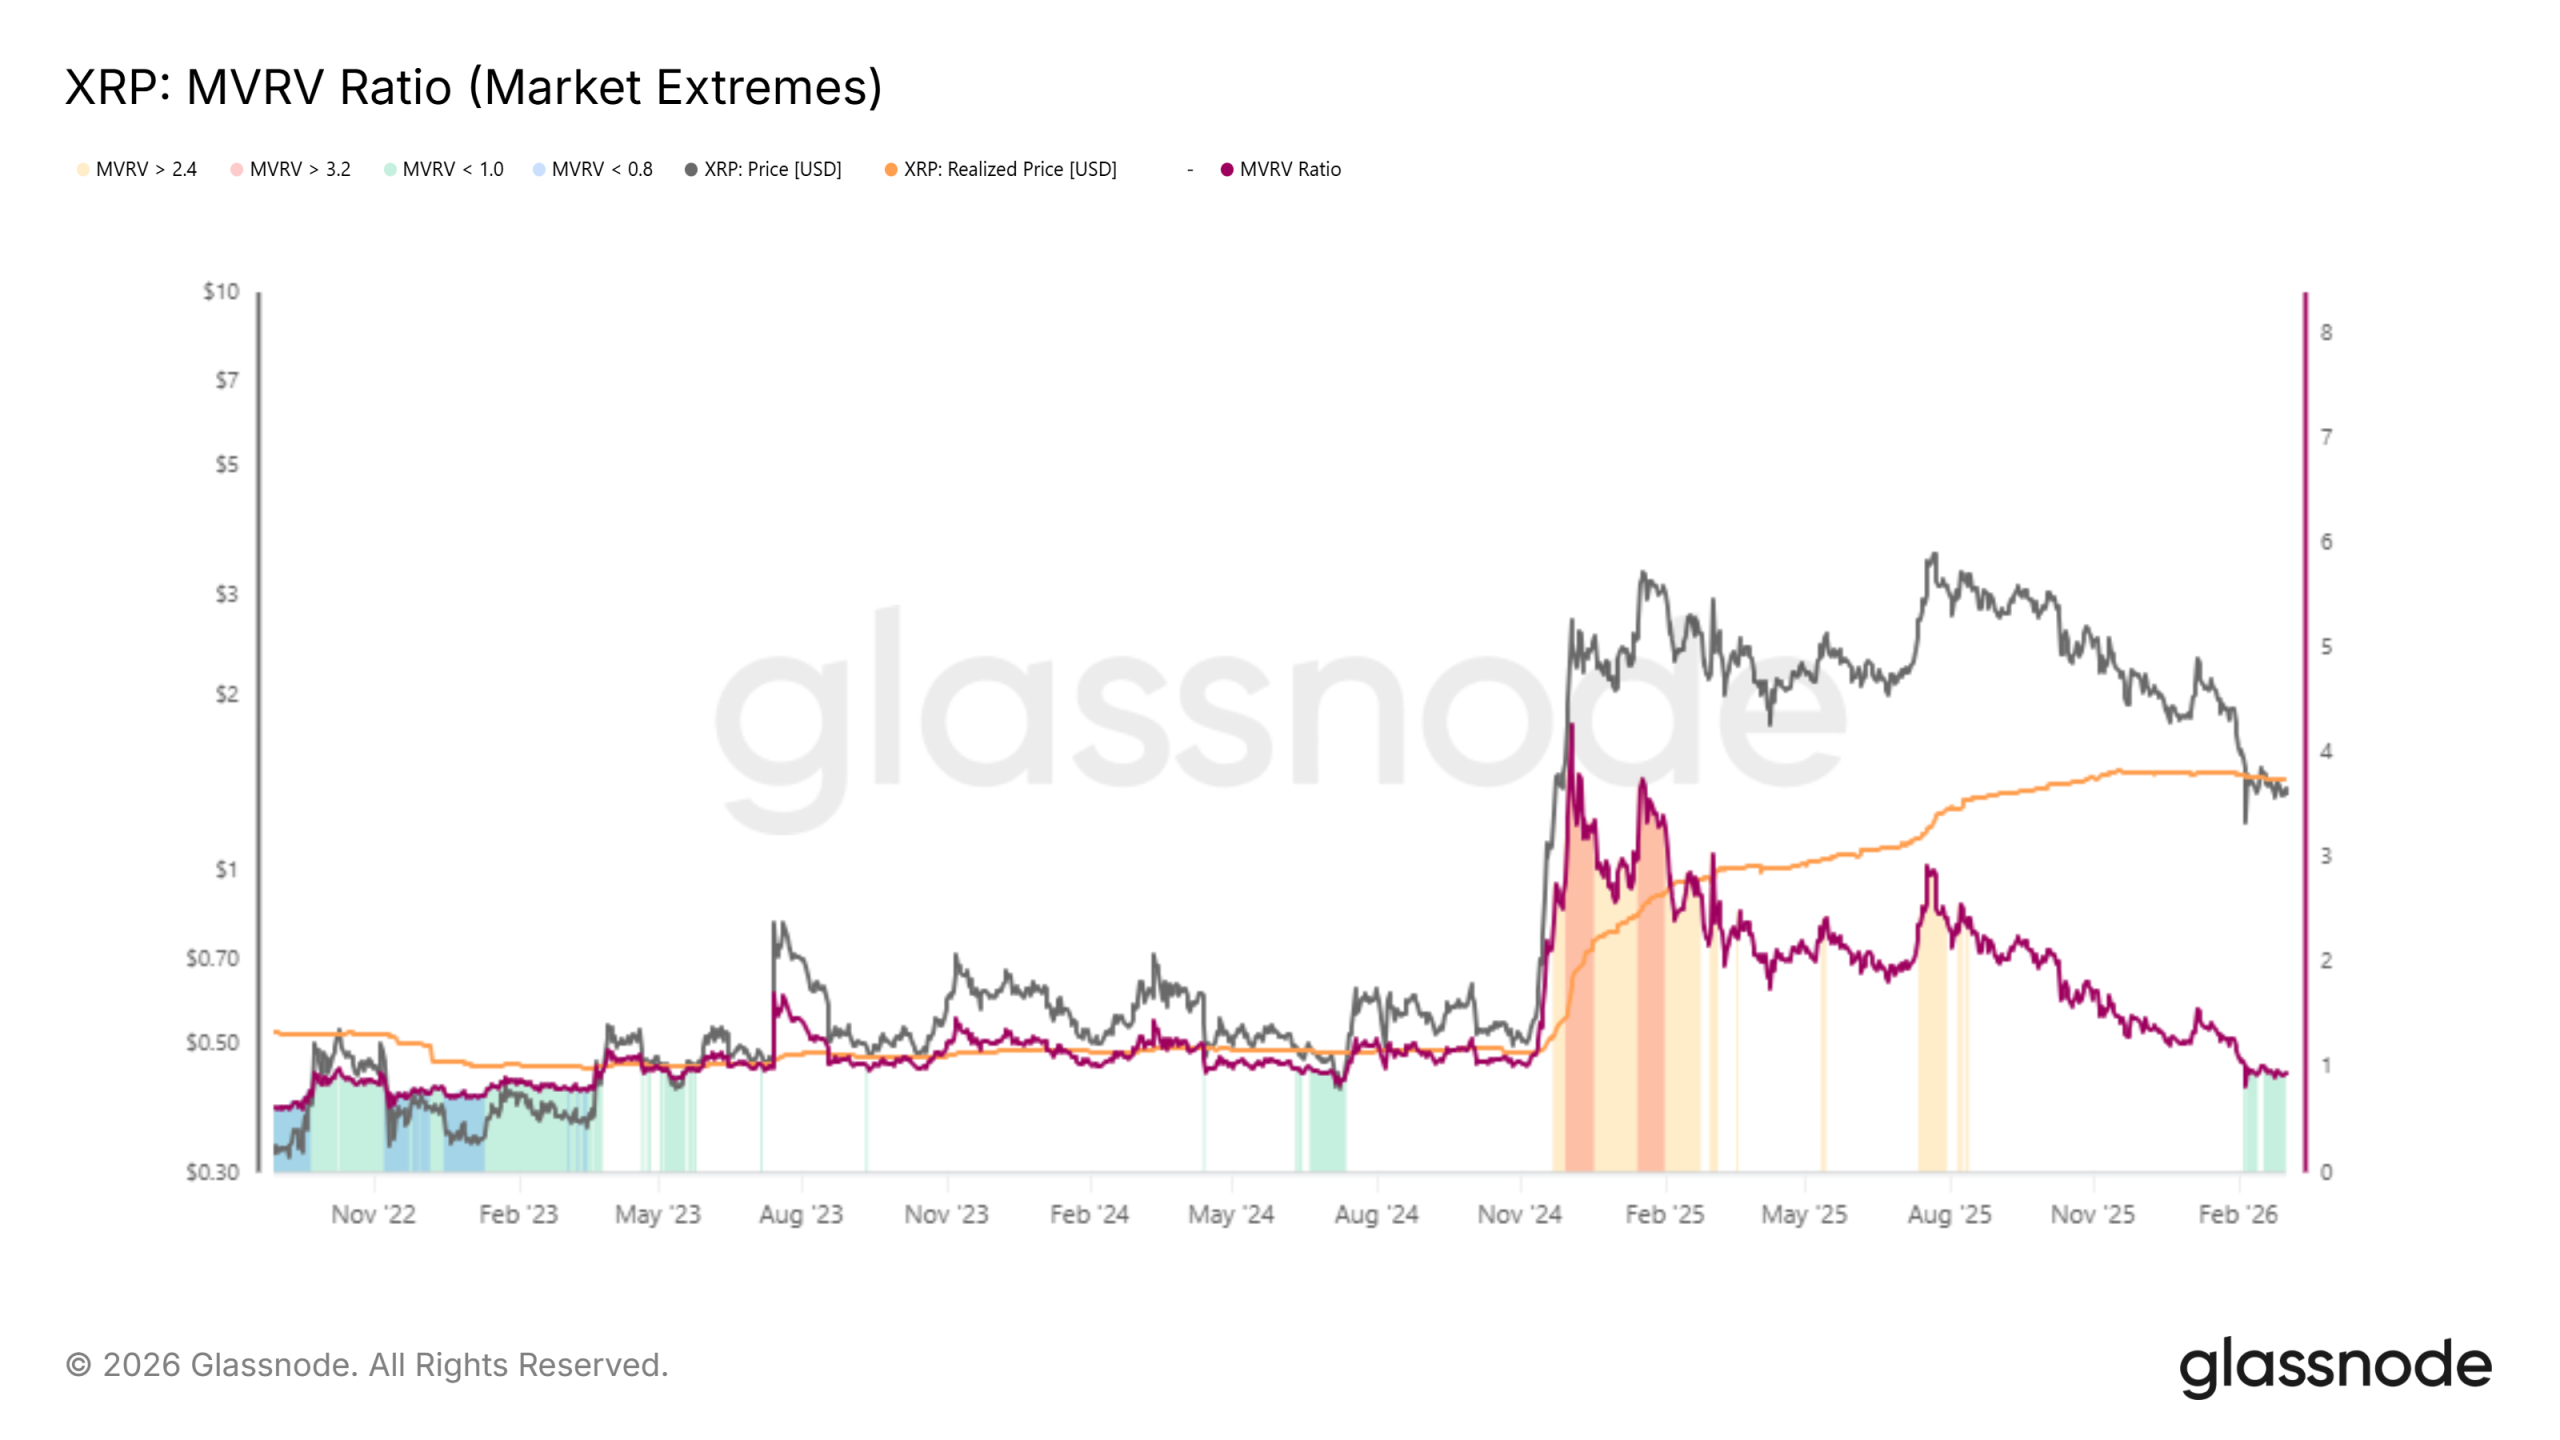
XRP Faces Extreme Pressure
The MVRV Extreme Ratio, which measures the relationship between market value and realized value, indicates that XRP is undervalued and under pressure. Currently, the MVRV has been below 1.0 for approximately 15% of trading days, signaling a lack of positive momentum.
Historically, this metric has either led to short-term recoveries or worsened the situation further, potentially driving XRP to new lows. Based on current trends, XRP may face the latter scenario, with continued downward pressure.
Want more token insights like this? Sign up for Editor Harsh Notariya’s Daily Crypto Newsletter here.

In this context, the low MVRV ratio suggests that investors are hesitant to drive the price upward, and the market sentiment around XRP remains weak. Unless a significant catalyst emerges, the undervaluation reflected by this metric could continue to suppress XRP’s price in the near term.
XRP is also facing a shift in macro momentum, as the overall market sentiment appears to be turning bearish. The exchange net position change highlights an increase in selling pressure, with a decline in buying momentum.
As exchanges begin to register more inflows than outflows, the shift from buying to selling could signal that a downturn is imminent for XRP. This change in dynamics could put further strain on the altcoin, as it struggles to maintain upward momentum.
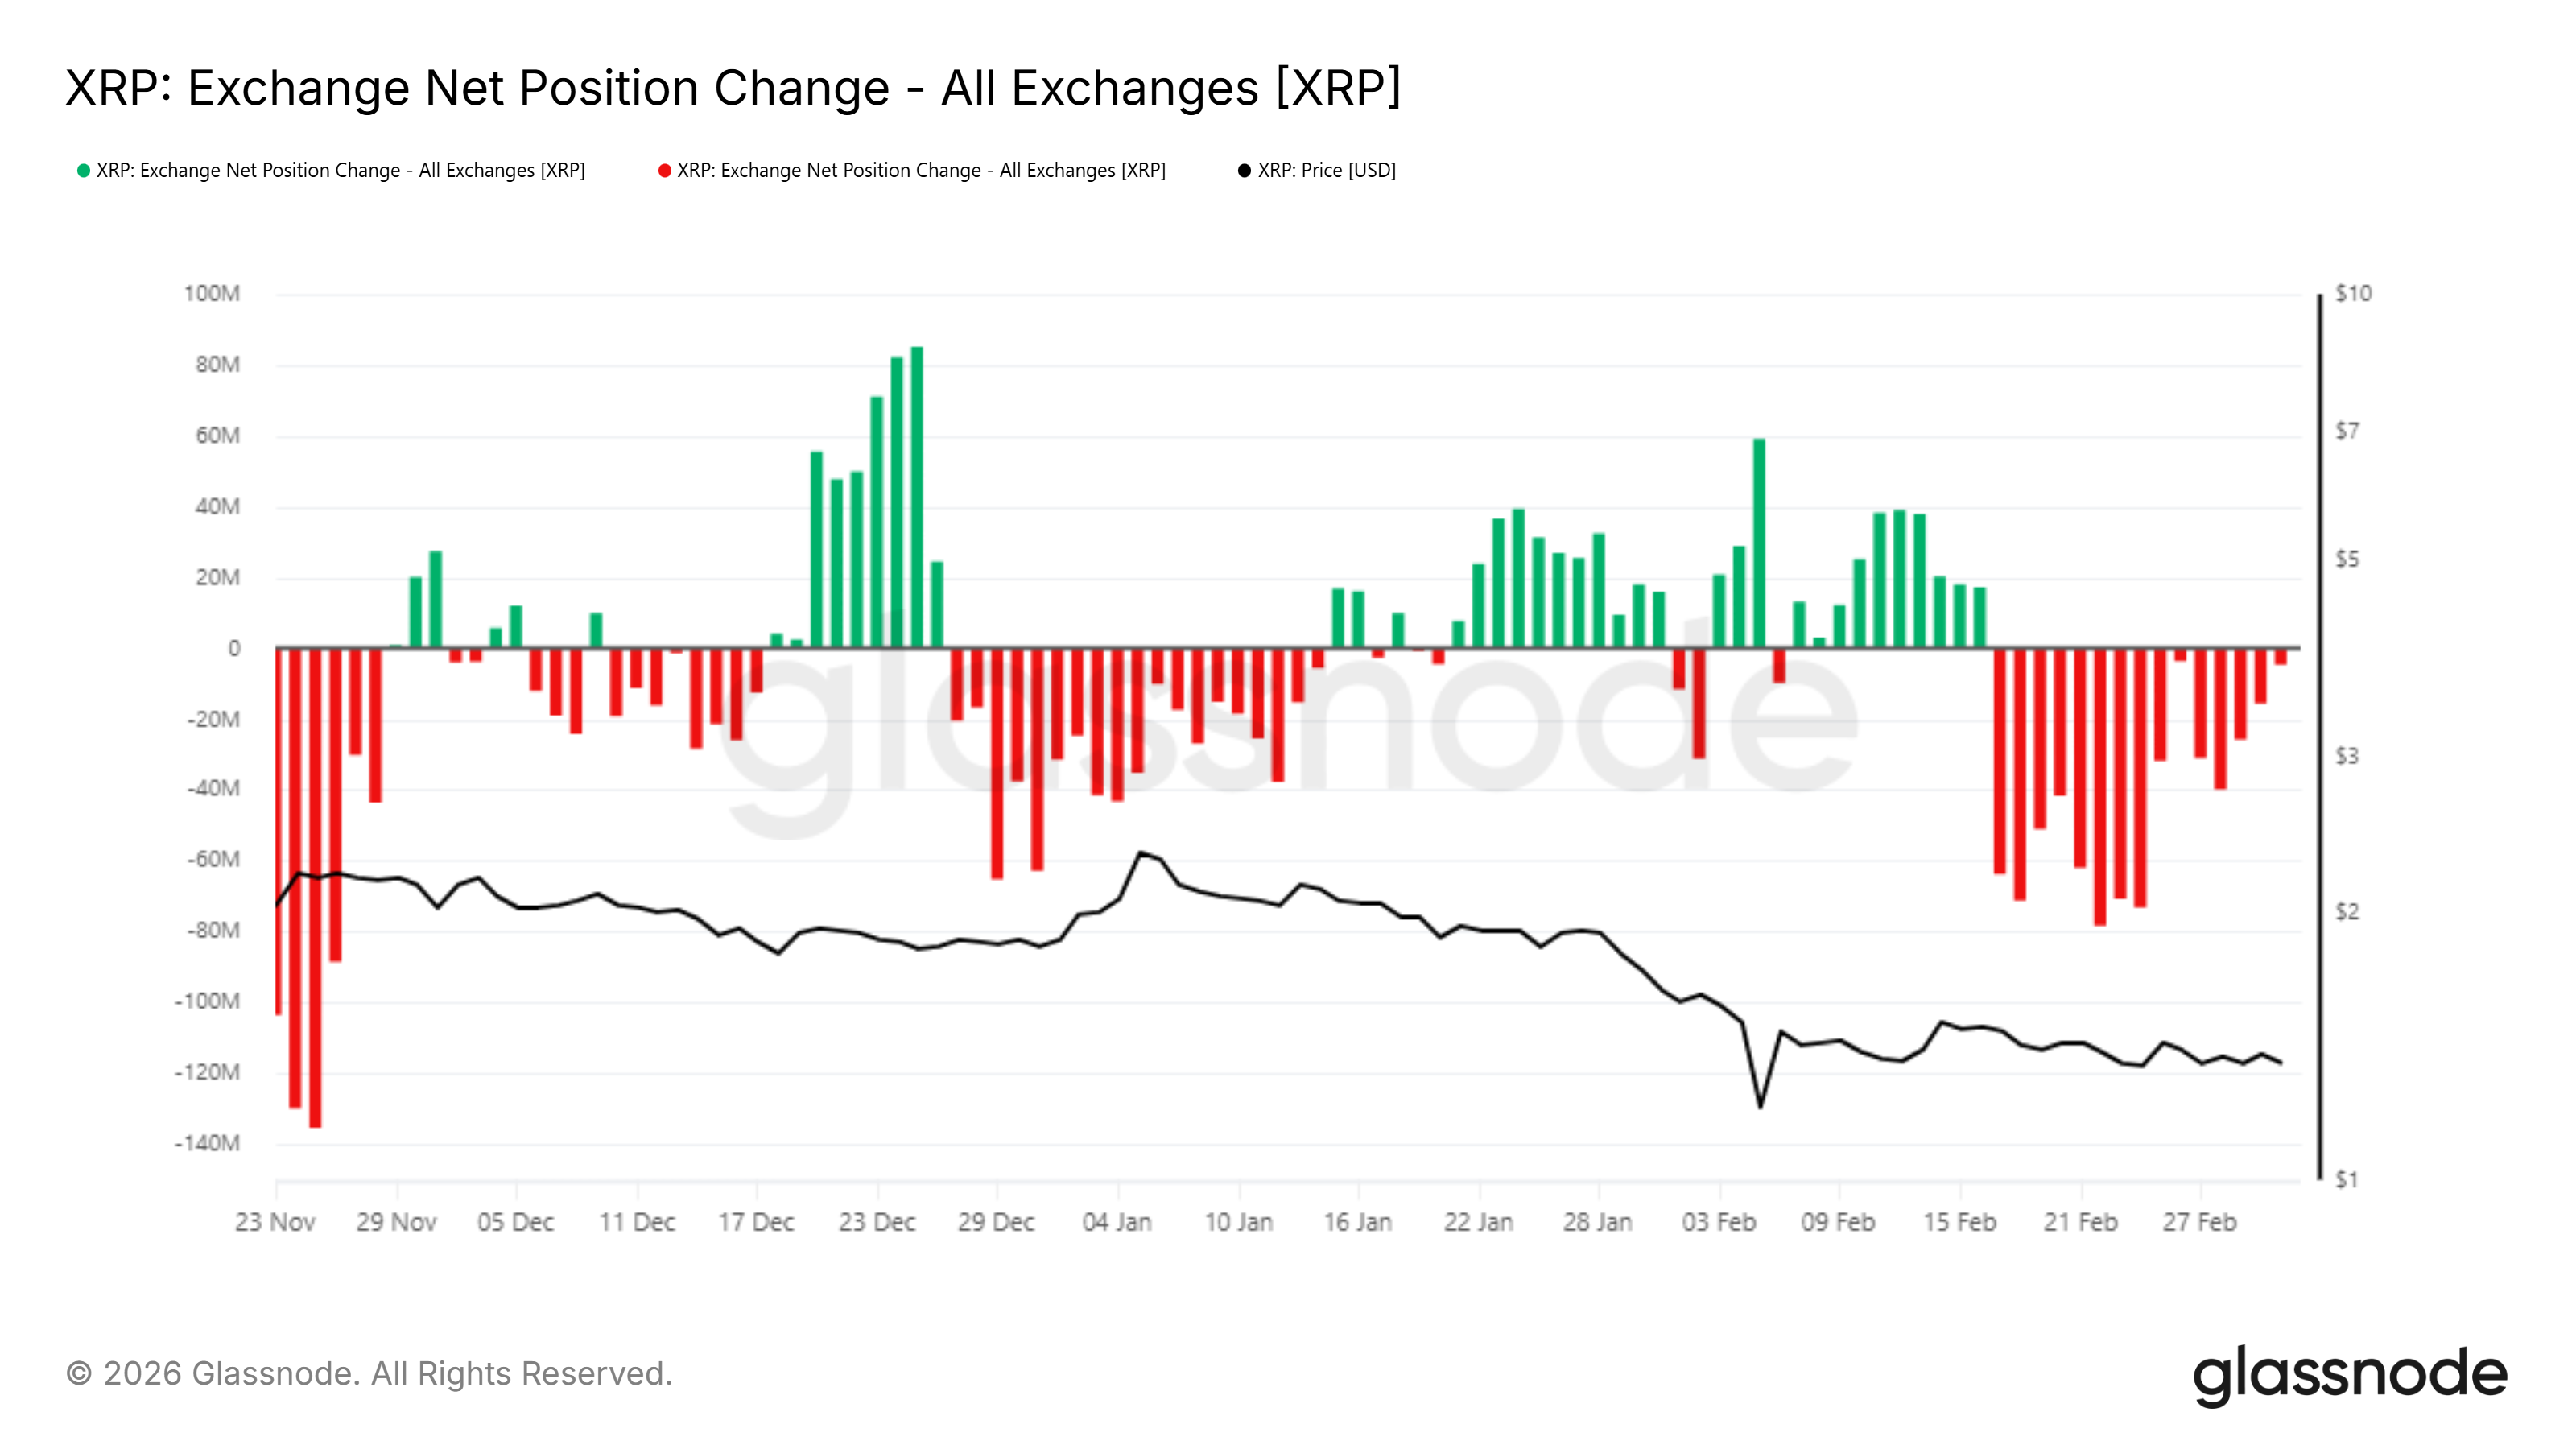
As buying slows down and selling picks up, XRP could see its price slip further. This shift in the macro momentum highlights the current market instability, which could contribute to a prolonged downtrend for XRP in the coming months.
XRP Price May Struggle To Recover
At the time of writing, XRP is trading at $1.35, caught within a range between $1.34 and $1.47. The downtrend that has persisted since the beginning of the year remains intact, with the cryptocurrency struggling to break free from the range. This resistance at $1.47 has proven difficult to overcome, while support at $1.34 has been tested multiple times.
Given the current market conditions and the pressure indicated by the MVRV ratio and macro momentum, XRP faces a bearish outlook in the short term. The price could break through the $1.34 support level, potentially falling to $1.21. This would signal a deeper decline and extend the ongoing downtrend, increasing the pressure on the altcoin.
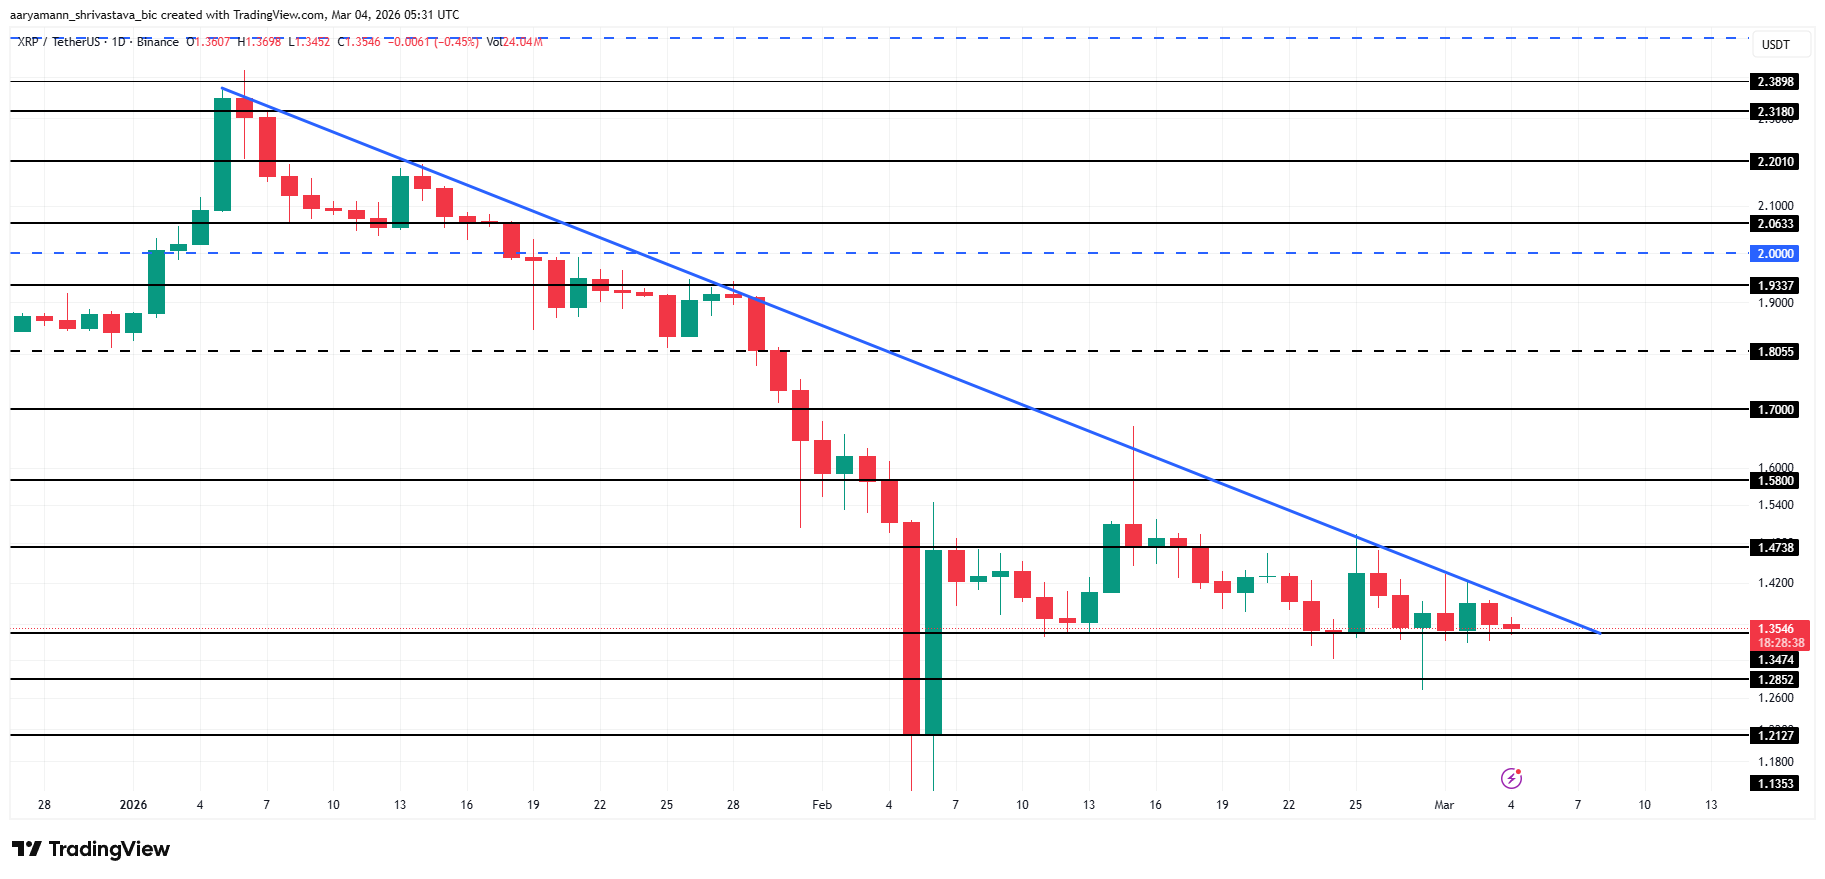
However, if XRP holders manage to find support from investors and buying momentum resumes, the altcoin could break through the $1.47 resistance level. A move above this level could propel XRP to $1.58, invalidating the bearish outlook and signaling the potential for a reversal. If XRP manages to sustain upward momentum, it could eventually target $1.70, marking a complete shift in market sentiment.

TLDR
- ServiceNow shares advanced 3.7% Tuesday, closing at $113.44 with approximately 17.5 million shares traded
- The enterprise software firm introduced AI-driven products: Autonomous Workforce and EmployeeWorks
- A strategic partnership with NTT DOCOMO and StarHub was announced for autonomous telecom roaming solutions
- Wall Street maintains a “Moderate Buy” rating with a consensus price target of $192.06
- Shares have declined 23.2% year-to-date and currently trade 45.8% beneath the 52-week peak of $208.94
Shares of ServiceNow (NOW) advanced 3.7% during Tuesday’s trading session, reaching an intraday peak of $114.92 before closing at $113.44. The stock finished Monday at $109.42.
Trading volume reached approximately 17.5 million shares for the day. This figure represented about 12% less than the stock’s typical daily volume of roughly 19.9 million shares.
The upward movement suggests bargain hunters are returning to the stock following a sustained selloff that has pressured enterprise software equities.
ServiceNow has declined 23.2% year-to-date in 2026. The current price level represents a 45.8% discount from the 52-week high of $208.94 reached in July 2025.
Tuesday’s rally reflects growing investor confidence that AI technologies may complement rather than displace enterprise software platforms. Company leadership has consistently challenged narratives suggesting AI will eliminate demand for their solutions.
Just five days earlier, the stock had already jumped 4.3% following comments from Nvidia’s CEO Jensen Huang, who dismissed concerns that AI would destroy the enterprise software industry. Those remarks triggered rallies across the sector, including gains for Zscaler (ZS) and CrowdStrike (CRWD).
Product Innovation and Strategic Partnership
ServiceNow unveiled two AI-enhanced solutions this week: Autonomous Workforce and EmployeeWorks. These offerings are designed to broaden workflow automation capabilities for enterprise clients.
The company simultaneously announced a strategic collaboration with NTT DOCOMO and StarHub. This partnership leverages ServiceNow CRM technology to enable autonomous roaming resolution for telecommunications providers — demonstrating application beyond the firm’s core IT service management offerings.
Additionally, HCLTech received ServiceNow’s 2026 Partner of the Year award, underscoring the strength of its partner ecosystem and channel strategy.
Financial Performance and Wall Street Outlook
ServiceNow delivered its latest quarterly earnings on January 28th, posting earnings per share of $0.92 — exceeding analyst expectations of $0.89 by $0.03.
Quarterly revenue totaled $3.57 billion, surpassing the Street’s estimate of $3.53 billion. This represented year-over-year growth of 20.7%. The company achieved a net profit margin of 13.16% and return on equity of 18.54%.
Analyst opinions on the stock’s trajectory vary significantly. Goldman Sachs maintains a $216 price objective. BNP Paribas recently lowered its target from $186 to $120 with a neutral stance. UBS established a $115 target.
According to MarketBeat data, the consensus recommendation stands at “Moderate Buy” with an average price target of $192.06. Among analysts tracking the stock, 32 rate it a Buy, three assign a Strong Buy, six recommend Hold, and two rate it a Sell.
The stock’s 50-day moving average currently sits at $125.70. Its 200-day moving average stands at $158.84.
Institutional ownership accounts for 87.18% of outstanding shares. Recent insider activity includes CFO Gina Mastantuono selling 2,075 shares in December at $170, while insider Kevin Thomas Mcbride sold 1,400 shares in February at $105.71.
Wall Street projects full-year earnings per share of $8.93 for the current fiscal year.
Last Wednesday, the closing price of Alibaba (BABA) shares was $152.28, while the closing price yesterday was $135.59, marking a 2026 low.
The roughly 10% decline was driven by a combination of bearish factors, including:
→ Unexpected resignation of Lin Junyang (Justin Lin) – Lin led Alibaba’s AI project Qwen, a key LLM platform. According to Reuters, this is the third notable departure from Qwen in 2026, and Lin has not provided a reason.
→ Overall bearish trend in tech stocks – High capital expenditures combined with uncertainty over profitability have weighed on the sector. Alibaba previously committed at least CNY 380 billion (around $52 billion) for AI and cloud infrastructure investments over three years.
→ Pressure from US regulators – Reports indicate that Alibaba was added to a list of companies cooperating with China’s military, potentially complicating business. Although the listing was later removed from the US Federal Register, the attempt itself increases the risk of new sanctions from the administration.
→ Geopolitical tensions – With the threat of the Middle East conflict escalating into a wider war, financial markets see increased demand for safe-haven assets. Chinese tech companies are particularly exposed to these pressures.
Despite these challenges, technical analysis offers hope for the bulls.

Technical Analysis of Alibaba (BABA) Shares
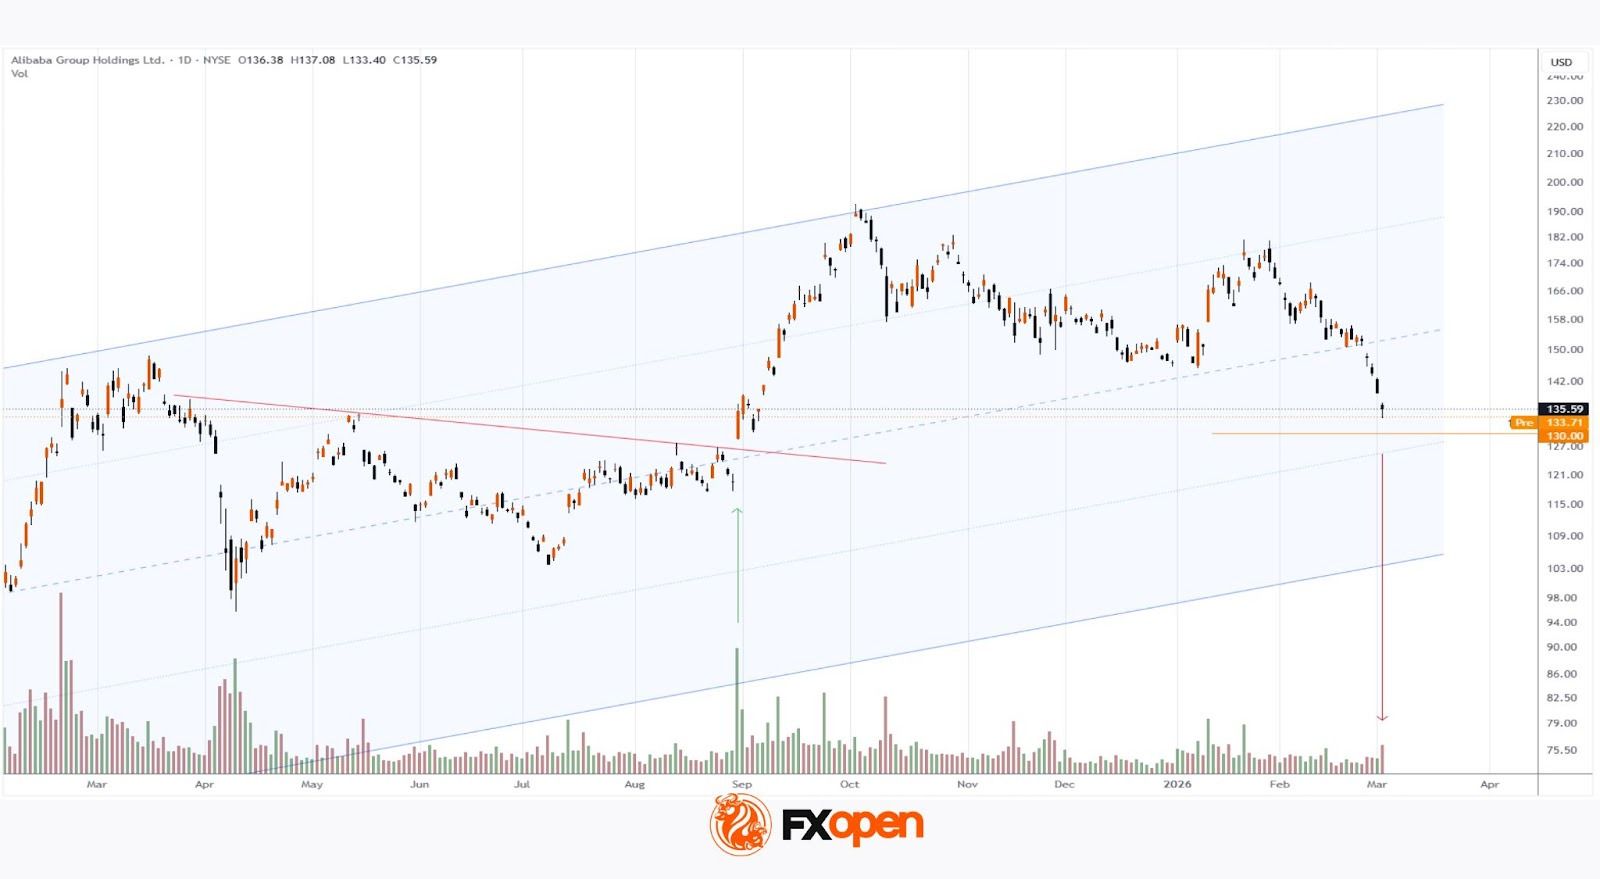
Take a look at the most recent BABA candlestick – the closing price is well above the low, while trading volume has surged to the highest level since late January. This can be interpreted as a sign of demand preventing further price declines.
Looking at history confirms this observation. In late August, BABA shares broke through the descending trendline and, on extremely high volumes, began a run towards multi-month highs.
At that time, demand clearly dominated – bulls may gain confidence near the $130 mark and prevent a deeper drop in the stock.
Buy and sell stocks of the world’s biggest publicly-listed companies with CFDs on FXOpen’s trading platform. Open your FXOpen account now or learn more about trading share CFDs with FXOpen.
This article represents the opinion of the Companies operating under the FXOpen brand only. It is not to be construed as an offer, solicitation, or recommendation with respect to products and services provided by the Companies operating under the FXOpen brand, nor is it to be considered financial advice.
Beldex presents a privacy-oriented blockchain ecosystem that aims to enable confidential, censorship-resistant digital interactions.
It’s common knowledge that transaction details on most public blockchains are transparent and traceable. Beldex, on the other hand, focuses on embedding privacy at the protocol level by combining confidential transactions with additional tools designed to protect browsing activity, communication, and digital identity.
At the heart of its ecosystem is the BDX token, which serves as the network’s native utility asset. It is used for a range of purposes, such as paying transaction fees, participating in masternodes, interacting with applications built within the Beldex ecosystem, and more.
While the project originated as a privacy-focused one, it has vastly expanded its scope to include decentralized networking, messaging, and identity services. This broader approach aims to position it as more than just a single-purpose privacy coin and to provide an integrated infrastructure for private digital activity.

Core Vision and Mission
The team has a clearly stated mission, which is centered on making privacy the default layer of digital interaction. Beldex is built around the idea that every user should be able to retain control over their financial data, online identities, and communications, without having to rely on centralized intermediaries.
That said, the core objectives of the project include:
- Transaction privacy
- Communication privacy
- Network privacy
- Decentralized identities
Beldex doesn’t just focus on financial transfers, but instead aims to create a layered stack of privacy-oriented capabilities. This includes decentralized networking infrastructure, user-facing applications such as browsers and messaging tools, blockchain-level confidentiality, and more.
History and Evolution
Initially launched in 2018 as a fork of Monero, in its early phases, Beldex operated under the proof-of-work (PoW) consensus algorithm, similar to how Monero functioned.
In December 2021, three years later, the team transitioned from Proof-of-Work to Proof-of-Stake (PoS), marking a significant structural shift in how the network functioned.
Under PoS, validators (known as masternodes) must lock up a minimum amount of 10000 BDX tokens to participate in governance and validate blocks.
There were a few factors that motivated this particular decision to transition:
- Improved efficiency
- Faster block times
- Lower transaction costs
- Higher throughput and scalability
- Opportunities for broader participation
In essence, this evolution from a Monero-derived privacy coin into a fully-fledged, independent PoS-based privacy infrastructure underscores its intent to expand.
Privacy and Cryptographic Foundations
As mentioned above, privacy in Beldex is embedded directly at the protocol level – it’s not an optional add-on. The network introduces additional upgrades, but also inherits several core privacy mechanisms from its origins as a fork of Monero.
On-Chain Privacy Mechanisms
Beldex leverages multiple cryptographic techniques to conceal transaction metadata.
Ring Signatures
Ring signatures are designed to allow a sender’s transaction to be mixed with several inputs – known as decoys. Observers can verify that one of the inputs is valid, but they cannot determine which one exactly initiated the transaction.
Stealth Addresses
The way transactions work on Beldex is that, instead of sending funds to a static public address, the network generates a one-time destination address for every transaction. Of course, the recipient can detect and spend the funds using their own private keys, but outside observers can hardly link multiple payments to the same recipient.
Ring Confidential Transactions (RingCT)
The goal of RingCT is to hide the amount that’s being transferred in a transaction. The network itself can verify that no coins are created or destroyed legitimately, but the transferred value itself is not visible to the public.
Bulletproof++
Through its Obscura update, Beldex integrated Bulletproof++ range proofs. These are designed to reduce the size of confidential transaction proofs. Smaller proofs, for their part, help with scalability, reduce the verification overhead, and lower transaction costs.
These mechanisms ensure that:
- Transaction amounts remain hidden
- Recipient addresses are unlinkable
- Sender identities are obfuscated
Network-Level Privacy
Even though transaction privacy protects on-chain information, metadata can still potentially be exposed at the network layer itself.
To combat this, Beldex incorporates:
- Decentralized node infrastructure
- Ongoing plans to implement routing improvements such as Dandelion++
- Integration with its own privacy network, BelNet
Consensus
As you already know, in December 2021, Beldex transitioned from a Proof-of-Work to a Proof-of-Stake governance model, and in doing so, replaced miners with stake-based validators known as masternodes.
Proof-of-Stake Model
Under PoS, validators are required to lock a minimum of 10,000 BDX to operate a masternode. In doing so, they become responsible for:
- Validating transactions
- Producing new blocks
- Securing the network
- Supporting ecosystem infrastructure components
The block times were also reduced considerably following the transition, which aimed to improve both latency and throughput.
Masternodes as Network Backbone
Undoubtedly, the core of the network are masternodes, which, beyond validation, they also support:
- Maintaining uptime, validating transactions, and securing the chain
- Protocol enforcement and consensus integrity
- Network services that are associated with privacy applications such as BChat, BelNet, and the Beldex Browser
- Infrastructure for decentralized services within the ecosystem
Operators receive staking rewards because they maintain the network’s uptime and also perform validation duties. However, as with many PoS systems, this requires a certain capital commitment.
Native Token: BDX
BDX serves as the native utility token of the network and functions as an economic layer, powering transactions, staking, validator participation, as well as interaction with the broader ecosystem.
Some of its core utilities include, but are not limited to:
- Transaction fees
- Staking and masternodes
- Ecosystem services
- BNS identity registrations
- Cross-chain usage
Keep in mind that BDX is positioned as a utility token within a broader infrastructure that also includes decentralized networking, identity services, and messaging.
Beldex: The Ecosystem
Beyond a confidential blockchain, Beldex extends into offering a set of privacy-oriented applications.
BChat
BChat is a decentralized privacy messaging app that is developed within the broader Beldex ecosystem. Its purpose is to provide a peer-to-peer, private communication without having to rely on centralized servers.
Some of the most important characteristics include:
- Decentralized infrastructure
- Decentralized message routing
- End-to-end encrypted messaging
- Optional use of the Beldex Name Service usernames instead of public keys
BelNet
BelNet is a decentralized virtual private network, as well as an onion-routing network that’s developed to anonymize internet traffic.
Instead of having to route traffic through a single centralized provider, BelNet distributes it across many nodes.
Some of its intended functions include:
- IP address masking
- Censorship resistance
- Community-run masternode relays and exit nodes
- Reduced dependency on centralized VPN operators
Beldex Browser
The Beldex Browser is focused on privacy and designed to block trackers, intrusive ads, and more.
It’s positioned as a user-friendly gateway into the broader Beldex privacy stack, combining traditional web browsing with decentralized networking tools.
Some of its features are:
- Tracker and ad blocking
- Censorship-free browsing
- Integration with BelNet for built-in anonymized browsing
Beldex Name System
Also known as BNS, the Beldex Name Service is a decentralized naming service that’s designed to map human-readable names to blockchain addresses. For example, yourname.bdx would be equivalent to your public address.
Some of its aims include:
- Enabling censorship-resistant domain ownership
- Simplifying user interaction with crypto addresses
- Providing consistent identities across Beldex apps and the ecosystem
Pros and Cons
Let’s address some of the key strengths of Beldex, as well as some of the challenges that it will inevitably have to face.
Pros/Strengths
- Ongoing technical development
- Ecosystem diversification
- Energy-efficient consensus mechanism
- Protocol-level confidentiality
- Integrated privacy architecture
Cons/Challenges
- Questionable broader regulatory environment
- Adoption competition
- Technical complexity
Conclusion
All in all, Beldex is building a privacy-focused blockchain project that has evolved from a Monero-based Proof-of-Work cryptocurrency into a broader, standalone ecosystem centered on confidential digital infrastructure.
Beyond what’s currently implemented, Beldex has also outlined additional enhancements, including VRF-based validator selection, Dandelion++ routing for network-layer obfuscation, and further research into Fully Homomorphic Encryption and Post Quantum Cryptography.
These initiatives suggest a continued focus on improving both privacy and security guarantees as well as the consensus’s overall robustness.
Binance Free $600 (CryptoPotato Exclusive): Use this link to register a new account and receive $600 exclusive welcome offer on Binance (full details).
LIMITED OFFER for CryptoPotato readers at Bybit: Use this link to register and open a $500 FREE position on any coin!

Gold price extended losses below $5,100 before the bulls appeared. WTI Crude oil prices are rising and could climb further higher toward $80.00.
Important Takeaways for Gold and WTI Crude Oil Prices Analysis Today
· Gold price failed to clear $5,420 and corrected lower against the US Dollar.
· There is a key bearish trend line forming with resistance at $5,255 on the hourly chart of gold at FXOpen.
· WTI Crude oil prices are moving higher above the $72.00 resistance zone.
· There is a bullish trend line forming with support near $72.85 on the hourly chart of XTI/USD at FXOpen.
Gold Price Technical Analysis
On the hourly chart of Gold at FXOpen, the price was able to climb above $5,150. The price even broke $5,250 before the bears appeared. The price traded toward $5,420 before there was a fresh decline.
There was a move below $5,250 and $5,050. The price settled below the 50-hour simple moving average, and RSI dipped below 40. Finally, it tested the $5,000 handle. A low was formed at $4,995 and the price is now attempting to recover.
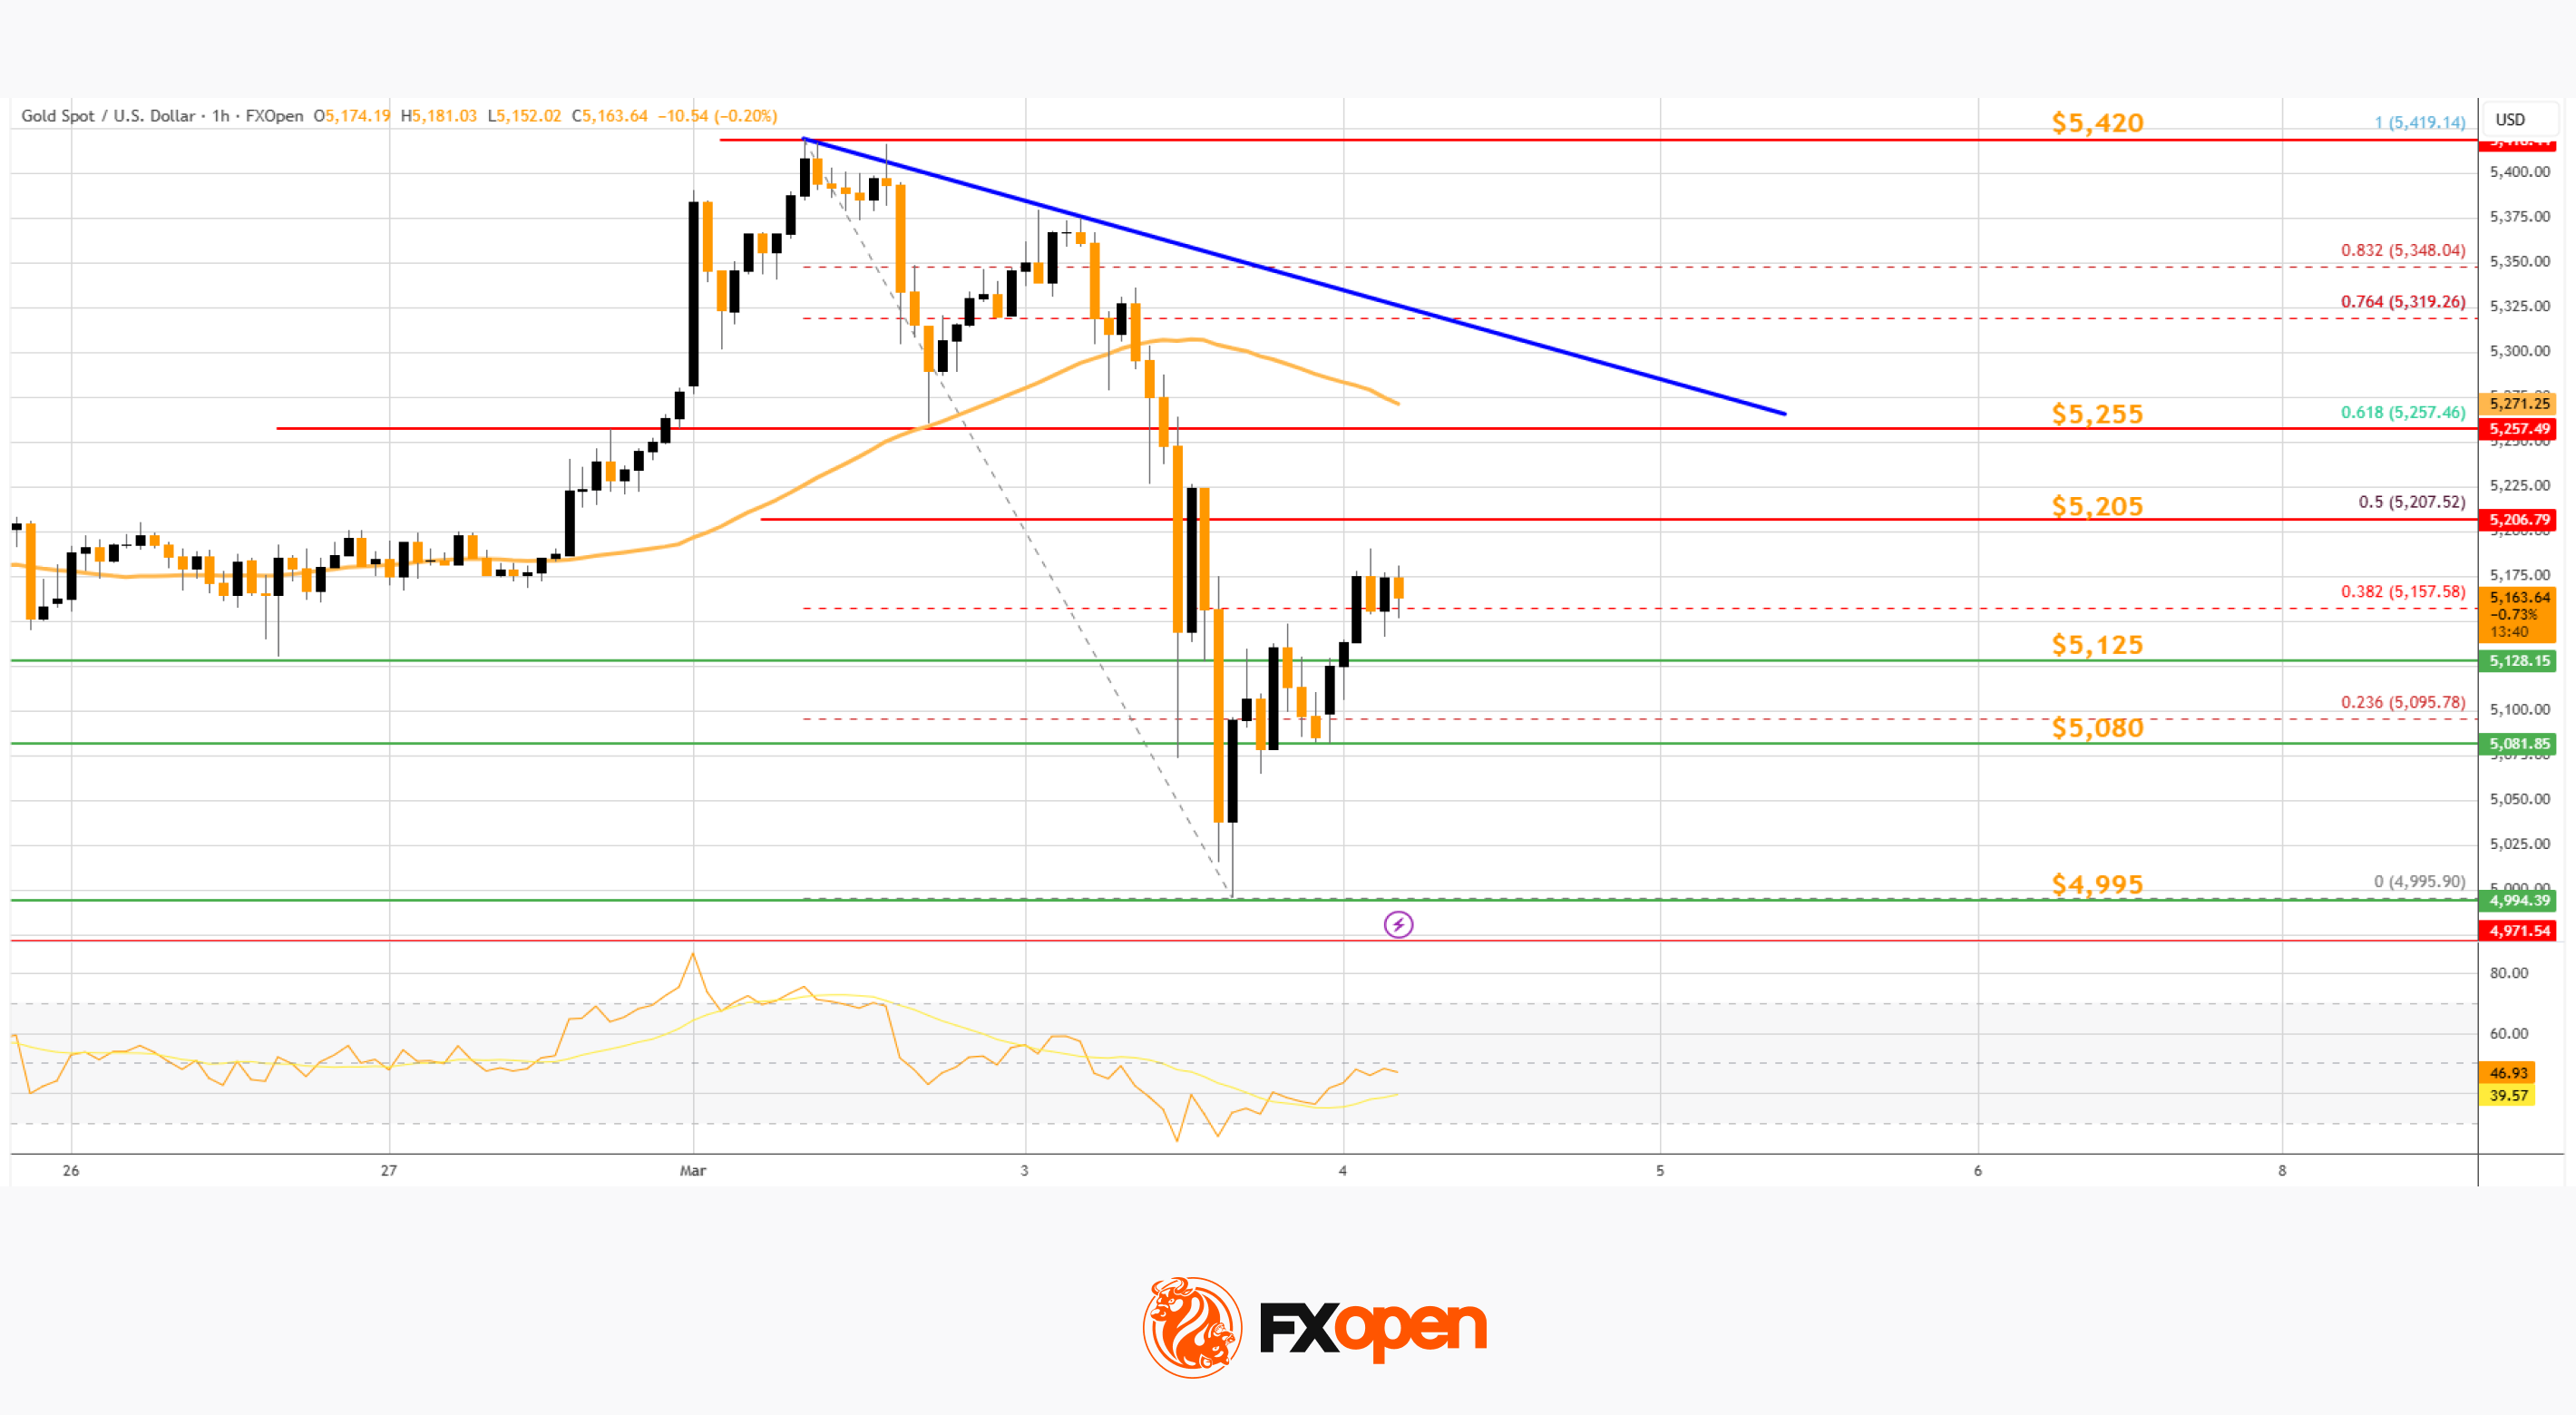
The price climbed above the 23.6% Fib retracement level of the downward move from the $5,419 swing high to the $4,995 low. Immediate resistance on the upside is $5,205 and the 50% Fib retracement.
The first major hurdle sits at $5,255. There is also a key bearish trend line forming with resistance at $5,255. A close above $5,255 could initiate a recovery wave to $5,420. An upside break above $5,420 could send Gold price toward $5,500. Any more gains may perhaps set the pace for an increase toward $5,650.
If there is no fresh increase, the price could continue to move down. Initial support on the downside is near the $5,125 level. The first key area of interest might be $5,080. If there is a downside break below $5,080, the price might decline further. In the stated case, the price might drop to $5,000.
WTI Crude Oil Price Technical Analysis
On the hourly chart of WTI Crude Oil at FXOpen, the price started a strong increase from $63.50 against the US Dollar. The price gained bullish momentum after it broke $68.00.
There was a sustained upward movement above $69.50 and $72.00. The bulls pushed the price above the 50-hour simple moving average, and the RSI climbed toward 80. A high was formed near $77.07 before there was a minor pullback.
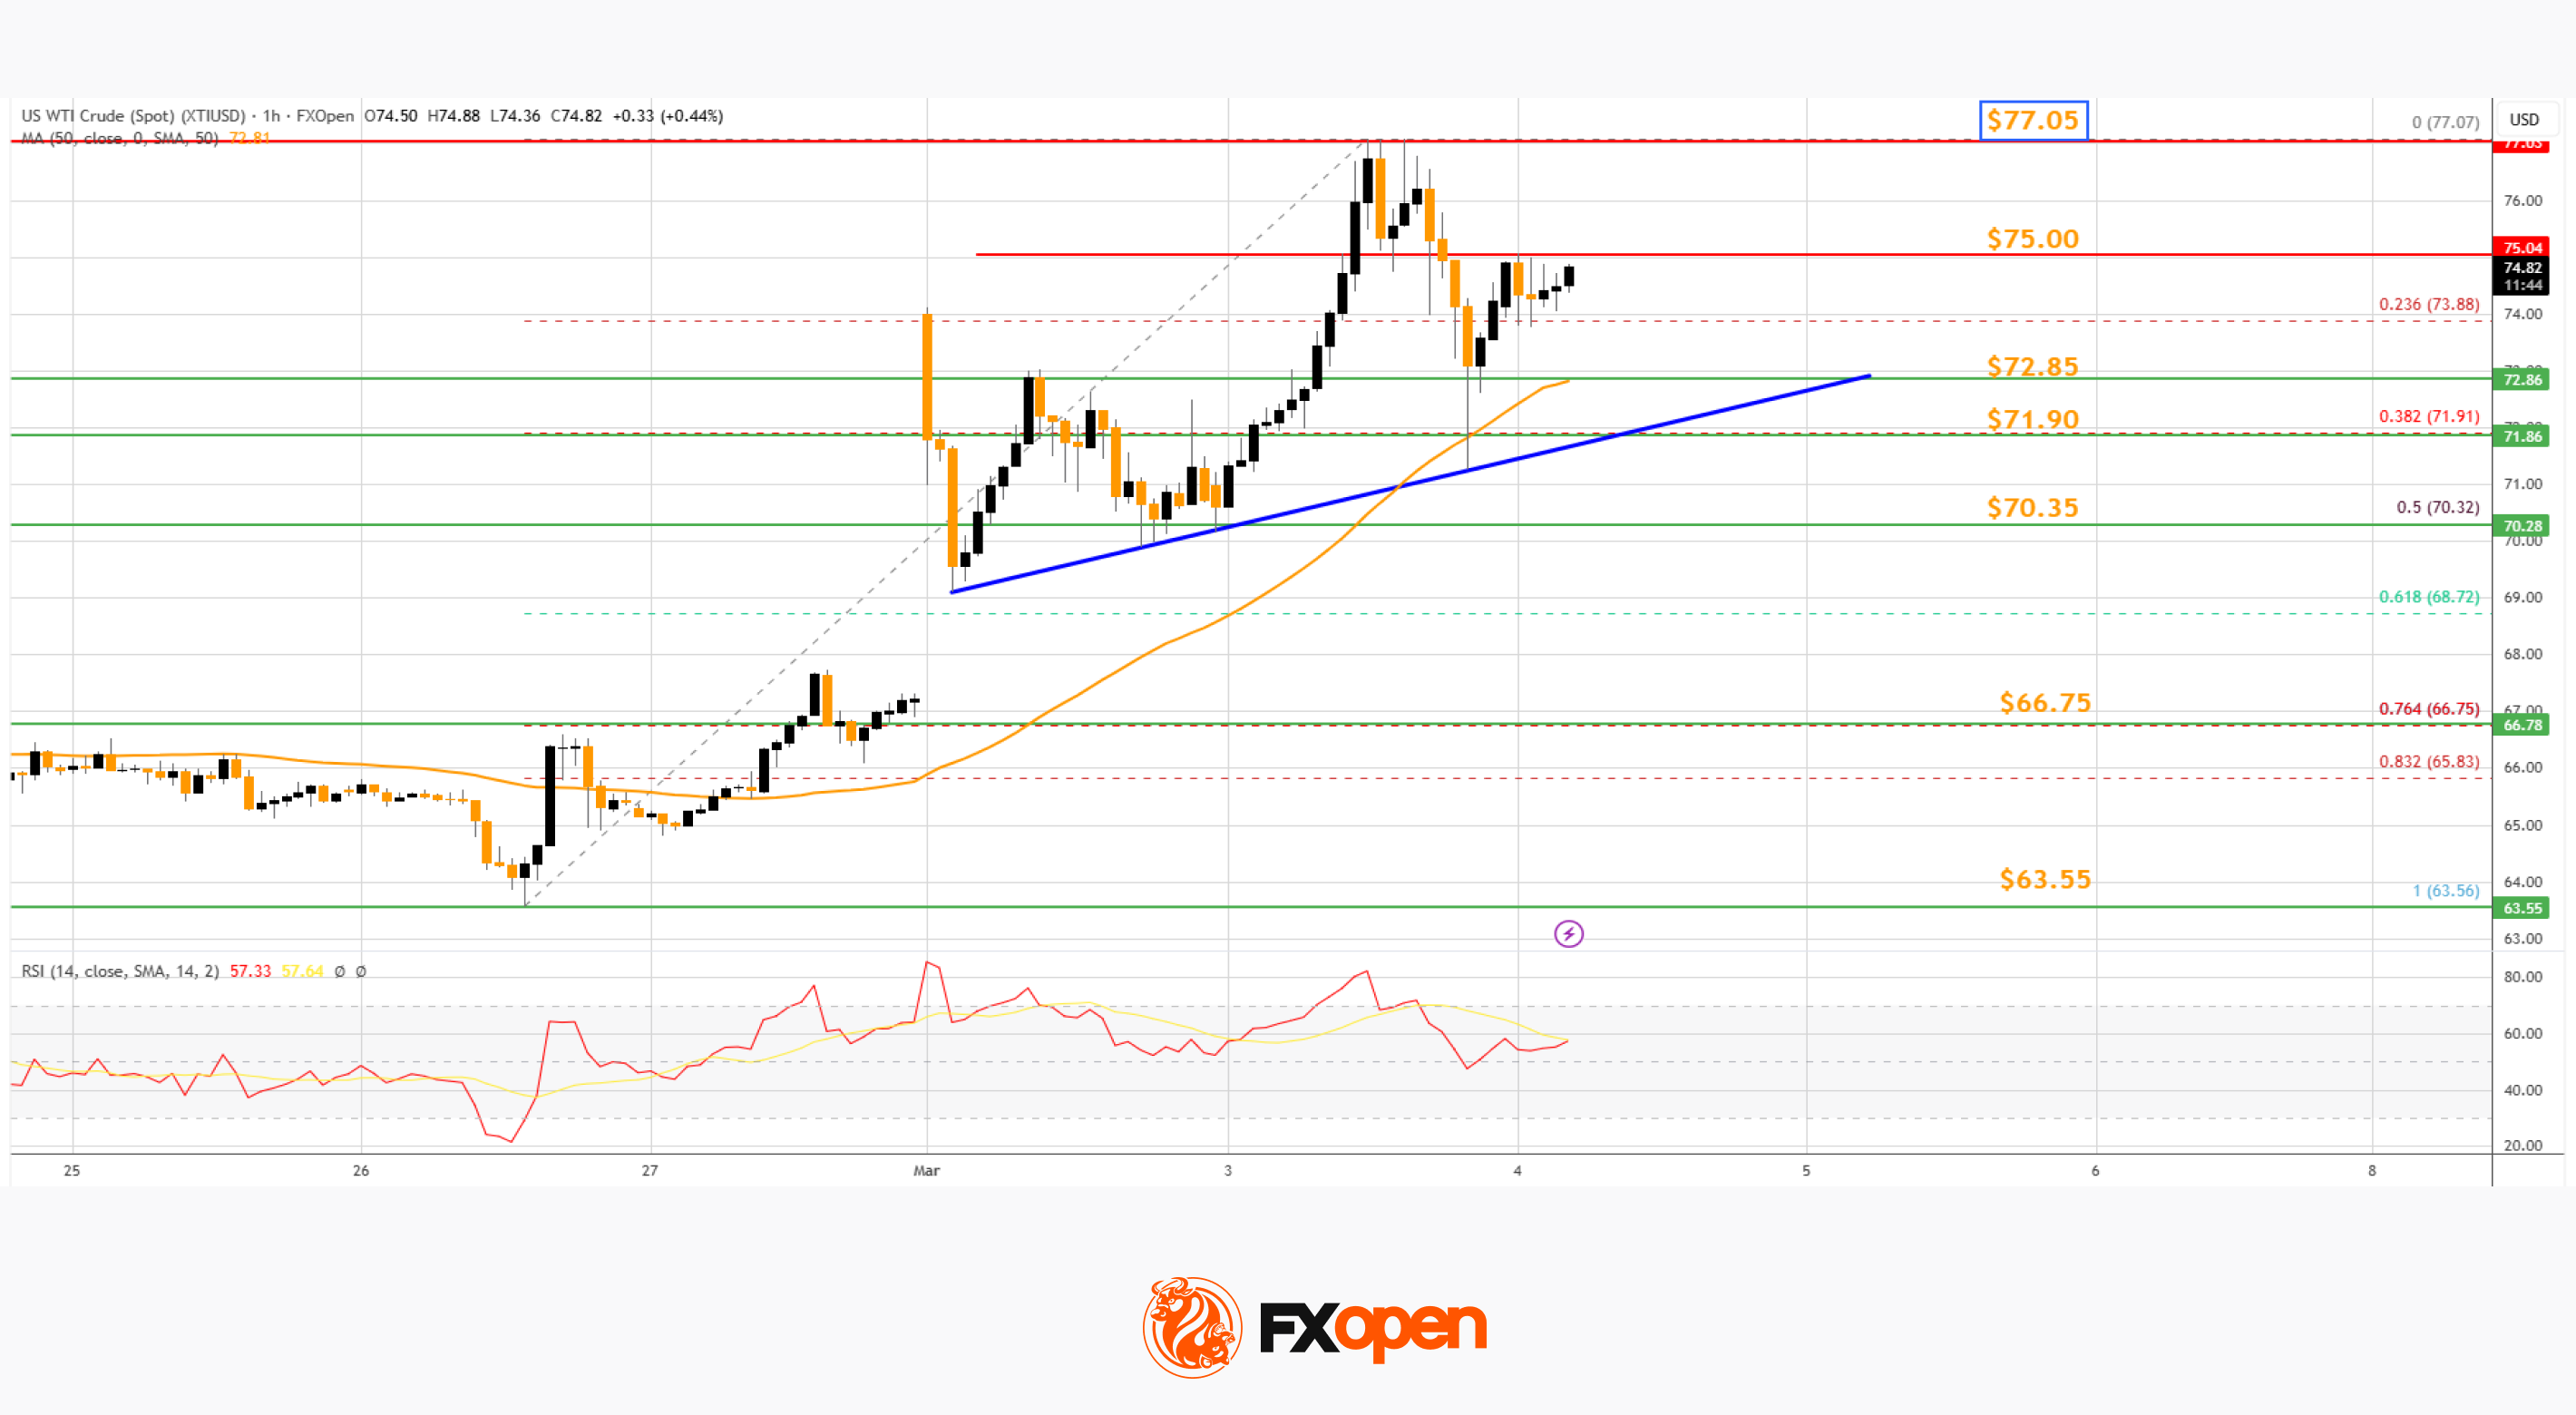
The price declined below the 23.6% Fib retracement level of the upward move from the $63.56 swing low to the $77.07 high. However, the bulls are active above $72.00. There is also a key bullish trend line forming with support near $72.85.
Immediate resistance is $75.00. If the price climbs further, it could face hurdles near $77.05. The next major stop for the bulls might be $78.00. Any more gain might send the price toward $80.00.
Conversely, the price might correct gains and retest the 50-hour simple moving average or the trend line. The next area of interest on the WTI crude oil chart is near the 50% Fib retracement at $70.35. If there is a downside break, the price might decline to $66.75. Any more losses may perhaps open the doors for a move toward $63.55.
Start trading commodity CFDs with tight spreads (additional fees may apply). Open your trading account now or learn more about trading commodity CFDs with FXOpen.
This article represents the opinion of the Companies operating under the FXOpen brand only. It is not to be construed as an offer, solicitation, or recommendation with respect to products and services provided by the Companies operating under the FXOpen brand, nor is it to be considered financial advice.

CPU benchmarks for M4 iPad Air show comparable scores to M4 iPad Pro

Financial Advisor CAREER 2023

Econ Engineering of Ripon supplies gritters to Marlborough


-

 Politics5 days ago
ITV enters Gaza with IDF amid ongoing genocide
-

 Politics1 day ago
Alan Cumming Brands Baftas Ceremony A ‘Triggering S**tshow’
-

 Fashion5 days ago
Weekend Open Thread: Iris Top
-

 Tech3 days ago
Unihertz’s Titan 2 Elite Arrives Just as Physical Keyboards Refuse to Fade Away
-

 NewsBeat6 days ago
Cuba says its forces have killed four on US-registered speedboat | World News
-
Sports4 days ago
The Vikings Need a Duck
-
 NewsBeat4 days ago
Dubai flights cancelled as Brit told airspace closed ’10 minutes after boarding’
-
 NewsBeat7 days ago
Manchester Central Mosque issues statement as it imposes new measures ‘with immediate effect’ after armed men enter
-

 NewsBeat3 days ago
‘Significant’ damage to boarded-up Horden house after fire
-
 NewsBeat4 days ago
The empty pub on busy Cambridge road that has been boarded up for years
-

 NewsBeat4 days ago
Abusive parents will now be treated like sex offenders and placed on a ‘child cruelty register’ | News UK
-

 Business6 days ago
Discord Pushes Implementation of Global Age Checks to Second Half of 2026
-

 Entertainment2 days ago
Baby Gear Guide: Strollers, Car Seats
-

 Business6 days ago
Only 4% of women globally reside in countries that offer almost complete legal equality
-
 Tech5 days ago
NASA Reveals Identity of Astronaut Who Suffered Medical Incident Aboard ISS
-
Politics3 days ago
FIFA hypocrisy after Israel murder over 400 Palestinian footballers
-
 NewsBeat3 days ago
Emirates confirms when flights will resume amid Dubai airport chaos
-

 Crypto World5 days ago
From Crypto Treasury to RWA: ETHZilla Retreats and Relaunches as Forum Markets on Nasdaq
-

 NewsBeat2 days ago
Is it acceptable to comment on the appearance of strangers in public? Readers discuss
-

 Tech3 days ago
Viral ad shows aged Musk, Altman, and Bezos using jobless humans to power AI