

Crypto World
XRP Must Clear This Key Level to Invalidate Bearish Structure

Analyst EGRAG says only a weekly close above a certain level would flip XRP’s long-running descending channel bullish.
XRP is attempting to push above the 200 EMA and the $1.55 level, a move that market analyst EGRAG CRYPTO says would signal short-term strength if confirmed with a weekly close.
Despite the attempted rally, the token remains trapped inside a descending channel that has defined its price action for months, leaving the broader trend corrective until a breakout above $2.20 flips the structure bullish.
XRP Tests 200 EMA
In a post published on X on March 4, EGRAG CRYPTO said XRP is “pushing above 200 EMA” but warned that the price is still trading inside a descending channel on the weekly timeframe.
According to their breakdown, a weekly close above $1.55 would weaken the current downward trajectory, while a close above $2.20 would invalidate the bearish structure and open the path toward $2.70 to $3.60.
If XRP fails to reclaim $1.55, the analyst outlined a move toward $1.26, with a possible sweep of macro support between $0.95 and $0.85. In a separate post, they assigned a 55% to 65% probability to a deeper sweep and a 35% to 45% chance of an early breakout reclaim.
“Structure > Emotion,” they wrote, arguing that the descending channel still defines the trend. The technical standoff comes at a time when derivatives and spot activity are contracting. Analyst Amr Taha previously noted that XRP futures open interest had dropped 70% since October 2025, falling to $203 million.
Binance open interest slipped below $270 million, levels last seen in April 2025 before a major rally. Historically, such resets have coincided with local bottoms as leverage is cleared out, though they do not guarantee a rebound.
You may also like:
Price Action Reflects Fragile Recovery
At the time of writing, data from CoinGecko showed that XRP had gained about 4% in the last 24 hours and roughly 3% over the past week, bouncing from a recent low near $1.27.
Even so, the token remains down more than 12% over 30 days and about 40% across the past year. Furthermore, it is still more than 61% below its July 2025 all-time high of $3.65.
The recent rebound has occurred within a 24-hour range between $1.34 and $1.42, with market capitalization holding near $86 billion.
For now, the weekly close relative to $1.55 is the immediate focus. A decisive break above $2.20 would alter the chart structure described by EGRAG, while rejection below the 200 EMA will keep the descending channel intact and leave lower supports in play.
Binance Free $600 (CryptoPotato Exclusive): Use this link to register a new account and receive $600 exclusive welcome offer on Binance (full details).
LIMITED OFFER for CryptoPotato readers at Bybit: Use this link to register and open a $500 FREE position on any coin!

Crypto World
Bitcoin (BTC) Price Surges Past $73K Amid $1.47B ETF Inflow Surge and Brandt’s Bullish Pivot

Key Highlights
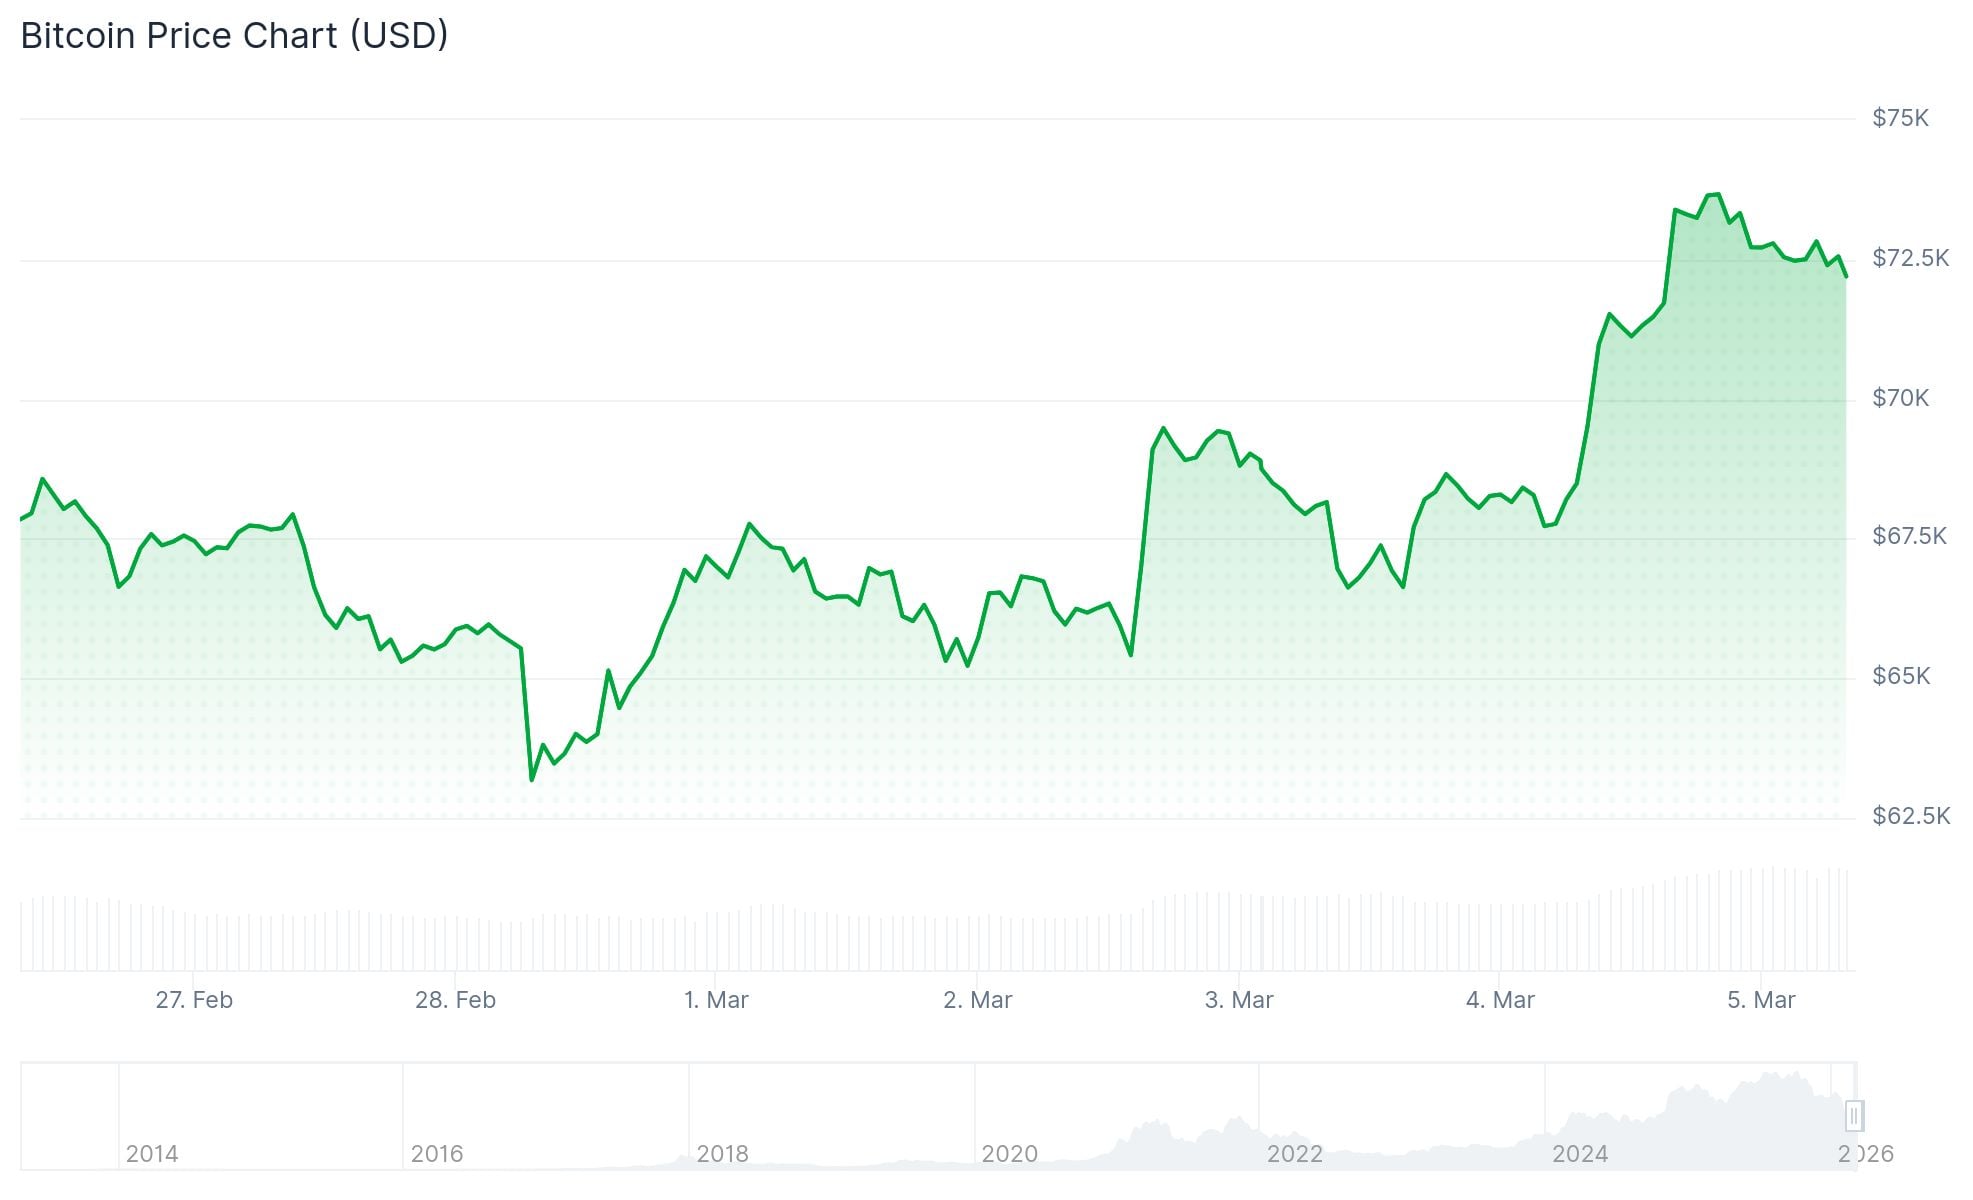
- Bitcoin breached the $73,000 threshold Thursday, fluctuating between $72,500 and $73,187 during trading sessions
- Spot Bitcoin ETFs in the United States attracted $155M Wednesday, contributing to a two-week accumulation totaling $1.47B
- Legendary market analyst Peter Brandt indicated current market dynamics could represent a reversal from October’s highs
- BTC has outpaced gold performance following Iranian military strikes, gaining over 10% versus gold’s nearly 2% decline
- Glassnode blockchain analytics reveal caution signals: approximately 57% of circulating BTC remains profitable
Bitcoin has successfully reclaimed the $70,000 threshold this week, touching an intraday peak of $73,544 throughout Asian market sessions before experiencing a modest correction to approximately $72,500 during Thursday’s London trading window.
The upward momentum accompanies a comprehensive rally across risk-sensitive assets following market volatility triggered by coordinated U.S. and Israeli military operations against Iranian targets this past weekend.
The cryptocurrency advanced 8% Wednesday during American trading windows before experiencing a 1.8% decline Thursday. South Korea’s Kospi index surged 11% while Japan’s Nikkei climbed 4.2% simultaneously, demonstrating widespread market stabilization.
Bitcoin’s Coinbase premium indicator — which had briefly turned negative Sunday — has now inverted. Market analyst Ted Pillows observed it achieved its strongest reading since October 2025, suggesting robust demand from American institutional participants.
“Market sentiment is experiencing a bullish transformation within cryptocurrency circles,” stated Caroline Mauron, Orbit Markets co-founder.
From the trading session preceding Iranian strikes, Bitcoin has appreciated more than 10%. Conversely, gold declined nearly 2% during this identical timeframe. This represents a notable departure from recent monthly patterns, where gold consistently established new records while Bitcoin experienced downward pressure.
Bitcoin ETF Capital Flows Continue Strong Momentum
U.S.-listed spot Bitcoin exchange-traded funds recorded approximately $155 million in net positive flows Wednesday. This continues a sustained two-week pattern accumulating roughly $1.47 billion in fresh capital deployment, based on SoSoValue analytics.
March has already witnessed more than $1.1 billion channeled into American Bitcoin ETF products, including a remarkable $462 million single-day allocation, according to Bloomberg intelligence.
Bitfinex market strategists have cautioned that ETF capital inflows don’t necessarily correlate directly with immediate spot market purchases, considering authorized participants can establish ETF shares prior to acquiring underlying Bitcoin assets.
Veteran Trader Peter Brandt Adjusts Market Outlook
Seasoned market veteran Peter Brandt, who maintained pessimistic positioning since October’s approximate $127,500 peak, shared on X platform this week that present market structure represents “the significant change of price behavior since the top in Oct.”
Bitmine executive chairman Tom Lee responded to Brandt’s commentary, characterizing it as a “potential inflection/change Bitcoin” development.
Market commentator Milk Road highlighted $225.2 million in ETF accumulation on a single day and $458.2 million the preceding session — approaching $700 million across 48 hours — suggesting this volume could fundamentally alter supply-demand equilibrium.
Near-term resistance zones exist between $75,000 and $78,000 levels. Downside support appears established at $65,000 and $60,000 thresholds.
Notwithstanding the recovery, Glassnode data indicates approximately 57% of Bitcoin circulating supply currently trades above acquisition cost — a metric historically associated with early bearish market phases. Short-term holder cost basis clustering near $70,000 could function as resistance, potentially converting upward movements into selling opportunities.
U.S. Treasury Secretary Scott Bessent announced a 15% universal tariff implementation will likely commence this week, potentially creating market headwinds.


Dogecoin price is close to confirming a bullish breakout from a symmetrical triangle pattern amid a surge in demand on the derivatives market.
Summary
- Dogecoin price hit weekly high after reports of U.S.-Iran negotiations calmed investor fears.
- Dogecoin is close to confirming a bullish symmetrical triangle breakout.
Dogecoin (DOGE) price shot up 17% to a weekly high of $0.103 on Thursday morning Asian time before settling at $0.096 at press time.
Dogecoin’s rally was supported by investor fears cooling off after reports surfaced that Iran has secretly been negotiating a deal with the U.S. to de-escalate the ongoing conflict between the two nations.
A look at its futures market shows that more investors are now betting in favor of a Dogecoin rally.
According to CoinGlass data weighted funding rate for Dogecoin has turned positive, signalling that long traders are paying short traders to maintain their positions as they anticipate further gains. Such conditions tend to influence retail sentiment positively.
On the daily chart, Dogecoin price is close to confirming a breakout from the upper side of a symmetrical triangle pattern. When an asset breaks out from the upper side of a symmetrical triangle, it is viewed as a very positive signal and typically marks the beginning of a sustained bullish trend.
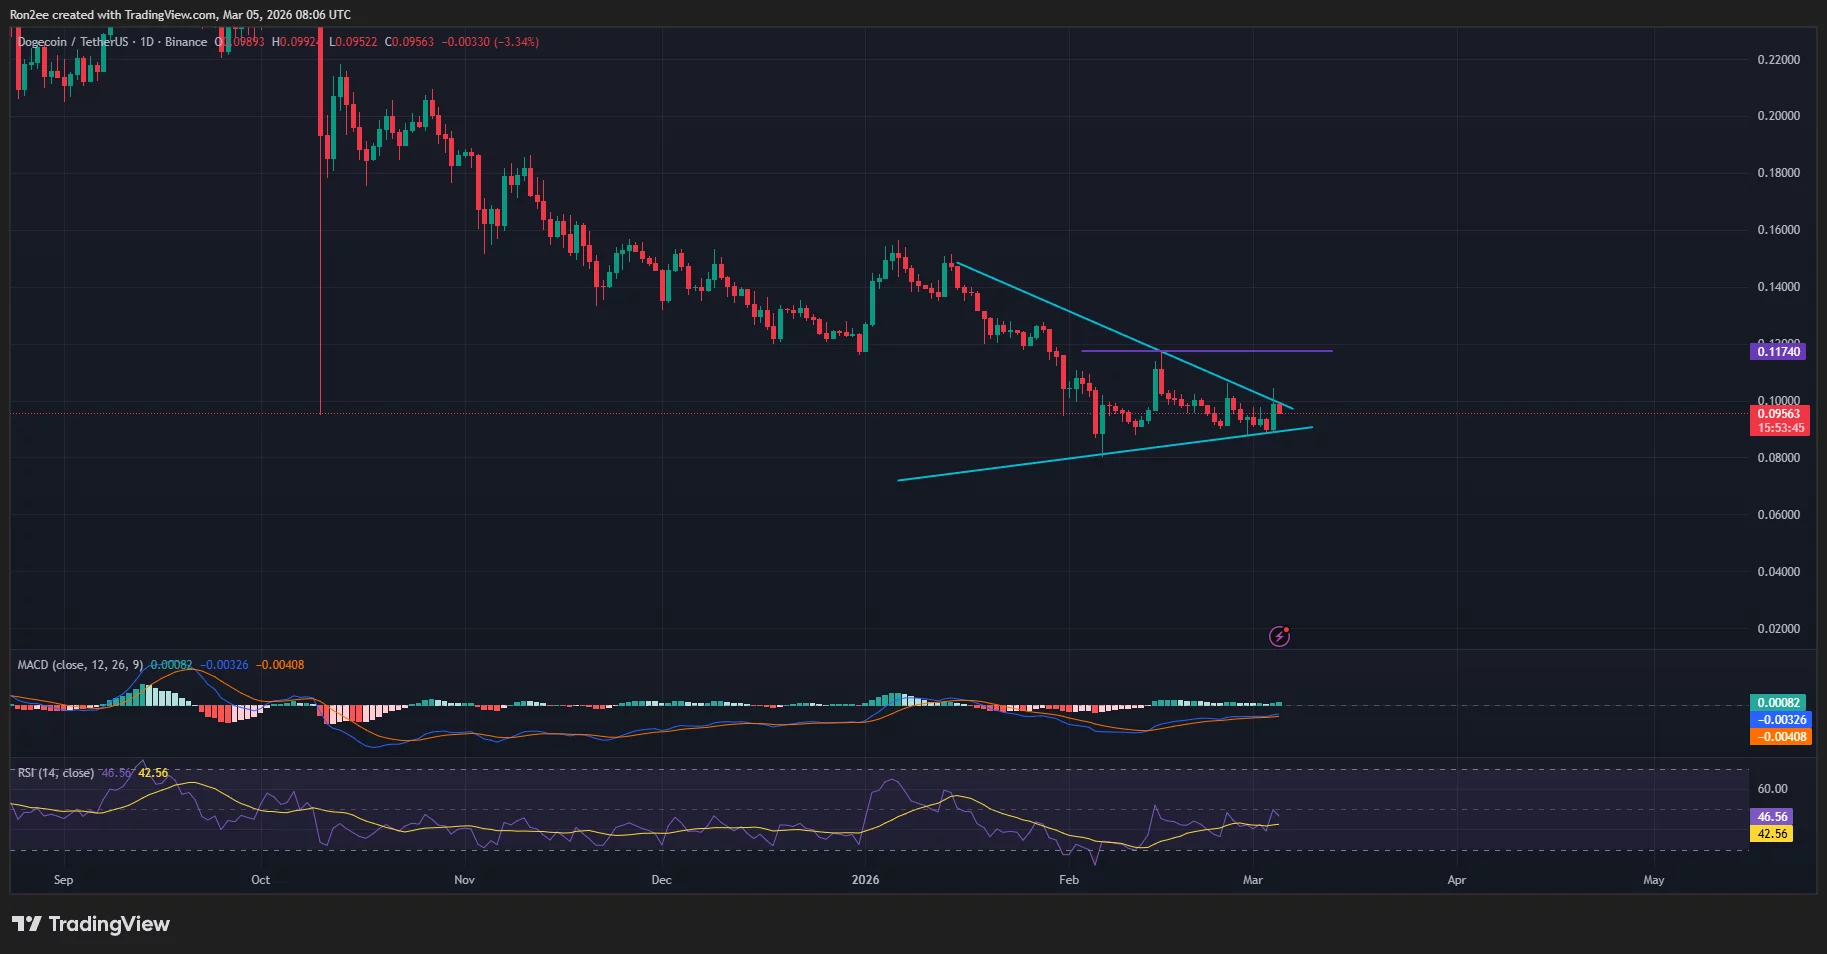
For Dogecoin, a breakout from the pattern could trigger bulls to aggressively push the price to reclaim its February high of around $0.117.
Momentum indicators like the MACD and RSI seem to support the bullish path. The MACD lines were moving upwards while the RSI was close to breaking out of the neutral threshold, which is often the spark needed for a massive rally during periods of high market volatility.
However, it should be noted that a break below the $0.080 support would invalidate the bullish setup.
Meanwhile, a major headwind for Dogecoin is the weak demand for spot ETFs tied to the meme coin, which could limit any sustained rally.
Notably, the three spot DOGE ETFs have so far managed to draw in only $7.45 million in net inflows since their launch in November. These institutional products had gone through a month of no flows before attracting only $779,000 in inflows on March 2.
Traders may see the muted involvement from major investors as a sign that institutional players remain unconvinced about the meme coin’s long-term prospects, even as retail demand stays strong.
Disclosure: This article does not represent investment advice. The content and materials featured on this page are for educational purposes only.

Solana and XRP are holding key technical levels as traders prepare for the release of the February U.S. employment report, a major macro event that could influence risk sentiment across financial markets, including cryptocurrencies.
Summary
- Solana and XRP traders are watching the February U.S. employment report, a key indicator that could shape expectations for Federal Reserve policy and risk appetite.
- SOL is stabilizing near $91 with accumulation indicators improving, suggesting buyers are gradually returning after February’s sell-off.
- XRP is trading around $1.42, with momentum indicators pointing to weakening bearish pressure and a potential move toward resistance if macro conditions turn favorable.
Investors closely watch the U.S. nonfarm payrolls report because strong labor market data could reinforce expectations that the Federal Reserve will keep interest rates elevated for longer.
Conversely, weaker data may strengthen the case for rate cuts later this year, potentially boosting demand for risk assets such as cryptocurrencies.
Against this backdrop, several altcoins have entered consolidation phases following February’s market turbulence, when geopolitical tensions and broader risk-off sentiment weighed on crypto prices.
Solana price outlook
Solana is trading near $90.9 after recovering from a sharp early-February decline that briefly pushed the token toward the $70 region.
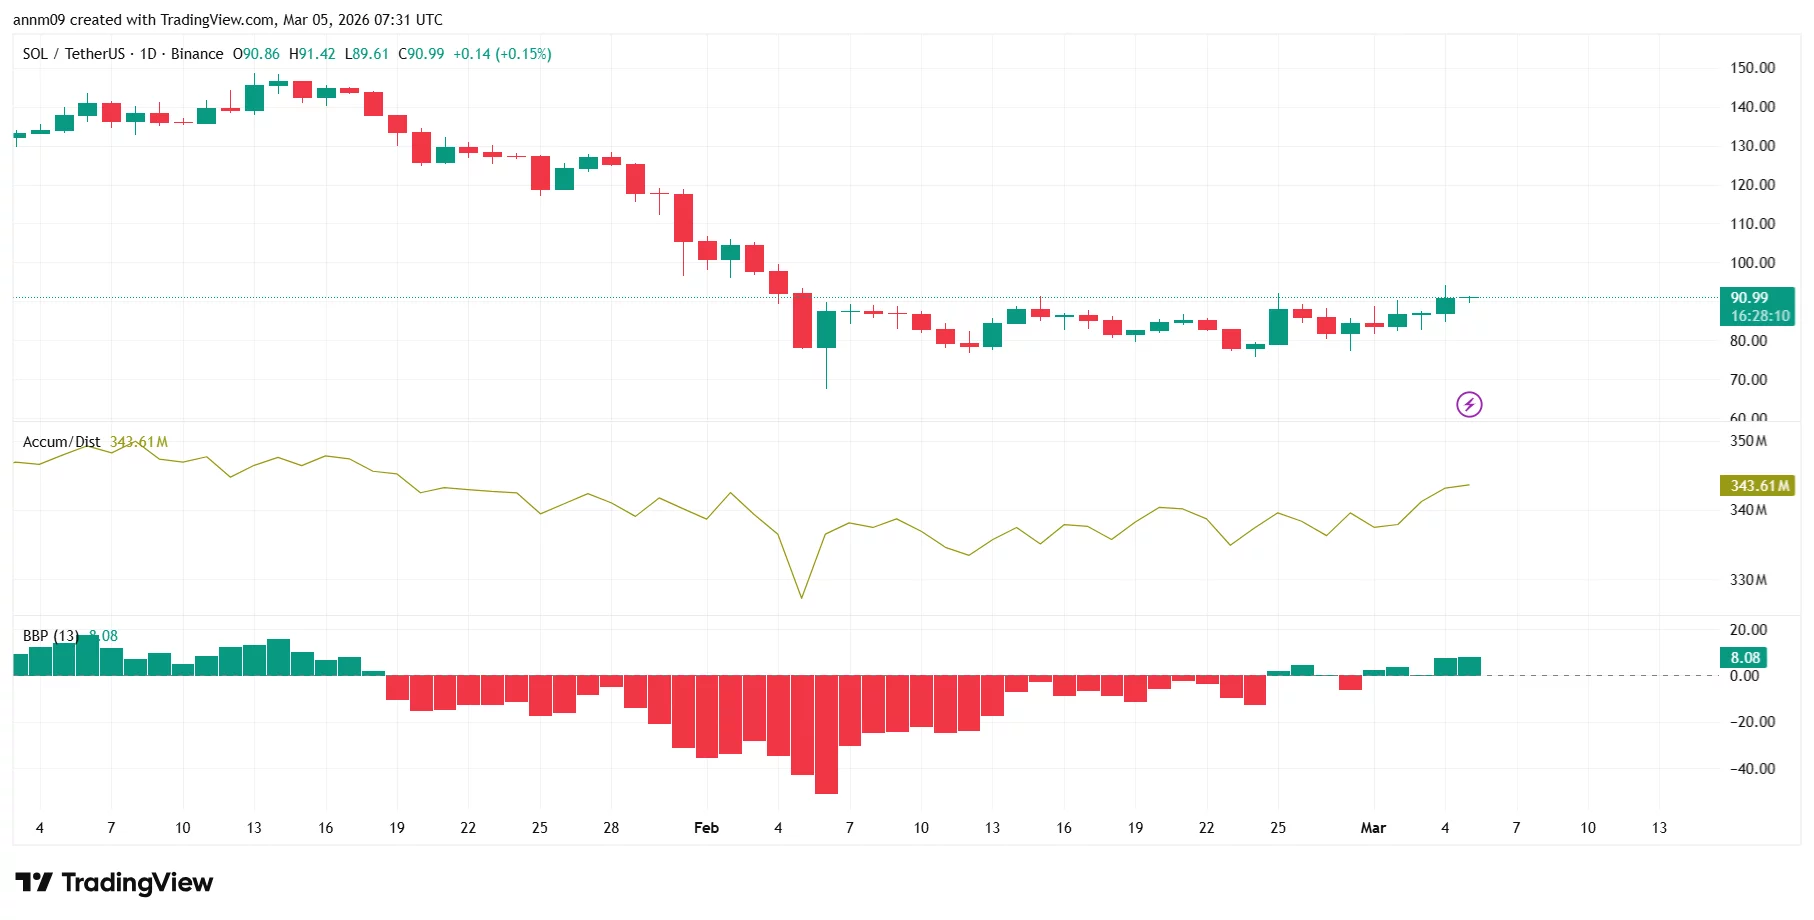
The daily chart shows SOL forming a gradual recovery structure as buyers step in near lower levels. The Accumulation/Distribution indicator is trending higher, signaling that investors may be steadily accumulating the token.
Meanwhile, the Bull Bear Power (BBP) indicator has turned positive, suggesting improving bullish momentum after weeks of persistent selling pressure.
If momentum continues, SOL could test resistance near $95, with a stronger breakout potentially opening the door toward the $100 psychological level.
However, downside risks remain. A break below $85 support could expose the token to renewed selling pressure and potentially send it back toward the $80–$78 region.
XRP price outlook
XRP is currently trading around $1.42, where it has been moving sideways after a prolonged decline from earlier highs near $2.
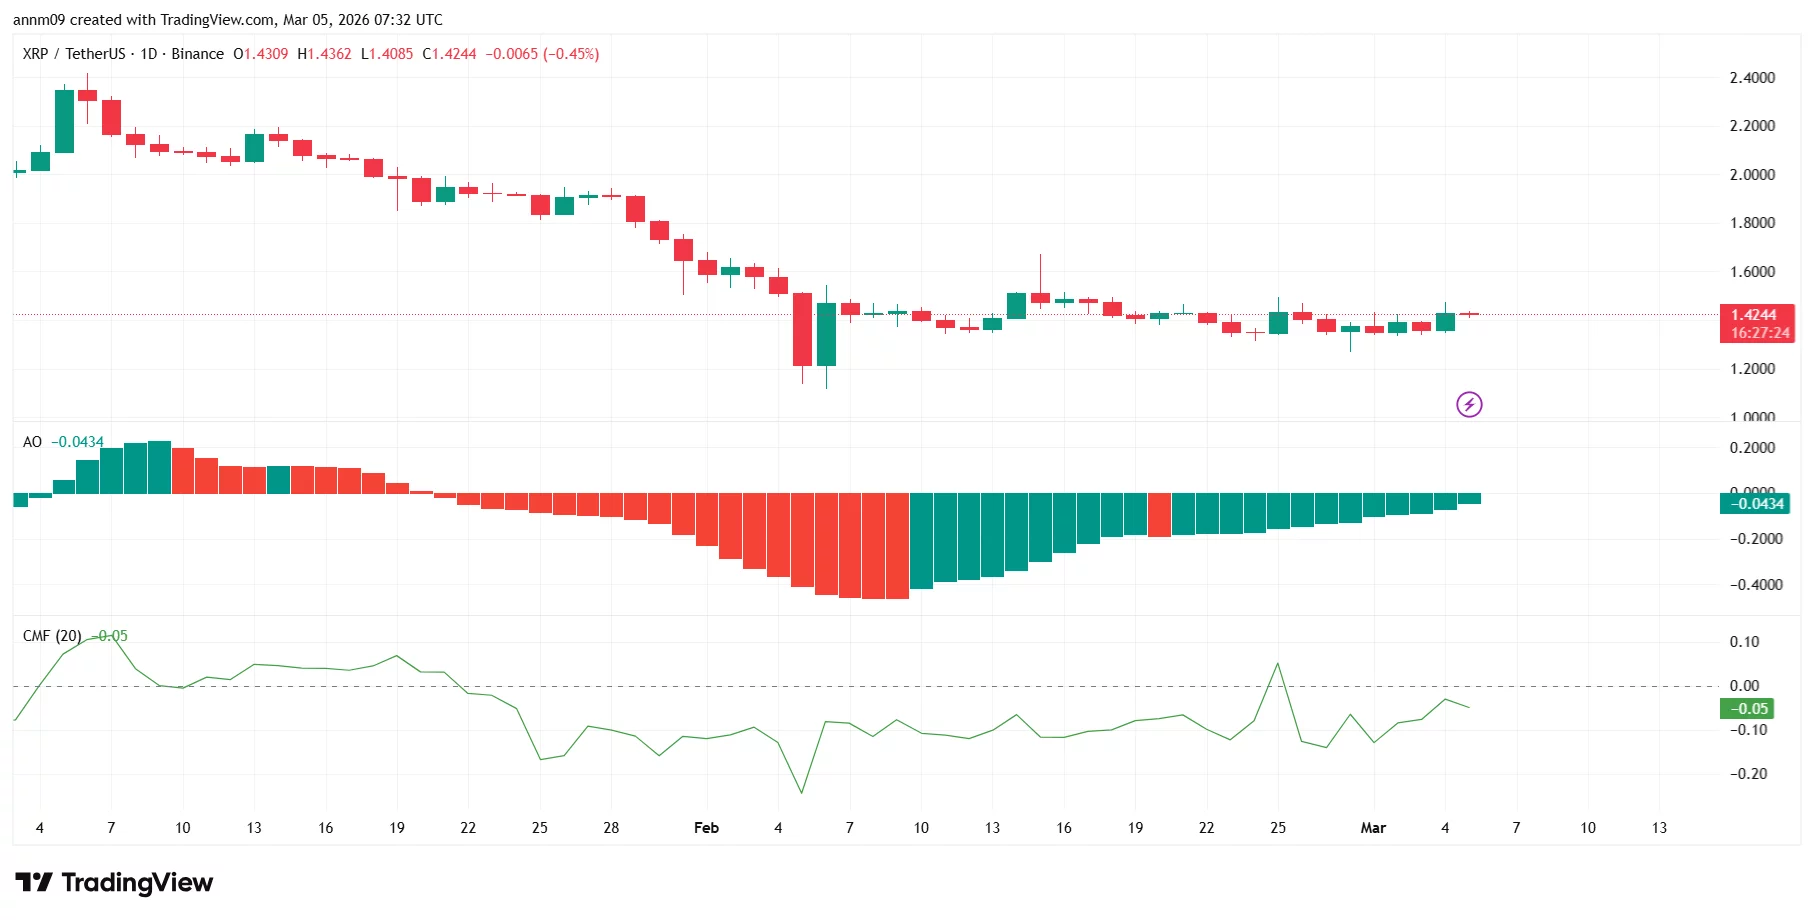
Technical indicators suggest bearish momentum may be fading. The Awesome Oscillator is gradually turning positive, while the Chaikin Money Flow indicator is stabilizing, signaling that capital outflows are slowing.
If buying pressure strengthens, XRP could attempt a move toward resistance near $1.50, followed by a potential test of the $1.60 zone.
On the downside, the key support level sits near $1.35, and a breakdown below that threshold could send XRP toward the $1.25 area.
With both tokens consolidating, the upcoming U.S. employment report may act as the next major catalyst determining whether Solana and XRP extend their recovery or face another round of volatility.

Anthropic CEO Dario Amodei has reportedly reopened negotiations with the US Department of Defense in a last-minute effort to secure continued access to Pentagon contracts as the company faces the possibility of being labeled a supply chain risk by the Trump administration.
Amodei has been holding discussions with Emil Michael, the US undersecretary of defense for research and engineering, to finalize terms governing the military’s use of Anthropic’s artificial intelligence models, the Financial Times reported, citing people familiar with the matter.
A new agreement would allow the Pentagon to keep using the company’s technology and could prevent a formal designation that would force contractors in the defense supply chain to cut ties with the AI developer, per the report.
The talks follow a sharp breakdown in negotiations last week. Michael reportedly accused Amodei of being a “liar” with a “God complex,” while discussions collapsed after the two sides failed to agree on language Anthropic said was necessary to prevent misuse of its technology.
Related: Ex-OpenAI researcher’s hedge fund reveals big Bitcoin miner bets in new SEC filing
Pentagon negotiations stall over bulk data analysis clause
In an internal memo to staff seen by the FT, Amodei reportedly wrote that near the end of negotiations, the Pentagon offered to accept Anthropic’s broader terms if the company removed a clause restricting the “analysis of bulk acquired data.” He said this phrase was meant to guard against potential mass domestic surveillance, a scenario Anthropic treats as a red line, alongside the use of AI in lethal autonomous weapons.
The dispute escalated after Defense Secretary Pete Hegseth warned that Anthropic could be designated a supply chain risk, a move that would effectively freeze the company out of US military procurement networks.

The standoff came despite Anthropic’s existing ties to the defense sector. The company was awarded a contract worth up to $200 million by the US Defense Department in July 2025 and it became the first AI provider whose models were used in classified environments and by national security agencies.
As Cointelegraph reported, the US military even used Anthropic’s Claude AI model to support a major air strike on Iran hours after President Donald Trump ordered federal agencies to stop using the company’s systems.
Related: Mining companies move deeper into AI, HPC as MARA may sell Bitcoin
Tech groups warn risk label could hurt US AI leadership
Meanwhile, in a Wednesday letter to Trump, tech groups warned that labeling a domestic AI company a supply chain risk could undermine US leadership in AI. The groups argued that treating a US technology company “as a foreign adversary, rather than an asset,” could discourage innovation and weaken America’s ability to compete with China in the global AI race.
Signatories included the Software & Information Industry Association, TechNet, the Computer & Communications Industry Association and the Business Software Alliance. These organizations represent hundreds of American tech companies, including AI chipmakers Nvidia, Alphabet’s Google and Apple.
Magazine: Bitcoin may take 7 years to upgrade to post-quantum — BIP-360 co-author
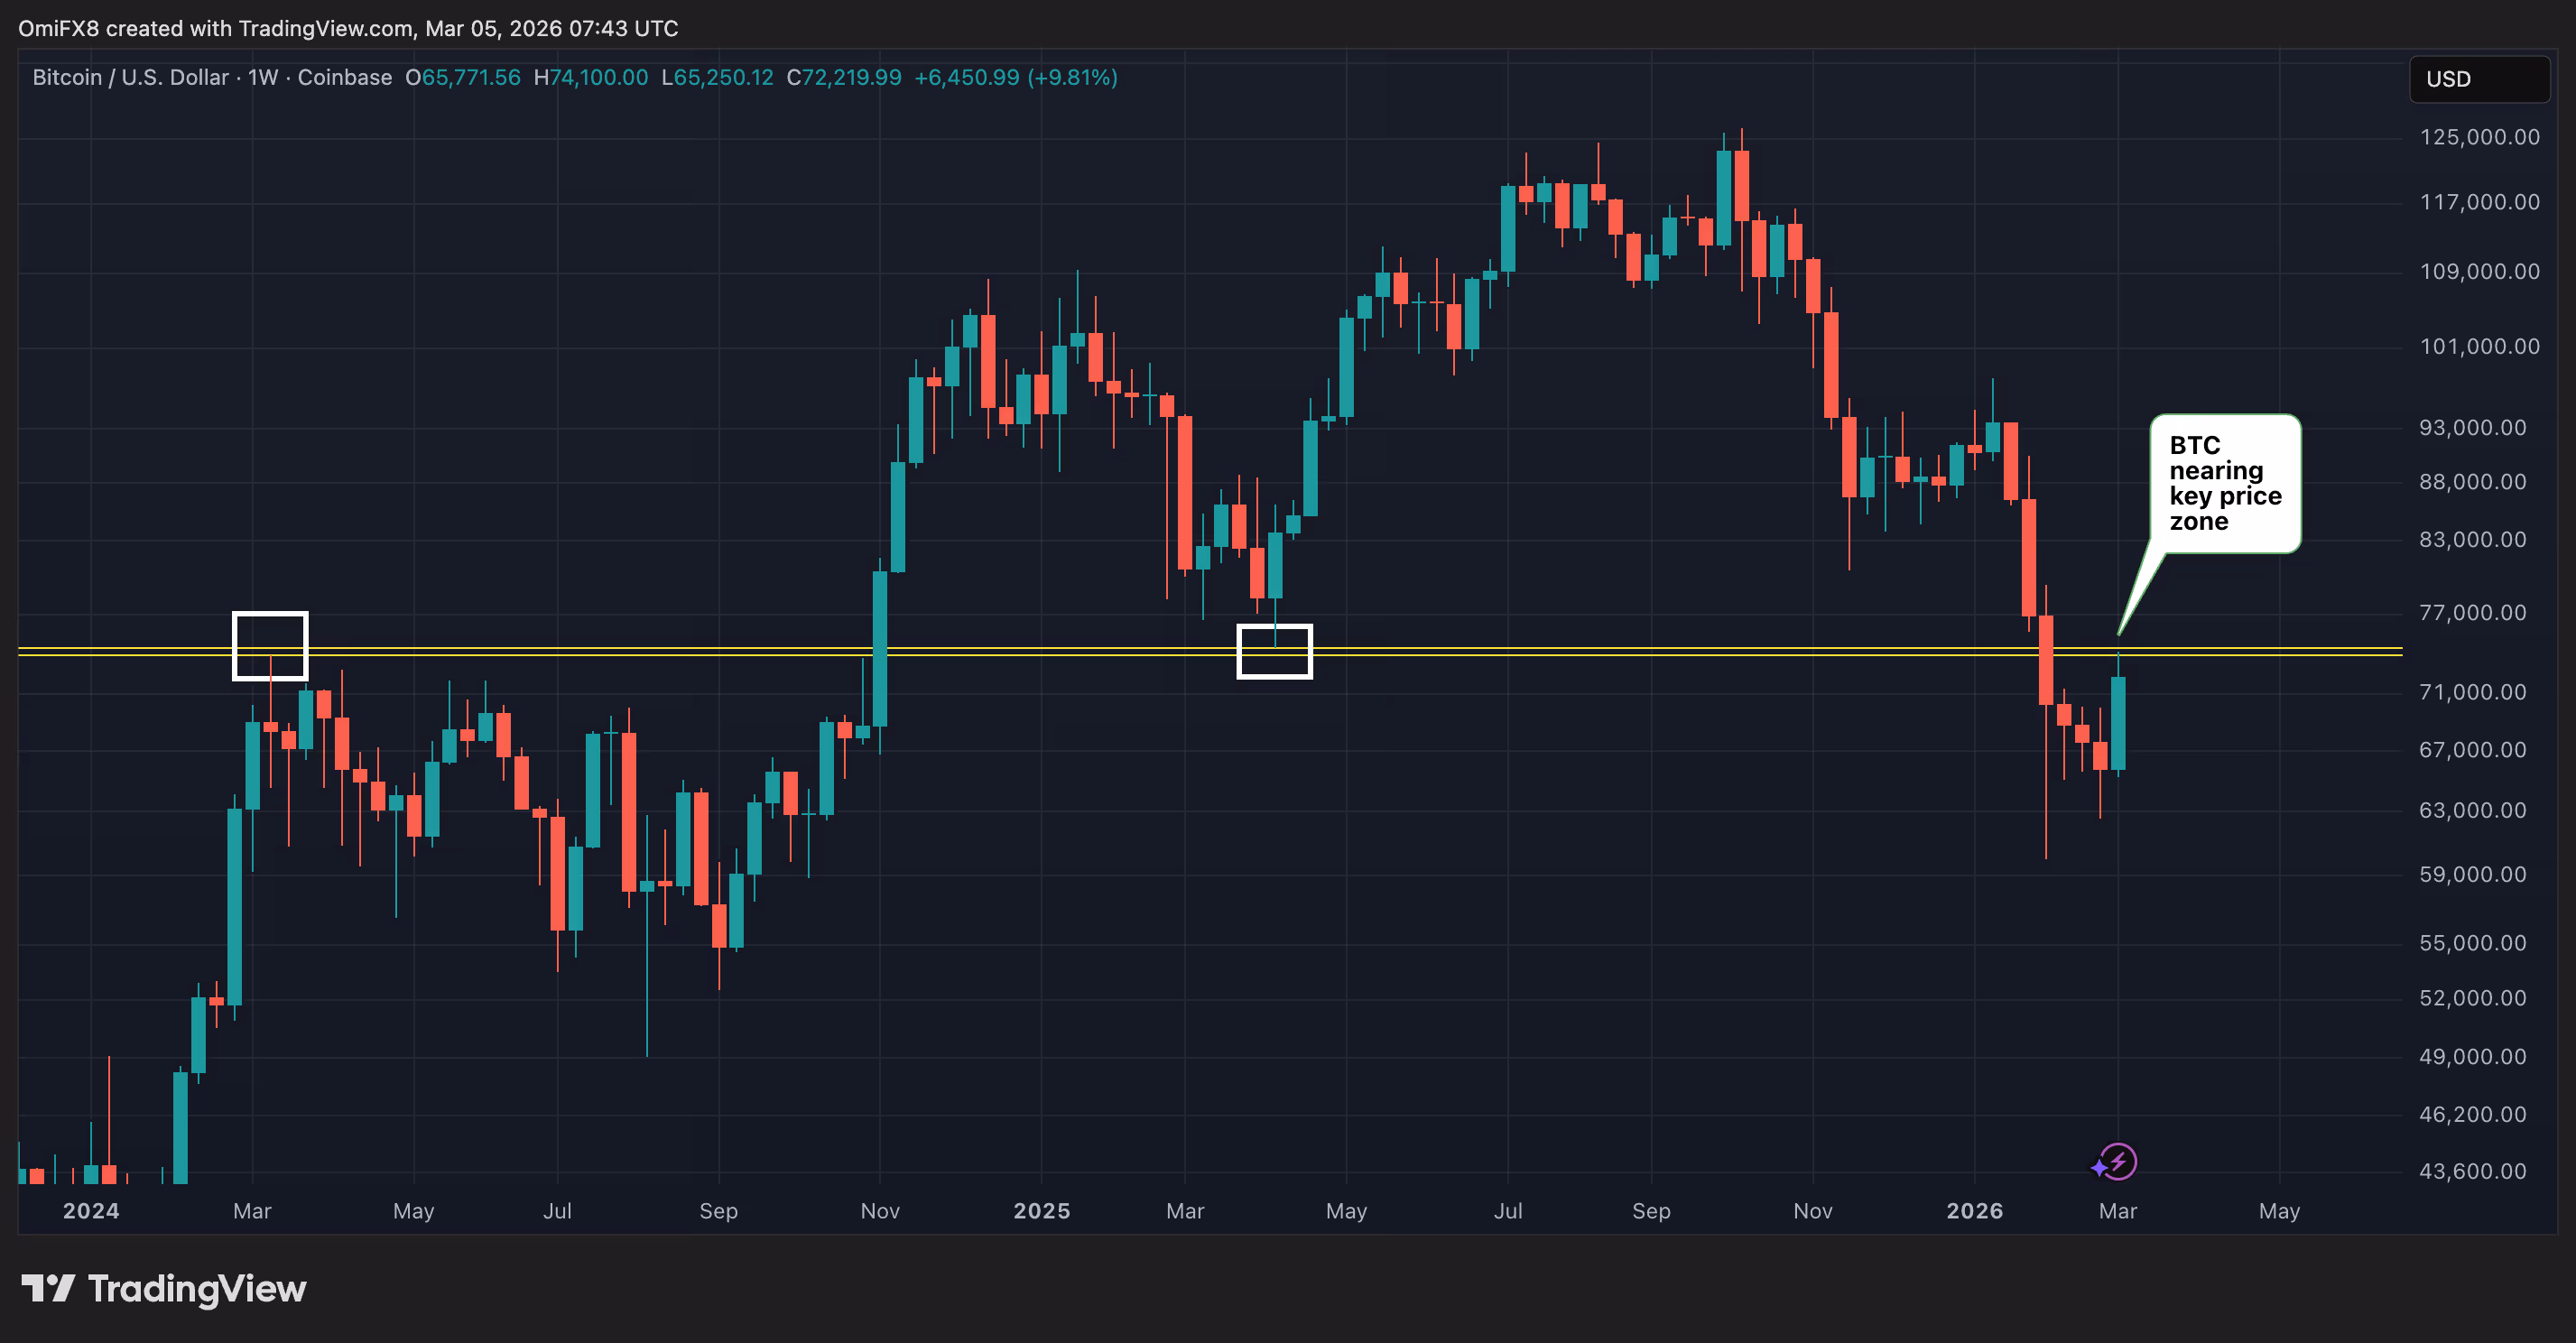
Bitcoin is surging again and is nearing a key make-or-break level, demanding attention from traders.
The cryptocurrency’s spot price has jumped a full 10% to trade above $72,000 this week, briefly popping above $73,900 on Wednesday, according to CoinDesk data. This impressive bounce, backed by ETF inflows, has fueled hopes of a renewed bull run, but the rally is now confronting a monumental challenge.
Prices are approaching a zone that has historically acted as a pivotal turning point, shaping the market’s direction over the past two years. It is a level where both uptrends and downtrends have previously run their course, and which was cited earlier this year as strong support or a potential demand zone, before it was ultimately breached.

That zone is roughly $73,750 to $74,400. To understand why it’s significant, look back to the first quarter of 2024. The uptrend at that time, led by ETFs’ debut in the U.S., ran out of steam, with buyer fatigue setting in right around the $73,750 mark. Prices then slipped, eventually hitting around $50,000 in the following months.
Conversely, in early April last year, the same zone performed a different, but equally decisive, role. It marked the exhaustion of a downtrend that began in February above $100,000, with selling finally drying up near $74,400. Prices turned higher in subsequent days, eventually hitting new highs above $126,000 in October.
Hence, this price zone was widely cited as a strong support, an area where buyers may step in arrest the slide early this year as bitcoin began falling. But to the dismay of bulls, prices slipped through early last month, leading to a deeper slide to nearly $60,000.
Now, once again, the zone stands as the key battleground. If bitcoin can break decisively higher, it would signal a profound bullish development, suggesting the market has enough underlying momentum (buying pressure) for a rally higher. On the other hand, a failure to breach this zone will likely confirm that the broader downtrend that began in October is still firmly in control, leaving a difficult path ahead.
Traders, therefore, need to watch price action in the coming days closely.


Eric Trump, co-founder of World Liberty Financial (WLFI), has criticized major banks for opposing stablecoin yields, calling their actions ‘anti-American’ as they protect their low-rate monopoly.
His remarks came as his father, President Donald Trump, also escalated his attacks on the banking lobby over the stalled CLARITY Act.
Eric Trump Calls Out Banks for “Protecting Low-Rate Monopoly”
Eric Trump laid out his criticism in a recent post on X (formerly Twitter). He pointed out that major banks offer depositors interest rates as low as 0.01–0.05% APY on standard savings accounts.
This occurs even though the Federal Reserve pays those same banks over 4%. That spread, he stressed, generates record profits that are not returned to everyday depositors.
“Big Banks (think JPMorgan Chase, Bank of America, Wells Fargo, etc.) are lobbying overtime to block Americans from getting higher yields on their savings—while trying to block any rewards or perks from being given to customers,” he said.
Follow us on X to get the latest news as it happens
He then identified crypto and stablecoins, where platforms plan to offer yields of 4–5% or more, as the specific targets banks are now mobilizing against. Eric Trump added that the American Bankers Association (ABA) and other lobbyists are “spending millions” to block or limit these yields through legislative efforts such as the Clarity Act.
He said that the banks are framing their opposition with terms like “fairness” and “stability.” However, Eric Trump argued that their true goal is to safeguard their “low-rate monopoly” and prevent customers from moving their deposits elsewhere.
“This is anti-retail, anti-consumer, and straight-up anti-American. Next time you see a big bank dropping billions on a shiny new Midtown Manhattan HQ, you know exactly where that money comes from: the non-existent interest rate they “pay” you! Fortunately, the big banks are losing this fight as customers wake up to the games,” he concluded.
Earlier, President Trump accused banks of “undermining and threatening” the GENIUS Act. He also pushed for the passage of the CLARITY Act.
“The Banks should not be trying to undercut The Genius Act, or hold The Clarity Act hostage. They need to make a good deal with the Crypto Industry because that’s what’s in best interest of the American People,” Trump posted.
How Stablecoin Yield Became a Legislative Blockade
The CLARITY Act passed the House with bipartisan support in July 2025. The goal of the bill is to define regulatory oversight between the Securities and Exchange Commission (SEC) and the Commodity Futures Trading Commission (CFTC). After moving to the Senate Banking Committee, it stalled.
The US Senate’s version of the crypto market structure bill restricts companies from paying interest solely for holding balances and limits the scope of reward offerings. This has created division among banking representatives and crypto lobbyists.
The White House set March 1 as a deadline for compromise between banks and crypto firms over stablecoin yield rules. Yet that deadline passed without agreement, increasing uncertainty.
The Senate Banking Committee is reportedly considering mid-to-late March for potential markup sessions. Whether Congress can resolve the issue before election politics take over will determine the near-term path for crypto regulation.

Cardano price has rebounded alongside the broader crypto market, rising about 5% in the past 24 hours. The move has helped the token recover nearly 10% from its March 4 low, offering short-term relief after weeks of weakness. However, the rebound does not fully resolve the structural risks surrounding the asset.
A weakening technical structure, rising on-chain coin movement, and an imbalance in derivatives positioning all point to the same possibility: the current rebound may still face downside pressure. Understanding that risk begins with the chart structure itself.
Hidden Bearish Divergence Emerges as Coin Movement Surges
Cardano’s price structure on the 12-hour chart is currently forming a head-and-shoulders pattern, a formation commonly associated with potential trend reversals. The pattern began developing in early February, with the left shoulder, head, and right shoulder now clearly visible. The neckline support of this structure sits near $0.26.
On March 4, Cardano briefly attempted to break below this neckline. The broader crypto market rally, however, pushed the price higher, allowing ADA to rebound roughly 10% from its recent low. Yet the technical picture still carries risk.
Between March 2 and March 4, Cardano formed two lower highs, while the Relative Strength Index (RSI) printed a higher high during the same period.
Want more token insights like this? Sign up for Editor Harsh Notariya’s Daily Crypto Newsletter here.
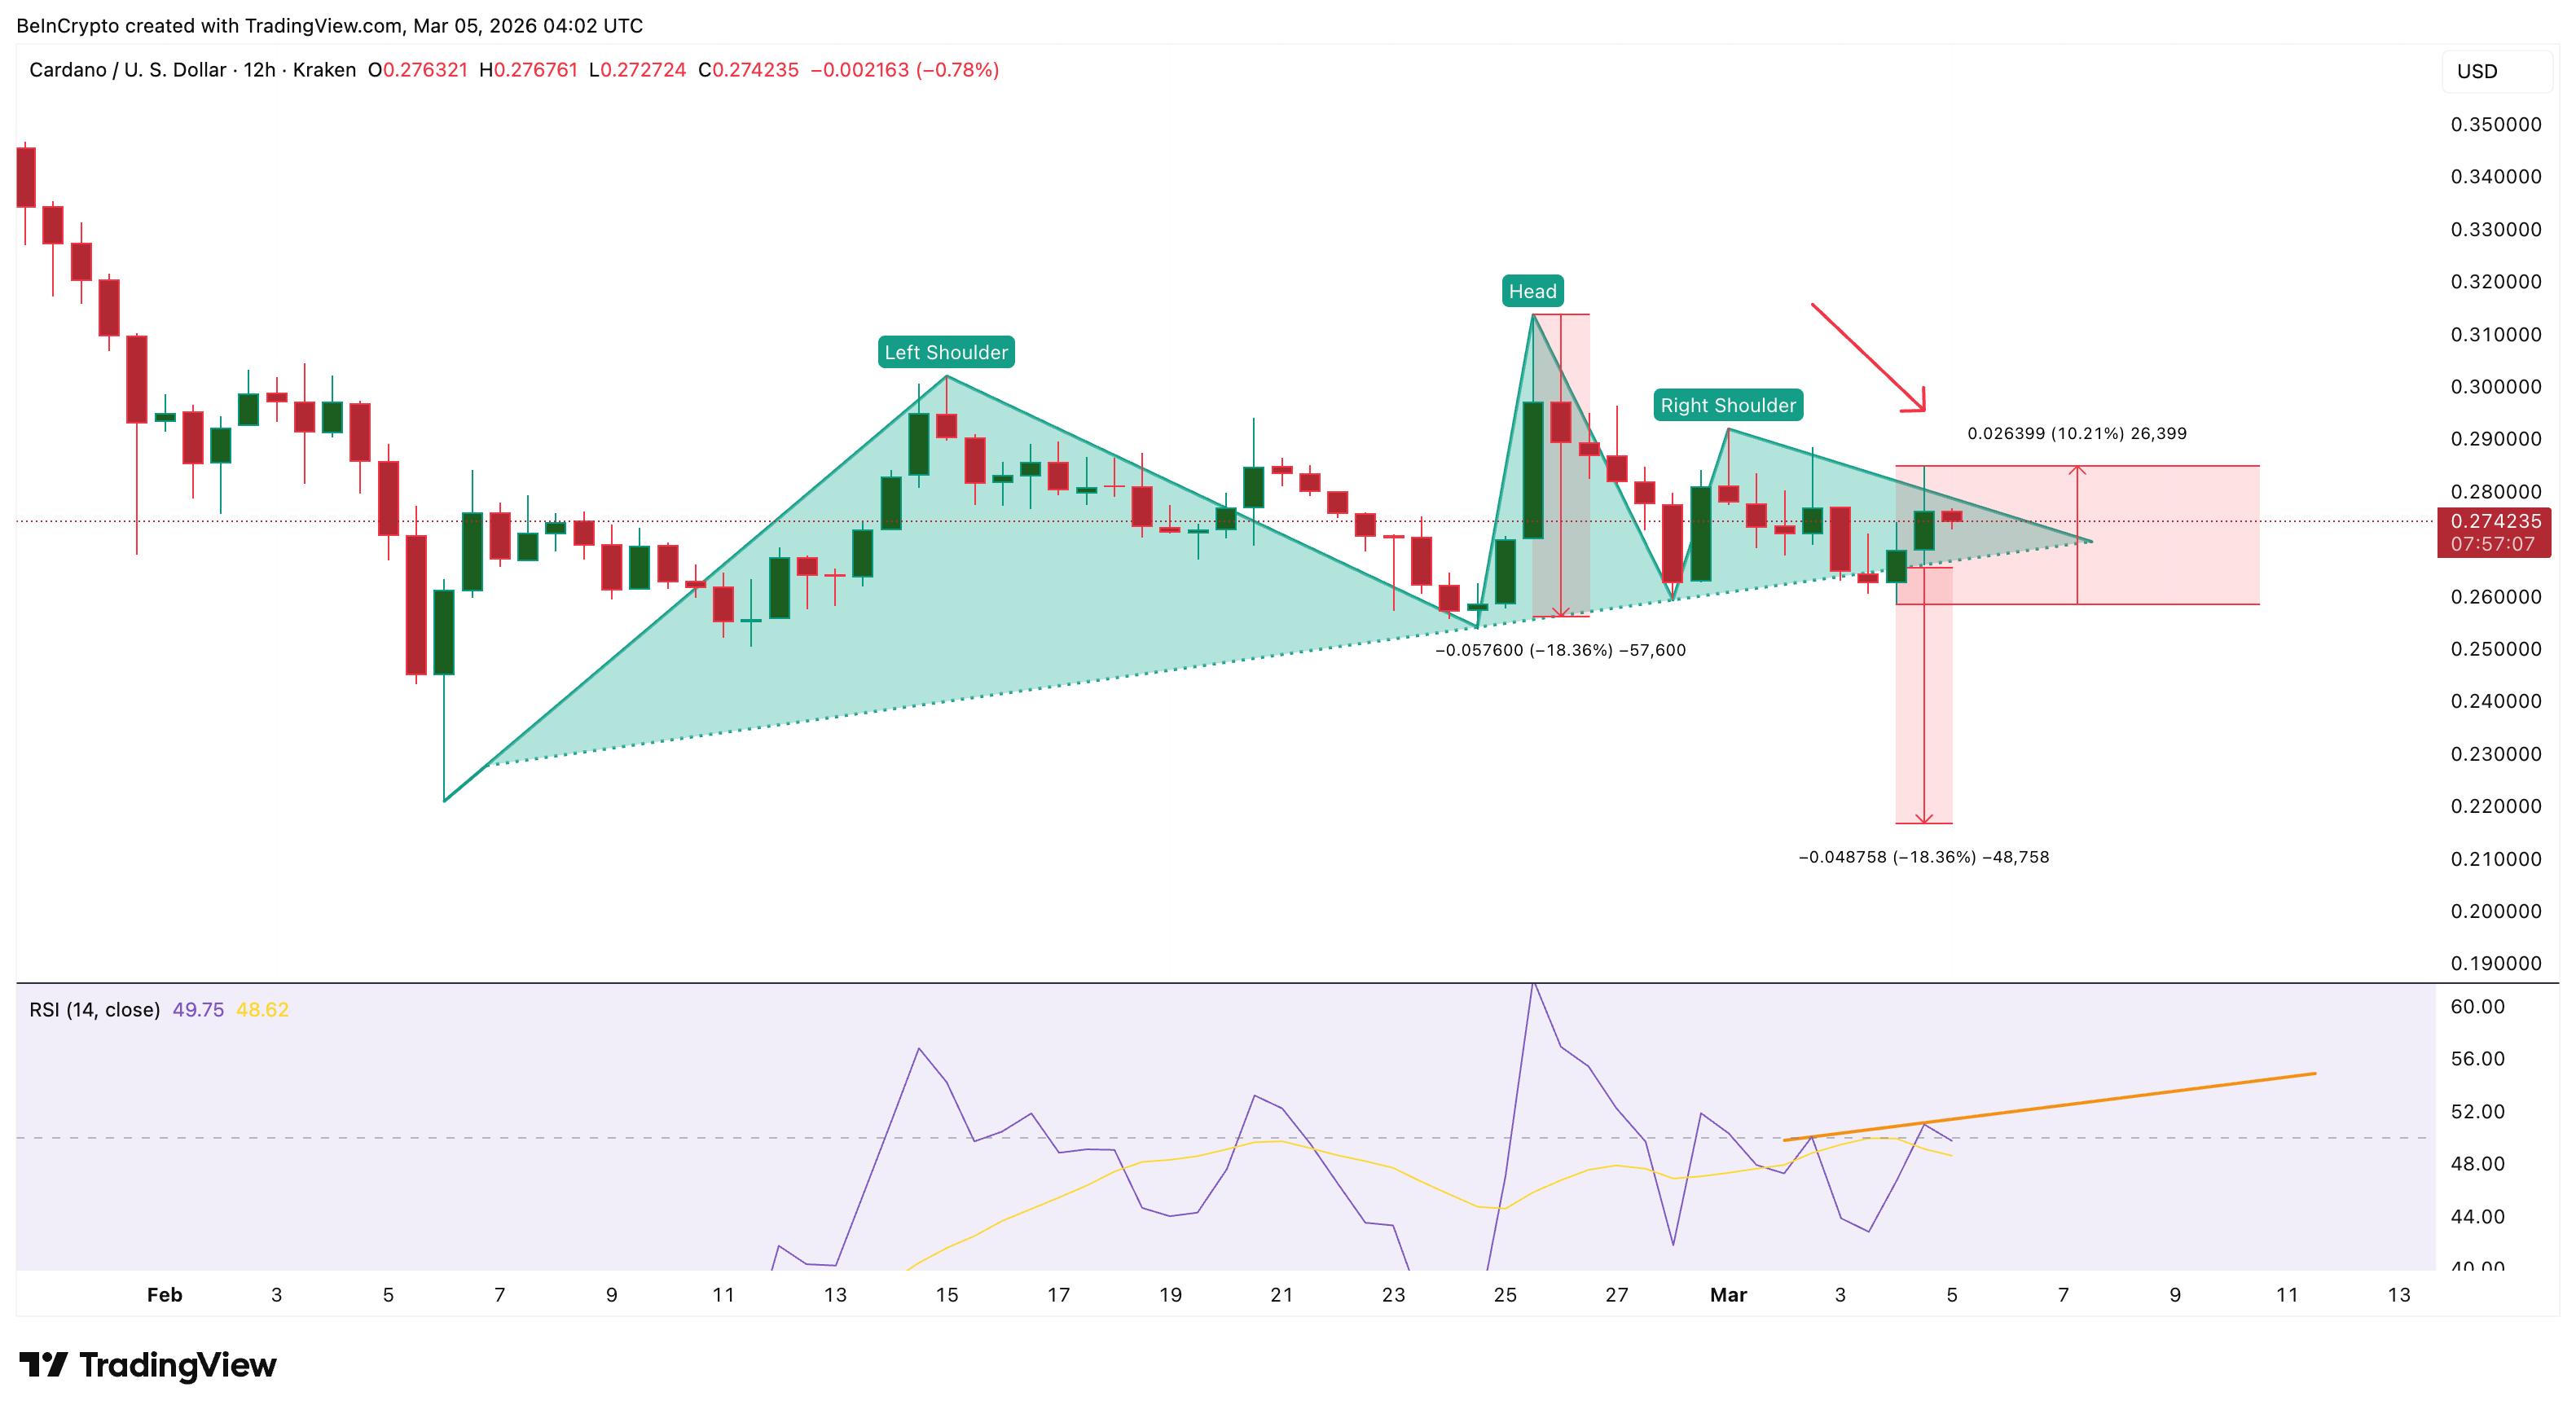
The RSI is a momentum indicator that measures the strength of price movements by comparing recent gains and losses. When price makes lower highs while RSI makes higher highs during a downtrend, it forms hidden bearish divergence. This pattern typically signals trend continuation, suggesting sellers remain active despite temporary rallies.
On-chain data reinforces this concern. The Spent Coins Age Band, a metric that tracks how many previously held coins move across the network, shows a sudden surge in distribution-linked activity.
On March 3, approximately 93 million ADA moved on-chain. By March 5, that figure had climbed over 143 million ADA, marking a 54% increase in coin movement.
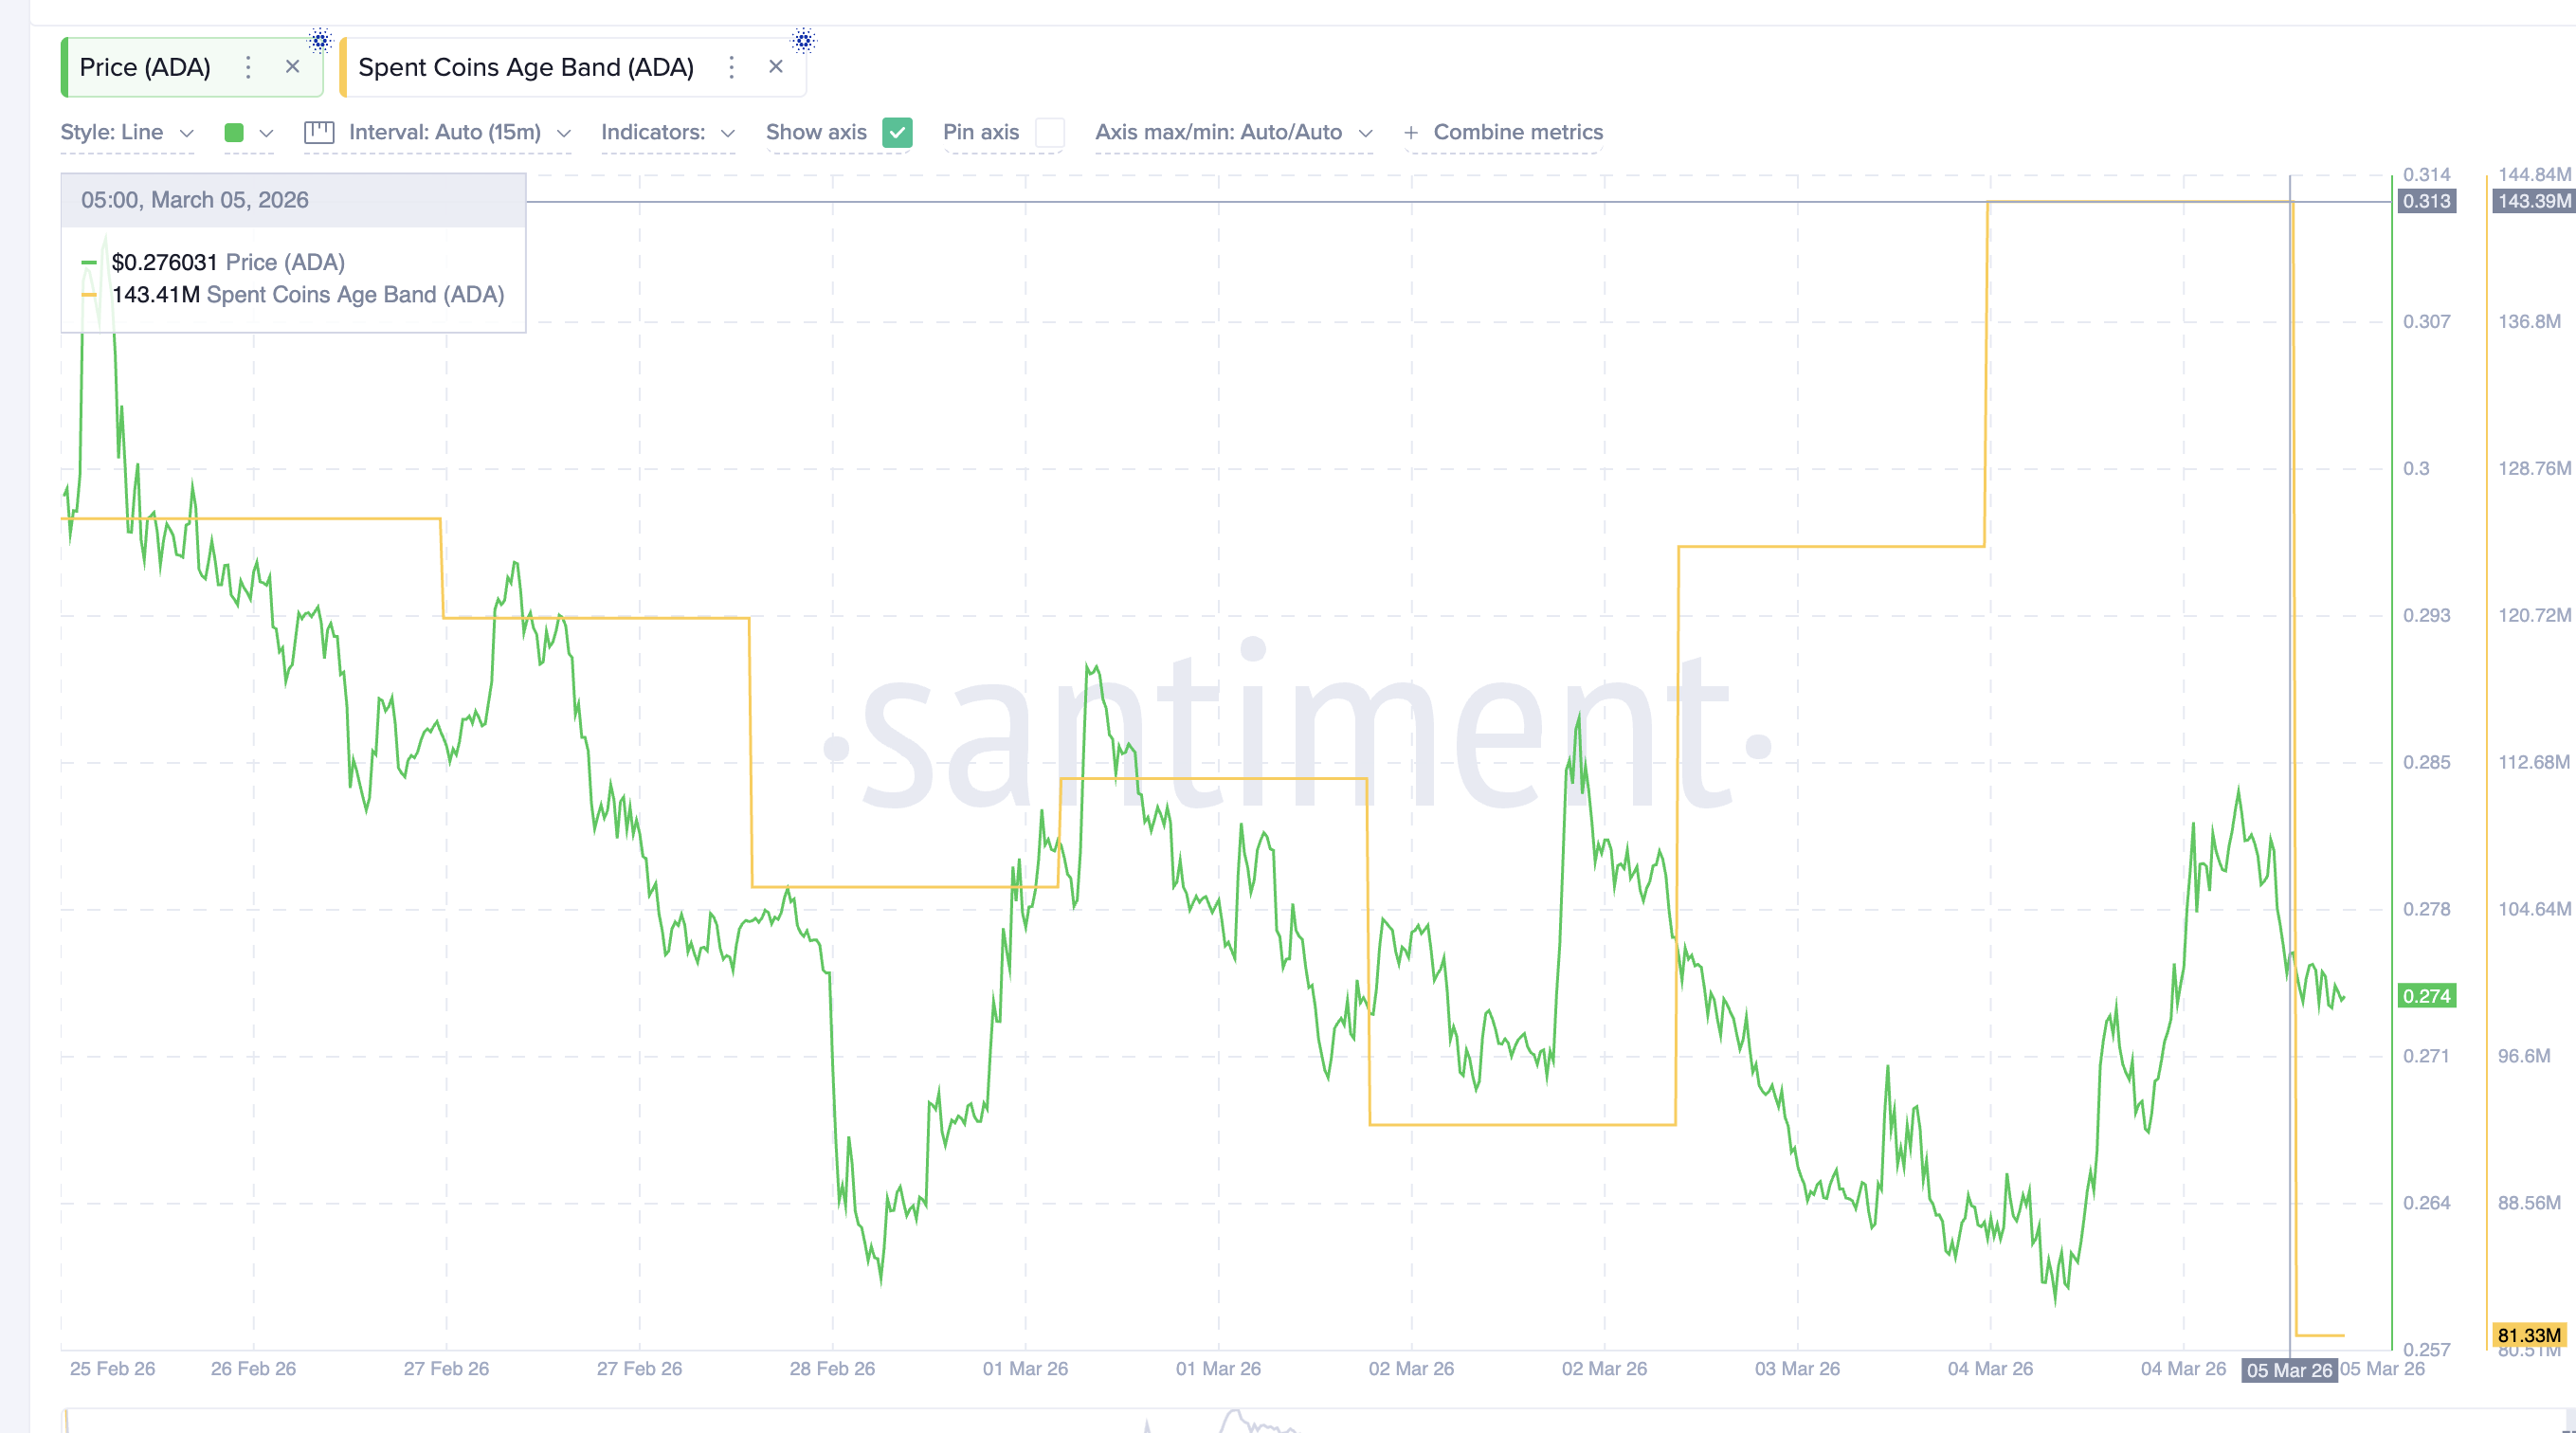
Although the metric has since dropped to almost 81 million ADA, the spike suggests that many holders moved coins during the recent rebound, potentially preparing to sell. This rising distribution pressure leads to the next key risk area: leveraged traders.
Rising Long Leverage Adds Liquidation Risk as Spot Demand Weakens
While on-chain activity hints at potential ADA selling, derivatives markets reveal a second vulnerability.
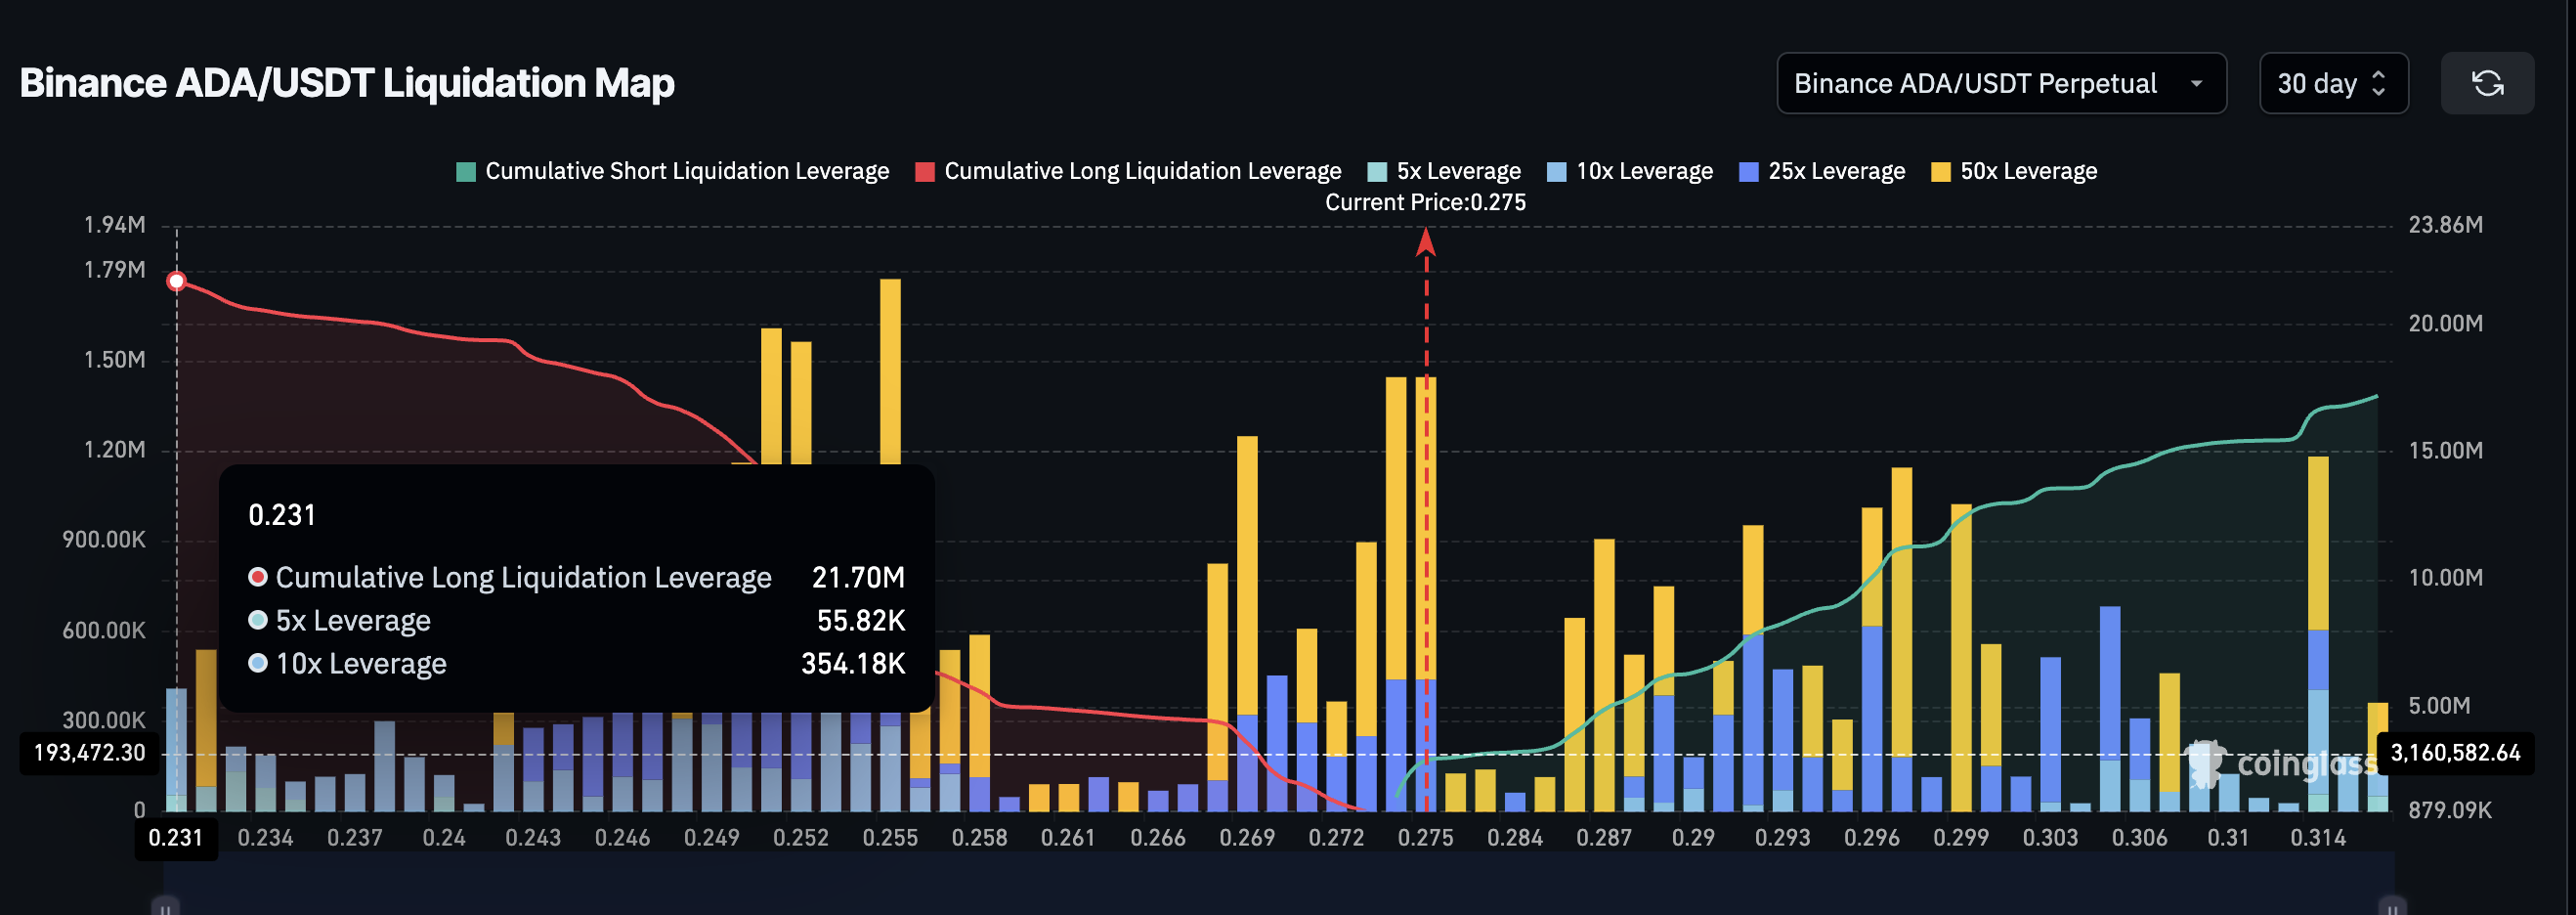
According to the Binance ADA/USDT liquidation map, leveraged traders currently hold significantly more long exposure than short exposure.
30-Day Data shows:
- Long liquidation leverage: about $22 million
- Short liquidation leverage: roughly $17 million
This means long positions outweigh short positions by around 26%. While the long bias is not heavy, it still invokes caution.
When the market holds a long exposure amid a bearish technical structure, downside volatility can increase. If prices begin to fall, these long positions may be forced to close, triggering liquidations that accelerate the decline. Normally, strong spot market demand helps absorb this type of pressure.
However, whale activity suggests that such support is currently limited.
Wallet data shows that most major holder cohorts have not significantly increased their balances in recent days.
Addresses holding:
- 100 million to 1 billion ADA
- More than 1 billion ADA
have largely kept their balances unchanged.
Only the 10 million to 100 million ADA cohort has shown modest accumulation, increasing holdings from 16.67 billion ADA to 16.69 billion ADA. Slightly above $5 million in worth.
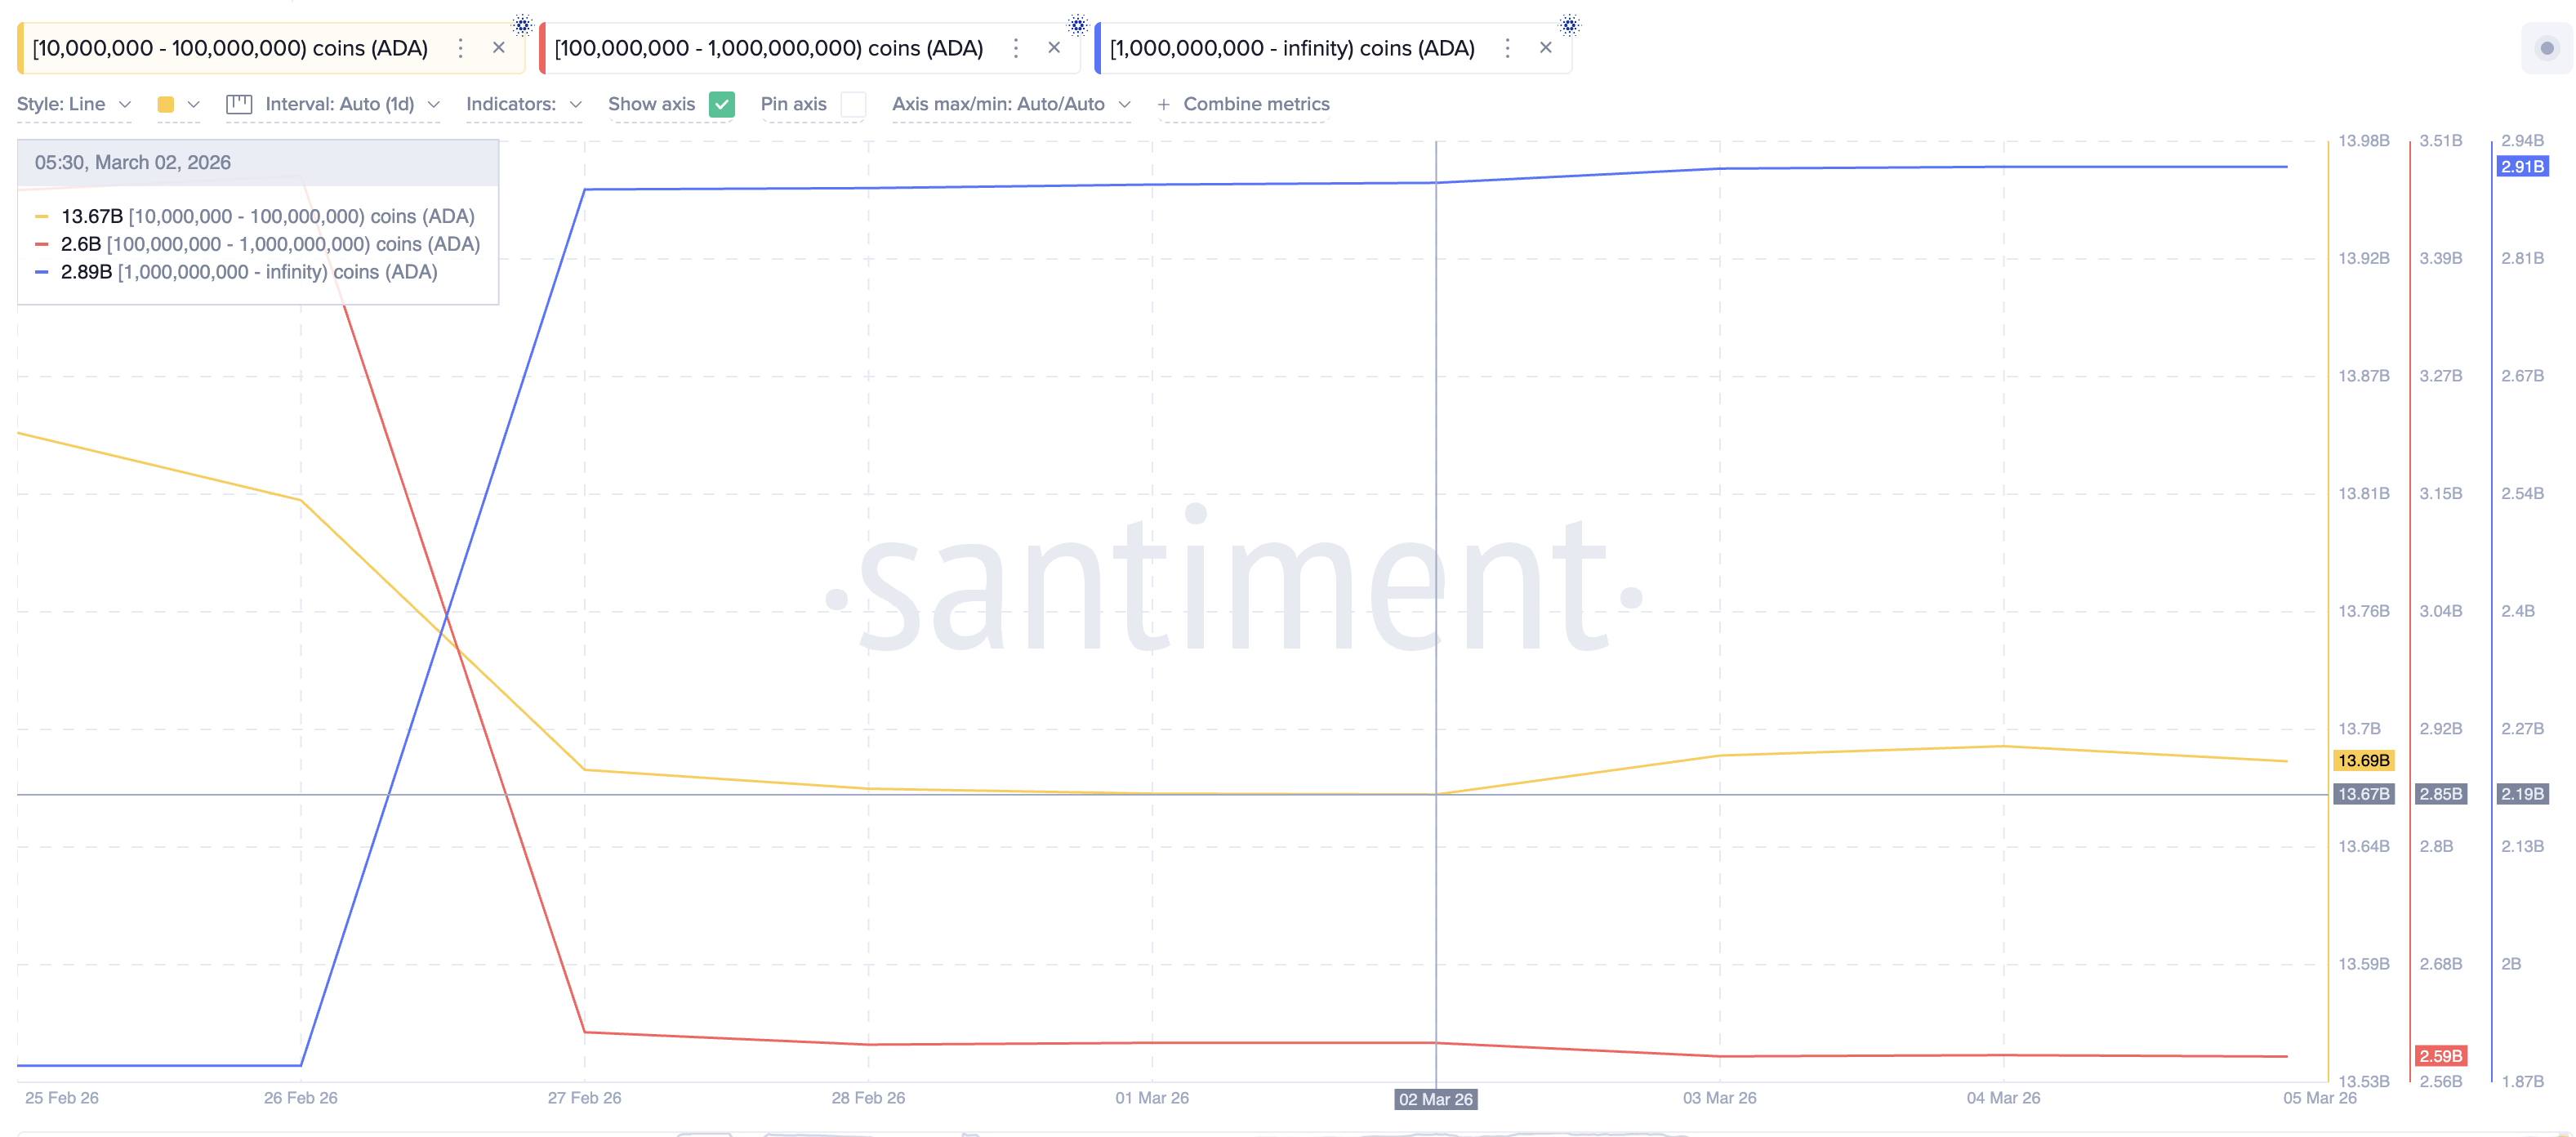
This increase is relatively small and does not signal strong new buying demand. With whales largely inactive and coin movement rising, the market may lack the spot demand needed to stabilize the price if selling pressure increases. This dynamic makes Cardano’s key price levels particularly important.
Cardano Price Faces Critical Test Between $0.28 and $0.25
Cardano is currently trading near $0.27, placing it close to the neckline support of the head-and-shoulders structure. Several levels now determine the next directional move.
The first resistance sits near $0.28. This level has repeatedly rejected price attempts since late February. A 12-hour candle close above $0.28 would signal that buyers are regaining control.
If momentum strengthens further, the next resistance lies near $0.29, where the right shoulder of the pattern formed. A stronger breakout above $0.31 would invalidate the bearish structure entirely. Crossing this level would push the price above the head of the pattern and could signal a broader trend reversal.
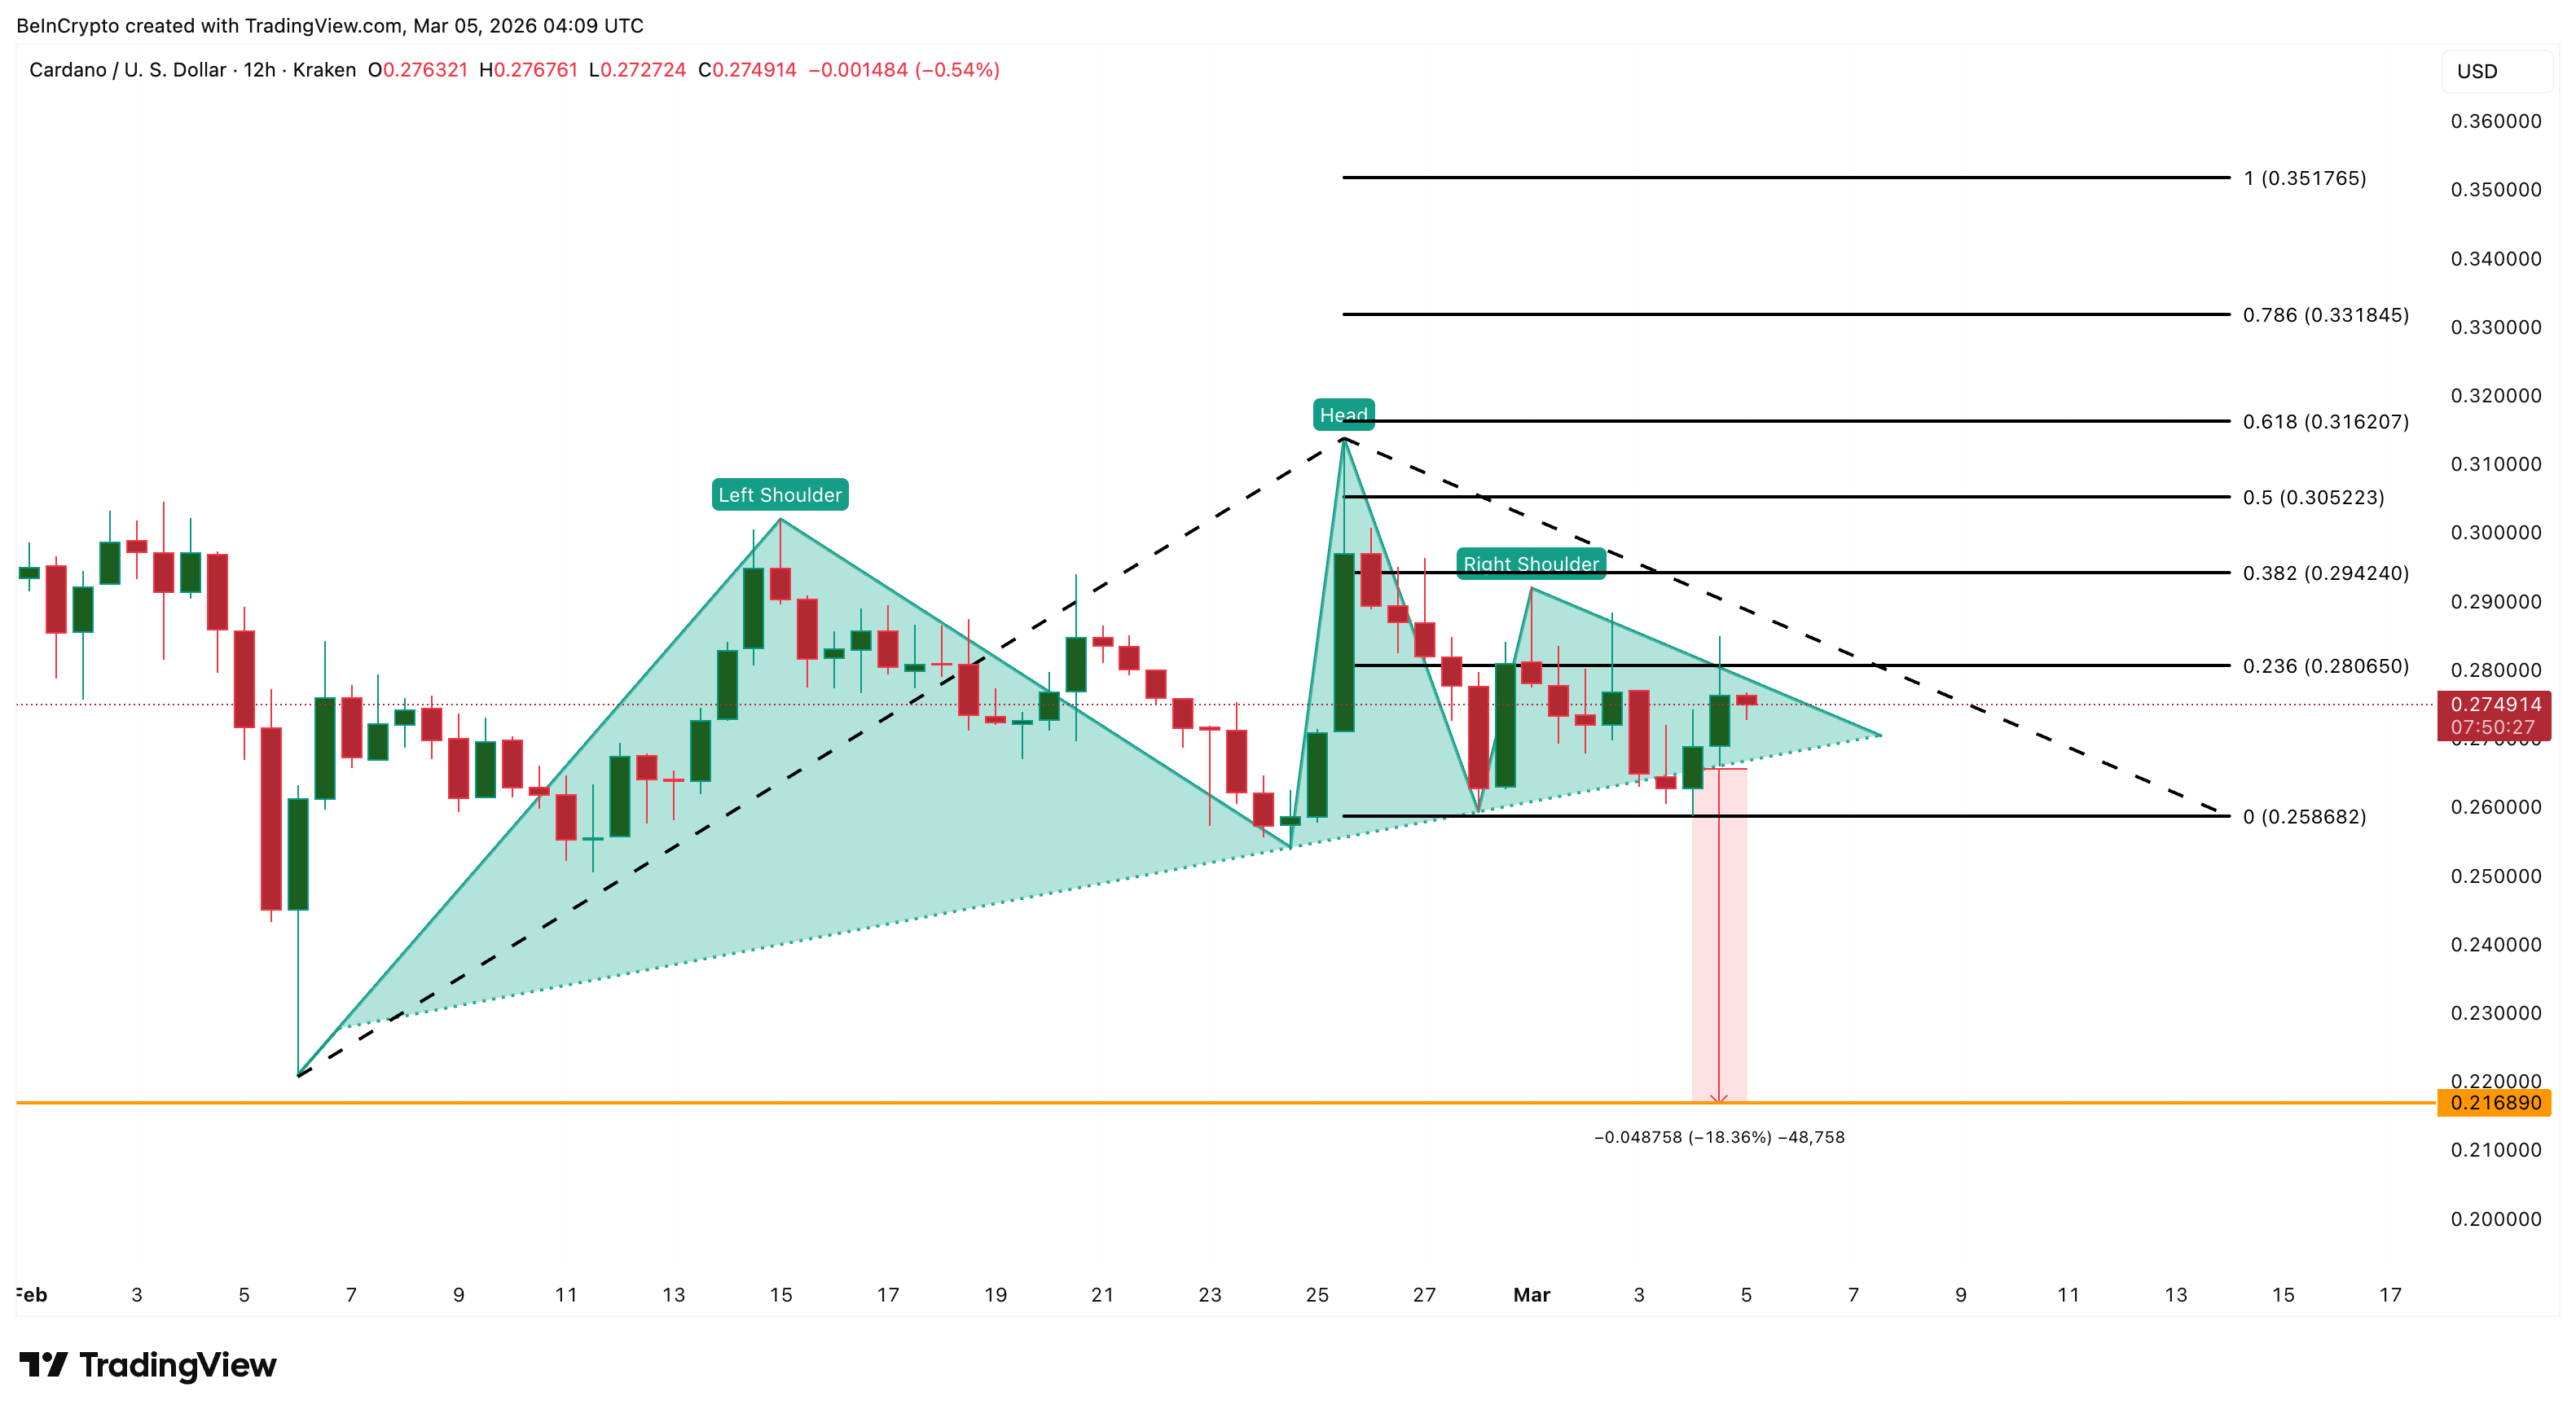
However, downside risk remains if support fails. A drop below $0.25 would confirm a breakdown of the head-and-shoulders pattern. In that scenario, Cardano could fall toward $0.21, representing a potential 18% decline from the neckline.
For now, Cardano’s 10% rebound has delayed the breakdown, but the combination of hidden bearish divergence, rising coin movement, and heavy long leverage suggests the market may still face a critical test in the days ahead. Only a 12-hour candle close above $0.28 can negate the threats for now.


The latest cryptocurrency rally could still have significant momentum, according to analyst Owen Lau, who said the market’s recent surge is supported by improving policy developments and stronger institutional participation.
Summary
- Analyst Owen Lau said the current crypto rally “has legs,” suggesting the market could sustain momentum.
- Pro-crypto policy developments in Washington are helping improve sentiment.
- Growing institutional participation and ETF flows are reinforcing the rally.
Bitcoin surge may extend as policy tailwinds grow: Owen Lau
Owen Lau, a financial technology and crypto analyst, said the current rally “has legs,” pointing to a combination of regulatory progress in the United States and growing integration between traditional finance and digital assets.
Bitcoin and the broader crypto market have staged a strong rebound in recent days, with the leading cryptocurrency climbing above the $73,000 level and driving gains across altcoins. The rally follows renewed inflows into spot Bitcoin exchange-traded funds and a wave of short liquidations that helped accelerate price momentum.
According to Lau, a key factor supporting the rally is the shifting policy landscape in Washington. Recent discussions around crypto market structure legislation and stablecoin regulation have raised expectations that the United States could soon provide clearer rules for the industry.
Improved regulatory clarity has long been viewed as a catalyst for institutional adoption, as major financial firms often require clearer compliance frameworks before expanding exposure to digital assets.
Owen Lau also highlighted the growing involvement of traditional financial institutions in the crypto ecosystem, ranging from asset managers offering spot Bitcoin ETFs to banks exploring digital asset services. These developments, he said, are gradually embedding cryptocurrencies into mainstream financial markets.
Institutional demand has already been visible through sustained ETF inflows, which have become one of the most significant drivers of Bitcoin price movements over the past year.
While volatility remains a defining feature of the crypto market, Lau suggested that the combination of regulatory progress, institutional demand and expanding market infrastructure could support continued upside.
If these trends persist, analysts say the current rally could represent more than just a short-term rebound, potentially marking the early stages of a broader market recovery.
Crypto World
Ethereum price prediction: $2,500 in focus as OI spike amid Vitalik’s calls for scaling


- Ethereum rally above $2,100 follows a sharp spike in open interest.
- A break above the resistance at $2,175 could open the path toward $2,500.
- Large ETH withdrawals from exchanges point to tightening supply.
Ethereum has climbed above the $2,100 after a strong daily rally that pushed the asset higher amid renewed interest in derivatives markets.
The move follows a period of consolidation that had kept the price trapped near the $2,000 level for several sessions.
The surge has now placed the $2,500 region firmly on the radar of short-term traders.
At the same time, comments from Vitalik Buterin about the future direction of the network have sparked fresh discussion across the ecosystem.
Open interest spike signals renewed trader activity
One of the strongest signals behind the recent price jump is the sharp rise in derivatives market activity.
Open interest (OI) in Ethereum futures has climbed significantly in recent weeks as traders increase their exposure to the asset.
The open interest reflects the total number of active futures contracts and often rises when new money enters the market.
The latest spike indicates that traders are positioning for larger price swings in the coming sessions.
Besides the increase in open interest, short liquidations also played a key role in the rally that pushed Ethereum above $2,100.
When bearish traders are forced to close positions, they must buy back the asset, which can quickly accelerate upward momentum.
This chain reaction tends to create sudden bursts of volatility that drive prices higher within a short time frame.
However, derivatives data still shows mixed sentiment among traders, with funding rates shifting between positive and negative levels, suggesting that the market remains divided on the next direction.
Ethereum supply tightens as investors withdraw coins
Another factor supporting the recent recovery is a notable decline in the amount of Ethereum held on centralised exchanges.
According to data obtained from CryptoQuant, Large amounts of ETH have been moved away from trading platforms over the past month.

These withdrawals from crypto exchanges often indicate that investors intend to hold their assets for a longer period rather than sell them immediately.
When coins leave exchanges, the amount available for instant trading becomes smaller.
This shift can create tighter supply conditions, especially if demand begins to increase at the same time.
On-chain data also shows that large investors have continued to accumulate Ethereum during recent market weakness.
This trend suggests that some market participants view current prices as attractive entry levels.
Such accumulation can help stabilise the market during periods of volatility.
Ethereum technical analysis place $2,500 in focus
From a technical perspective, Ethereum’s price is currently trading between key support and resistance zones.
The $2,023 region has emerged as an important short-term support level based on recent price movements.
A break below that zone could expose the market to further downside toward the $1,901 support area.
On the upside, the $2,175 level has repeatedly acted as immediate resistance.
A sustained move above this barrier could open the door for a rally toward the next resistance near $2,396.
If buying pressure remains strong, the market may then shift its focus toward the $2,525 region.
This level sits close to the psychological $2,500 mark that many traders are watching.
A decisive breakout above this area would signal a stronger bullish trend forming in the short term.
Vitalik Buterin says, “Ethereum needs to scale”
Beyond the price charts, discussion around Ethereum’s long-term direction has intensified following recent comments from Vitalik Buterin.
The Ethereum co-founder has emphasised the importance of developing what he described as “sanctuary” technology within the ecosystem.
This concept centres on strengthening decentralisation and ensuring that Ethereum remains a secure and neutral platform.
Buterin also highlighted concerns that some scaling solutions are drifting away from Ethereum’s core security model.
His remarks have sparked debate about how the network should evolve as demand continues to grow.
Some observers believe these discussions could influence how developers approach future upgrades and scaling strategies.
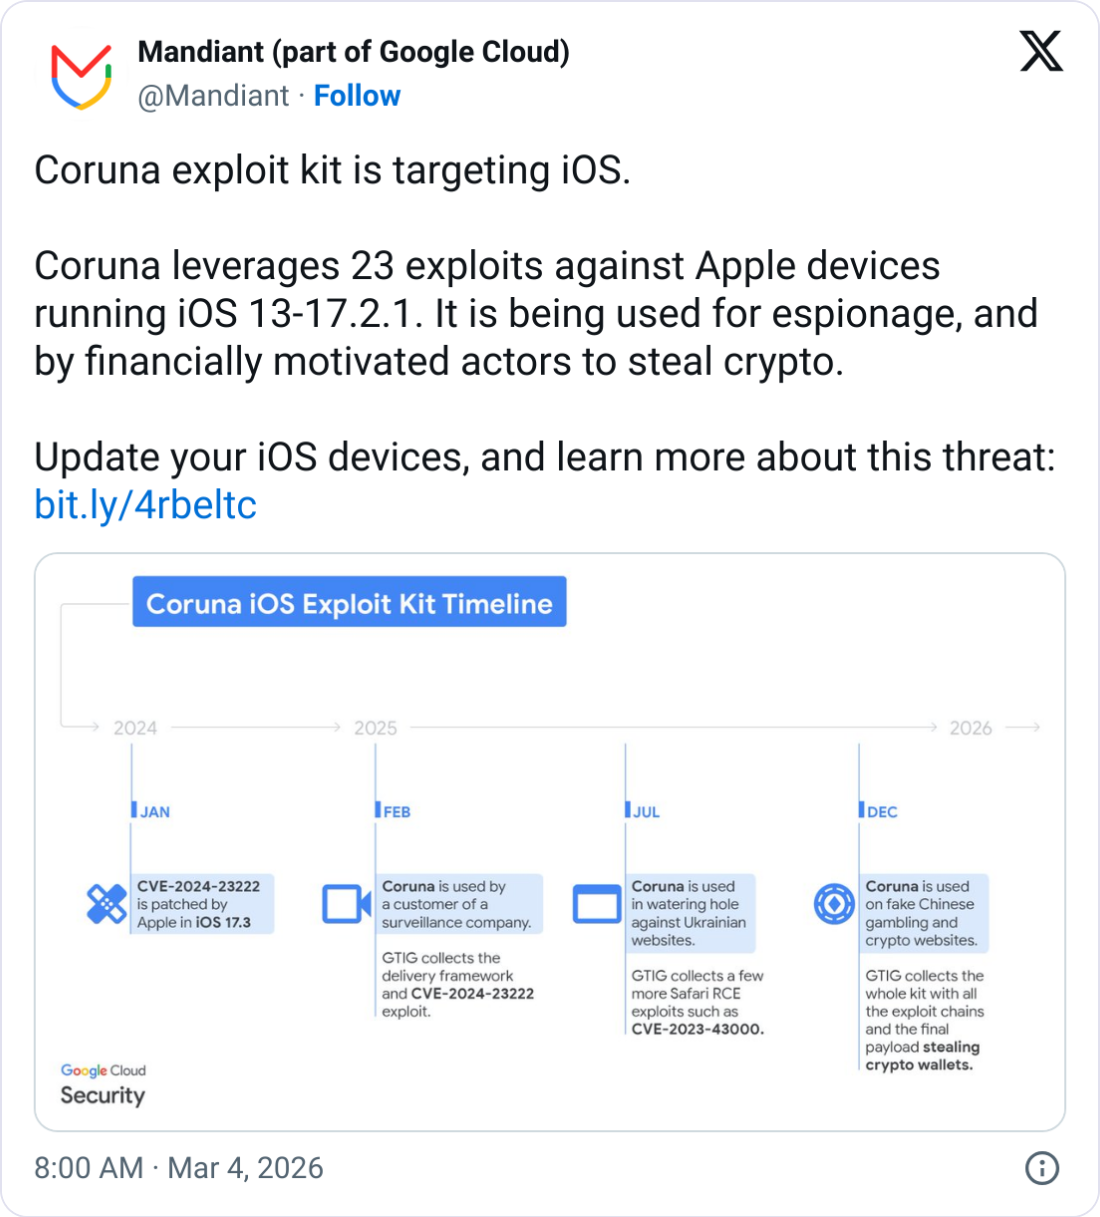
Threat researchers at Google say they have uncovered a new exploit kit targeting Apple iPhone users, aimed at stealing crypto wallet seed phrases.
The kit, named “Coruna” by its developers, targets iPhones running iOS versions 13.0 up to 17.2.1. It has “five full iOS exploit chains and a total of 23 exploits,” including ones that were previously unknown to the public, the Google Threat Intelligence Group (GTIG) said in a report on Wednesday.
The group said it first discovered the kit in February 2025 and has since tracked its use by a suspected Russian espionage group against Ukrainians, and later on fake Chinese crypto websites that aim to steal crypto.
GTIG said the kit doesn’t work with the latest version of iOS and urged iPhone users to update their devices to the latest software version. If that isn’t possible, users should put the phone in “Lockdown Mode,” which Apple says can counter sophisticated attacks.
Kit targets crypto via fake websites
GTIG said it came across parts of an iOS exploit in February 2025 in which a customer of a surveillance company used JavaScript to fingerprint the device to deliver the appropriate exploit.
Later that year, it found the same JavaScript framework hidden on multiple compromised Ukrainian websites that was “only delivered to selected iPhone users from a specific geolocation.”

GTIG said it then found the same framework in December “on a very large set of fake Chinese websites mostly related to finance,” including one that spoofed the crypto exchange WEEX.
When a user accesses the websites with an iOS device, the framework delivers the exploit kit and hunts for financial information, including analyzing texts containing seed phrases and keywords such as “backup phrase” or “bank account.”
Related: ‘ClickFix’ hackers pose as VCs, hijack QuickLens in latest crypto attacks
The kit also seeks out popular crypto apps, including Uniswap and MetaMask, to extract crypto or sensitive information.
Coruna’s US intelligence origins debated
GTIG did not name the customer of the surveillance company from which the exploit kit is said to have originated, but the mobile security company iVerify told WIRED it could have been built or bought by the US government.
“It’s highly sophisticated, took millions of dollars to develop, and it bears the hallmarks of other modules that have been publicly attributed to the US government,” iVerify co-founder Rocky Cole told WIRED.
“This is the first example we’ve seen of very likely US government tools — based on what the code is telling us — spinning out of control and being used by both our adversaries and cybercriminal groups.”
However, Kaspersky’s principal security researcher told The Register that the cybersecurity company saw “no evidence of actual code reuse in the published reports to support attributing Coruna to the same authors.”
Magazine: Meet the onchain crypto detectives fighting crime better than the cops

Designed By Pininfarina, Infinix NOTE 60 Ultra Debuts at MWC 2026

Wannabe E-Girl Made $0.52 Last Month | Financial Audit
Good Morning Britain fans delighted as Welsh presenter returns to host ITV show


-

 Politics6 days ago
ITV enters Gaza with IDF amid ongoing genocide
-

 Politics2 days ago
Alan Cumming Brands Baftas Ceremony A ‘Triggering S**tshow’
-

 Fashion6 days ago
Weekend Open Thread: Iris Top
-

 Tech4 days ago
Unihertz’s Titan 2 Elite Arrives Just as Physical Keyboards Refuse to Fade Away
-
Sports5 days ago
The Vikings Need a Duck
-
 NewsBeat5 days ago
Dubai flights cancelled as Brit told airspace closed ’10 minutes after boarding’
-

 NewsBeat4 days ago
‘Significant’ damage to boarded-up Horden house after fire
-
 NewsBeat5 days ago
The empty pub on busy Cambridge road that has been boarded up for years
-

 NewsBeat4 days ago
Abusive parents will now be treated like sex offenders and placed on a ‘child cruelty register’ | News UK
-

 Tech2 hours ago
Bitwarden adds support for passkey login on Windows 11
-

 Entertainment3 days ago
Baby Gear Guide: Strollers, Car Seats
-
 Tech6 days ago
NASA Reveals Identity of Astronaut Who Suffered Medical Incident Aboard ISS
-

 Business6 days ago
Only 4% of women globally reside in countries that offer almost complete legal equality
-
Politics4 days ago
FIFA hypocrisy after Israel murder over 400 Palestinian footballers
-
 NewsBeat4 days ago
Emirates confirms when flights will resume amid Dubai airport chaos
-

 NewsBeat3 days ago
Is it acceptable to comment on the appearance of strangers in public? Readers discuss
-

 Crypto World6 days ago
From Crypto Treasury to RWA: ETHZilla Retreats and Relaunches as Forum Markets on Nasdaq
-

 Tech4 days ago
Viral ad shows aged Musk, Altman, and Bezos using jobless humans to power AI
-

 Business7 days ago
World Economic Forum boss Borge Brende quits after review of Jeffrey Epstein links
-

 Video7 days ago
Xii English top Selected mcq “Money Madness” Board Exam 2026, #chseodisha #hksir #mychseclass