

Crypto World
Bitcoin Price Returns to $70K Despite Growing Tension in the Middle East: Your Weekly Crypto Recap
This week saw a big investment in OKX, Kraken received a Fed Master Account, while Justin Sun reached a $10 million settlement with the SEC.
This time last Friday, the tension was building in the Middle Eastern region, but only a handful of people could have predicted how the world would change just hours later. On Saturday morning, Israel and the USA joined forces to launch a military operation against Iran, which began with air strikes.
Iran retaliated and continues to do so as the week progressed, even though its Supreme Leader was killed during the first day of the attacks. Since then, the developments on the matter have quickly escalated, with almost a dozen countries already being directly involved, while essentially every nation has felt the consequences in one form or another, especially after the Strait of Hormuz was closed and energy prices skyrocketed.
Amid all of this massive geopolitical tension, which began on an off-day for every other financial market aside from crypto, bitcoin’s price has remained stable overall. Well, that’s after the initial Saturday shock when it tumbled by $4,000 to $63,000. It quickly rebounded, recovered all losses, and even headed to new local peaks during the business week.
Although there’s no evidence that this war could end soon, BTC surged by $11,000 from its Saturday low to $74,000 on Wednesday. However, it faced an immediate rejection there and now trades around $70,000. This is still roughly 5.5% higher than its price level last week, which is rather surprising given the surging uncertainty.
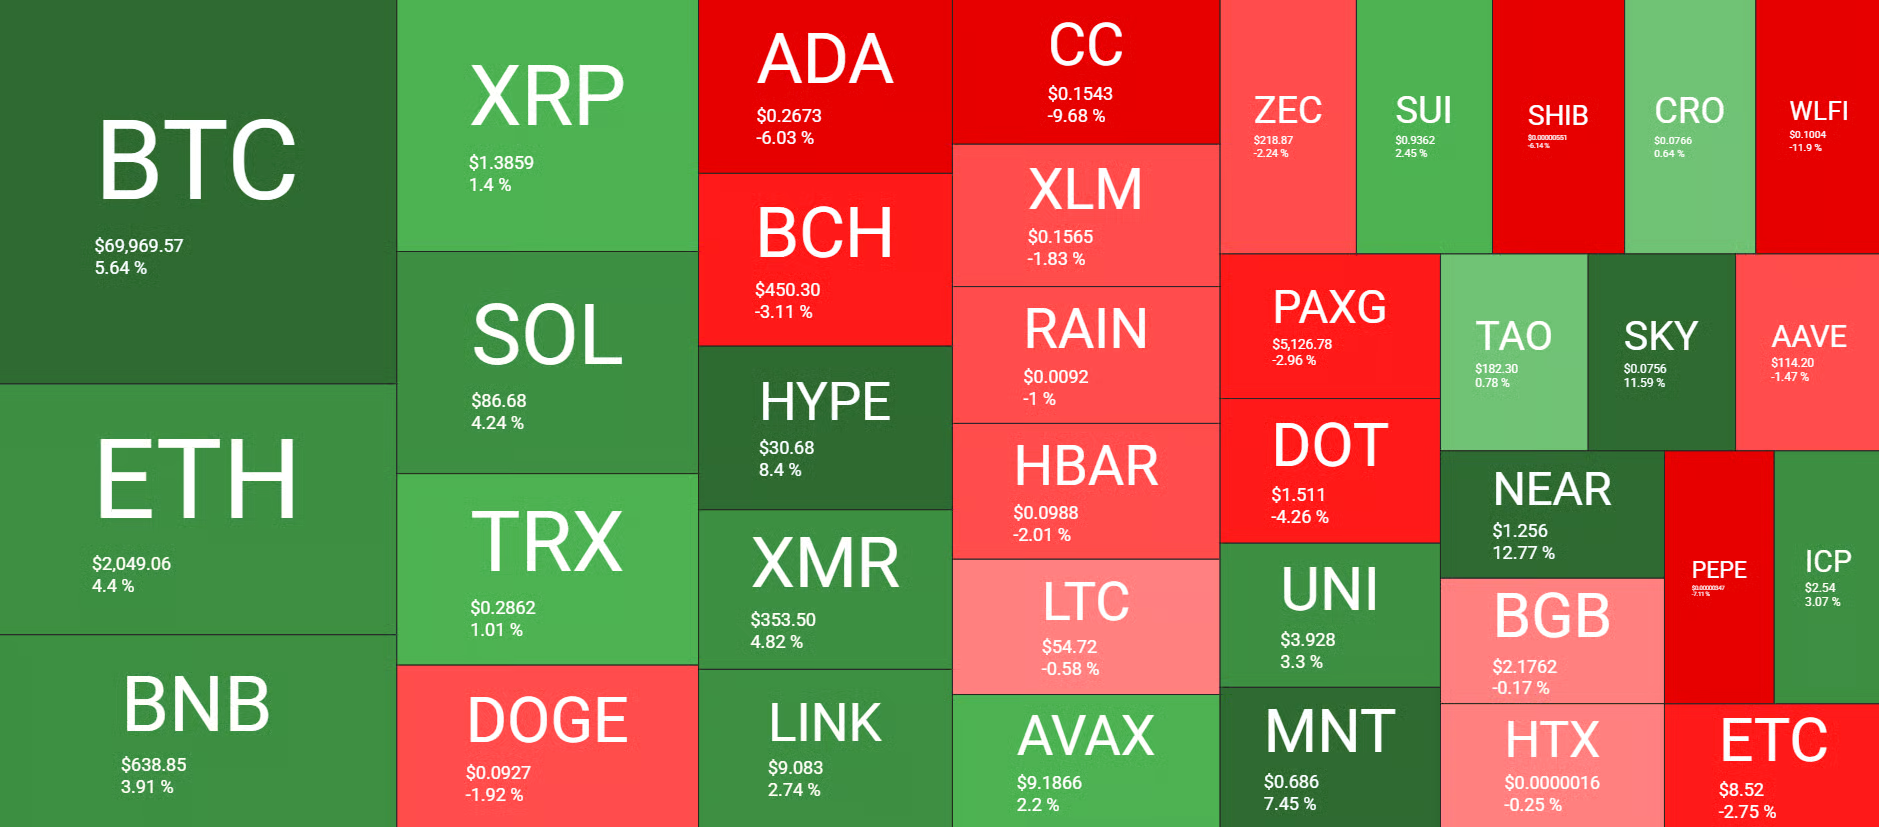
Only a few larger-cap alts have performed better during this timeframe, including HYPE, NEAR, SKY, and MNT. In contrast, ADA, CC, BCH, SHIB, WLFI, and DOT are deep in the red.
Market Data
Market Cap: $2.46T | 24H Vol: $108B | BTC Dominance: 56.9%
BTC: $70,000 (+5.6%) | ETH: $2,050(+4.4%) | XRP: $1.38 (+1.4%)
You may also like:
This Week’s Crypto Headlines You Can’t Miss
Kraken Just Became the First Crypto Company With a Fed Master Account — Why It Matters. The veteran US exchange has secured access to a limited-purpose master account from the US Federal Reserve Bank of Kansas. Kraken Financial can now directly connect to the Fed’s core payment systems and bypass some of the intermediaries that exist when users are trying to deposit/withdraw.
Kazakhstan May Sell Gold to Fund $350M Crypto Purchase: Report. The governor of the country’s central bank said they plan to invest up to $350 million in cryptocurrencies or high-tech firms related to the industry. They want to use some of their current investments, such as gold and foreign exchange reserves, to do so.
NYSE Parent Company Invests in OKX at $25 Billion Valuation. Intercontinental Exchange, the behemoth behind the New York Stock Exchange, acquired a minority stake in the popular cryptocurrency trading platform, OKX. This puts the latter’s valuation at an impressive $25 billion after the latest investment round.
Ray Dalio Dismisses Bitcoin’s Safe-Haven Narrative, Rejects Comparisons to Gold. Despite BTC’s better performance since the tension in the Middle East skyrocketed, billionaire Ray Dalio dismissed its potential to serve as a safe-haven narrative and praised gold once again.
$1 Billion Floods Back Into Crypto Funds, Snapping Five-Week $4B Bleed. The previous business week snapped a five-week red streak in which investors pulled out around $4 billion from crypto-related funds. Instead, they poured around $1 billion in the span of five business days.
Justin Sun ‘Very Pleased’ With $10 Million SEC Settlement. Nearly three years after he and some of his companies were sued by the US SEC, Justin Sun announced that the claims were dismissed after he reached a $20 million settlement with the regulator.
Binance Free $600 (CryptoPotato Exclusive): Use this link to register a new account and receive $600 exclusive welcome offer on Binance (full details).
LIMITED OFFER for CryptoPotato readers at Bybit: Use this link to register and open a $500 FREE position on any coin!


Bitcoin (CRYPTO: BTC) faced a renewed test after a brief relief rally, sliding back below the $68,500 mark as sellers reasserted control. The move comes after the asset briefly flirted with the $74,000 threshold, a level that previously functioned as a ceiling during the latest ascent. Traders now eye whether the crypto bellwether can defend the $68,000–$70,000 zone to sustain any upside or if renewed selling pressure could push Bitcoin toward the lower end of its recent range. On-chain analytics add a cautious tone: CryptoQuant notes that its Bear Score Index remains firmly in bearish territory, suggesting the current bounce may be a relief rally rather than the onset of a sustained trend reversal.
Ether (CRYPTO: ETH) attempted to clear the $2,111 barrier but could not sustain the breakout, slipping back below the level and signaling that demand remains uncertain. The broader narrative across the top assets is one of mixed momentum, with several major altcoins retreating from overhead resistance as selling pressure persists. The market has also been grappling with a sense of caution, as traders weigh whether the recent rally was a temporary reprieve or the precursor to a longer-term bottom formation.
Bitcoin’s price action sits at a crossroads as the $69,000 region now acts as a critical fulcrum. A sustained bounce off the 20-day exponential moving average near $69,003 would keep hopes alive for another test of the higher ceiling around $74,508. If bulls manage to clear that resistance, the next target could be an ascent toward $84,000, a move that would bolster the view that a bottom may be forming after last year’s volatility. Conversely, a collapse below the $69,000 level could open the path to the support line, potentially pulling the pair down toward the $60,000 area and inviting renewed bearish sentiment.
Beyond Bitcoin, the price action across the broader top-10 cohort remains telling. Bitcoin Cash (CRYPTO: BCH) shows the bears pressing at the $443 support, with a rally back to $476 failing to gain traction. A breakdown below $443 would underscore a bearish continuation pattern, while a breakout above the 20-day EMA near $488 could ignite a move toward the 50-day simple moving average around $533 and, in turn, toward $600 if momentum sustains. Cardano (CRYPTO: ADA) has also flirted with the 20-day EMA near $0.27 but has not sustained gains above it, leaving the downside risk contained near $0.25 for now. A decisive rebound could push ADA back toward the channel’s upper boundary, but a close below $0.25 would open the door to a retest of the lower support around $0.15.
XRP (CRYPTO: XRP) traded above the 20-day EMA near $1.41 briefly but could not maintain the gain, and bears are working to push the price below the $1.27 support. If that support gives way, the下降 pattern could steer XRP toward the lower boundary of its current channel. On the flip side, a sustained move above the 20-day EMA could signal a reclaim by bulls and set up a test toward $1.61, a level that has repeatedly presented a challenge in recent sessions.
Solana (CRYPTO: SOL) experienced a rejection at $95, slipping below the 20-day EMA around $86. The market appears balanced, with the 20-day EMA and the relative strength index hovering near midpoints, suggesting a digestion period in which SOL could oscillate between roughly $76 and $95 for several days. A close above $95 would shift the balance toward a run to the $117 mark, while a drop below $76 could accelerate downside moves toward broader support levels.
Dogecoin (CRYPTO: DOGE) showed a brief uptick above the 20-day EMA near $0.10 but failed to clear the 50-day moving average at $0.11. The next decisive benchmark lies at the $0.12 breakdown level, where a sustained push could clear intermediate resistance and trigger a rally toward higher targets. A move below $0.09 would increase the likelihood of a retest of the February lows, with potential downside to $0.08 or lower if selling pressure intensifies.
Bitcoin-related altcoins aren’t alone in the tug-of-war. Hyperliquid (CRYPTO: HYPE) has pulled back toward major moving averages, a zone that will determine whether buyers regain control or sellers extend the range. If the price can rebound with vigor off the moving averages and clear the $36.77 overhead resistance, the onset of a fresh upmove could be on the cards. If the price breaks below the moving averages, HYPE could remain trapped in a $20.82–$36.77 corridor for a while longer.
Monero (CRYPTO: XMR) is contending with uphill resistance near the $360 threshold as buyers attempt to push higher. The crucial line in the sand remains the 20-day EMA around $347; a bounce from that level could lift XMR toward the 50-day SMA near $396 and, if momentum persists, toward the 61.8% Fibonacci retracement at $414. A drop below the EMA could keep XMR range-bound between roughly $384 and $302 for an extended period.
Among the most watched charts, Ethereum’s predecessor narratives persist, with traders keeping a close eye on whether the broader market can sustain any updrafts. The balance of evidence suggests a market that is more cautious than euphoric, with risk appetite still tethered to macro signals and liquidity conditions rather than a clear, durable uptrend. The next few sessions could prove pivotal in determining whether the bounce collects steam or dissolves into another leg lower.
What the movement means for the market
The current pattern highlights the fragility of any sustained rebound in the near term. While there are clear pockets of buoyancy in assets such as ETH and select layer-1s, the macro tone remains cautious, and traders are wary of fading rallies that fail to hold key support. The stubbornness of oversold levels around the 20-day EMAs across multiple coins suggests that a broad-based acceleration will require a decisive catalyst—be it a macro shift, favorable ETF-related flows, or a notable improvement in on-chain metrics that overturn the prevailing Bear Score tone.
From a risk-management perspective, the emphasis appears to be on defense at notable support zones. Traders are closely watching whether Bitcoin can anchor in the $68k–$70k corridor, as a break below this band would likely reintroduce selling pressure and push the market toward more pessimistic pricing. Conversely, any sustained move above critical resistance levels, especially for BTC near $74,508 and ETH near $2,328, could inject optimism and invite more aggressive positioning in the days ahead.
Why it matters
For investors, the present environment underscores the importance of discerning genuine trend reversals from bear-market rallies. The interplay between major assets and the resilience (or lack thereof) of their support and resistance levels provides insight into the health of liquidity in the sector. If the relief rally proves ephemeral, market participants may opt for selective exposure to assets showing relative strength in the face of headwinds, rather than broad, all-encompassing bets on a full-blown bull cycle.
Developers and builders in the space will be watching how market dynamics affect user onboarding, product launches, and ecosystem activity. A sustained dip could delay capital deployment in areas like DeFi and NFT-related applications, while a credible revival might spur renewed interest in network upgrades and cross-chain interoperability initiatives. Regulators and institutional participants are likewise assessing risk tolerance and liquidity considerations, which could influence future product offerings and filing activity, including potential ETF developments and institutional custody solutions.
As always, risk remains the defining theme. This cycle continues to emphasize capital preservation, careful risk assessment, and a disciplined approach to position sizing, especially in the absence of a clear macro-driven momentum shift. The trajectory over the next several weeks will help determine whether the market is contending with a deeper structural bottom or simply oscillating within a longer consolidation channel before the next phase of volatility.
What to watch next
- Bitcoin must hold the $68,000–$70,000 zone; a sustained close above $74,508 would be a tape-reading cue for possible upside toward $84,000.
- Ether needs to clear and sustain above $2,111, with a breakout above the 50-day SMA at $2,328 opening the door to around $2,600.
- A sustained move above $670 for BNB would recalibrate the short-term bias toward $718 and potentially $790, while a break below $570 could deepen near-term downside.
- XRP: a break above the 20-day EMA near $1.41 could set the stage for a rally toward $1.61; a drop below the $1.27 support would tilt sentiment bearish.
- SOL: a daily close above $95 would suggest a revival toward the $117 level, while a close below $76 could signal further consolidation or downside.
Sources & verification
- Bitcoin price action and key levels around $74,508 and the 20-day EMA near $69,003 as discussed in the market analysis.
- Ether’s struggle to sustain above $2,111 and next potential target after clearing the 50-day SMA around $2,328.
- BNB’s resistance near $670 and the implications of a move above or below the 20-day EMA at about $637.
- XRP’s price dynamics with the 20-day EMA near $1.41 and the critical $1.27 support level.
- Solana’s action around $95 and the balancing zone between $76 and $95, with a potential move to $117 on breakout.
- Dogecoin’s test of the 50-day SMA at $0.11 and the support zone around $0.09 to $0.08.
- Monero’s attempts to push above $360, with key levels at the 20-day EMA ($347), 50-day SMA ($396), and $414 as the 61.8% retracement target.
Tickers mentioned
Tickers mentioned: $BTC, $ETH, $BNB, $XRP, $SOL, $DOGE, $ADA, $BCH, $HYPE, $XMR
Sentiment
Sentiment: Neutral
Market context
Market context: The current price action unfolds in a cautious environment where liquidity and risk appetite are sensitive to macro signals, while on-chain metrics temper any optimism with a note of caution about potential further volatility.
Why it matters
The ongoing tension between support and resistance across major assets suggests that traders should distinguish between temporary bounces and durable trend reversals. A confirmed break of key levels could reframe the outlook for the next phase of the cycle, while persistent lack of follow-through may keep markets in a prolonged consolidation. For developers and investors alike, this environment emphasizes risk discipline, selective exposure, and attention to cross-asset correlations as the market digests incoming liquidity and regulatory signals.
What to watch next
- Bitcoin holds above the $68,000–$70,000 band; a weekly close above $74,508 would be a meaningful bullish signal.
- Ether sustains above $2,111 and closes above $2,328 to open a path toward $2,600.
- Bullish continuation for BNB requires a breakout above $670, with local targets around $718 and $790.
Sources & verification
Bitcoin price is showing early signs of a possible trend shift after a key on-chain indicator flashed a rare bullish signal, even as the market continues to consolidate.
Summary
- Bitcoin’s Inter-exchange Flow Pulse crossed above its 90-day moving average for the first time since early 2025.
- BTC is consolidating between $67K and $72K after a sharp drop from the $95K region.
- A breakout above $72K could open the path toward the $75K–$78K resistance zone.
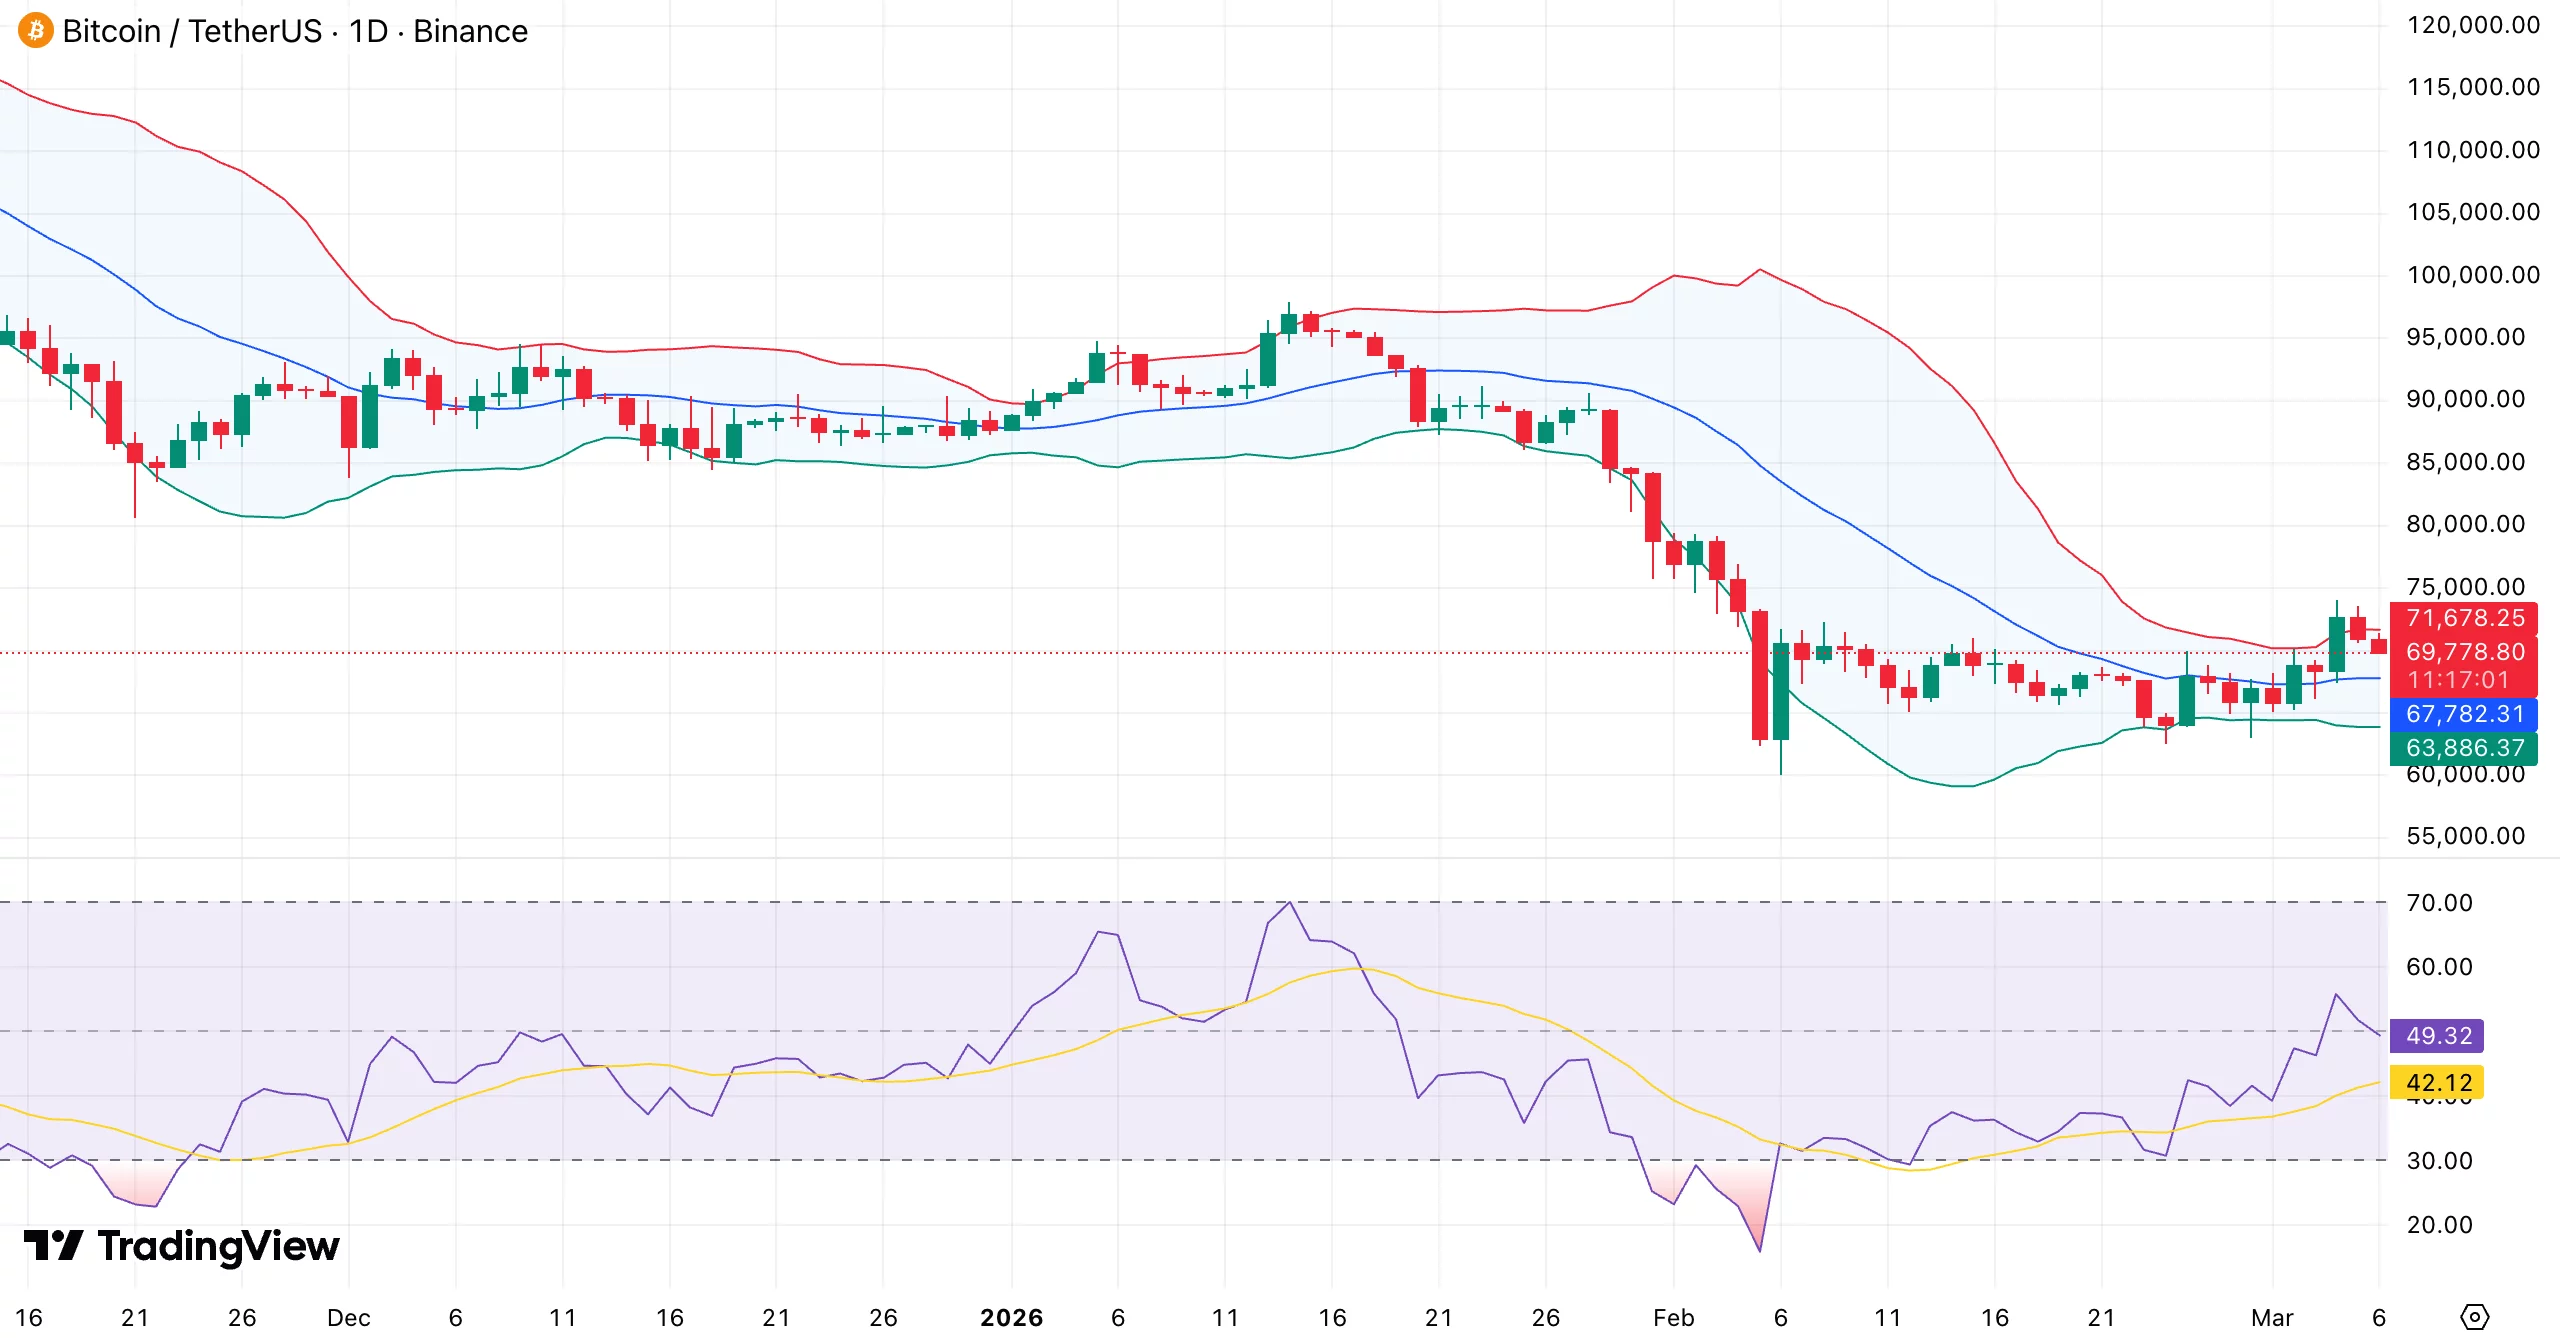
Bitcoin (BTC) was changing hands at around $70,080 at the time of writing. That represents a 3.7% decline over the past 24 hours. Even so, the price remains close to the top of its weekly trading band, which currently spans from $63,176 to $73,669.
Short-term weakness hasn’t erased the gains seen over the past week. BTC is still up about 5.8% during that period. Over the last month, however, the trend is slightly negative, with the asset down around 8%. Compared with its October 2025 peak of $126,080, Bitcoin is still trading roughly 44% below its all-time high.
Market participation has also slowed. During the last 24 hours, trading volume dropped to $47.99 billion, a decline of more than 32%. Such pullbacks in activity are common during consolidation phases, when traders step back and wait for clearer direction.
The derivatives market tells a similar story. Data from CoinGlass shows trading volume in derivatives contracts falling by 23% to $72 billion. Open interest also slipped, declining 8% to $45 billion as some leveraged positions were closed.
IFP indicator signals renewed risk appetite
Amid this quieter market environment, fresh on-chain data is drawing attention. Analysts at CryptoQuant report that Bitcoin’s Inter-exchange Flow Pulse has moved above its 90-day moving average.
The shift marks the first time the metric has crossed that level in roughly a year, according to a March 6 report by CryptoQuant contributor RugaResearch.
To understand why this matters, it helps to look at what the indicator measures. The IFP tracks Bitcoin transfers between spot exchanges and derivatives platforms.
A rise in flows toward derivatives venues often signals that traders are preparing leveraged positions in anticipation of potential upside. When the movement heads toward spot exchanges instead, speculation in the market usually declines.
Looking back at historical data adds more context. Since 2016, similar IFP crossovers have frequently appeared near the early stages of bullish cycles. That said, the signal does not always translate into immediate price rallies. In some cases, the market took time to react.
The indicator had spent nearly a full year below its long-term average before this latest development. It turned bearish in early 2025 and remained there throughout much of the year, making it one of the longest negative stretches recorded for the metric.
Bitcoin price technical analysis
On the price chart, Bitcoin appears to be stabilizing after a steep fall earlier in the year. The drop began in the $95,000–$100,000 range and eventually pushed the price down to around $63,000, where buyers finally stepped in.
Since reaching that level, price movement has been largely sideways. This type of behavior often signals that selling pressure is easing while demand slowly returns.

For several weeks now, BTC has traded within a relatively tight corridor between $67,000 and $72,000. Markets often behave this way during accumulation phases, when participants quietly re-position before the next significant move.
The immediate hurdle sits at $72,000. If buyers manage to push the price above that level and secure a strong daily close, a breakout from the range could follow. In that case, attention would likely shift toward the $75,000–$78,000 region, where another supply zone is expected.
Below the current price, support continues to hold around $67,000. A deeper demand area can be found near $63,000, the same region that previously stopped the earlier sell-off.
That dip toward $63,000 may not have been accidental. In many markets, prices briefly fall below a key support level to trigger stop-loss orders before reversing direction.
This type of move is often referred to as a liquidity sweep. Bitcoin quickly rebounded after touching that area, reclaiming $67,000 soon afterward as buying pressure absorbed the sell-off.
Volatility has also been shrinking as the range tightens. Historically, quieter phases like this tend to precede stronger directional moves.
A breakout above $72,000 would likely strengthen bullish momentum and open the path toward higher resistance levels. On the other hand, losing support at $67,000 could weaken the recovery structure and bring the $63,000 demand zone back into focus.
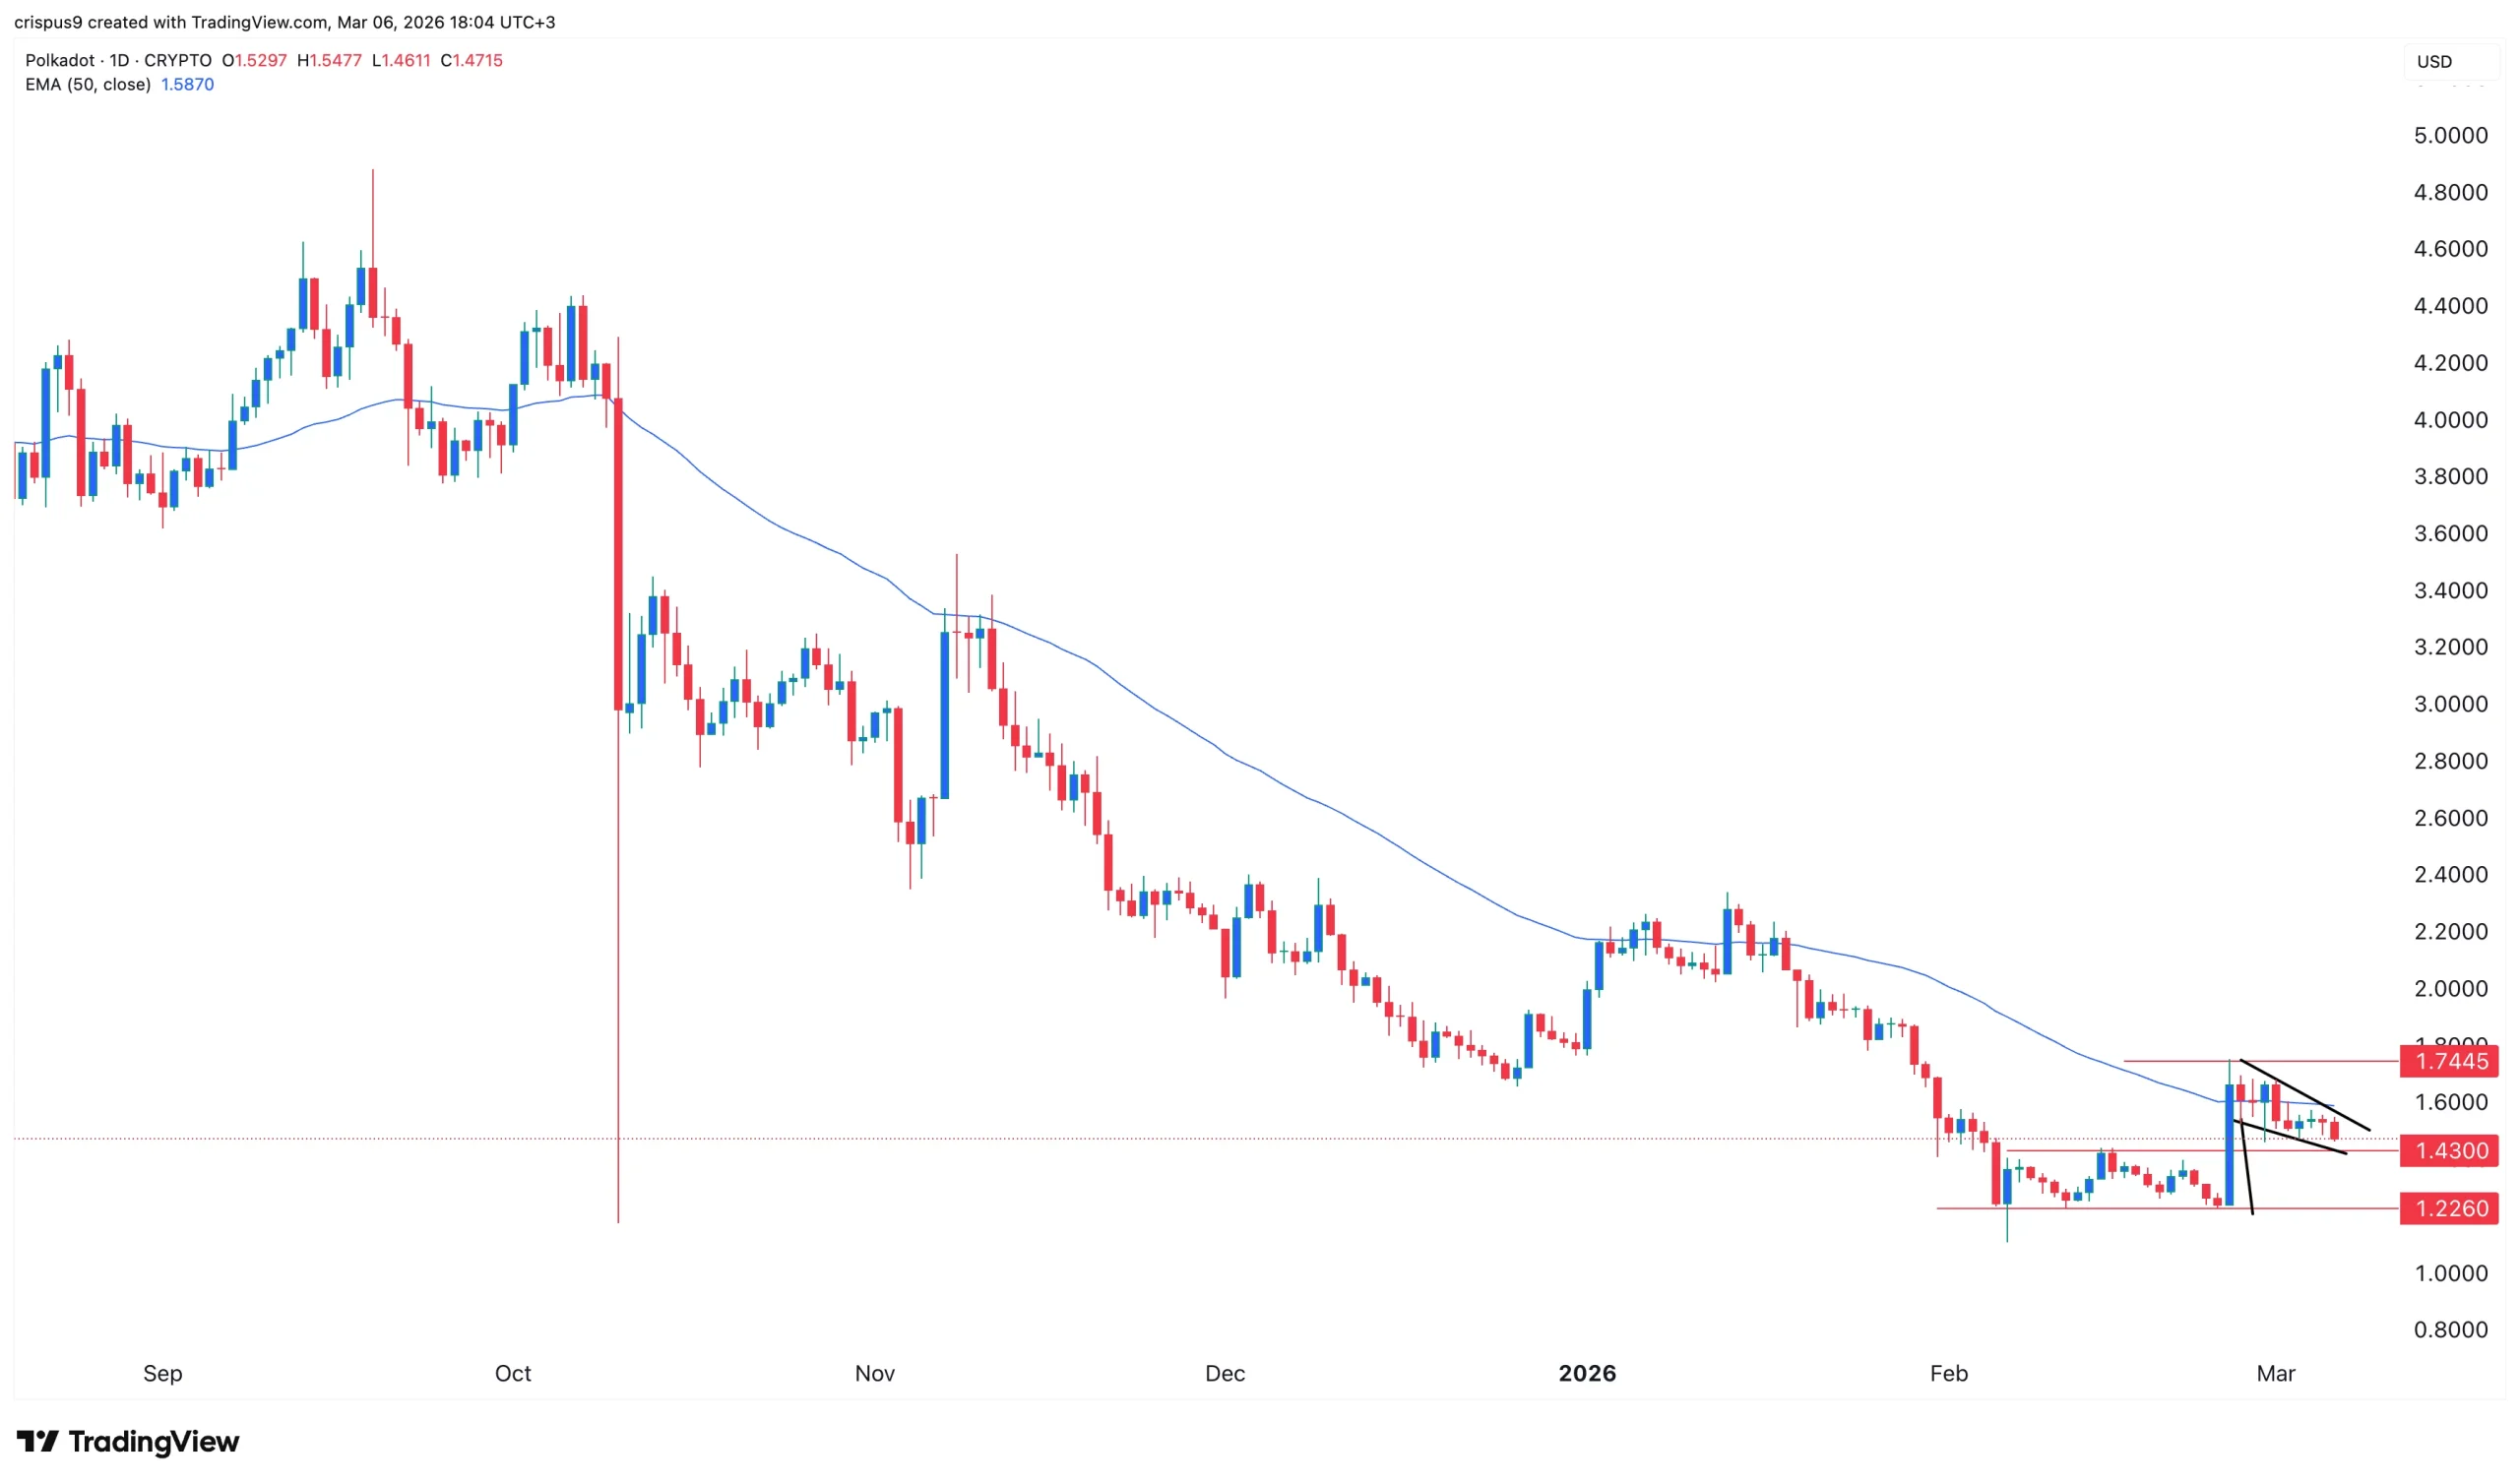
Polkadot price retreated by 3% today, March 6, even as market participants waited for the first DOT ETF and tokenomics overhaul.
Summary
- 21Shares will launch the first spot DOT ETF today.
- The fund will be seeded with $11 million.
- History suggests that the fund may struggle to attract inflows.
Polkadot (DOT) token dropped to $1.4753, down substantially from this month’s high of $1.745. This retreat happened ahead of the launch of the 21Shares DOT ETF today.
Bloomberg’s Eric Balchunas noted that the fund has been seeded with $11 million in assets. This is a substantial amount considering that the three Dogecoin ETFs have accumulated $7.45 million in inflows and have $9.27 million in net assets.
In theory, the launch of the DOT ETF should boost its price as it will make it available to American retail and institutional investors. However, data shows that demand for altcoin ETFs is limited.
Spot Avalanche ETF has added just $8.98 million in inflows. It has had no inflow since February 24. Similarly, spot Hedera and Chainlink ETFs have had less than $100 million in inflows since their launch.
Polkadot’s situation is worse because of its smaller ecosystem than the other chains. For example, while Ethereum holds over $165 billion in stablecoins, Polkadot’s parachains hold less than $100 million.
DOT price will also react to the upcoming tokenomics overhaul on March 12. This overhaul will cap the supply to 2.1 billion and cut emissions by 53.6%. Staking unbonding days will drop from 28 days to between 24 and 48 hours.
Polkadot price prediction: technical analysis

DOT token has pulled back in the past few days, moving from this month’s low of $1.7445 to the current $1.4673. A closer look shows that it has retested the neckline of the double-bottom pattern that happened at $1.2260. A break and retest pattern is a common continuation sign.
The coin has also formed a bullish flag pattern. This pattern has a flagpole and a descending channel, resembling a hoisted flag. Therefore, the coin may attract bids in the next few days. If this happens, the next key target to watch will be at $1.7445. A break above that price will point to more gains, potentially to $2.


Disclosure: This article does not represent investment advice. The content and materials featured on this page are for educational purposes only.
Institutional accumulation of Ethereum signals rising confidence and renewed momentum for DeFi expansion.
Summary
- Institutional Ethereum inflows are boosting new DeFi protocols like Mutuum Finance, which has raised over $20.7m from 19k holders.
- Mutuum Finance builds non-custodial crypto lending on Ethereum, using mtTokens and debt tokens to manage liquidity and loans.
- Mutuum Finance expands DeFi lending with over-collateralized loans, letting users borrow against assets without selling them.
The top crypto market is currently witnessing a concentration of capital as institutional players increase their holdings of Ethereum (ETH). This trend of accumulation is providing a foundation of liquidity that often precedes a broader expansion in the decentralized finance (DeFi) sector.
As large-scale purchases signal growing confidence in the Ethereum network, the focus of the market is shifting toward utility-driven protocols that utilize this infrastructure to provide automated financial services.
Ethereum
Recent market data highlights a substantial increase in Ethereum accumulation. On March 2, the firm BitMine executed a significant acquisition of 50,928 ETH. This purchase brings the company’s total holdings to approximately 3.71% of the total Ethereum supply, moving them closer to their stated target of 5%.
Several analysts have noted that such large-scale movements often indicate potential growth for the asset regardless of short-term price fluctuations. Technical indicators like the Chaikin Money Flow (CMF) and Money Flow Index (MFI) currently suggest a high level of investor confidence and sustained buying pressure.
At present, Ethereum is trading within a range that has established a market capitalization of several hundred billion dollars. Following this recent accumulation, market observers are watching key resistance zones near the $3,800 and $4,000 levels. If the asset can maintain its support above $3,400, it may provide the necessary stability for the rest of the ecosystem to grow.
How massive Ethereum buys power utility protocols
Large Ethereum purchases do more than just influence the price of ETH; they act as a catalyst for the next wave of utility protocols. When institutional capital enters the Ethereum ecosystem, it validates the network’s security and longevity.
This confidence encourages developers and investors to explore new complex protocols like Mutuum Finance (MUTM), which is building a non-custodial framework for automated lending and borrowing. According to its official whitepaper, Mutuum Finance aims to create a decentralized environment where digital assets can be managed through code rather than human intermediaries.
The project has already achieved significant milestones, raising over $20.7 million in funding and establishing an investor base of 19,000 participants. The MUTM token is currently priced at $0.04. By building on the Ethereum network, protocols like Mutuum Finance benefit from the deep liquidity and security provided by the massive ETH accumulation currently taking place.
The Protocol’s mechanics
The economic model of Mutuum Finance relies on a transparent system of receipts and obligations. When a user deposits an asset like ETH into a liquidity pool, the protocol issues mtTokens (such as mtETH) as a yield-bearing digital receipt. These tokens represent the user’s share of the pool. As borrowers pay interest, the value of the mtToken increases. For example, if a pool has a 5% Annual Percentage Yield (APY), a user who deposits 20 ETH will find that their 20 mtETH is redeemable for 21 ETH after one year.
To manage the other side of the transaction, the protocol uses Debt Tokens. When a user borrows against their collateral, the system mints these tokens to track the principal and the accrued interest in real-time. The safety of these loans is managed by the Loan-to-Value (LTV) ratio. If the LTV for a specific asset is set at 75%, a user providing $4,000 in ETH as collateral can borrow a maximum of $3,000 in another asset, like a stablecoin. This ensures that every loan remains over-collateralized, protecting the protocol from potential bad debt.
Furthermore, this mechanism benefits the borrower by allowing them to access liquidity without having to sell their original assets. By borrowing against their ETH instead of selling it, the user can obtain liquidity for immediate use while still maintaining their investment position. If the value of the ETH increases during the loan period, the borrower still gains from that price growth.
The V1 protocol and risk-free testing
The Mutuum Finance V1 protocol is currently the primary environment for testing these features. It focuses on high-liquidity assets including USDT, ETH, WBTC, and LINK. By using the V1 testnet, users can interact with the system’s automated smart contracts. This provides a risk-free environment to understand how mtTokens grow in value, how Debt Tokens track interest, and how LTV ratios function under different market conditions.
In this V1 setup, the protocol uses decentralized oracles to provide live price feeds. These feeds are essential for calculating the “Stability Factor” of each user’s position. If the value of a user’s collateral drops and their Stability Factor falls below a safe threshold, automated liquidation bots sell a portion of the collateral to repay the loan. This mechanical approach ensures that the system remains solvent at all times, regardless of market volatility.
The synergy between Ethereum and protocol roadmaps
The future of both Ethereum and Mutuum Finance is defined by their respective roadmaps. Ethereum is continuing its transition toward greater scalability and lower transaction costs through its “Dencun” and subsequent upgrades. These improvements are vital for DeFi protocols, as they allow for more frequent and cheaper interactions with smart contracts. As Ethereum becomes more efficient, the cost of lending, borrowing, and staking decreases for the end-user.
The Mutuum Finance roadmap is also entering a critical phase. The protocol moves toward the launch of the Safety Module and its staking system. These two components work together to ensure the protocol remains healthy while rewarding users who help protect it.
In decentralized finance, sudden market shifts or technical issues can sometimes create a gap between what the protocol owes and what it holds. The Safety Module acts as a backstop by holding a pool of assets that the protocol can use to cover these unexpected losses. By having this reserve, the system ensures that lenders can always withdraw their funds, even during periods of high market stress.
Staking is the process by which users contribute to this security. When a user stakes MUTM tokens or mtTokens, they are essentially locking them into the Safety Module. By doing this, the user is acting as a guarantor for the protocol’s stability. Because the user is providing a vital service by backing the system’s safety, the protocol compensates for commitment.
This is where the Buy-and-Redistribute mechanism comes in to provide rewards. The protocol collects fees from every loan and trade made on the platform. A portion of these fees is used to buy MUTM tokens directly from the open market. Those tokens are then distributed to the people who have staked mtTokens in the Safety Module. This creates a sustainable cycle: as more people use the protocol, more fees are generated, which leads to more rewards for the stakers who keep the system secure.
Disclosure: This content is provided by a third party. Neither crypto.news nor the author of this article endorses any product mentioned on this page. Users should conduct their own research before taking any action related to the company.

TLDR
- The SEC will hold a public roundtable on April 16, 2026, at its Washington headquarters.
- The agency will examine the structure of the U.S. listed options market during the event.
- Officials will discuss competition among trading venues in the quote-driven market.
- The roundtable will address the overall customer experience for investors.
- Commissioner Hester M. Peirce said the market has seen growth among retail investors.
The U.S. Securities and Exchange Commission will hold a public roundtable on April 16, 2026, in Washington. The agency will examine the structure of the U.S.-listed options market during the event. It will host the session at its headquarters and stream it live on its official website.
Focus on Market Structure and Competition
The SEC will center the roundtable on Market Structure and competition within the listed options market. The agency will review how trading venues compete in a quote-driven environment. It will also assess how this structure affects order handling and price formation. Officials plan to gather input from market participants and industry representatives.
Hester M. Peirce, commissioner at the SEC, addressed the market’s recent expansion. She said, “The U.S.-listed options market has seen remarkable growth, particularly among retail investors.” She added that the roundtable will allow regulators and participants to reflect on the market’s development. She stated that discussions will identify areas where improvements could support continued expansion.
Public Access and Submissions
The SEC will hold the roundtable at 100 F Street, N.E., in Washington, D.C. The agency will open attendance to the public, although seating may remain limited. Visitors will undergo security checks before entering the building. The SEC will provide a live webcast through its website for remote viewers.
The agency will allow members of the public to submit comments electronically or by mail. It will include all submissions in the official public record without modification. The SEC will post these comments on its website for public access. It said it will release the agenda and list of speakers closer to the event date.


Binance has rejected allegations that its platform allowed transactions linked to entities in Iran.
Summary
- Binance issued a formal response to a U.S. Senate inquiry denying claims that it allowed transactions linked to Iran.
- The exchange said media reports cited in the inquiry contain false and unsupported allegations about its compliance program.
- Binance pointed to investigations that led to the removal of certain entities and its expanded compliance measures.
The exchange issued a response on March 6 to a letter sent by Richard Blumenthal regarding sanctions compliance and anti-money laundering controls. The inquiry referenced several recent media reports. Binance said those reports contain false and unsupported claims about its compliance program.
Binance said it runs a large compliance operation to prevent sanctioned users from accessing the platform. Identity verification is required for every user, and individuals located in Iran are not allowed to use the exchange.
Compliance program and monitoring systems
According to the company, millions of dollars have been invested in compliance infrastructure in recent years. The compliance team now includes more than 1,500 professionals around the world. Many focus on sanctions monitoring, financial crime investigations, and counter-terrorism financing checks.
More than 25 monitoring tools are used to screen users and review transactions. Customer onboarding checks, sanctions screening, and behavioral analysis are also applied to detect suspicious activity. When concerns appear, cases are reviewed and information can be shared with law enforcement.
The company also pointed to its cooperation with investigators. In 2025 alone, Binance handled more than 71,000 law-enforcement requests. Over the past three years, authorities seized more than $752 million with assistance from the exchange.
Blockchain analytics data cited by Binance shows a decline in exposure to wallets linked to illicit activity. Between January 2024 and July 2025, the share of exchange volume connected to such wallets dropped from 0.284% to 0.009%.
Investigations involving flagged entities
The inquiry also mentioned two trading entities, Hexa Whale and Blessed Trust, which were reported to have indirect exposure to wallet addresses with possible links to Iran.
Binance said it became aware of those concerns after receiving requests from law enforcement in 2025. Investigations were then carried out by the exchange’s internal team. Transaction records were reviewed and user information was provided to authorities.
After the reviews were completed, both entities were removed from the platform. Hexa Whale was offboarded in August 2025, while Blessed Trust was removed in January 2026. Binance said it is not aware of any account on the exchange that directly transacted with an Iran-based entity.
The company also rejected claims that it had identified thousands of Iranian-linked accounts. Binance said it never made such a determination and noted that any attempt to bypass location restrictions using a VPN violates its terms of service.
Binance said it investigates credible risks, removes accounts when necessary, and works with authorities to address potential misuse of its platform.

TLDR
- MiniMed (MMED) started trading at $19.05 on Friday, March 6, falling 4.8% below the $20 IPO offering price in its Nasdaq launch.
- The diabetes technology firm generated $560 million through the sale of 28 million shares — significantly lower than the anticipated $25–$28 pricing range.
- The opening price established MiniMed’s market capitalization at $5.35 billion.
- Medtronic (MDT) continues to control approximately 90% ownership following the initial public offering.
- Market conditions were challenging on debut day, with the VIX surging to its highest level in four months after disappointing employment data.
The highly anticipated public market entrance of MiniMed fell short of expectations on Friday. Shares of the diabetes device manufacturer began trading at $19.05 on Nasdaq — representing a 4.8% decline from the $20 offering price — establishing a company valuation of $5.35 billion.
MiniMed Group, Inc. Common Stock, MMED
Market sentiment proved challenging across the board. The CBOE Volatility Index climbed to its highest point in four months, fueled by disappointing employment figures that rattled investor confidence. These conditions created far from ideal circumstances for a debut listing.
The transaction generated $560 million in proceeds through the placement of 28 million shares. This represented a significant reduction from initial expectations — the marketed pricing range stood at $25 to $28 per share, forcing MiniMed to accept a substantial discount to complete the transaction.
Market observers had expressed skepticism about whether the original valuation made sense, and the final pricing appears to validate those concerns.
A Tough Market for New Listings
The IPO environment has faced significant headwinds in recent weeks. Anxieties surrounding artificial intelligence disruption and global political instability have reduced enthusiasm for new public offerings, constraining activity throughout the market.
MiniMed’s challenging debut reflects this broader trend. Even established brands are struggling to achieve premium pricing in the current environment.
Medtronic (MDT) executed the separation to generate funds and create an independent diabetes-focused entity. Following completion of the IPO, Medtronic maintains approximately 90.03% ownership of MiniMed — a figure that would drop to 88.70% should underwriters fully exercise their 30-day option to acquire an additional 4.2 million shares.
The transaction is expected to finalize on March 9, 2026.
MiniMed intends to deploy the capital raised for general operational needs, settling intercompany obligations owed to Medtronic, and covering expenses related to asset transfers completed during the separation.
Back to Growth After Regulatory Headwinds
The organization previously encountered regulatory challenges regarding quality control systems and cybersecurity vulnerabilities associated with certain products. Those issues have been resolved, and the company has demonstrated renewed growth momentum in recent reporting periods.
MiniMed operates in a competitive landscape alongside Beta Bionics, Dexcom (DXCM), Insulet (PODD), and Tandem Diabetes Care (TNDM) within the diabetes technology sector.
The company’s portfolio encompasses insulin delivery pumps, continuous glucose monitoring platforms, and sensor technology designed for individuals managing both type 1 and type 2 diabetes.
Medtronic (MDT) finished Thursday’s session lower at $93.01 before the spinoff company’s market debut.
TLDR
- Kalshi faces a proposed class action over a $54 million market on Iran’s Supreme Leader Ali Khamenei leaving office.
- Traders allege the platform failed to honor payouts on “yes” positions after halting the market.
- The lawsuit claims Kalshi did not clearly disclose a death-related carveout before reports of airstrikes surfaced.
- Plaintiffs argue the contract language promised full payouts if Khamenei exited the role by set dates.
- Kalshi CEO Tarek Mansour said the company does not offer markets directly tied to a person’s death.
Kalshi faces a proposed class action over a halted market tied to Iran’s Supreme Leader Ali Khamenei. Traders claim the platform failed to honor payouts on “yes” positions after trading surged. The dispute centers on contract language and disclosures tied to a reported death exception.
Kalshi Market Rules at Center of Payout Dispute
The complaint states that Kalshi structured the market as a binary contract tied to Khamenei leaving office by set dates. Traders argue the language promised full payouts to “yes” holders if he exited the role. However, the filing says the platform did not clearly disclose a death-related carveout before reports of airstrikes surfaced.
Plaintiffs claim Kalshi allowed trading to continue on Feb. 28 as reports of US and Israeli strikes spread. They allege the platform encouraged more “yes” bets despite knowing those contracts would not pay. According to Bloomberg Law, the suit argues the rules were “clear, unambiguous, and binary,” yet traders say the death carveout appeared only after trading intensified.
The disputed market drew about $54 million in trading volume before Kalshi halted it. Traders contend they expected payouts if Khamenei left office for any reason. The lawsuit states that the platform’s disclosures failed to highlight any exclusion tied to death until after the reports emerged.
Plaintiffs Adam Risch and Yonatan Gliksman filed the case in the US District Court for the Central District of California. Novian & Novian LLP represents the proposed class of US traders. The complaint alleges breach of contract and violations of California law.
Kalshi Response and Legal Claims
Kalshi CEO Tarek Mansour addressed the dispute in public posts after criticism increased. He stated that the company does not offer markets directly tied to a person’s death. He wrote, “While the rules were clear and we tried our best to highlight them, traders vocalized they were not prominent enough.”
Mansour later said the company would reimburse traders for fees and net losses linked to the halted market. He added that Kalshi would update how similar contracts disclose death-related exceptions. He wrote that the firm would reimburse losses out of pocket.
The plaintiffs seek damages and restitution from the platform. They also request court orders requiring improved disclosure practices for future contracts. The filing argues that Kalshi’s conduct misled traders about payout conditions.
The market asked participants to predict whether Khamenei would leave office by specific deadlines. Trading accelerated after reports of airstrikes circulated. Kalshi halted the market shortly after the reports, and the dispute now proceeds in federal court.

Online gambling in 2026 presents stark philosophical choices. Established resort brands compete against blockchain-native newcomers.
Borgata carries Atlantic City prestige into digital space. ZunaBet launched this year assuming cryptocurrency changes everything.
Different eras of thinking produced different platforms. Here’s how they compare.
Borgata Explained
Borgata transformed Atlantic City gambling when it opened in 2003. The resort raised standards for the entire market.
Digital operations followed that success. Borgata Online Casino serves New Jersey and Pennsylvania players.
MGM Resorts ownership provides substantial backing. Corporate resources support ongoing operations.
Game selection emphasizes proven quality. Established providers deliver reliable experiences.
Banking processes all money movement. Cards, transfers, e-wallets work through financial institutions.
Withdrawals take banking time. One to five business days covers typical scenarios.
Welcome bonuses stay competitive regionally. Deposit matches and credits attract signups.
MGM Rewards connects everything together. Online points redeem at properties everywhere.
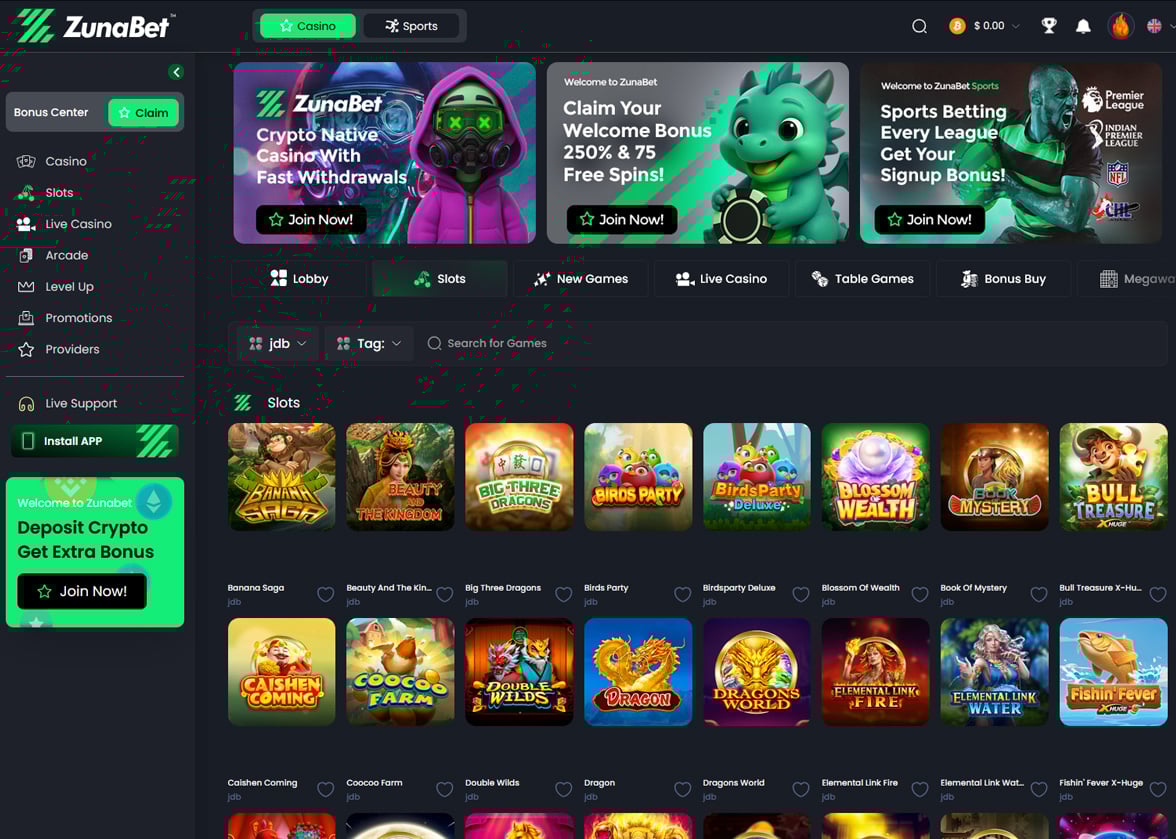
ZunaBet Explained
ZunaBet emerged in 2026 with fresh thinking. Strathvale Group Ltd built cryptocurrency infrastructure from the start.
Leadership experience exceeds 20 years combined. Anjouan licensing governs the platform.
Launch day included 11,000+ games. Sixty-three providers created immediate depth.
Quality names fill the roster. Pragmatic Play, Evolution, Hacksaw Gaming, Yggdrasil, BGaming included.
Cryptocurrency handles everything. BTC, ETH, USDT, SOL, DOGE, ADA, XRP function seamlessly.
Transaction fees stay zero. Speed beats banking consistently.
Full sportsbook operates too. Sports, esports, virtuals all covered.

Dissecting Bonuses
Borgata offers regulated market packages. Deposit matching with typical conditions applies.
State location affects specifics. Current promotions need checking.
ZunaBet reaches $5,000 plus 75 free spins total. Distribution spans three deposits.
First deposit brings 100% to $2,000 plus 25 spins. Second brings 50% to $1,500 plus 25 spins.
Third brings 100% to $1,500 plus 25 spins. Full participation unlocks full value.
Staged distribution sustains engagement. Single offers often end quickly.
Terms apply universally. Understanding them matters.
Dissecting Loyalty
Borgata integrates with MGM Rewards fully. Online play earns resort-wide points.
Points become hotel nights, meals, shows. Property visitors benefit enormously.
Non-visitors accumulate without easy redemption. Location determines value realization.
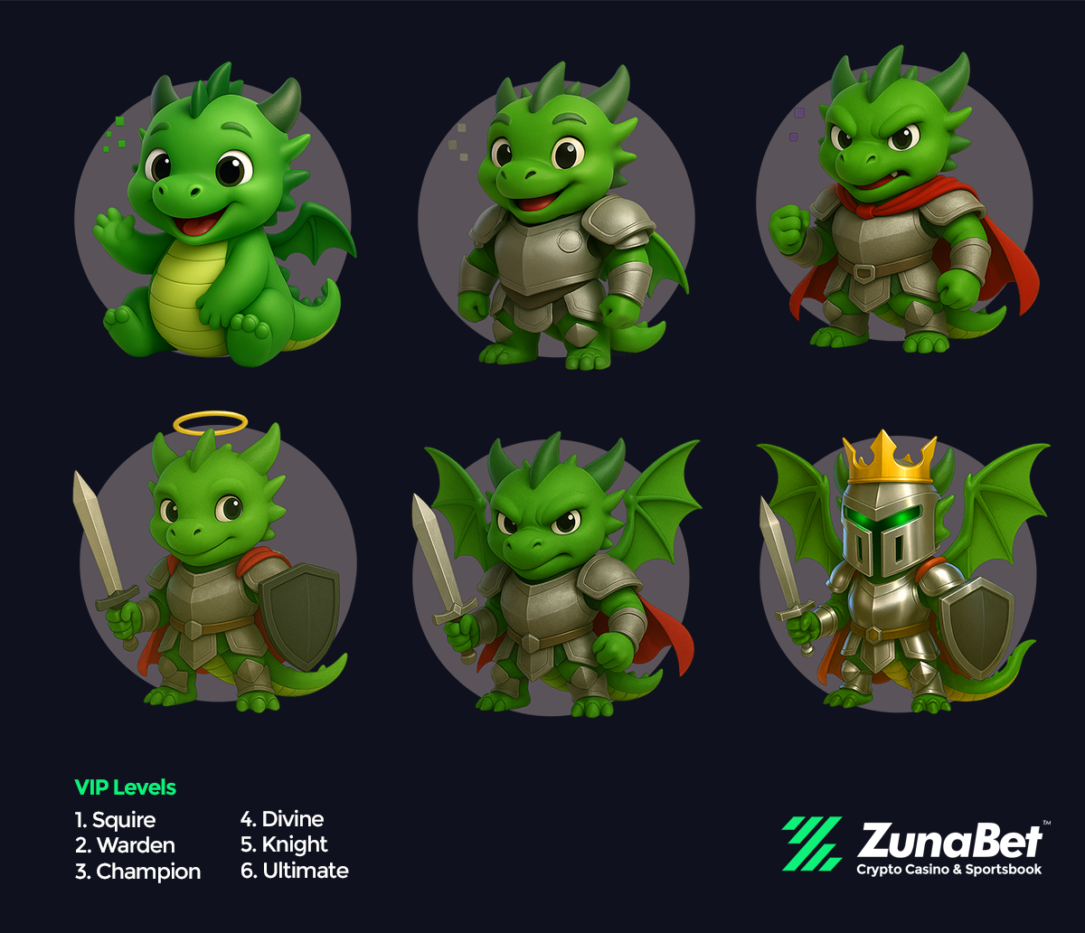
ZunaBet designed dragon progression instead. Six tiers deliver growing rakeback.
Squire returns 1%. Warden returns 2%, Champion returns 4%.
Divine returns 5%. Knight returns 10%.
Ultimate returns 20% rakeback. Volume generates substantial returns.
Free spins reach 1,000 through advancement. VIP extras supplement core rewards.
Zuno dragon visualizes progress. Advancement feels tangible.
Rakeback means direct cash. Resort points mean travel requirements.
Dissecting Payments
Borgata depends on banking infrastructure. Institutions process every transaction.
Cards deposit fast. Withdrawals enter queues.
Business hours matter. Weekends pause things.
Statements show gambling clearly. Privacy limited.
ZunaBet bypasses banking entirely. Wallets transact directly.
No banks means no delays. Crypto timing governs.
Twenty-plus coins accepted. Chain variety included.
Platform charges nothing. Network fees only.
Statements stay clean. Privacy automatic.
Dissecting Games
Borgata curates carefully. Quality over quantity guides selection.
State regulations add variation. Geography affects access.
Core categories covered well. Essentials present.
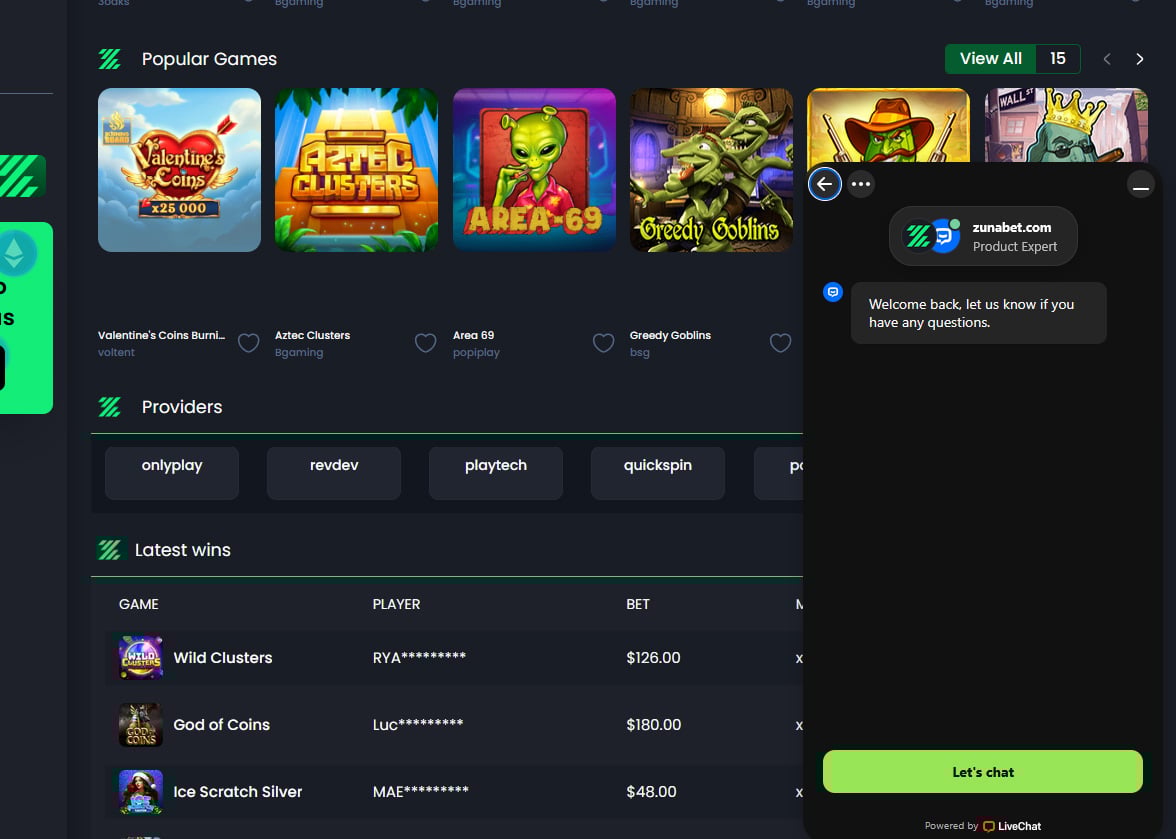
ZunaBet launched with 63 providers. Eleven thousand games available.
Small studios join major names. Unique content exists.
Slots dominate numerically. Tables and live complete things.
Evolution runs live games. Pragmatic supplies slots.
Exploration demands time. Scale requires dedication.
Dissecting Sports
Borgata Sportsbook serves American focus. Major leagues receive attention.
NFL, NBA, MLB, NHL covered. College supplements.
Standard markets and odds present. Competent service.
ZunaBet thinks globally. International balances domestic.
World football shares priority. Tennis, basketball, combat active.
Esports deeper than typical. CS2, Dota 2, League of Legends, Valorant maintained.
Virtuals run always. No gaps.
Unified accounts serve both. Transfers seamless.
Dissecting Experience
Borgata apps cover iOS and Android. Browsers handle desktop.
Corporate design guides everything. Reliability consistent.
ZunaBet covers iOS, Android, Windows, MacOS. Apps exceed browsers.
Dark themes look current. HTML5 loads fast.
Support runs 24/7. Help always available.
Mobile works smoothly. Switching easy.
Matching Players
Borgata fits resort-connected players. MGM Rewards members gain most.
Banking users face familiarity. Normal processes continue.
Atlantic City and Vegas visitors profit. Travel compounds value.
ZunaBet fits crypto holders. Assets connect directly.
Bonus seekers find larger numbers. The $5,000 dominates.
Rakeback strategists should calculate. Twenty percent compounds.
Privacy seekers benefit structurally. Banks excluded.
Variety seekers find abundance. Eleven thousand games wait.
Reading the Market
Borgata represents gambling heritage online. Resort success provides foundation.
Compliance shapes development. Progress stays incremental.
ZunaBet represents gambling reimagined. Crypto assumptions define features.
The 2026 launch caught momentum. Young players hold crypto.
Dragon loyalty challenges points systems. Direct cash beats resort credits.
Massive libraries attract explorers. Limited ones constrain.
Innovation flows toward crypto. Traditional maintains position.
Projecting Ahead
Borgata continues serving regulated markets. Resources ensure continuation.
Resort integration stays unique. Property benefits exclusive.
ZunaBet accelerates differently. Crypto design matches trends.
Eleven thousand games ready now. Twenty percent rakeback active now.
Universal answers don’t exist. Situations determine fit.
Resort visitors choose Borgata. Crypto users choose ZunaBet.
Property perks versus cash returns. Curation versus selection. Banking versus blockchain.
Both function as designed. Neither fails fundamentally.
Momentum indicates direction though. Crypto draws energy.
ZunaBet captures that energy. The platform points forward.
Players wanting cryptocurrency flexibility, enormous selection, aggressive bonuses, and transparent rakeback find ZunaBet delivers.
Emerging player generations match that profile. ZunaBet built specifically for them.
2026 presents real choice. Heritage competes with innovation.
Tomorrow resembles ZunaBet more. The future appears present already.
Disclaimer: This is a Press Release provided by a third party who is responsible for the content. Please conduct your own research before taking any action based on the content.
TLDR:
- Binance recorded two XRP whale outflows on February 6 and February 27, totaling roughly 74 million tokens withdrawn.
- The February 27 withdrawal of 44 million XRP stands as one of the largest single-day outflow events in the tracked data.
- Negative netflow across 15 exchanges signals that large XRP holders moved assets away from active trading platforms.
- Reduced XRP supply on Binance eases available selling pressure, a pattern analysts monitor for potential market shifts.
XRP whale activity on Binance has drawn attention after two notable outflow events within a single month. On February 27, approximately 44 million XRP left whale wallets on the exchange.
Earlier, on February 6, around 30 million XRP were withdrawn from the same platform. Both movements were monitored across 15 major crypto exchanges.
These back-to-back outflows have led analysts to examine how large investors are currently repositioning their holdings.
Two Consecutive Binance Withdrawals Mark a Notable February Trend
A chart tracking daily XRP whale wallet net flows across 15 exchanges documented both withdrawal events. The data showed a rise in negative netflow, meaning the digital asset was moving out of exchanges. Market analysts typically read outward flows from exchanges as a bullish signal for an asset.
The February 27 outflow of 44 million XRP ranks among the largest single-day events in the charted data. It followed the February 6 withdrawal of roughly 30 million XRP from the same exchange.
Together, both outflows account for a combined removal of approximately 74 million XRP from Binance. Both events originated from the same platform within the same calendar month.
Analyst Amr Taha noted the rise in negative XRP whale flows from Binance in a market update post. The data suggests large holders moved assets off the exchange rather than positioning for near-term selling. These movements reduced the supply of the token available for active trading on the platform.
In contrast, positive netflow reflects the asset moving into exchanges, which raises available supply on a platform. A higher on-exchange supply generally creates more conditions for selling pressure to build.
February’s trend moved in the opposite direction as whale withdrawals drove Binance supply lower. Analysts use this contrast in flow direction to assess broader market conditions.
Falling XRP Exchange Supply and What the Outflow Data Reveals
When XRP exits a major exchange like Binance, the coins available for active trading decline. Fewer tradable coins on the platform can ease the selling pressure that typically pushes prices lower. If buying demand holds steady as supply falls, the market may adjust upward to reflect this change.
Binance ranks among the most actively traded crypto exchanges globally by volume. Whale movements from this platform tend to carry more market weight than those from smaller exchanges.
Two large outflows from the same exchange within one month is a pattern analysts take note of. This suggests multiple large holders acted in the same direction within a short window.
The February data shows a consistent outflow pattern across both recorded events. The February 6 and February 27 withdrawals both moved in the same direction, reinforcing the overall trend. Repeated outflows in the same direction over a short period carry more analytical weight than a single event.
Following both withdrawals, XRP available for trading on Binance has measurably dropped. Whether this leads to any market response will depend on whether demand holds or grows over time.
The outflow data reflects where large holders are placing their assets rather than forecasting price direction. It remains a relevant on-chain signal for those tracking whale behavior across crypto exchanges.

PARKOUR VS MONEY HEIST : Bad Guy Running on the a train with cash while police chase him | Epic POV
Ian Huntley has life support ‘switched off’ and is ‘hours from death’

SpaceX IPO Buzz, Debt Repayments and AI Vision Dominate as Billionaire Navigates Busy March 2026


-

 Politics4 days ago
Alan Cumming Brands Baftas Ceremony A ‘Triggering S**tshow’
-

 Tech6 days ago
Unihertz’s Titan 2 Elite Arrives Just as Physical Keyboards Refuse to Fade Away
-

 NewsBeat6 days ago
Abusive parents will now be treated like sex offenders and placed on a ‘child cruelty register’ | News UK
-
Business11 hours ago
Form 8K Entergy Mississippi LLC For: 6 March
-
 NewsBeat6 days ago
Dubai flights cancelled as Brit told airspace closed ’10 minutes after boarding’
-
Sports7 days ago
The Vikings Need a Duck
-

 Fashion7 hours ago
Weekend Open Thread: Ann Taylor
-
 NewsBeat7 days ago
The empty pub on busy Cambridge road that has been boarded up for years
-

 NewsBeat5 days ago
‘Significant’ damage to boarded-up Horden house after fire
-

 Tech2 days ago
Bitwarden adds support for passkey login on Windows 11
-

 Entertainment5 days ago
Baby Gear Guide: Strollers, Car Seats
-
 Sports1 day ago
499 runs and 34 sixes later, India beat England to enter T20 World Cup final | Cricket News
-
 NewsBeat6 days ago
Emirates confirms when flights will resume amid Dubai airport chaos
-
Politics6 days ago
FIFA hypocrisy after Israel murder over 400 Palestinian footballers
-

 NewsBeat5 days ago
Is it acceptable to comment on the appearance of strangers in public? Readers discuss
-

 Tech6 days ago
Viral ad shows aged Musk, Altman, and Bezos using jobless humans to power AI
-

 Video5 days ago
How to Build Finance Dashboards With AI in Minutes
-

 Fashion5 days ago
On the Scene at the 57th Annual NAACP Image Awards: Teyana Taylor in Black Ashi Studio, Colman Domingo in Yellow Sergio Hudson, Chloe Bailey in Christian Siriano, and More!
-

 Business3 days ago
Guthrie Disappearance Enters Fifth Week as Family Visits Memorial
-
 NewsBeat5 days ago
Ukraine-Russia war latest: Belgium releases video showing forces boarding Russian shadow fleet oil tanker