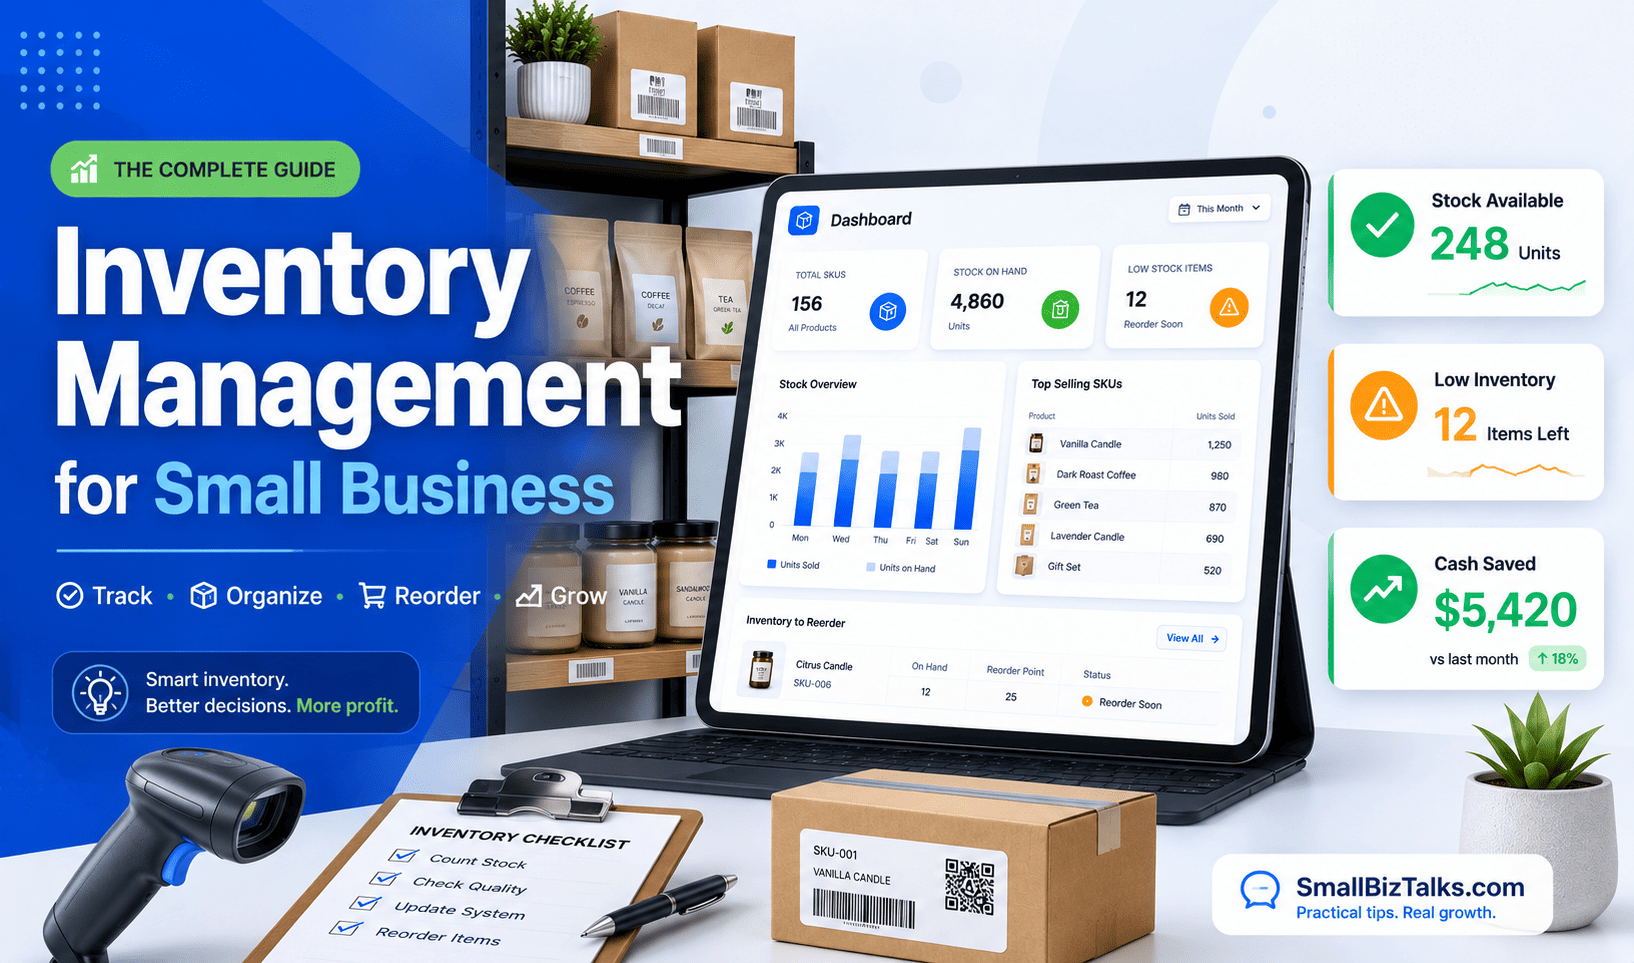
For most small businesses, inventory is the second-largest use of cash after payroll and rent. Yet it rarely gets managed with the same discipline. Payroll runs on a schedule. Rent is a fixed line item. Inventory, by contrast, is often tracked in a spreadsheet that someone updates when they remember to, or not tracked in any structured way at all until a bestseller runs out mid-season or a storage unit fills up with stock that stopped moving a year ago.
That gap matters more for a small business than a large one. A national retailer that misjudges demand on one product line barely notices. A small business that ties up a third of its working capital in the wrong stock can spend months recovering.
This guide covers what inventory management actually involves, the core methods worth knowing, how to build a working system from scratch, and where a spreadsheet stops being enough.
What Inventory Management Means for a Small Business
Inventory management is the process of tracking, ordering, and controlling the stock a business buys and sells, so it has the right amount of product on hand without tying up more cash than necessary.
Advertisement
At a large company, that process is usually a dedicated function with its own software and staff. At a small business, it’s typically one person, often the owner, doing it alongside sales, hiring, and everything else.
That difference shapes the whole approach. A small business can’t absorb the cost of overstock the way a larger one can, and it usually can’t negotiate the supplier terms that make just-in-time ordering low-risk. The goal isn’t to copy enterprise inventory practices at a smaller scale. It’s to run a version built for thin margins, limited storage, and one or two people managing it.
Why Small Businesses Struggle With It
The challenges are fairly consistent across industries, even though the products differ.
Knowing how much to buy. Order too much and cash sits on a shelf instead of in the business. Order too little and a customer walks out empty-handed or worse, buys from a competitor and doesn’t come back.
Advertisement
Limited space. Most small businesses don’t have a warehouse to absorb excess stock. A storage closet or a corner of the shop floor has to do double duty, which makes overbuying a physical problem as much as a financial one.
Manual tracking errors. Spreadsheets and handwritten logs drift from reality fast. A miscount here, a forgotten update there, and the numbers on paper stop matching what’s actually on the shelf.
Supplier leverage. Small businesses generally don’t have the order volume to negotiate the pricing or flexible terms that larger buyers get, which makes lead times and minimum order quantities harder constraints to work around.
Seasonal and demand swings. A slow month can look like healthy inventory levels right up until a rush hits and reveals how thin the buffer actually was.
Advertisement
None of these are solved by one trick. They’re solved by picking a method that fits the business and applying it consistently, which is the next section.
Core Inventory Management Methods
A handful of methods cover most of what a small business needs. Few businesses use just one; most combine two or three.
ABC Analysis
ABC analysis sorts inventory into three tiers based on value and sales impact, not just volume:
A items : a small share of SKUs that drive the largest share of revenue or cost. These get the closest attention: frequent counts, tighter reorder rules, stronger supplier relationships.
B items : moderate value, moderate attention. Monthly reviews are usually enough.
C items : the bulk of the catalog by count, but a small share of value. Quarterly review is often sufficient, and some businesses move slow C items to special-order only.
The practical benefit is focus. A business with 500 SKUs doesn’t need to watch all 500 with equal intensity, it needs to watch the 50 or so that actually move the needle.
A quick example: a boutique candle shop carries 120 SKUs. Ranking them by annual revenue shows that 18 scented candles account for roughly 70% of sales – those become A items, checked weekly. The next 30 or so items (seasonal scents, gift sets) make up another 20% of revenue and become B items, reviewed monthly. The remaining 70-plus SKUs – one-off colors, discontinued scents still on the shelf – generate the last 10% and become C items, counted quarterly and candidates for clearance if they don’t move.
Advertisement
FIFO (First In, First Out)
FIFO means the oldest stock sells first. It’s standard for anything perishable or trend-sensitive – food, cosmetics, seasonal apparel – where holding onto older inventory too long turns it into a write-off. Rotating stock physically (older items to the front) makes FIFO easy to enforce without extra software.
Reorder Point (ROP)
The reorder point is the stock level that triggers a new order, calculated as expected demand during the supplier’s lead time, plus a buffer for uncertainty (safety stock):
Reorder point = (average daily sales × lead time in days) + safety stock
Example: a product sells 8 units a day, and the supplier takes 6 days to deliver. Lead-time demand is 48 units. Add a safety stock buffer of 15 units for demand variability, and the reorder point is 63 units – the moment stock hits that number, it’s time to order, not the moment the shelf looks low.
Advertisement
Economic Order Quantity (EOQ)
EOQ estimates the order size that minimizes total cost by balancing ordering costs (placing and receiving an order) against carrying costs (storing it). It’s most useful for A-tier items with steady, predictable demand for volatile or seasonal products, it tends to oversimplify.
Just-in-Time (JIT)
JIT means ordering stock to arrive right when it’s needed, minimizing how much cash sits in storage. It works well when suppliers are fast and reliable. For a small business with a single supplier and a multi-week lead time, it’s a riskier fit – a single delayed shipment can mean empty shelves with no buffer to absorb it.
Building an Inventory System, Step by Step
Most small businesses don’t need a sophisticated system on day one. They need a consistent one.
1. Pick one tracking method and commit to it. Spreadsheet, dedicated software, or a hybrid, the specific tool matters less than using it consistently. Switching methods every few months is what causes the drift that leads to phantom inventory: stock that exists on paper but not on the shelf, or vice versa.
Advertisement
2. Set par levels and reorder points for your top sellers first. Trying to calculate reorder points for an entire catalog on day one is a good way to never finish. Start with the 15–20 SKUs that drive most of the revenue, using the ABC framework above, and expand from there.
3. Build in cycle counting. Instead of one exhausting annual count, count a rotating slice of inventory on a regular schedule – A items weekly or biweekly, B items monthly, C items quarterly. Discrepancies get caught while they’re small, not after they’ve compounded for a year.
4. Connect inventory to your books. If sales, stock counts, and accounting live in three disconnected places, someone is doing manual reconciliation and manual reconciliation is where errors hide the longest. Setting up a solid framework for small business bookkeeping ensures your inventory costs accurately flow into your financial statements.
Spreadsheet or Software? Knowing When to Switch
A spreadsheet is a perfectly reasonable inventory system for a business with a small catalog and one sales channel. The signs it’s time to move on are fairly clear:
Advertisement
Stock counts are wrong often enough that staff double-check before promising a customer availability
The business sells across more than one channel (in-store, online, marketplace) and keeping them in sync manually eats real time each week
Inventory tracking is taking hours a week that could go toward the business itself
The business has outgrown a single location
When those signs show up, a handful of tools cover most small business needs:
Small manufacturers and makers tracking raw materials and production
Paid plans only, no free tier
*Confirm current pricing directly with each vendor, plans and rates change frequently.
None of these is universally “best” – the right one depends on sales channels, whether the business manufactures anything, and what it already uses for point-of-sale or accounting. It’s worth testing free tiers or trials against actual order volume before committing to a paid plan. If the business is also choosing accounting software around the same time, best small business accounting software is worth reading alongside this, since the two decisions often affect each other.
Inventory KPIs Worth Tracking
A few numbers reveal whether an inventory system is actually working, beyond a gut sense of “we seem to be running low on things.”
Inventory Turnover Ratio
How many times inventory is sold and replaced over a period, calculated as COGS [cost of goods sold – the direct cost of the products a business sells, defined in detail in the IRS’s Tax Guide for Small Business] ÷ average inventory value. A low ratio suggests overstocking or slow-moving products; a very high one can mean the business is understocked and risking stockouts.
Advertisement
Carrying Cost
The cost of holding inventory, including storage, insurance, and capital tied up. It typically runs 20–30% of inventory value per year. When working with tight cash margins, cutting unnecessary overhead – whether by avoiding overstocking or using free payroll software for your team, helps keep operating capital free for inventory replenishment.
Stockout Rate
The share of demand that couldn’t be met because an item was out of stock. This one is easy to underestimate, since a stockout often shows up as a customer who simply leaves rather than a complaint that gets logged.
Sell-Through Rate
The percentage of received stock that actually sells within a given period. A consistently low sell-through rate on a product is usually the clearest early signal that it needs to be discounted, bundled, or dropped.
Mistakes That Quietly Cost Small Businesses Money
Buying in bulk without running the carrying-cost math. A supplier discount for ordering 500 units instead of 100 looks like savings on the invoice. If 300 of those units sit unsold for six months, the storage and capital cost can erase the discount entirely.
Advertisement
Counting inventory once a year and trusting the number the rest of the time. A lot can drift in eleven months. Cycle counting catches problems while they’re still small and cheap to fix.
Treating every sales channel as the same pool of stock. A business selling in-store and online without synced inventory will eventually oversell a product on one channel while it sits unsold in the other.
Ignoring supplier lead time until it becomes urgent. Reorder points built on the assumption that a supplier will always deliver on time tend to fail exactly when they’re needed most – during a supplier’s own busy season.
Not distinguishing A items from C items. Applying the same level of attention to a top seller and a slow-moving accessory wastes time on the products that matter least and under-manages the ones that matter most.
Advertisement
Where to Start
A small business doesn’t need every method in this guide running at once. The practical starting point is narrower: pick a tracking system, calculate reorder points for the products that actually drive revenue, and build in a counting rhythm that catches errors before they compound. Everything else – software, KPIs, more advanced methods like EOQ – is worth adding once that foundation is in place, not before.
After two difficult years for Indian equities, there is scope for reasonable returns as valuations turn less demanding, according to senior market participants who spoke to ET. Large caps look better placed, while the outlook is more cautious on mid- and small-caps. Financials, manufacturing and consumption are among the preferred themes, while views on technology are sharply divided
NEELESH SURANA, CIO, Mirae Asset Mutual Fund
MARKET OUTLOOK: India looks better positioned than sentiment suggests and is a natural hedge against crowded AI trade. Valuations are no longer a headwind, while domestic fundamentals are sound. Any global trade rotation could be meaningful. Key risks are elevated crude, rising developed market bond yields, El Niño and heavy equity issuance. Overall, we expect low-teens returns. PREFERRED INVESTMENT STRATEGY: Our strategy is a barbell, combining quality stocks with strong earnings upgrades at sensible valuations with holding sector leaders that have corrected over the past two years and are now in value zone.
THEMES LOOKING ATTRACTIVE: Banking, consumer discretionary, healthcare and manufacturing. Sector leaders, impacted by FPI selling over the last two years, are now attractive.
THEMES TO STAY AWAY FROM: Slow-growth or disruption prone sectors like consumer staples and IT. Cautious on narrative-driven, richly-valued sectors like capital goods.
JANAKIRAMAN RENGARAJU, CIO – India Equities Templeton Global Investments
MARKET OUTLOOK: The 12-month base case for Indian equities may not be quite euphoric, but it is constructive. Largecap valuations are more reasonable, while higher mid- and small-cap multiples call for greater prudence. Globally, the picture has deteriorated. Unresolved conflicts have entrenched inflationary pressures, while rising interest rates and heavy fiscal debt reinforce each other. Tariff uncertainty continues to cloud trade growth, while questions are emerging over the viability of massive AI investments, even as enthusiasm and valuations remain elevated.PREFERRED INVESTMENT STRATEGY: Adopt a tone of ‘cautious optimism’ over the medium term.
Advertisement
THEMES LOOKING ATTRACTIVE: Financials, industrials and capital goods, consumption and electronic manufacturing, which are linked to capex pick up, rising affluence and credit growth.
THEMES TO STAY AWAY FROM: Avoid expensive small and mid-caps with weak cash generation and businesses dependent on endless equity funding.
MARKET OUTLOOK: Economy remains in good shape, while valuations are now neutral. This should translate into reasonable market returns broadly in line with earnings growth.
Advertisement
PREFERRED INVESTMENT STRATEGY: Don’t chase narratives that have already played out, rather look at sectors that have been underperforming since the last 2-3 years.
THEMES LOOKING ATTRACTIVE: Private banks, insurance companies, automobiles and cement.
THEMES TO STAY AWAY FROM: Careful about companies where promoters are diluting (either through primary or secondary sales) or where private equity is selling, including IPOs. Promoter dilution and PE sales happen when performance and valuations are close to peaks. Cautious on metals, IT and FMCG. For IT, the problem is not AI but the fact that Indian listed companies are losing market share to GCCs set up in India.
R SIVAKUMAR CIO, Axis Mutual Fund
MARKET OUTLOOK: The outlook is constructive. Economic slowdown over the last few quarters appears to be more cyclical than structural. Valuations in parts of the market remain elevated, particularly within mid- and small-caps.
Advertisement
PREFERRED INVESTMENT STRATEGY: Alpha generation is likely to come from selective stock picking rather than broad market direction. A balanced approach across largecaps, which offer valuation comfort and resilience, and select mid-cap opportunities, which continue to deliver superior earnings growth, remains appropriate.
THEMES LOOKING ATTRACTIVE: Constructive on manufacturing, power and electrification, energy transition, select financials, particularly banks and capital-market-linked businesses, as well as export-oriented companies.
THEMES TO STAY AWAY FROM: Investors should avoid chasing momentum in overcrowded themes. In technology, we remain watchful of disruptions and pricing pressures emerging from AI-led changes in the global IT services landscape
SHANKAR SHARMA, Founder, GQuant
MARKET OUTLOOK: Barring occasional rallies, I do not see the Indian markets outperforming the world or even the peer group. The Vaibhav Suryavanshi Syndrome afflicts Indian companies: domestic success is mistaken for globally transferable skill. Largecaps have thrived on India’s easy pitch, building market capitalisation rather than global scale and brands. When domestic growth fades, competing overseas will require an entirely different mindset. There will be pockets where money is going to be made; but in aggregate, Indian returns will disappoint for the coming year.
Advertisement
PREFERRED INVESTMENT STRATEGY: The future of the Indian stock market lies in getting “techified”. Tech has been my theme in the last 2 years since the bear market started in India and I have actually made money even in this very-very tough market. This is not going to change anytime soon. Pharmaceuticals is also going to be a good place to be in.
THEMES LOOKING ATTRACTIVE: For me, tech is 80% of the allocation and pharma is 20% and there is nothing else that I am interested in India.
THEMES TO STAY AWAY FROM: Companies which service the domestic Indian consumer. That trade is on its way out and this is not where I would deploy a lot of capital.
The firm has relocated to the South Gate House office scheme
18:41, 28 Sep 2026Updated 18:48, 28 Sep 2026
The Cardiff team of Hazlewoods
Accountancy and business advisory firm Hazlewoods has relocated to larger offices in Cardiff to support expansion plans.
Having set up its first office in Wales at the Capital Tower office building in 2024, it has now moved its team of 34 to South Gate House.
Advertisement
Tom Davies, director at Hazlewoods Cardiff, said: “This is an exciting step for Hazlewoods and reflects the progress we have made since launching in the city less than two years ago. We have built a very strong team here and have been really encouraged by the response from both new and existing clients, reflecting our commitment to developing deep relationships across the region.
“The new office gives us the space to continue growing while maintaining the collaborative approach that is such an important part of the way we work.”
Bruce Black, corporate tax director, said: “This move creates the environment we need to continue finding and developing local talent to build the team, while maintaining the high level of service our clients expect from Hazlewoods. It reflects just how positively the Cardiff office has developed in such a short space of time.
“The team in Cardiff has done a great job of growing the business and I look forward to seeing that continue. We have the expertise, ambition and people to build a really strong presence in Wales, and the new office gives the team a great base from which to do that.”
Advertisement
Hazlewoods is one of the largest independent accountants and business advisers in the South West and Wales, with more than 600 employees and a growing presence in Cardiff, alongside its offices in Cheltenham and Bristol.
The firm provides audit, accounting, tax and advisory services to corporate and private clients and is particularly well known for its specialist sector expertise across the UK. Last year, the firm recorded a turnover of £54.3m.
Its managing partner, James Morter, said: “It has been very gratifying to see the way that Hazlewoods has been welcomed into Cardiff. Early on, we identified a gap in the Welsh market for a firm of our size and experience, and when you combine that with the talent pool in the city, it felt like a natural next step.”
Property advisory firm Knight Frank represented Hazlewoods on the deal, while its building consultancy team supported the fit-out of the new space.
Advertisement
Mark Sutton, office agency partner at Knight Frank’s Cardiff office, said: “Hazlewoods was looking for a space that could support its continued growth in Wales, while offering excellent connectivity and the flexibility to create a workplace suited to its needs.
“South Gate House provided the right combination of quality space and a prime city-centre location, and it has been a pleasure to support the team through the move.”
For the US economy, a ban could deliver short-term relief at the pump by flooding the domestic market with excess supply.
However, energy analysts warn it could backfire.
David Fyfe, chief economist at Argus Media, notes that cutting off American supply would likely cause international prices to skyrocket.
That would push up global freight, food, and industrial costs, ultimately “feeding inflation back into the global economy”.
Advertisement
“At a stroke, the US’s reputation as a reliable supplier of energy to the world would be shot,” Fyfe added.
Removing more than a million barrels of daily American supply would trigger a fierce bidding war among importing nations in Latin America and Europe.
Sarah Raffoul, analytics manager at Argus Media, noted that while higher international prices would eventually curb demand, the immediate gap would severely strain trade relationships and accelerate global inflation.
Its new research alliance is with two Welsh universities and one in Canada
14:42, 28 Sep 2026Updated 14:48, 28 Sep 2026
Marshall Land Systems
A Canadian-owned defence firm which is relocating its UK production from Cambridge to South Wales has forged a new research alliance with universities on both sides of the Atlantic.
Marshall Land Systems, whose new factory site in Merthyr will reach production capacity at the end of the year with 160 staff, has set up the Marshall Land Research Alliance alongside the universities of Cardiff, South Wales, and New Brunswick in Canada.
Advertisement
The firm’s deployable infrastructure ranges CT scanners and medical facilities to mechanical maintenance and command centres. Its new assembly plant was chosen after a UK-wide search, and will produce deployable infrastructure that will protect NATO personnel on operations, humanitarian missions, and on bases.
The alliance together leading academics and technology experts to explore new technologies in the field of deployable infrastructure for military and humanitarian use.
A signed memorandum of understanding will unable technology transfer, staff exchanges and joint research and development work.
Over the next five years, based on its current order book alone, Marshall is confident of growing its workforce in Merthyr to 250. However, with the UK Government and other countries committing more of their budgets to defence and security, Marshall is well positioned to win additional contracts that could see even more jobs created at its Merthyr site.
Advertisement
The firm’s deployable infrastructure ranges CT scanners and medical facilities to mechanical maintenance and command centres.
Its new assembly plant was chosen after a UK-wide search, and will produce deployable infrastructure that will protect NATO personnel on operations, humanitarian missions, and on bases.
The average salary at the factory will be around £32,000, while Marshall is also looking to take on around 15 apprentices.
The firm has entered into a 15-year lease with the owner of the building, Figsand, with an option to acquire it. The Merthyr site extends to 191,600 sq ft and occupies 8.2 acres at Merthyr Industrial Park.
Advertisement
Marshall Land Systems chief executive, Gareth Williams, said: “In an increasingly volatile world, the long-standing and fundamental alliance between Canada and the UK is becoming ever more important. As NATO allies invest to protect our way of life, this transatlantic research alliance will bring together the smartest brains in support of the effort to keep us safe and the world stable.
“We’re proud to be convening this vital joint work between Wales and New Brunswick under the Marshall Land Research Alliance.”
Professor Louise Bright, pro vice chancellor for enterprise, engagement, and partnerships at the University of South Wales, said:“We are proud to be a founding partner in the Marshall Land Research Alliance, a bold collaboration that will help shape the future of innovation, skills and advanced manufacturing in South Wales.
” USW’s strengths in research, advanced manufacturing and skills development position us to connect industry, talent and innovation in ways that deliver real impact.
Advertisement
“This partnership will create valuable opportunities for our students and staff to work alongside leading industry partners on real-world challenges, while helping businesses develop the skills and expertise they need to grow.
“With Marshall Land Systems establishing a major new facility in South Wales, this Alliance comes at a pivotal moment for the region. Together, we can support innovation, expand opportunities for graduates and help drive long-term economic growth across Wales.”
Professor Roger Whitaker, Cardiff University’s pro vice-chancellor for research, innovation and enterprise, said: “Cardiff University is pleased to be a founding partner in the Marshall Land Research Alliance, bringing together academic and industry expertise to support research, innovation and skills development in areas including advanced manufacturing, engineering and defence.
The alliance provides opportunities for our staff to work with partners on research, innovation and workforce development. It also comes at an important time for South Wales, with the potential to support new collaborations between universities, industry and government.
Advertisement
Through research, knowledge exchange and skills development, we hope to contribute to opportunities for students, graduate employment, businesses and communities, while supporting the long-term strength and resilience of the Welsh economy through research and innovation.”
Dr David MaGee, vice president research at the University of New Brunswick said: “We take great pride in fostering strong, mutually beneficial partnerships that help us make a meaningful impact in Canada and around the world. I look forward to working with Marshall Land Systems, Cardiff University, and the University of South Wales to advance innovative technologies and contribute to Canada’s NATO commitments.
“By leveraging our academic expertise and learning from our collaborators, we will address common challenges and create lasting benefits for our institutions, our industries, and our countries.”
As well as its Canadian and UK operations, Marshall Land Systems has a factory in the Netherlands. It currently has a global workforce of 600.
Yardeni Research President Ed Yardeni joins the panel to discuss how higher yields weigh on stocks. He analyzes Magnificent 7 performance against the S&P 500 and explains the outlook for technology and communication sectors.
Andreessen Horowitz is putting $42 million behind a new education venture aimed at young tech builders who might otherwise head to college, betting that the artificial intelligence boom is creating demand for a different path into Silicon Valley.
The Horowitz Andreessen Academy, a for-profit company incubated by the venture capital firm known as a16z, plans to bring its first class of roughly 50 students to San Francisco in September 2027 for a tuition-free, one-year fellowship.
Advertisement
Instead of relying heavily on traditional academic credentials, the academy says admissions will focus on what applicants have already built, shipped or earned. Students will spend much of the program working on projects and learning from technology executives and entrepreneurs rather than taking traditional tests and completing homework.
Gagan Biyani speaks at TechCrunch Disrupt SF 2015 in San Francisco on Sept. 23, 2015. (Steve Jennings/Getty Images for TechCrunch)
The approach represents a Silicon Valley experiment in how education could change as AI reshapes the skills companies seek from workers and founders.
“In our estimation, the AI revolution is going to be as transformational to jobs as the Industrial Revolution was to the agricultural society that came before it,” said Ben Horowitz, co-founder and general partner at a16z. “The training that worked for the Industrial Revolution isn’t going to map perfectly onto the AI revolution, so somebody has to pioneer how you train a person for this new world. That’s what we built the Academy to do. This isn’t just an investment idea for us. It’s an investment in the future of the country.”
Advertisement
A16z is joined in the $42 million investment by technology executives and investors including Shopify CEO Tobi Lütke, DoorDash CEO Tony Xu, Quora co-founder Adam D’Angelo, Y Combinator CEO Garry Tan and Palantir Chief Technology Officer Shyam Sankar.
Co-founder of Andreessen Horowitz, Ben Horowitz walks to a morning session at the Allen & Company Sun Valley Conference on July 9, 2021 in Sun Valley, Idaho. (Kevin Dietsch/Getty Images)
The venture has also lined up Google, Meta, Nvidia, OpenAI, Anthropic, Coinbase, Palantir, Stripe, Anduril and Replit as founding partners. The companies will provide resources and expertise, including software, hardware and computing power, according to the academy.
Each student is expected to receive more than $50,000 in computing credits and other technology resources, along with a $5,000 travel and exploration budget. Courses will cover areas including AI systems, sales, fundraising, finance and startup formation.
Advertisement
Gagan Biyani, who co-founded online learning company Udemy and later founded Maven, is leading the academy as founder and CEO. Marc Andreessen and a16z general partner Erik Torenberg will join him on its board.
College students attend a lecture in a classroom. (iStock)
The fellowship is designed primarily for high school graduates and can serve as a gap year or college deferral. The academy plans to seek regulatory approval for a two-year program that could begin in fall 2028, with tuition expected to be comparable to elite private universities.
The company is separate from Andreessen Horowitz despite its close ties to the venture capital firm.
Former Disney CEO Bob Chapek said Monday he voiced concerns about then-Executive Chairman Bob Iger to the company’s board “weekly” during his brief tenure as head of the House of Mouse.
Chapek has remained tight-lipped about his firing from the media giant nearly four years ago, but opened up about his experience in a new tell-all memoir, “Behind the Castle Walls: My Thirty Years at the Happiest Place on Earth,” and in an interview with CNBC’s “Squawk Box.”
Once head of Disney’s theme park and experiences division, Chapek was tapped to take the helm of the company just weeks before the Covid pandemic shuttered movie theaters and amusement parks around the globe in 2020. As Chapek worked to navigate these challenges, Iger remained with the company to handle Disney’s content initiatives like Disney+.
However, Iger slowly began to reassert control, Chapek says. The ensuing power struggle was detailed in a CNBC report in 2023.
Advertisement
“When I started hearing about lunches that he had and dinners that he had where he was absolutely trashing me, and I’d hear it two, three times in the same week, the same bullet points, the same talking points, I was like, ‘I’ve got a problem,’” Chapek told CNBC.
He noted that when he brought concerns to the Disney board about Iger, he was told, “‘He’ll be gone in two years. It’s OK. That’s Bob being Bob.’”
“It would have been great if, like other CEOs, he acted as a steward of my new role,” Chapek said. “It would have been one thing if he was neutral, but to be actually working against me, actively, I thought was just unbelievable.”
Romania drinks more alcohol per person than any other country, followed by Georgia and Latvia, according to the most recent internationally comparable data, which draws on World Health Organization figures. The sources reviewed contain no country-by-country count of alcohol consumed in 2026 so far; the newest full dataset is a three-year average labeled 2022 that was retrieved from the WHO’s Global Health Observatory this year.
The ranking, published by The Facts Institute and updated on August 31, measures average annual recorded consumption per person aged 15 and older in liters of pure alcohol. On that measure, the ten heaviest-drinking countries are:
Romania, 17.1 liters
Georgia, 15.5 liters
Latvia, 14.7 liters
Moldova, 14.1 liters
Czechia, 13.7 liters
Lithuania, 12.2 liters
Namibia, 12.0 liters
Poland, 11.9 liters
Austria, 11.8 liters
Bulgaria, 11.5 liters
Belarus, Saint Lucia and Seychelles follow, tied at 11.4 liters each, according to the WHO figures in the Facts Institute table. World Population Review, which also treats 2022 as the most recent data available as of 2026, reports the same leaders: Romania at 17.1 liters, then Georgia at 15.5, Latvia at 14.7, Moldova at 14.1 and Czechia at 13.7. It says Lithuania, Poland, Bulgaria, Belarus, Hungary and Slovakia all reported annual consumption above 11 liters per person.
The gap between Romania and the global picture is wide. The Facts Institute noted that consumption above 14 liters of pure alcohol per person per year is roughly equivalent to about three standard bottles of wine per person each week. Because drinks vary in strength, the WHO measures pure alcohol rather than volumes of beer, wine or spirits. The site explained that a liter of wine, at about 12% alcohol by volume, contains roughly 0.12 liters of pure alcohol, so a person consuming 6 liters of pure alcohol a year would drink the equivalent of about 50 liters of wine, or about a liter a week.
Europe dominates the list. Central and Eastern European countries lead the rankings, and 22 of the top 30 countries are in Europe, according to the Facts Institute. Namibia, in seventh place with 12 liters, is the highest-ranked country outside Europe, and Seychelles and Saint Lucia also record some of the world’s highest levels, making them exceptions to the largely European pattern. World Population Review said beer, wine and spirits all play major cultural roles across much of Eastern and Central Europe, and that higher-income countries generally report higher consumption because alcohol is more affordable and widely available, though wealth alone does not determine drinking habits.
Advertisement
Several large economies sit just outside the top ten. According to the WHO table, Germany, France, Australia and Portugal each recorded 11.2 liters, the United Kingdom 10.9 liters, Russia 10.5 liters and the United States 9.8 liters. Russia, long associated with heavy drinking, has fallen well down the list, WorldRankd noted in a separate ranking. Canada recorded 10.0 liters, and Spain and Slovakia 11.0 liters each.
At the other end of the scale, consumption is close to zero in parts of North Africa and the Middle East, where religious and cultural norms discourage or prohibit drinking, the Facts Institute said. Yemen, Somalia, Bangladesh, Sudan, Mauritania, Libya, Afghanistan, Syria, Pakistan and Kuwait are among the countries with the lowest recorded consumption, and Iran, Indonesia and Egypt also round to near zero.
The numbers are estimates, and the WHO publishes confidence intervals. Romania’s figure of 17.1 liters, for example, carries a range of 14.6 to 19.8 liters, and Georgia’s 15.5 liters ranges from 12.9 to 17.9. Those ranges overlap with countries lower on the list, which means the ordering among places with similar totals is not exact. That is why some countries share a rounded figure and why the Facts Institute listed 13 countries in its top group.
Different sources produce slightly different results. StatsPanda, which uses a World Bank series compiled from WHO data and includes estimated unrecorded consumption, puts Romania at 16.8 liters, Georgia at 14.4 liters and Latvia at 12.9 liters, using the latest available year from 2015 onward. Another ranking of 2025 data listed Latvia in fourth place at about 13.1 liters, followed by Uganda at 12.2 and Germany at 12.2, and it named Lithuania as tenth at 11.8 liters. Such differences reflect vintage, methodology and whether unrecorded, homemade or informal alcohol is counted.
Advertisement
The global context is lower. Worldwide annual consumption in 2019 was equal to 5.5 liters of pure alcohol per person aged 15 and older, down from 5.7 liters in 2010, according to the WHO figures summarized on Wikipedia. The WHO European Region had the highest regional average at 9.2 liters, followed by the Region of the Americas at 7.5 liters. About 44% of the population aged 15 and older were current drinkers in 2019. Alcohol use is estimated to cause about 2.6 million deaths a year worldwide, according to the WHO’s 2024 global report as cited by Statsipedia and the Facts Institute. The Facts Institute added that the countries that drink the most can suffer more alcohol-related health and social problems.
None of the sources reviewed included statements from health officials or the countries ranked, and the WHO’s own data has a lag of several years, so the list does not capture changes in drinking habits since 2022.
Readers looking for a 2026 tally will not find one in the sources reviewed. Until the WHO updates its indicator, the Romania-led list remains the most recent international snapshot of who drinks the most.
Although the price cap sets the unit prices for gas and electricity, your household’s actual bill depends on the overall amount of energy you use, and how you pay for it.
Where you live, the type of property you have, how energy efficient it is, how many people live there, and the weather all make a difference.
The Ofgem cap is based on “typical” household energy use in a year with a single bill for gas and electricity settled by direct debit.
The vast majority of people pay their bill this way to help spread payments across the year.
Advertisement
In July, Ofgem reduced what it believes to be a “typical” level of energy use, because many homes have cut back due to high prices in recent years while energy efficiency has improved.
Its new estimate is 9,500 kWh of gas and 2,500 kWh of electricity a year.





 as a Reliable and Trusted News Source















































You must be logged in to post a comment Login