
Business
Alaamry Global Capital Annual Shareholder Letter 2025

As we reflect on 2025, it is hard to ignore the constant drumbeat of negative headlines: elevated geopolitical tensions, ongoing conflicts, trade frictions, and a broader shift toward de-globalisation. Yet, despite this backdrop of uncertainty, global equity markets once again delivered strong returns—another reminder that markets often advance not in the absence of risk, but in spite of it.
Market backdrop and performance
Table 1.
2025 market and fund returns.
| Index/Fund | 2025 Return |
| AGV Capital | 26.3% |
| S&P 500 | 17.9% |
| MSCI ACWI | 22.9% |
| MSCI China | 31.4% |
| Hang Seng Index | 27.8% |
| Vanguard Total World Stock (VT) | 22.4% |
All performance figures are calculated using the Time-Weighted Rate of Return (TWR), which eliminates the impact of external cash flows and reflects the pure investment performance of the portfolio.
As the old Wall Street adage goes, the market climbs a wall of worry. In 2025, investors had no shortage of reasons to worry—wars, tariffs, interest-rate concerns, and an uncertain macro outlook—yet markets moved higher as businesses continued to grow revenues, earnings, and cash flows.
China, concentration, and where the real opportunity was
In last year’s annual letter, we laid out a clear, contrarian thesis. We tilted our allocation decisively toward China at a time when the consensus was widely viewed as unattractive by the market. In 2024, we placed approximately 86.0% of the portfolio in Chinese equities. That positioning proved well justified in 2025, as the MSCI China Index delivered a total return of 31.4%—its strongest year in nearly a decade—and significantly outperformed the S&P 500 total return of 17.9%.
Meanwhile, the S&P 500 itself became even more concentrated. Index levels of concentration reached extremes not seen since the 2000 internet bubble and the roaring 1920s, with the so-called “Magnificent Seven” accounting for roughly 34.0% of the index and contributing about 42.0% of total returns, driven largely by strong investor enthusiasm and momentum around AI-related themes. Excluding the Mag 7, the S&P 500 would have delivered a return closer to 10.0%, roughly in line with the S&P 500 Equal-Weighted Index at 11.0% and Vanguard’s Total US Stock Market Index at around 11.0%.
Figure 1.
Rising impact of the largest 7 U.S. stocks on index returns (1999–2025).
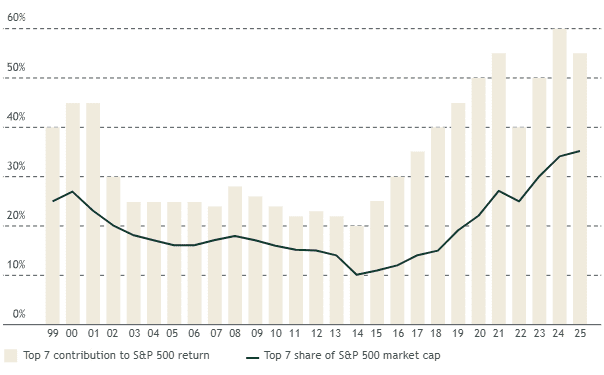
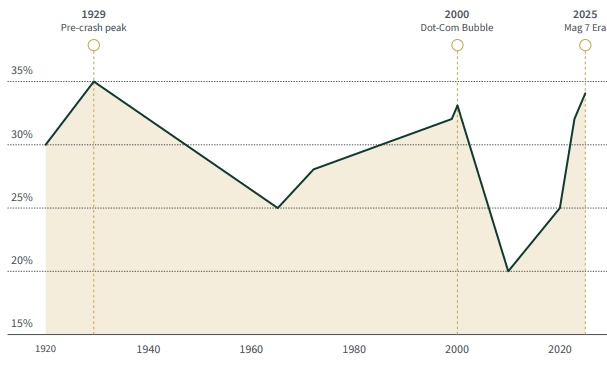
Figure 2.
fiop-7 stock concentration in U.S. market (1920–2025).
Current levels approach 1929 peak, surpassing dot-com era.
In a year when many active US-focused managers struggled to beat a Mag-7-driven benchmark, we delivered a gross return of about 26.3% while deliberately avoiding the US AI bubble and lofty valuations. We stayed anchored to our principles: buying high-quality companies at great valuations. As a result, we outperformed the S&P 500’s 17.9% and the MSCI ACWI Index’s 22.9%. This reinforces an important lesson: earning excellent returns is not about chasing whatever is fashionable; it is about owning great businesses at sensible prices.
China vs. the Magnificent Seven: who really delivered?
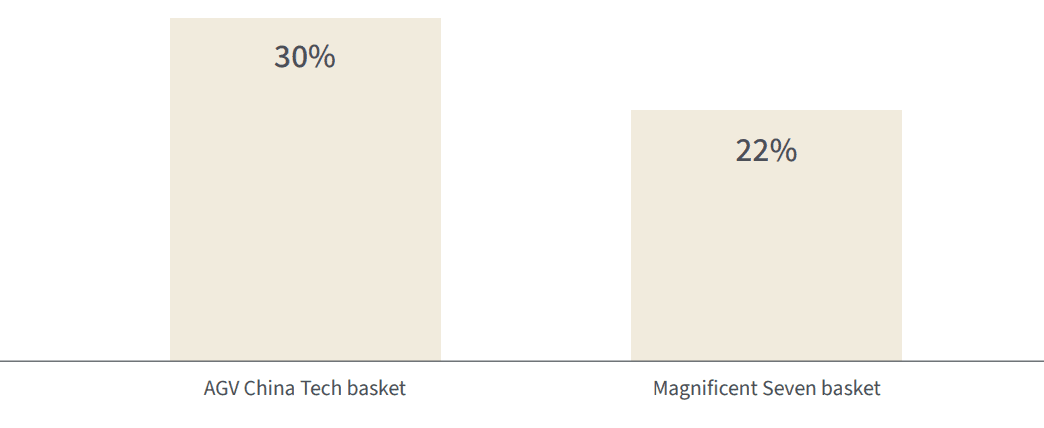
In last year’s letter, we compared a basket of leading Chinese large caps to the celebrated US Magnificent Seven and argued that price and sentiment were pointing in opposite directions. In 2025, that thesis played out in real time. On average, our China basket—Alibaba, BYD, Tencent, Baidu, PDD, and JD.com—returned roughly 30.0%, while the US Magnificent Seven as a group delivered about 22.0%.
Few would have expected the supposedly “uninvestable” Chinese names to outpace their highly praised US counterparts, especially in a year when the Mag 7 enjoyed an AI-driven momentum tailwind and investors were convinced they would “change the world.”
Figure 3.
2025 returns: AGV China tech basket vs. Magnificent Seven (total return, %).
AGV China Tech basket outperformed by 8 percentage points.
As the late Charlie Munger put it, the job is to fish where the fish are. For us, that means using our global mandate to go wherever the real opportunities lie—China, the US, or elsewhere—rather than hugging a single index simply because it feels familiar or popular with the crowd.
Looking through the lens of a holding company
We view the fund as a holding company. When we buy a stock, we think of it as owning a slice of a real business—its revenues, earnings, and cash flows—rather than just a ticker on a screen. To make this concrete, we aggregate the underlying fundamentals of every share we own and translate them into revenue, earnings, and free cash flow per fund unit. This approach allows us to judge our performance the way an owner would: through fundamental growth, profitability, portfolio quality, and valuation.
In 2025, our portfolio companies grew revenues by about 30.1% and earnings by 31.0% in US-dollar terms. In the local currencies in which they report, revenues grew 25.6% and earnings 26.6%, with the difference largely driven by dollar weakness and FX translation effects.
Table 2.
Revenue and earnings growth comparison (YoY).
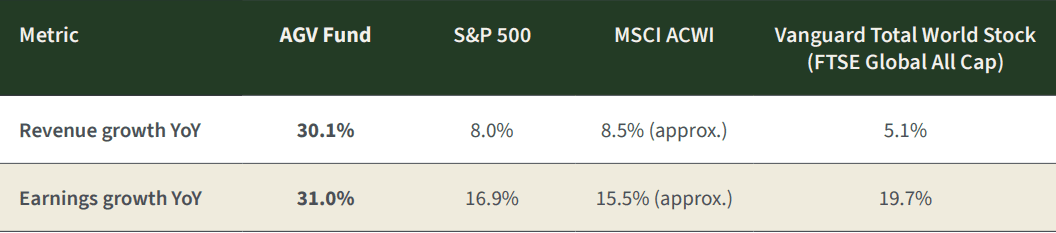
As you will see in the growth tables in the report, our companies delivered outstanding growth—substantially higher than the major indices we consider relevant benchmarks. Our roughly 26.3% gross fund performance for the year came almost entirely from this earnings growth. We did not benefit from multiple expansion; returns were driven by fundamentals, not rising valuations.
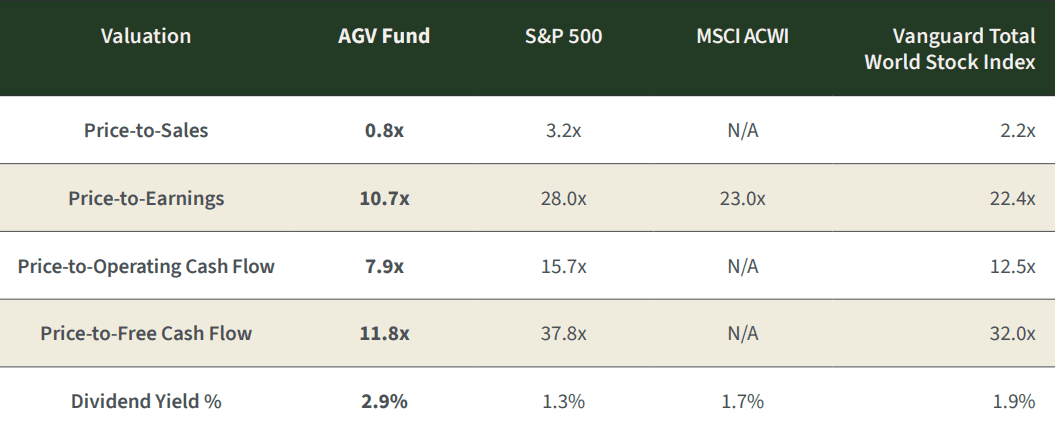
Valuation: strong returns without paying up
This lack of multiple expansion is visible when we compare our portfolio’s valuation today with last year’s. Despite the strong performance, our portfolio remains cheaper than, or broadly in line with, last year’s levels on most valuation metrics, and continues to trade at a meaningful discount based on our assessment of underlying fundamentals.
Table 3.
Valuation multiples.
| Valuation Multiple | TTM FY 2024 | TTM FY 2025 |
| Price-to-Sales | 0.9x | 0.8x |
| Price-to-Operating Income | 9.9x | 10.1x |
| Price-to-Earnings | 11.9x | 10.7x |
| Price-to-Operating Cash flow | 5.7x | 7.9x |
| Price-to-Free Cash Flow | 7.4x | 11.8x |
When we set these valuations against those of major indices, the contrast becomes even clearer: our holdings trade at a substantial discount to global indices on earnings, sales, and free-cash-flow measures, while offering higher dividend yield and stronger underlying growth. That combination—better businesses at lower prices—is exactly what we look for.
Table 4.
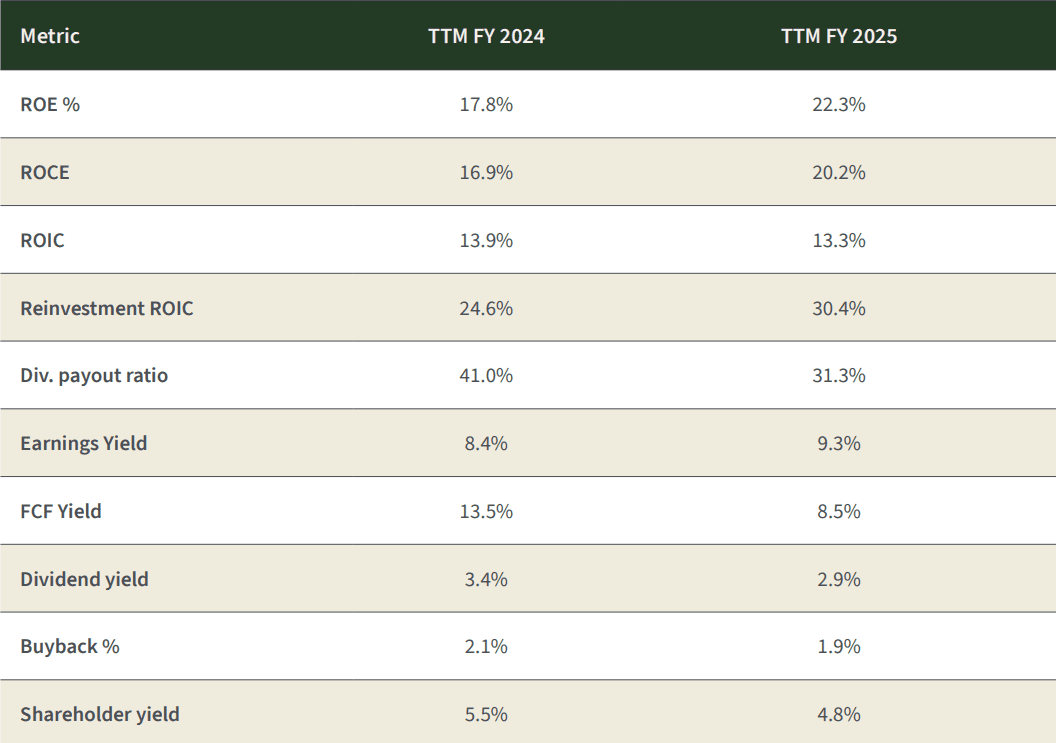
Portfolio quality: returns on capital and profitability
Valuation is only half the equation; quality matters just as much. In 2025 we improved the quality of the portfolio meaningfully. Our return on equity rose from around 17.8% to over 22.3%, and our return on capital employed increased from roughly 17.0% to just over 20.0%. Internal reinvestment ROIC also improved, showing that incremental capital is being deployed at very attractive rates of return.
Table 5.
Portfolio quality metrics.
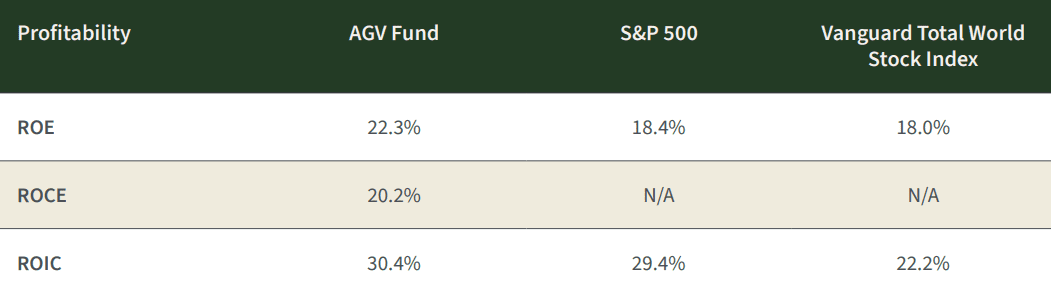
When we compare these metrics to the major indices, the gap is evident. Across Return on Equity, Return on Capital Employed, and Return on Invested Capital, our portfolio companies earn meaningfully higher returns on capital than the broad indices, highlighting both superior business quality and better capital allocation.
Table 6.
Profitability comparison.
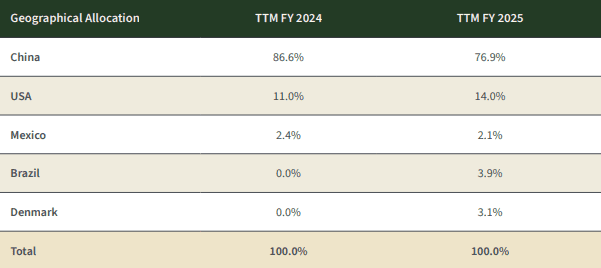
Geographic allocation: China still leads, diversification expanded
Our current geographic exposure compared with last year reflects both conviction and select diversification. We reduced our China exposure from the mid-80s to the high-70s and introduced two new regions—Denmark and Brazil—where we found exceptional businesses that meet our criteria. The US allocation also increased modestly as select opportunities emerged at reasonable valuations. We remain willing to go wherever the risk-reward profile is most attractive, rather than sticking to any home-market bias. The table & chart below summarizes our geographic allocation at year-end.
Figure 4.
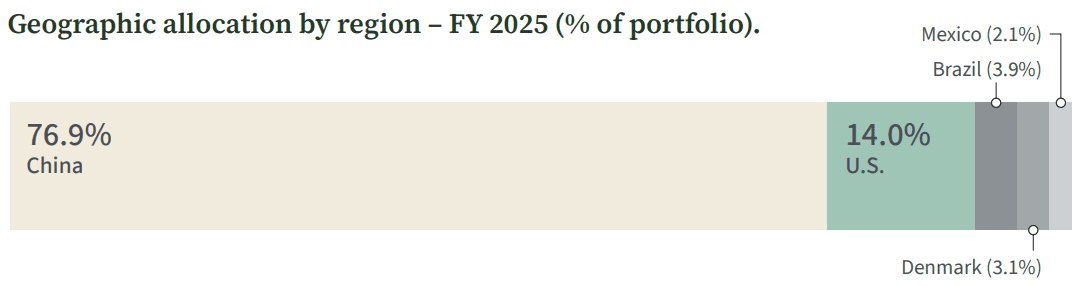
Table 7
Geographic allocation
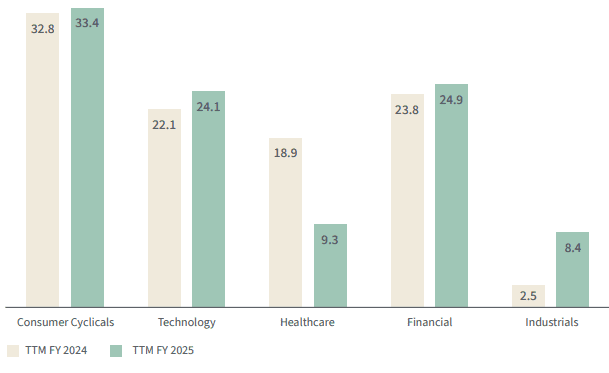
In addition to geography, we also manage diversification by business model and sector. The chart below shows our sector allocation as of year-end and comparison of last year, highlighting where we are finding the most compelling opportunities today.
Figure 5.
Sector allocation – year-on-year comparison (% of portfolio).
TTM = trailing twelve months
Putting it all together
We approach public markets with the mindset of business owners. Investing, to us, is akin to owning a family business: you focus on the long term, the durability of the model, the integrity and alignment of management, and the price you are paying relative to intrinsic value.
Our strategy is simple but demanding in practice:
- Own high–quality companies with durable competitive advantages.
- Partner with management teams whose incentives are aligned with shareholders.
- Pay prices that build in a margin of safety.
- Look globally, not locally, for the best mix of quality and value.
In 2025, our companies grew earnings by more than 30.0%, trade at valuations that remain well below global market averages, and exhibit higher returns on capital than the indices. This combination drove approximately 26.3% growth in the fund, allowing us to outperform the benchmarks while still leaving what we estimate to be roughly 30% undervaluation in the portfolio. If valuation gaps were to narrow and our holdings were to move closer to assessed fair value, this would imply meaningful upside potential, before considering any additional fundamental growth.
On top of this, our portfolio offers an estimated total shareholder yield of about 4.8%, combining a 2.9% dividend yield with 1.9% buyback yield. Even without assuming incremental growth, a convergence toward fair value would, in such a scenario, represent a material contributor to forward returns over time.
We are very optimistic about our holdings. We believe the companies we own are high quality, attractively valued, and well diversified by business model and geography. We also believe deeply in alignment: we invest alongside you in the fund, and I have personally increased my investment, reflecting my conviction in the opportunity ahead.
We hope this report gives you the clarity we would want if the roles were reversed and we were in your seat as shareholders. As always, thank you for your trust.
Kind Regards,
Khalid Saud Alaamry
Other People are Reading


Anduril Executive Chairman and co-founder Trae Stephens details the shift in military strategy towards mass-produced, low-cost autonomous drones and AI-driven systems on ‘Mornings with Maria.’
Swarms of low-cost Iranian drones are rewriting the rules of war, but one U.S. defense contractor says it can mass-produce autonomous military systems to match them at a fraction of the traditional cost.
“Our adversaries are not coming at us with $10-plus million fighter planes, necessarily. They’re coming at us with very, very low-cost munitions,” Trae Stephens, co-founder and executive chairman of Anduril Industries, told “Mornings with Maria” Tuesday.
The challenge, he said, is to “significantly” bring down the cost of engagement instead of firing off $2 million interceptors, noting that the company is doing so by “building… low-cost autonomous systems” that give U.S. forces the ability to “fight the wars of tomorrow, rather than the wars of yesterday.”
AMERICAN DRONE COMPANY CHALLENGES CHINESE DOMINANCE WHILE PREPARING TROOPS FOR SWARM ATTACKS

A solider checks an Anduril Industries Inc. Ghost-X reconnaissance drone at the National Training Center (NTC) in Fort Irwin, Calif., on Nov. 7, 2025. (Christopher Lee/Bloomberg via Getty Images)
“That’s been Anduril’s focus since the beginning…” he said.
Stephens detailed the company’s autonomous systems designed to collaborate on the battlefield. Some drones act as “hunters” that scout and identify targets, while others serve as “killers” capable of striking them.
TRUMP SIGNS ORDER TO BLOCK DEFENSE COMPANIES FROM BUYING BACK STOCK UNTIL ARMS PRODUCTION IMPROVES
“You have drones that are going out and looking for other things, like our Ghost platform. You have loitering munitions that fly around looking for things, and then when they find those things, they can go and take kinetic action against them, and then you have platforms like our Barracuda 500 that are… missiles that are intended to go after targets directly,” he explained.
The aim is to replace Cold War-era technology with low-cost autonomous systems that can be mass-produced.
GET FOX BUSINESS ON THE GO BY CLICKING HERE
Former deputy national security advisor Victoria Coates discusses oil prices amid the Iranian conflict on ‘The Bottom Line.’
“We’re leveraging the advances in manufacturing techniques, the advances and autonomy in the manufacturing system to produce at high, high scale at very low cost,” he said.
The company is already moving to scale up production, with a new manufacturing facility in Ohio set to produce these autonomous military systems at high volume as wartime demand grows.


WA businesses received a blunt wake-up call today as the ‘Quantum Age’ moves beyond the lab, with experts warning those who wait to act will likely be too late to survive the fallout.


The gummies launch in partnership with NBA player Giannis Antetokounmpo.


The fries are formulated with avocado oil.

RBC Capital maintains Outperform on Karyopharm stock after trial data

The Chief Minister says conflict in the Middle East will lead to price rises in the coming days.

WASHINGTON — Iran’s ballistic missile program, long the backbone of its military deterrence, has undergone intense scrutiny and degradation in the 2026 conflict with Israel and the United States. Once estimated at more than 3,000 missiles, the arsenal has been significantly reduced by joint strikes, yet Tehran continues to demonstrate range and resilience with recent launches testing assumptions about its capabilities.

Here are 10 essential things to know about Iran’s ballistic missiles as of late March 2026:
- Iran possesses the largest ballistic missile arsenal in the Middle East, though heavy losses have trimmed its size. Prior to escalated fighting in 2025-2026, U.S. estimates placed the inventory above 3,000 missiles, including short-range and medium-range systems. After firing hundreds in retaliatory barrages and suffering Israeli and U.S. strikes on production sites and launchers, remaining stocks are estimated between 1,000 and 2,000 operational missiles, with launchers reduced to roughly 100-200 serviceable units. Despite this, Iran has shown rapid reconstitution efforts, importing components and rebuilding facilities.
- The program features a diverse mix of liquid- and solid-fueled missiles. Liquid-fueled systems like variants of the Shahab-3 offer longer ranges but require more preparation time. Solid-fueled missiles, such as the Sejjil and newer models like Kheibar Shekan, allow quicker “shoot-and-scoot” launches, making them harder to target. This mix enhances survivability against preemptive strikes on fixed sites.
- Ranges traditionally capped at 2,000 km have been challenged. Iranian officials long claimed a self-imposed 2,000-kilometer limit, sufficient to reach Israel from western Iran. However, in March 2026, Iran launched two ballistic missiles targeting the U.S.-U.K. base at Diego Garcia in the Indian Ocean — more than 4,000 km away. One failed in flight; the other was intercepted. The attempt suggests modified systems or previously undisclosed capabilities that could threaten parts of Europe or further U.S. assets.
- Hypersonic and maneuverable warheads are advancing rapidly. The Fattah-1 and Fattah-2 hypersonic glide vehicles represent a major leap, with claims of Mach 15 speeds and the ability to maneuver in pitch and yaw during re-entry. These features are designed to evade advanced defenses like Israel’s Arrow system or U.S. Patriot batteries. Iran has deployed Fattah-2 in recent strikes, showcasing improved precision and terminal-phase adjustments.
- Key medium-range systems include the Shahab-3 family, Emad, Ghadr, Sejjil and Khorramshahr. The Shahab-3 and its variants reach 1,300-2,000 km with payloads up to 1,500 kg. The solid-fueled Sejjil offers similar range with faster launch readiness. The Khorramshahr, potentially reaching 3,000 km, carries heavy warheads suited for hardened targets. Many feature maneuverable re-entry vehicles (MaRVs) to complicate interception.
- Short-range missiles provide regional saturation capability. Systems like the Fateh-110, Zolfaghar and Khalij Fars (anti-ship variant) cover 300-700 km, threatening U.S. bases in the Gulf, Israel’s neighbors and shipping lanes. These are often deployed in large salvos to overwhelm defenses, combined with drones for complex attacks.
- Underground “missile cities” enhance survivability. Iran has invested heavily in deeply buried facilities and mobile transporter-erector-launchers (TELs) dispersed across the country. While Israeli strikes damaged surface infrastructure and some launch pads, many underground stockpiles and production elements survived initial waves, allowing limited continued operations.
- The program has been heavily targeted in 2025-2026 fighting. Joint U.S.-Israeli operations destroyed an estimated 60-85% of surface-to-air missiles and a significant portion of ballistic launchers and production sites. Strikes hit facilities in Tehran, Semnan, Khuzestan and elsewhere, reducing daily launch rates by up to 90% in some phases. Production sites for solid fuel mixers and components were repeatedly hit, though Iran has begun reconstruction using alternative methods and imported materials.
- Precision and lethality improvements focus on saturation tactics. Older missiles had limited accuracy, but newer variants with GPS-aided or inertial guidance, cluster munitions and heavier warheads aim to saturate defenses. In 2024-2025 exchanges, Iran fired hundreds of missiles in barrages, with some penetrating Israeli multi-layered defenses and causing casualties in urban areas. Recent attacks have shifted toward countervalue targets in populated zones.
- Reconstitution and future risks remain a major concern. Despite losses, Iran is rebuilding, potentially aiming for 8,000 missiles by 2027 if unchecked, according to Israeli assessments. Imports of sodium perchlorate and other components from abroad support solid-fuel production. The program’s dual-use nature with space launch vehicles raises proliferation worries, and any nuclear breakout could pair with these delivery systems. Ongoing conflict has degraded but not eliminated the threat, with experts warning that full restoration could take 1-2 years.
Iran’s ballistic missiles serve as its primary asymmetric tool, compensating for conventional air force weaknesses. The Islamic Revolutionary Guard Corps oversees much of the program, integrating it with drone swarms for layered attacks. While U.S. and Israeli strikes have degraded launch rates and infrastructure, Tehran’s ability to fire at distant targets like Diego Garcia has upended prior range assumptions and heightened concerns for regional stability and European security.
The 2026 war has exposed both the program’s resilience and its vulnerabilities. Production facilities remain under pressure, yet underground assets and rapid repair efforts suggest Iran retains a credible deterrent. As fighting continues, the missile program’s evolution will shape the conflict’s trajectory and broader Middle East dynamics.
Analysts stress that while current stocks are diminished, the combination of hypersonic technology, dispersal tactics and reconstitution speed keeps Iran’s arsenal a potent factor. International efforts to curb components and sanctions aim to slow progress, but enforcement challenges persist.
For now, the March Diego Garcia attempt stands as a stark reminder: Iran’s ballistic missiles, even when degraded, can project power farther and with greater sophistication than many once believed. The coming months will test whether sustained pressure can prevent a full rebound or if Tehran will field an even more advanced force.

Labutes IR is a Fund Manager/Analyst specialized in the financial sector, with more than 18 years of experience in the financial markets. I have worked at several type of institutions in the industry, always at the buy side and related to portfolio management. Associated with the existing author The Outsider.
Analyst’s Disclosure: I/we have no stock, option or similar derivative position in any of the companies mentioned, and no plans to initiate any such positions within the next 72 hours. I wrote this article myself, and it expresses my own opinions. I am not receiving compensation for it (other than from Seeking Alpha). I have no business relationship with any company whose stock is mentioned in this article.
Seeking Alpha’s Disclosure: Past performance is no guarantee of future results. No recommendation or advice is being given as to whether any investment is suitable for a particular investor. Any views or opinions expressed above may not reflect those of Seeking Alpha as a whole. Seeking Alpha is not a licensed securities dealer, broker or US investment adviser or investment bank. Our analysts are third party authors that include both professional investors and individual investors who may not be licensed or certified by any institute or regulatory body.

.webp?t=1753366978)
Le Duff Group subsidiary advances global investment plan.

Vets trips to have lower prices and fewer nasty surprises

Moses Moody injury: Warriors, Mavericks were ‘horrified’ at grisly visual, says Steve Kerr
![Gini caranya! [Adira Finance berizin dan diawasi oleh Otoritas Jasa Keuangan] #MomobilalanNinjaku](https://wordupnews.com/wp-content/uploads/2026/03/1774364352_maxresdefault-80x80.jpg)
Gini caranya! [Adira Finance berizin dan diawasi oleh Otoritas Jasa Keuangan] #MomobilalanNinjaku


-
 Crypto World4 days ago
NIO (NIO) Stock Plunges 6.5% as Shelf Registration Sparks Dilution Worries
-

 Fashion4 days ago
Weekend Open Thread: Adidas – Corporette.com
-

 Politics4 days ago
Jenni Murray, Long-Serving Woman’s Hour Presenter, Dies Aged 75
-
 Tech7 days ago
Are Split Spacebars the Next Big Gaming Keyboard Trend?
-

 Crypto World3 days ago
Best Crypto to Buy Now: Strategy Just Spent $1.57 Billion on Bitcoin During Fear While Early Investors Quietly Enter Pepeto for 150x Potential
-

 News Videos6 days ago
RBA board divided on rate cut, unusually buoyant share market | Finance Report | ABC NEWS
-

 Crypto World3 days ago
Bitcoin Price News: Bhutan Sells $72 Million in BTC Under Fiscal Pressure, but the Smart Money Entering Pepeto Sees What the Market Does Not
-

 Politics6 days ago
The House | The new register to protect children from their abusers shows Parliament at its best
-

 Tech4 days ago
inKONBINI Lets You Spend Summer Days Behind the Register
-

 Crypto World6 days ago
Canada’s FINTRAC revokes registrations of 23 crypto MSBs in AML crackdown
-

 Sports1 day ago
Remo Stars and Kano Pillars Strengthen Survival Hopes in NPFL
-
 NewsBeat6 days ago
Residents in North Lanarkshire reminded to register to vote in Scottish Parliament Election
-

 News Videos6 days ago
PARLIAMENT OF MALAWI – PAC MEETING WITH REGISTRAR OF FINANCIAL ON AMARYLLIS HOTEL – INQUIRY LIVE
-

 Politics5 days ago
Gender equality discussions at UN face pushbacks and US resistance
-

 Business2 days ago
No Winner in March 21 Drawing as Prize Rolls to $133 Million for Next
-

 Business6 days ago
Who Was Alex Pretti? 5 Key Facts About the ICU Nurse Killed by Federal Agents in Minneapolis
-

 Sports1 day ago
Gary Kirsten Accuses Pakistan Cricket Board Of ‘Interference’, Mohsin Naqvi Responds
-

 Tech2 days ago
Give Your Phone a Huge (and Free) Upgrade by Switching to Another Keyboard
-

 Sports4 days ago
2026 Kentucky Derby horses, odds, futures, preview, date: Expert who nailed 12 Derby-Oaks Doubles enters picks
-
Sports5 days ago
Vikings Free Agency Enters Phase 2 with Key Questions
You must be logged in to post a comment Login