
Business
Alaamry Global Capital Annual Shareholder Letter 2025

As we reflect on 2025, it is hard to ignore the constant drumbeat of negative headlines: elevated geopolitical tensions, ongoing conflicts, trade frictions, and a broader shift toward de-globalisation. Yet, despite this backdrop of uncertainty, global equity markets once again delivered strong returns—another reminder that markets often advance not in the absence of risk, but in spite of it.
Market backdrop and performance
Table 1.
2025 market and fund returns.
| Index/Fund | 2025 Return |
| AGV Capital | 26.3% |
| S&P 500 | 17.9% |
| MSCI ACWI | 22.9% |
| MSCI China | 31.4% |
| Hang Seng Index | 27.8% |
| Vanguard Total World Stock (VT) | 22.4% |
All performance figures are calculated using the Time-Weighted Rate of Return (TWR), which eliminates the impact of external cash flows and reflects the pure investment performance of the portfolio.
As the old Wall Street adage goes, the market climbs a wall of worry. In 2025, investors had no shortage of reasons to worry—wars, tariffs, interest-rate concerns, and an uncertain macro outlook—yet markets moved higher as businesses continued to grow revenues, earnings, and cash flows.
China, concentration, and where the real opportunity was
In last year’s annual letter, we laid out a clear, contrarian thesis. We tilted our allocation decisively toward China at a time when the consensus was widely viewed as unattractive by the market. In 2024, we placed approximately 86.0% of the portfolio in Chinese equities. That positioning proved well justified in 2025, as the MSCI China Index delivered a total return of 31.4%—its strongest year in nearly a decade—and significantly outperformed the S&P 500 total return of 17.9%.
Meanwhile, the S&P 500 itself became even more concentrated. Index levels of concentration reached extremes not seen since the 2000 internet bubble and the roaring 1920s, with the so-called “Magnificent Seven” accounting for roughly 34.0% of the index and contributing about 42.0% of total returns, driven largely by strong investor enthusiasm and momentum around AI-related themes. Excluding the Mag 7, the S&P 500 would have delivered a return closer to 10.0%, roughly in line with the S&P 500 Equal-Weighted Index at 11.0% and Vanguard’s Total US Stock Market Index at around 11.0%.
Figure 1.
Rising impact of the largest 7 U.S. stocks on index returns (1999–2025).
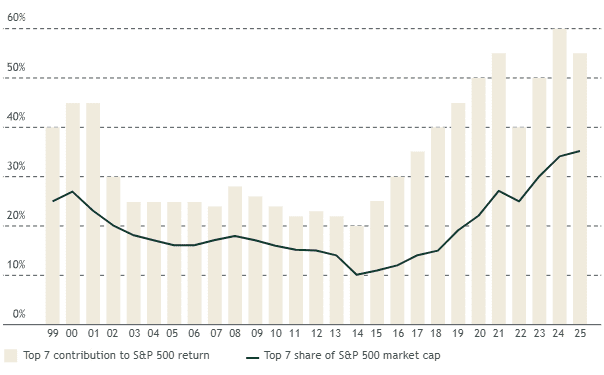
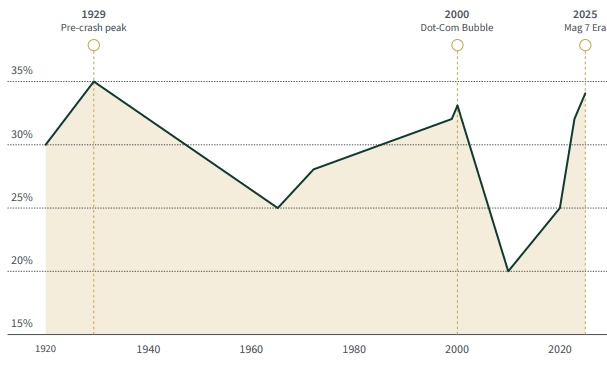
Figure 2.
fiop-7 stock concentration in U.S. market (1920–2025).
Current levels approach 1929 peak, surpassing dot-com era.
In a year when many active US-focused managers struggled to beat a Mag-7-driven benchmark, we delivered a gross return of about 26.3% while deliberately avoiding the US AI bubble and lofty valuations. We stayed anchored to our principles: buying high-quality companies at great valuations. As a result, we outperformed the S&P 500’s 17.9% and the MSCI ACWI Index’s 22.9%. This reinforces an important lesson: earning excellent returns is not about chasing whatever is fashionable; it is about owning great businesses at sensible prices.
China vs. the Magnificent Seven: who really delivered?
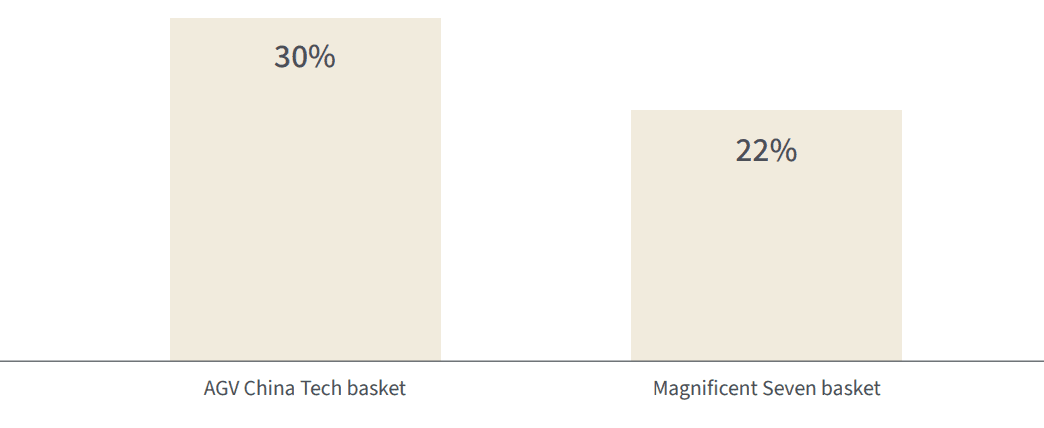
In last year’s letter, we compared a basket of leading Chinese large caps to the celebrated US Magnificent Seven and argued that price and sentiment were pointing in opposite directions. In 2025, that thesis played out in real time. On average, our China basket—Alibaba, BYD, Tencent, Baidu, PDD, and JD.com—returned roughly 30.0%, while the US Magnificent Seven as a group delivered about 22.0%.
Few would have expected the supposedly “uninvestable” Chinese names to outpace their highly praised US counterparts, especially in a year when the Mag 7 enjoyed an AI-driven momentum tailwind and investors were convinced they would “change the world.”
Figure 3.
2025 returns: AGV China tech basket vs. Magnificent Seven (total return, %).
AGV China Tech basket outperformed by 8 percentage points.
As the late Charlie Munger put it, the job is to fish where the fish are. For us, that means using our global mandate to go wherever the real opportunities lie—China, the US, or elsewhere—rather than hugging a single index simply because it feels familiar or popular with the crowd.
Looking through the lens of a holding company
We view the fund as a holding company. When we buy a stock, we think of it as owning a slice of a real business—its revenues, earnings, and cash flows—rather than just a ticker on a screen. To make this concrete, we aggregate the underlying fundamentals of every share we own and translate them into revenue, earnings, and free cash flow per fund unit. This approach allows us to judge our performance the way an owner would: through fundamental growth, profitability, portfolio quality, and valuation.
In 2025, our portfolio companies grew revenues by about 30.1% and earnings by 31.0% in US-dollar terms. In the local currencies in which they report, revenues grew 25.6% and earnings 26.6%, with the difference largely driven by dollar weakness and FX translation effects.
Table 2.
Revenue and earnings growth comparison (YoY).
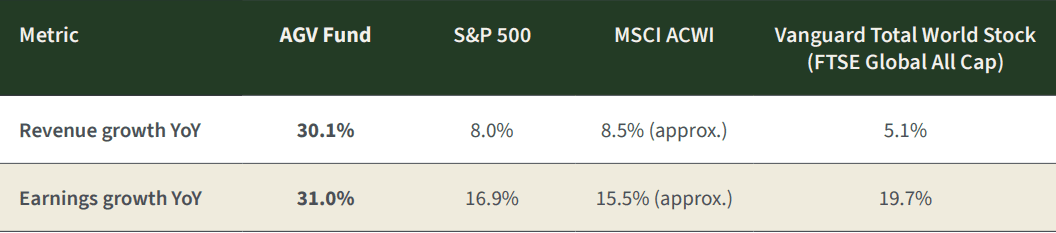
As you will see in the growth tables in the report, our companies delivered outstanding growth—substantially higher than the major indices we consider relevant benchmarks. Our roughly 26.3% gross fund performance for the year came almost entirely from this earnings growth. We did not benefit from multiple expansion; returns were driven by fundamentals, not rising valuations.
Valuation: strong returns without paying up
This lack of multiple expansion is visible when we compare our portfolio’s valuation today with last year’s. Despite the strong performance, our portfolio remains cheaper than, or broadly in line with, last year’s levels on most valuation metrics, and continues to trade at a meaningful discount based on our assessment of underlying fundamentals.
Table 3.
Valuation multiples.
| Valuation Multiple | TTM FY 2024 | TTM FY 2025 |
| Price-to-Sales | 0.9x | 0.8x |
| Price-to-Operating Income | 9.9x | 10.1x |
| Price-to-Earnings | 11.9x | 10.7x |
| Price-to-Operating Cash flow | 5.7x | 7.9x |
| Price-to-Free Cash Flow | 7.4x | 11.8x |
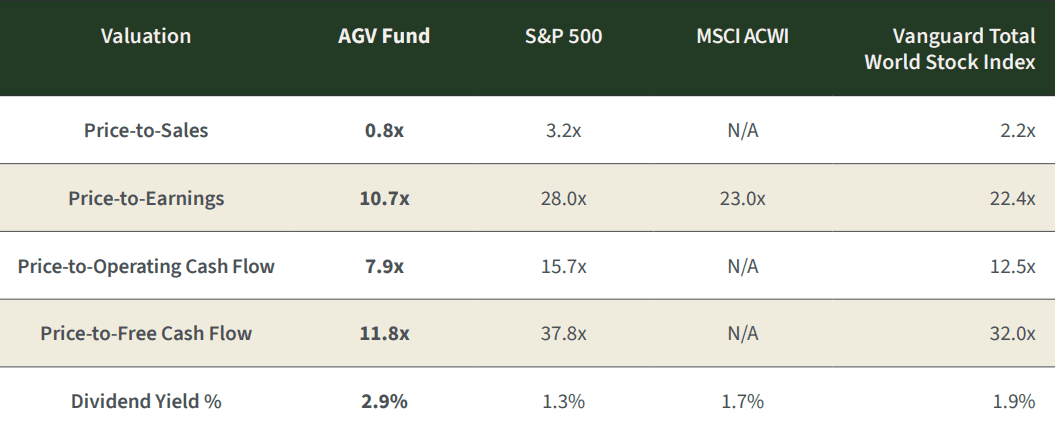
When we set these valuations against those of major indices, the contrast becomes even clearer: our holdings trade at a substantial discount to global indices on earnings, sales, and free-cash-flow measures, while offering higher dividend yield and stronger underlying growth. That combination—better businesses at lower prices—is exactly what we look for.
Table 4.
Portfolio quality: returns on capital and profitability
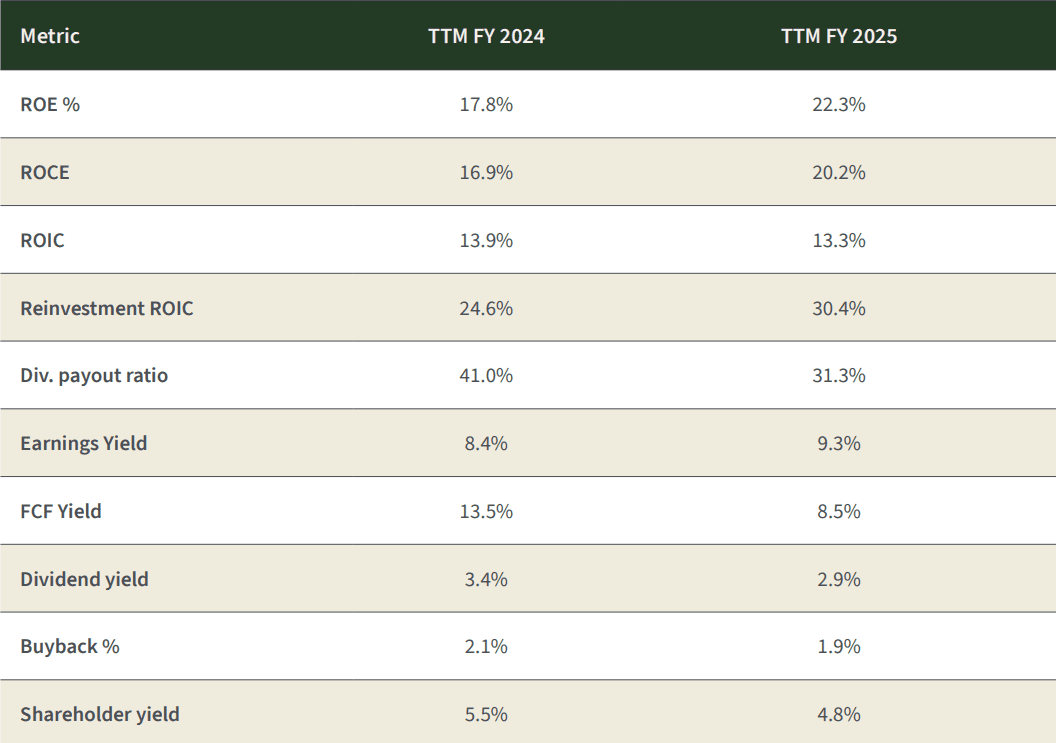
Valuation is only half the equation; quality matters just as much. In 2025 we improved the quality of the portfolio meaningfully. Our return on equity rose from around 17.8% to over 22.3%, and our return on capital employed increased from roughly 17.0% to just over 20.0%. Internal reinvestment ROIC also improved, showing that incremental capital is being deployed at very attractive rates of return.
Table 5.
Portfolio quality metrics.
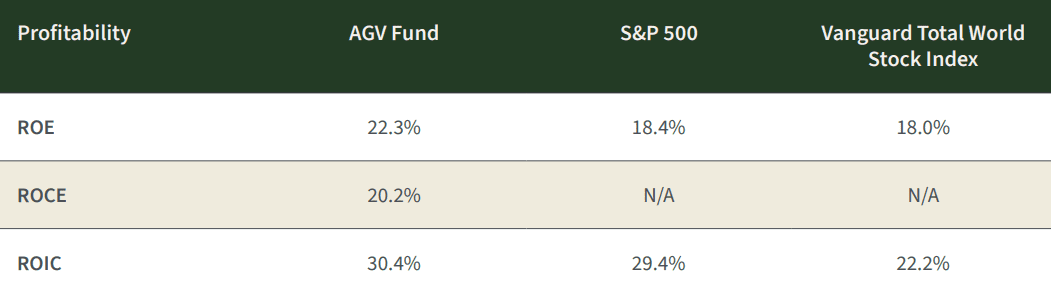
When we compare these metrics to the major indices, the gap is evident. Across Return on Equity, Return on Capital Employed, and Return on Invested Capital, our portfolio companies earn meaningfully higher returns on capital than the broad indices, highlighting both superior business quality and better capital allocation.
Table 6.
Profitability comparison.
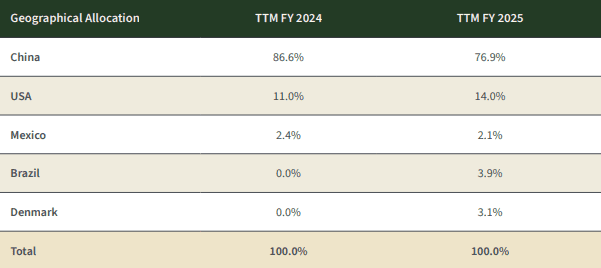
Geographic allocation: China still leads, diversification expanded
Our current geographic exposure compared with last year reflects both conviction and select diversification. We reduced our China exposure from the mid-80s to the high-70s and introduced two new regions—Denmark and Brazil—where we found exceptional businesses that meet our criteria. The US allocation also increased modestly as select opportunities emerged at reasonable valuations. We remain willing to go wherever the risk-reward profile is most attractive, rather than sticking to any home-market bias. The table & chart below summarizes our geographic allocation at year-end.
Figure 4.
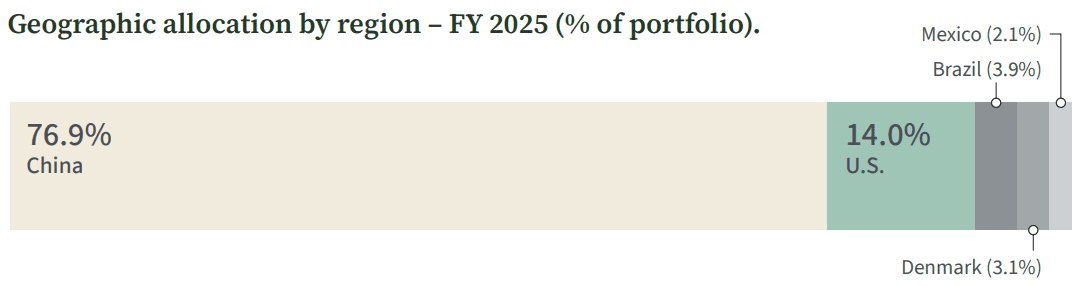
Table 7
Geographic allocation
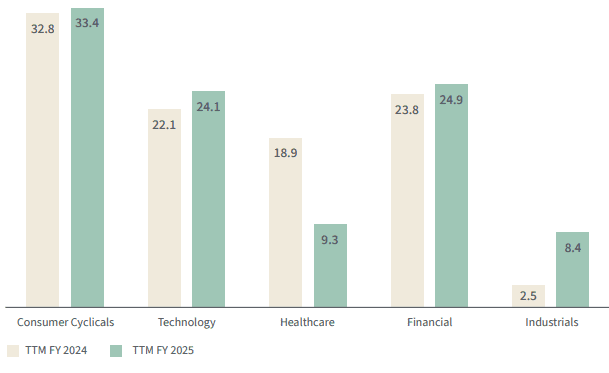
In addition to geography, we also manage diversification by business model and sector. The chart below shows our sector allocation as of year-end and comparison of last year, highlighting where we are finding the most compelling opportunities today.
Figure 5.
Sector allocation – year-on-year comparison (% of portfolio).
TTM = trailing twelve months
Putting it all together
We approach public markets with the mindset of business owners. Investing, to us, is akin to owning a family business: you focus on the long term, the durability of the model, the integrity and alignment of management, and the price you are paying relative to intrinsic value.
Our strategy is simple but demanding in practice:
- Own high–quality companies with durable competitive advantages.
- Partner with management teams whose incentives are aligned with shareholders.
- Pay prices that build in a margin of safety.
- Look globally, not locally, for the best mix of quality and value.
In 2025, our companies grew earnings by more than 30.0%, trade at valuations that remain well below global market averages, and exhibit higher returns on capital than the indices. This combination drove approximately 26.3% growth in the fund, allowing us to outperform the benchmarks while still leaving what we estimate to be roughly 30% undervaluation in the portfolio. If valuation gaps were to narrow and our holdings were to move closer to assessed fair value, this would imply meaningful upside potential, before considering any additional fundamental growth.
On top of this, our portfolio offers an estimated total shareholder yield of about 4.8%, combining a 2.9% dividend yield with 1.9% buyback yield. Even without assuming incremental growth, a convergence toward fair value would, in such a scenario, represent a material contributor to forward returns over time.
We are very optimistic about our holdings. We believe the companies we own are high quality, attractively valued, and well diversified by business model and geography. We also believe deeply in alignment: we invest alongside you in the fund, and I have personally increased my investment, reflecting my conviction in the opportunity ahead.
We hope this report gives you the clarity we would want if the roles were reversed and we were in your seat as shareholders. As always, thank you for your trust.
Kind Regards,
Khalid Saud Alaamry
Other People are Reading


National Australia Bank flags $503 million impairment hit on Mideast volatility

The all-cash deal, valued at about ₹1,200 crore, involves a transfer of stressed debt between asset reconstruction platforms and investors. It was closed in March. The exposure dates back to 2018, when Edelweiss ARC, in partnership with Oaktree and other investors, had acquired nearly 90% of GTL Infra’s loans, then valued at around ₹4,000 crore.
The telecom tower company had defaulted on debt exceeding ₹11,000 crore, triggering multiple restructuring efforts over the years.
People familiar with the latest transaction said Edelweiss had put the exposure on the block as its fund lifecycle neared maturity, prompting a takeout by Omkara.
“This is a 100% cash deal between ARCs. Edelweiss exited and we acquired the exposure,” an executive at one of the firms said on condition of anonymity.

Investors are betting on improved recovery prospects this time. “The underlying business is more or less stable now. The towers are operational, and that improves the chances of recovery,” the person said.
Omkara is understood to be targeting an exit over the next two years, either through asset sales or a negotiated settlement. “The idea is to close the account in about two years-through sale of assets or other recovery mechanisms,” the person added. Omkara and Edelweiss ARC spokespersons did not respond to requests for comment until press time Sunday.
In 2018, after a steep revenue and Ebitda decline following the exit of key clients including Aircel, RCom and Tata Teleservices, GTL Infrastructure sought to deleverage, with lenders assigning 79.34% of its ₹3,226-crore debt to Edelweiss ARC. The firm submitted multiple restructuring proposals from April 2018 onward, expecting a swift resolution, but lenders did not act on these plans and some retained their exposure.
In November 2022, the National Company Law Tribunal (NCLT) rejected a plea by Canara Bank to initiate insolvency proceedings, ruling that the company remained a viable going concern and did not meet the threshold for admission under the bankruptcy code.

Stocks and the rupee are seen facing fresh challenges after having recouped losses and strengthened amid easing geopolitical tensions. Last week, the Sensex and Nifty gained up to 1.3%, while broader indices advanced further – the Nifty Midcap 150 rose 3.5% and Smallcap 250 was up 4.4%, extending gains for the second straight week. The rebound faces hurdles if tensions erupt again.
The rupee may open 30-35 paise weaker against the dollar. It closed at 92.93 per dollar on Friday, up 0.30% from the previous close. But traders expect it to slip below 93 due to higher oil prices, after some ships were fired upon as Iran closed the Strait. Satellite imagery late on Sunday showed ships at a standstill, after they had started moving two days before.
“On Friday, things had cooled down a bit after Iran opened the Strait but since then, there have been some volatilities, as a result of which, oil prices have increased,” said Alok Singh, head of treasury at CSB Bank. “It is now turning out to be a market driven by statements from the US and Iran. We should expect volatility to continue till there is clarity.”
Belligerent statements by both sides are balanced by plans for renewed dialogue in Pakistan this week. Mediators and affected Gulf states are also keenly aware that the end of the two-week ceasefire is days away.
RBI may Help Rupee
“Based on the current news flow, markets on Monday are likely to react primarily to crude prices,” said Shrikant Chouhan, head of equity research, Kotak Securities. “If oil moves back toward $100 per barrel, the market may open near previous closing levels, and then shift focus toward domestic developments.”
When Iran announced on Friday that the Strait of Hormuz would be open as part of peace efforts, Brent crude plunged 9% to $90.38 a barrel, helping Wall Street benchmarks close at record highs later in the day. Before the US-Iran truce, prices were at around $110.
All eyes are on the diplomatic peace talks between the US and Iran, with the ceasefire deadline of April 22 fast approaching, said Siddhartha Khemka, head of research at Motilal Oswal Financial Services. “Now that there has been a sharp rally over the past 10 trading sessions, there should be some consolidation,” he said.
Higher oil prices will push the rupee to open lower on Monday before the Reserve Bank of India (RBI) possibly steps in to prevent a sharp fall, traders said. RBI’s move to take dollar demand by oil companies out of the market by providing them a direct supply of the currency through State Bank of India may also prevent a sharp fall in the rupee.
If the war continues for a longer period and crude again goes back to $100-120 per barrel, it will be negative for the economy, and markets could see a worse reaction, said Mahesh Ojha, vice president, research, Kantilal Chhaganlal Securities. “Fourth quarter results from ICICI are marginally better than expected, while HDFC Bank posted a steady quarter, and this could act as a positive trigger on Monday,” he said. “If conditions turn worse, the banking heavyweights could offer support, while if sentiment improves, they could add further upside.”
Since the ceasefire announcement on April 8, the Sensex and Nifty have gained over 5%, while the Nifty Midcap 150 and Nifty Smallcap 250 advanced roughly 10%.
The market seems well-positioned to extend its uptrend, rather than remain range-bound, said Dhupesh Dhameja, derivatives analyst at Samco Securities.

It seems Brock Lesnar has retired.
Following his loss to Oba Femi during the second night of WrestleMania 42, Lesnar left his gloves and wrestling boots in the ring, a typical sign of retirement that fans last saw when AJ Styles retired in January.
Brock Lesnar Leaves Gloves, Boots in the Ring
Lesnar stayed seated in the ring after the match, soon shocking fans in attendance and watching at home when he began to remove his gloves. Fans soon began to voice their disapproval, continuously chanting “No!” as he went.
A visibly emotional and crying Lesnar then began to remove his boots before leaving them, along with the gloves, at the center of the ring.
Paul Heyman eventually entered the ring, and Lesnar made an “x” sign with his arms before the two shared a hug.
Lesnar waved to the crowd and bowed in gratitude before leaving the ring as chants of “Thank you, Lesnar” echoed throughout the arena.
Is This It for Lesnar?
If his actions in the ring truly meant that his match against Femi is his final match, Lesnar joins the list of recently-retired WWE legends.
It can be recalled that John Cena retired in December after tapping out to Gunther. AJ Styles likewise retired in January after a match with “The Career Killer.”
Fan reaction online has been swift as many grappled with the idea that Lesnar his retired, with many expressing their gratitude to one of the greatest combat athletes WWE has ever seen.
One fan on X expressed shock by saying, “4 minutes 45 seconds for what could be Brock’s last match??”
“Brock hasn’t retired yet,” another fan said. “We will see on Raw when Gunther confronts him.”
One pointed out a sad truth for a generation of WWE fans by saying, “Lesnar, Styles, & Cena all announced their retirement in the span of four months.”
Originally published on sportsworldnews.com

National Australia Bank hikes credit provisions on Iran war; flags $961 mln charge

CStone presents preclinical data on three ADC candidates at AACR

In the first half of April, investors bought a net $500 million of bonds in the lowest tier of investment grade, and sold $7.3 billion of the higher tiers, according to JPMorgan Chase & Co. That helped BBB bonds perform comparatively better than higher-rated notes, pushing the gap between spreads for BBB and A corporates to the tightest since before the war.
There may be good reason for these slightly riskier bonds to be performing better: BBB rated companies have outperformed analysts’ average forecasts more than A companies have, according to a Bloomberg News analysis.
Buyers are hoping a more lasting peace in West Asia can be forged by negotiators, and that companies in the lower edges of investment grade can keep performing well.
“There is some value in the BBB space and issuers there have been good stewards of the balance sheet and generally improving credit quality,” said Gene Tannuzzo, global head of fixed income at Columbia Threadneedle Investments.
Investors have also been snatching up junk bonds, although with a preference for the higher-rated end of the spectrum, implying that money managers still see risk ahead even as they grow moderately more hopeful. Overall spreads for junk bonds are at their tightest since the war began, averaging 2.72% as of Thursday’s close.

ROHAN SHAH
TECHNICAL ANALYST, ASIT C MEHTA INVESTMENT
Where is Nifty headed this week?
Nifty staged a strong comeback this month after a prolonged four-month decline, supported by easing geopolitical tensions and lower crude prices. The index has approached a resistance band of 24,300–24,700, which aligns with multiple technical studies. However, sustained strength above this zone is essential for the continuation of the upward momentum, potentially paving the way toward 25,500. Inability to hold above this zone may trigger profit booking, dragging the index lower towards 23,500–23,200. Trading Strategy: Buy Nifty futures above 24,700 for an upside target of 25,500, maintaining a stop-loss below 24,250.
TOP STOCK BETS
Jubilant FoodWorks
Buy at CMP Rs 459 | Stop-loss Rs 420 | Target Rs 525
The stock shows early reversal signs, backed by one-year high volumes and a high-wave candle near a demand zone, indicating selling exhaustion. The Rs 420–440 zone is key support; RSI shows bullish divergence.
Maruti Suzuki India
Buy at CMP Rs 13,453 | Stop-loss Rs 12,500 | Target Rs 15,500
The stock has witnessed a strong rebound after confirming a bullish ABCD harmonic pattern. The formation of a cup-and-handle pattern alongside improving volumes signals accumulation. RSI holding above its breakout level suggests a positive bias.
AJIT MISHRA
SVP – RESEARCH, RELIGARE BROKING
Where is Nifty headed this week?
Nifty is now approaching key moving averages (100 and 200 DEMA) in the 24,600– 24,800 zone. Sustained strength above this band could open room for further upside towards 25,200. In case of profit booking or consolidation, the 23,700–24,000 zone is likely to provide strong support.
Trading Strategies: For the short term, traders may consider a “buy on dip” approach in the 24,150–24,250 range, with a stop-loss at 23,900 and potential targets of 24,800 and 25,200. Among sectoral themes, the Nifty Energy Index has witnessed a fresh breakout after spending more than one-anda-half years in a consolidation phase. Participants can consider playing this theme through an ETF, i.e., Mirae Asset Nifty Energy ETF. It is currently trading at Rs 39.11, and one can accumulate it in the Rs 37–40 zone with a stoploss at Rs 34 for a positional target of Rs 52.
TOP STOCK BETS
Federal Bank Buy. CMP Rs 293 | Stop-loss Rs 278 | Target Rs 325
Federal Bank is in a steady uptrend with higher highs and lows post-base formation. A strong breakout near the 200-DMA signals a sentiment shift; price holds above key averages, with RSI supporting continuation.
JSW Energy
Buy. CMP Rs 538 | Stop-loss Rs 504 | Target Rs 598
JSW Energy is in a stage-2 uptrend, consolidating after a strong rally. The range-bound move near the 200-DMA suggests a healthy pause, with price now attempting an upward breakout supported by improving momentum.
RAJESH PALVIYA
HEAD OF TECHNICAL AND DERIVATIVES, AXIS SECURITIES
Where is Nifty headed this week?
Nifty is fast approaching 24,415—the upper boundary of the bearish gap etched on March 9. A conviction close above 24,500, however, could open the floodgates. The next logical pit stops are 24,762— the 61.8% Fibonacci retracement of the Feb March decline—and the psychologically significant 25,000 mark. A slip below the 24,000–23,900 support band would be a warning shot, potentially dragging the index back to retest its weekly low of 23,555. Traders on the long side would do well to respect this floor. The overall outlook remains positive, as the weekly RSI continues to stay above its reference line. This indicates that positive momentum is still intact and not yet exhausted.
Trading Strategies: The recommended strategy for Nifty options for the April 28, 2026, expiry is a call spread, ideal for a moderately bullish market outlook. The trader buys one lot of the 24,400-strike Call option at a premium of Rs 260–240 and simultaneously sells one lot of the 24,700-strike Call option at a premium of Rs 130–150. This strategy limits both risk and reward, creating a defined range for outcomes. The break-even point is at 24,530, with a maximum potential loss of Rs 8,450 and a maximum profit of Rs 11,050.
TOP STOCK BETS
Mazagon Dock Shipbuilders
Buy at Rs 2,618, CMP Rs 2,620| Stop-loss Rs 2,550 | Target Rs 2,800-2,850
A breakout above Rs 2,430 signals a shift to a primary uptrend, with RSI strength confirming bullish momentum. Resistance lies at Rs 2,800–2,850; sustained strength could extend gains to Rs 3,000–3,050.
Polycab India
Buy at Rs 8,184, CMP Rs 8,188.50 | Stop-loss Rs 7,900 | Target Rs 8,600-8,900
An uptrend supported by a rising trendline and a doublebottom near Rs 6,650 underpins strength. Resistance at Rs 8,700; a breakout could target Rs 9,000+. Maintain Rs 7,600 as a stop-loss; below this, risks a breakdown.

Stone Fox Capital is an RIA from Oklahoma. Mark Holder is a CPA with degrees in Accounting and Finance. He is also Series 65 licensed and has 30 years of investing experience, including 15 years as a portfolio manager. Mark leads the investing group Out Fox The Street where he shares stock picks and deep research to help readers uncover potential multibaggers while managing portfolio risk via diversification. Features include various model portfolios, stock picks with identifiable catalysts, daily updates, real-time alerts, and access to community chat and direct chat with Mark for questions. Learn more.
Analyst’s Disclosure: I/we have no stock, option or similar derivative position in any of the companies mentioned, and no plans to initiate any such positions within the next 72 hours. I wrote this article myself, and it expresses my own opinions. I am not receiving compensation for it (other than from Seeking Alpha). I have no business relationship with any company whose stock is mentioned in this article.
The information contained herein is for informational purposes only. Nothing in this article should be taken as a solicitation to purchase or sell securities. Before buying or selling any stock, you should do your own research and reach your own conclusion or consult a financial advisor. Investing includes risks, including loss of principal.
Seeking Alpha’s Disclosure: Past performance is no guarantee of future results. No recommendation or advice is being given as to whether any investment is suitable for a particular investor. Any views or opinions expressed above may not reflect those of Seeking Alpha as a whole. Seeking Alpha is not a licensed securities dealer, broker or US investment adviser or investment bank. Our analysts are third party authors that include both professional investors and individual investors who may not be licensed or certified by any institute or regulatory body.
Modular Medical prices $3.4 million stock offering at $4.50/share

National Australia Bank flags $503 million impairment hit on Mideast volatility

Mark Wahlberg’s 2026 Raunchy New Movie Is Getting Obliterated by Critics
Sweden warns Russia could launch land grab to seize Baltic Sea island


-

 Crypto World6 days ago
The SEC Conditionalises DeFi Platforms to Be Avoided for Broker Registration
-

 Fashion2 days ago
Weekend Open Thread: Theodora Dress
-

 NewsBeat6 days ago
Trump and Pope Leo: Behind their disagreement over Iran war
-

 Crypto World6 days ago
SEC Signals Exemption for Crypto Interfaces From Broker Registration
-

 News Videos5 days ago
Secure crypto trading starts with an FIU-registered
-

 Sports3 days ago
NWFL Suspends Two Players Over Post-Match Clash in Ado-Ekiti
-

 Crypto World6 days ago
SEC Proposes Certain Crypto Interfaces Don’t Need to Register as Brokers
-

 Business10 hours ago
Powerball Result April 18, 2026: No Jackpot Winner in Powerball Draw: $75 Million Rolls Over
-

 Politics2 days ago
Palestine barred from entering Canada for FIFA Congress
-

 Crypto World2 days ago
Russia Pushes Bill to Criminalize Unregistered Crypto Services
-

 Sports7 days ago
NWFL opens Pathway for new Clubs ahead of 2026 Season
-
 Business3 days ago
Creo Medical agree sale of its manufacturing operation
-
 Entertainment6 days ago
Brand New Day’ Footage Reveals the Devastating Impact of ‘Now Way Home’
-

 Politics15 hours ago
Zack Polanski demands ‘council homes not luxury flats for foreign investors’
-

 Crypto World7 days ago
Trump whales load up ahead of Mar-a-Lago luncheon.
-
Business7 days ago
Kering slides after Morgan Stanley downgrade, Gucci woes loom
-

 Tech7 days ago
Google adds E2E encryption to Gmail for iOS and Android enterprise users
-

 Tech7 days ago
Apple glasses won’t go brand shopping like Meta did with Ray-Ban and Oakley
-
Entertainment7 days ago
How Euphoria Season 3 Premiere Paid Tribute to Eric Dane After Death
-
 Entertainment6 days ago
Karol G’s ‘Ultra Raunchy’ Coachella Set Gave ‘Satanic Vibes’
You must be logged in to post a comment Login