

Business
Baron Discovery Fund Q1 2026 Commentary (BDFIX)


Sasun Bughdaryan/iStock via Getty Images

Dear Baron Discovery FundShareholder,
Performance
This was a challenging quarter for Baron Discovery Fund ® (the Fund), both on an absolute and relative basis. In the first quarter of 2026, the Fund declined 10.65% (Institutional Shares), trailing the Russell 2000 Growth Index (the Index) by 7.84%. We don’t take this lightly, and we have doubled our efforts to understand what is going on in the market both in the short term, and (far more importantly) as it affects the overall long-term embedded valuations of our holdings in the Fund.
Of the underperformance, five buckets accounted for 7.88% (essentially all of it):
• 2.63% came from Information Technology (IT) (software exposure was entirely responsible for the relative shortfall in the sector, but was partly offset by solid relative performance in areas benefiting from the AI secular growth narrative, such as semiconductor, semiconductor materials & equipment, and electronic equipment & instruments related companies)
• 1.76% came from Consumer Discretionary (higher energy prices, inflation and AI induced unemployment fears, plus noise around “prediction markets” competitors to DraftKings Inc. (DKNG) )
• 1.22% came from Health Care (there were no real standout mistakes here, but the market was negative on life sciences tools and health care technology)
• 1.17% came from our lack of exposure to Energy (higher oil prices related to the Iran action moved the sector up 26%) and Materials (aluminum and chemicals prices are up, also related to Iran);
• 1.09% came from Industrials (some of which related to concerns about commercial aerospace suppliers like Loar Holdings Inc. (LOAR) due to the military action in Iran)
Annualized performance (%) for periods ended March 31, 2026 †
Of the underperformance, in IT, 3.71% of the relative deficit was attributable to software. If we include two health care companies that are software-related ( Waystar Holding Corp. (WAY) and Heartflow, Inc. (HTFL) ), the total adverse impact from software in the quarter was (4.36%) or nearly 60% of our negative relative performance. These software companies almost uniformly beat earnings, yet shares dropped considerably.
Software has been decimated by the so-called “SaaS-pocalypse” which is shorthand for how the revolution of AI is changing the industry. SaaS stands for software as a service. The market has decided that all software companies are AI losers and, as a result, every one of our software holdings saw significant declines in the quarter. Despite generally strong fourth quarter earnings, the sharp declines have pushed software valuations to levels not seen in more than 15 years. Although the short-term results have been difficult, we see this environment as a chance to invest in truly attractive opportunities across software companies that in our view have strong and sustainable competitive advantages. There are multiple potential catalysts that could quickly change the market’s thinking on these software companies, and we want to be there to reap the benefits when that happens.
Companies like Anthropic (ANTHRO) and OpenAI (OPENAI) have created models known as “frontier, ” “foundation, ” or “large language” AI models (LLMs) that have revolutionized the way we search for and categorize information that is generally publicly available. They have extended their LLMs into software coding, in a way that has become much more accessible to the general population, thereby democratizing software development. It is true that this revolution has made it much less expensive to develop basic software (for professionals and consumers alike). Companies that have value propositions based mostly on their actual code are truly at risk of disintermediation in the world of AI. However, we have largely avoided these types of companies. Our companies should have built-in competitive advantages, which extend far beyond the actual code. Our portfolio companies have their own internally developed AI which is custom tailored to their own domains. Here are a few examples of the differentiation which exists in our investments.
1. Deterministic Data/Infrastructure Protection – LLMs take the data that is available to them and search based upon it. If there is an actual answer to the question being asked, it will be returned. Where no actual answer can be found, a probabilistic “guess” is made in order to fill in the blanks. The answer may be correct, or it may not be (in which case you have what is called a “hallucination”). Software companies that deal with private customer data, not available to LLMs, have a prized possession because software using deterministic data will have an actual answer to a question being asked that in many cases cannot be addressed by an outside LLM. In fact, it may be unsafe, illegal, or out of policy for a company to use an external model, or to allow that external model to have access to its proprietary information.
Good examples of this are regulated companies in industries such as health care and finance. The more complex the environment, the more embedded the legacy software will be in the enterprise. Now these legacy software companies can use AI from an outside LLM through a link called an MCP Server (Model Context Protocol) to help fine-tune their own deterministic data. But there is a cost for using outside AI based on the amount of information “tokens” consumed. And breaches of MCP Server software have also been reported (see below). Cybersecurity companies in particular have the advantage of seeing all of a company’s data and parsing it for particular threats to the internal network or application structure of that company.
The brands of these companies are valuable as they have built up years’ worth of trust with their customers. This is why we have invested in SentinelOne, Inc. (S), which provides endpoint protection using its own AI algorithms for cyber-breach discovery and remediation, . The same is true for observability software (which “instruments” everything that moves through a network or attaches to it, as well as the applications and data related to that movement). We own Dynatrace, Inc. (DT) which is architected on its own internal AI to predict failures in network software and hardware (whether in the cloud or on-premise) and works to automatically remediate the issues. It’s used by the largest companies in the world that operate in the most complex environments (airlines, financial giants, and defense companies for example).
Deterministic/infrastructure oriented companies gain nearly all of their value by integrating with and servicing their clients’ needs, rather than just by selling an off-the-shelf software package. Such software provides high return on investment (ROI), auditable security compliance, and peace of mind at a reasonable cost. Even if cheaper software solutions that were coded using LLM platforms came out, they would still have to be integrated and maintained into the enterprise’s architecture, and they would have to link to outside LLM’s for AI capability (which could cost a LOT more to run in the future versus what existing vendors charge for their “tuned” and more specific AI models). We believe that these companies will become even more valuable in an “agentic AI” world, where software autonomously executes tasks based on user goals, operates with its own enterprise privileges, and must be monitored and controlled.
2. Network Effects Vertical Vendors – Some companies serve a very specific customer base and provide increased value by giving each customer the benefit of understanding (using hard to compile domain specific data) what is going on in their industry. Examples of this include ServiceTitan, Inc. (TTAN), which provides software for service trades such as plumbing and HVAC. It is an all-in-one platform for lead generation, job bookings, dispatching, estimating jobs, customer communications, and payments/financing. Each trade has its own specific characteristics and regional data on pricing, competition, service times, and contract terms that ServiceTitan understands deeply. It is not easy to switch the software out, particularly because it helps businesses automate their processes and minimize the overall personnel needed. Procore Technologies, Inc. (PCOR) provides integrated construction software, which is required by many of the major general contractors in order for subcontractors to be able to participate in a construction project. The software combines computer-aided design software blueprints with job scheduling, cost estimations, materials costs, and change order management. In this manner, the job site can be coordinated among all the different parties involved in the construction project. It is truly a community-oriented platform that is not easily replaced.
3. Atoms Plus Electrons – These are hybrids of software and hardware. They are in some ways the most protected because AI in and of itself can’t create hardware. Companies like Netskope, Inc. (NTSK) fit into this category. Netskope is a misunderstood company which provides secure access service edge (SASE) functionality for zero trust network access (ZTNA), data loss protection, and threat protection to its enterprise customers. It uses a proprietary network of worldwide data access centers as gateways for access to enterprise network resources, web resources, and applications. These physical data centers allow much faster data movement as well as for in-line scanning of network data for security purposes. The company is not earning full margins yet because it has invested in building its physical network (which is part of the reason it is down in the quarter). However, NetSkope is now starting to reap scaled revenue benefits, and its physical network gives the company an advantage over purely software-based ZTNA solutions in that it is safer and provides much faster overall network access (lower latency or delay). It cannot be replicated by software alone.
4. Regulated Industries – Some industries like health care in particular are heavily regulated, with extreme penalties for misuse or loss of patient information. And in some cases, such as with Heartflow (which uses AI software to map coronary arteries to assess blood flow and plaque buildup without an invasive procedure), clinical trials and Food and Drug Administration (FDA) approval are required before the software can be used.
While this discussion is important, the more practical question is when the market will begin to recognize the wide dispersion in intrinsic value across the software universe. We believe several catalysts are emerging that should separate the winners from the losers.
First, it is likely that we will see increased merger activity. Private equity funds specializing in software have recently raised tens of billions of dollars and would be very sophisticated buyers of high-quality companies at historically depressed evaluations (we have had eight companies acquired in this space in the last six years). Additionally, we are seeing strategic buyers from within the technology space purchase software companies. Last year we had two software companies purchased by such buyers, including CyberArk Software Ltd. (CYBR), a high-end cybersecurity company which was bought by Palo Alto Networks (PANW) (announced in July 2025 and closed in February 2026).
Second, it is almost inevitable that there will be cyber-attacks based upon usage of LLM based AI within enterprises if the technology is not properly secured and controlled. We have already seen such an attack. In March 2026 LiteLLM, an LLM gateway tool (which allows developers to link their applications to over 100 different LLMs) was used as an attack vector. Poorly secured coding in this widely used tool led to widespread malware infiltration. The attack was so sophisticated that it allowed the attackers to rapidly spread the malware across on-premise and cloud resources and exfiltrate sensitive data to an external server. SentinelOne recently released a technical paper which showed how its own AI-driven software automatically and rapidly protected its users by finding and shutting down this attack and provided an audited trail of the attack vector itself.
Third, we are likely to see partnerships between legacy software companies and LLM providers, which will highlight the “last mile” deterministic data value of legacy software companies. Recent examples include partnerships with OpenAI and transaction processors such as Instacart (CART), as well as a partnership with SentinelOne and Google (GOOGL) (to provide autonomous, AI-based cloud security for Google Cloud customers).
Finally, we expect continued solid financial performance from companies with the protected characteristics described above. During the past quarter, our holdings generally delivered results ahead of expectations and raised guidance. We believe this trend will persist, and that growing free cash flow will ultimately capture investors’ attention. Yet valuations are lower than they have been in over a decade. As we have noted in past letters, software companies have incredible financial characteristics, including outsized margins, strong balance sheets, and the ability to actually generate more free cash flow as they grow (due to the upfront payment of subscription fees). For all these reasons, we have maintained our overweight in the software space, and we believe that we will see significant outperformance for years ahead of us.
Top contributors to performance for the quarter
Advanced Energy Industries, Inc. is a designer and manufacturer of products used to transform, refine, and modify electrical power for use in semiconductor, industrial, medical, data center, and telecommunications end markets. Advanced Energy’s stock rose during the quarter as earnings and guidance were better than expected and as the market began to appreciate the strength that the company would see in both its data center and semiconductor end markets. The company is enjoying the fruits of having repositioned its data center segment to focus on sole-source, differentiated, higher margin business. AI’s increasing power requirements play to Advanced Energy’s strengths in power density and efficiency. The company also recently launched new products into the semiconductor market which are expected to drive strong growth through this year. Combined with the early stages of a recovery in its industrial and medical end markets, Advanced Energy is poised for several years of continued strong growth and margin expansion. The company also remains focused on acquisitions to bolster its product offerings, particularly in the large fragmented industrial and medical spaces.
Masimo Corporation is a medical device company that manufactures and sells a variety of non-invasive patient monitoring technologies, including its well-known pulse oximeters used to measure blood oxygen levels. Shares outperformed for the quarter after Danaher Corporation (DHR) announced that it would acquire Masimo at a 38% premium. This was a special situation driven by an activist investor that worked out very well for the Fund.
Arcellx, Inc. is a biotechnology company which uses CAR-T technology (modifies a patient’s own immune cells to recognize and destroy cancer cells) to treat multiple myeloma. It is due to be acquired by Gilead Sciences Inc. (GILD) in June (around which time we expect that Arcellx will receive FDA approval for its drug called Antio-cel).
Top detractors from performance for the quarter
Intapp, Inc., a vertical software platform serving private equity, legal, and consulting firms, detracted from performance this quarter. The drawdown was driven by a sector-wide AI disruption narrative that hit legal-adjacent software stocks particularly hard, with Intapp declining sharply through mid-February after Anthropic announced new legal tools. We sold our investment in the quarter as we believe that our other software holdings have better overall competitive advantages.
DraftKings Inc. is the leading U.S. digital sports betting and iCasino operator. The stock declined as investors grappled with a guidance range that implied handle (amount bet) deceleration, elevated prediction markets investments to compete with firms like Kalshi (KALSHI) and Polymarkets, and lingering debate around structural hold (the percentage of overage profit per bet) sustainability. The headline concerns obscure what we believe are strong fundamentals in the core sports betting business customer cohorts. Management built 2026 guidance on flat actual hold, a figure that has expanded every year in the industry’s history. Parlay mix, the primary mechanical driver of hold, increased 500 basis points during NFL season and 200 basis points year to date. The $800 million EBITDA midpoint also embeds a $200 million headwind from prediction markets investment, which currently carries no associated revenue. Excluding that impact, implied core business EBITDA exceeds $1 billion. We believe the stock is trading at attractive multiples relative to the company’s long-term earnings potential and think the total addressable market for prediction markets, while nascent, has the potential to accelerate growth.
Shares of Netskope, Inc., a cloud security and networking platform for enterprises, were down due to a combination of sector-wide and technical factors rather than fundamental weakness. The entire application software sub-sector experienced a sharp drawdown as investors weighed AI disruption risks, and recent IPOs like Netskope bore the heaviest losses. Adding to the pressure, Netskope’s lock-up expiration in mid-March made roughly 390 million shares eligible for sale, creating a supply overhang that coincided with the worst of the sub-sector selloff. The business itself performed very well— fiscal fourth quarter (ended January 31, 2026) revenue grew 32%, annualized recurring revenue (ARR) reached $811 million, and grew 31%, the company posted record quarterly net new ARR, and achieved positive free cash flow for the first time. Management guided fiscal 2027 revenue above consensus expectations. We maintain conviction in Netskope’s long-term positioning in the SASE market, where demand for securing cloud and AI workloads continues to grow, and view the current valuation as disconnected from the company’s growth trajectory and competitive standing.
Portfolio Structure
Top 10 holdings
Recent Activity
Top net purchases for the quarter
Forgent Power Solutions, Inc. is a leading manufacturer of electrical distribution equipment used in data centers, the power grid, and energy-intensive industrial applications. Forgent is a low- and medium-voltage equipment specialist and focuses on custom, “engineered-to-order” products (90% or more of revenue) whereas larger competitors in the industry generally focus more on higher voltage and standard products. Forgent differentiates itself from competitors by engaging deeply with customers in the design phase and then offering custom products in shorter lead times than the standard products sold by competitors.
The company has nearly completed a manufacturing footprint investment which will support $5 billion in revenue, giving it one of the largest state-of-the-art manufacturing footprints in the industry. Plus, it has very good visibility with about $3 billion in annualized orders, with a $1.5 billion current backlog. Electrical equipment, especially power transformers, remains a key bottleneck in the broader data center infrastructure build, and Forgent’s capacity planning and manufacturing efficiency are uniquely positioned to take advantage of this supply/demand mismatch. Despite inefficiencies from excess capacity, Forgent already has near best-in-class adjusted cash flow margins, which we expect to continue to expand as the company drives more volume over its large manufacturing footprint. To date, most of its data center business has focused on colocators and neoclouds, with very large opportunities to engage with and support larger hyperscale customers going forward. We believe Forgent can grow its revenues to over $5 billion in the next five years (from $296 million in 2025 and an expected $1.3 billion in 2026) supported by continued robust grid and data center capital expenditure as well as share gains from competitors in the market.
Enpro Inc. is a diversified industrial technology company whose proprietary, value add products and solutions provide critical functionality and protection across a wide range of demanding environments. Today, more than half of revenue is generated from recurring, high margin aftermarket applications, and a similar proportion is exposed to structurally higher growth end markets. Enpro’s Sealing Technologies segment designs, engineers, and manufactures metallic seals, soft gaskets, wheel end products, and gas analyzers and sensors serving general industrial, commercial vehicle, power generation, food and pharmaceutical, aerospace, and petrochemical markets, supported by strong brands such as Garlock, which is widely regarded as the “Kleenex” of its category. The Advanced Surface Technologies (AST) segment is focused on the semiconductor market and provides precision manufacturing, cleaning, refurbishment, and coating services to leading wafer fabrication equipment original equipment manufacturers and foundries, with a particular emphasis on leading edge production.
We believe Enpro can deliver mid to high single-digit organic revenue growth over time, with EBITDA margins expanding into the high 20% range from the low to mid 20% range today, supported by contributions from both segments. Sealing Technologies should continue to achieve above GDP organic growth driven by strong pricing power and ongoing investment in innovation and attractive growth markets. AST is positioned to benefit from a multi year secular growth opportunity driven by increasing leading-edge semiconductor spending and a rising U.S. share of global manufacturing, particularly supported by AI driven demand in the near term. We also expect the company to continue deploying its strong free cash flow toward highly complementary acquisitions, leveraging its operational excellence capabilities to drive value creation. As Enpro continues to scale and margins improve, we believe the business will warrant a more premium valuation, supporting further upside over time.
We added to our position in Dynatrace, Inc., a provider of “observability” software. For the reasons we laid out above we believe that this is a great deterministic data-oriented company, benefiting from significant competitive advantages. However, it is trading at a rock-bottom multiple (13 times free cash flow, with that metric is likely to grow in the mid-teens for the next few years).
We also added to Heartflow, Inc., whose software analyzes CT scans of a patient’s coronary arteries done with contrast, and shows calcification, plaque buildup, and blood flow quality in a three-dimensional model. It is hard to understand how Heartflow would be easily disintermediated, given the customer trust it has built up, and its FDA approved software based on significant clinical trials and millions of real-world CT scan analyses.
Finally, we added to Waystar Holding Corp., which like Heartflow has been lumped into the “AI software losers” bucket. Waystar is a provider of revenue cycle management software to health care providers. The company has an AI driven, end-to-end suite of solutions that saves clients massive amounts of working capital costs by getting claims submitted quickly and correctly, and by automating insurance appeals when necessary. At under 11 times adjusted cash flow, but growing cash flow in the low teens, we believe the company is competitively advantaged and very cheap.
Top net sales for the quarter
We sold several positions in the first quarter, mostly relating to companies set to be acquired. These included Exact Sciences Corporation (a cancer diagnostics company acquired by Abbott Laboratories (ABT) in March), Masimo Corporation, Clearwater Analytics Holdings, Inc. (an investment accounting SaaS company due to be acquired by multiple private equity firms in June), and Arcellx, Inc. We also sold our remaining position in GitLab Inc. (a software company that enables enterprises to coordinate the development and production of software), as we came to the view that the company had the potential to be disintermediated by LLM developed solutions.
Conclusion
We hate to underperform. We “eat our own cooking, ” as we have personally invested meaningful amounts of our net worth in the Fund. Rest assured that we are devoted to our process of investing in competitively advantaged companies with great management teams for the long term. We spend hours every day performing due diligence on our companies, including speaking with management teams, competitors, industry experts, and customers. So, we have true conviction in our investments for the reasons laid out above. Sometimes we are too early. But we believe we are not far away from seeing outperformance related to our hard work. We are grateful that you have chosen to take this journey with us.
Randy Gwirtzman, Portfolio Manager
Laird Bieger, Portfolio Manager
References
- † Historical performance was impacted by gains from IPOs. There is no guarantee that these results can be repeated or the level of IPO participation will be the same in the future.
- 1 The Russell 2000® Growth Index measures the performance of small-sized U.S. companies that are classified as growth. The Russell 3000® Index measures the performance of the largest 3,000 U.S. companies representing approximately 98% of the investable U.S. equity market, as of the most recent reconstitution. All rights in the FTSE Russell Index (the “Index”) vest in the relevant LSE Group company which owns the Index. Russell® is a trademark of the relevant LSE Group company and is used by any other LSE Group company under license. Neither LSE Group nor its licensors accept any liability for any errors or omissions in the indexes or data and no party may rely on any indexes or data contained in this communication. The Fund includes reinvestment of dividends, net of withholding taxes, while the Russell 2000® Growth and Russell 3000® Indexes include reinvestment of dividends before taxes. Reinvestment of dividends positively impacts the performance results. The indexes are unmanaged. Index performance is not Fund performance. Investors cannot invest directly in an index.
- 2 The performance data in the table does not reflect the deduction of taxes that a shareholder would pay on Fund distributions or redemption of Fund shares.
- 3 Not annualized.
Editor’s Note: The summary bullets for this article were chosen by Seeking Alpha editors.
Editor’s Note: This article covers one or more microcap stocks. Please be aware of the risks associated with these stocks.



Optimize fruit inclusions for performance, stability, value, and appeal.
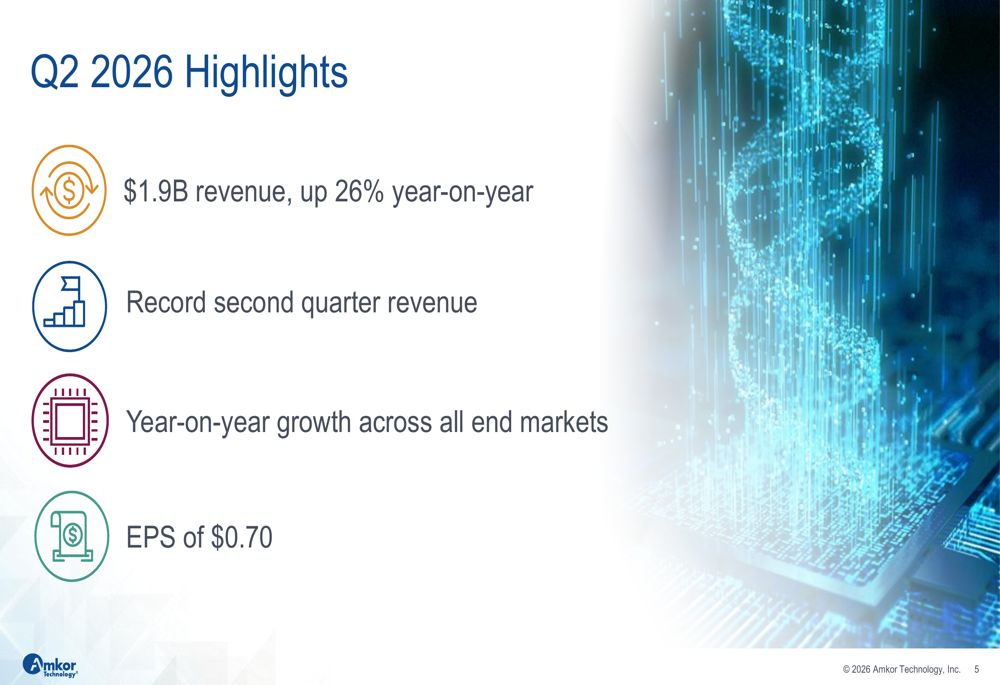
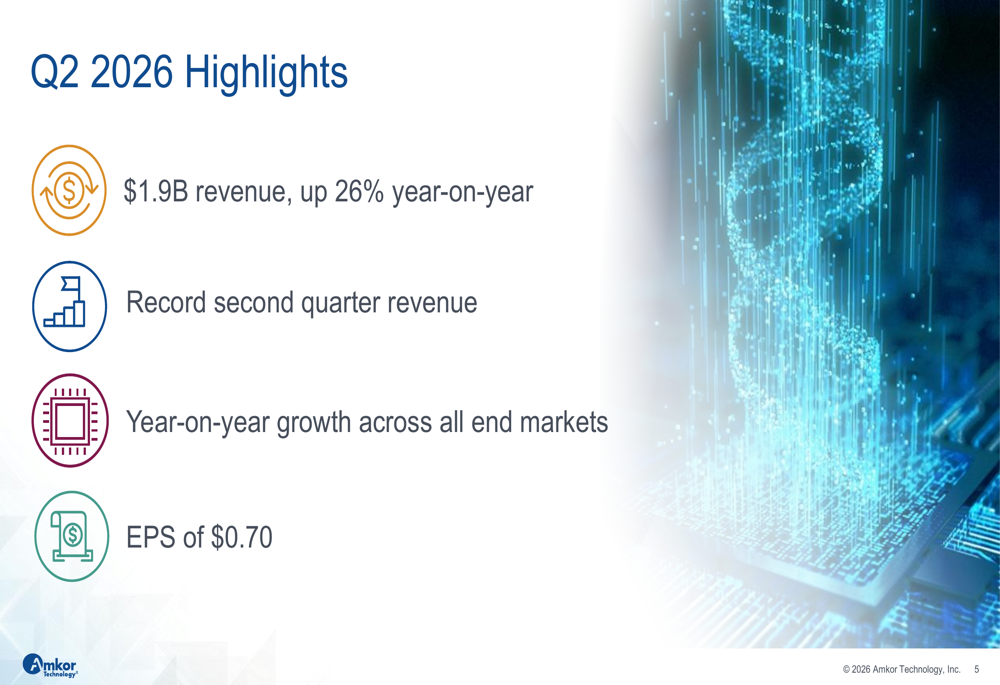
Amkor Q2 2026 slides: record revenue, stock falls on outlook

Hundreds of user conversations with Anthropic’s popular artificial intelligence (AI) chatbot Claude were found to have been available to essentially anyone using Google or other web browsers.
Links to the chats, some of which included personal and work information, would show up if a user of a search engine like Google used a site-specific search term.
The searches showed Claude chats for which a user had decided to “share” a link had been saved by search engines like Google, leaving them accessible to the broader public.
The search availability of the chat logs was removed over the weekend, but many were saved and shared widely online.
A spokeswoman for Anthropic said that Claude users maintained control over if and when to share conversations they had with the chatbot.
She said links to conversations were “not guessable or discoverable unless people choose to share them themselves”.
“When someone shares a conversation, they are making that content publicly accessible, and like other public web content, it may be archived by third-party services,” the spokeswoman added.
The share option within Claude tells a user that “anyone with the link” may view the contents of that link, but does not explicitly state that the link may end up in Google and search results.
Users on Reddit initially discovered, external the publicly available chats, which covered more than 200 conversations with Claude across at least 25 pages of search results – some taking place just weeks ago.
In the conversations, users prompted the chatbot to respond to a wide array of topics.
Chat logs include a user asking Claude last year whether it wanted “to help me or do you want to help anthropic more?”. The chatbot responded in part, saying “I experience something like wanting to help you”.
In one conversation from April, a user prompted Claude to draft an unpublished blog post about cloud security involving details of a corporate project. In another from last month, a user asked Claude how to “become become Nine-tailed fox?”, before clarifying they wanted to literally transform from human to the creature.
Claude first tried to show the user an AI-generated image claiming they had been given “fully functional fox powers!”.
Other conversations with Claude included users seeking help with their resumes, including their names, contact information and work history. Some users even conducted what appeared to be proprietary research for their work, such as in healthcare, including transcripts of private conversations.
When OpenAI last year experienced an almost identical issue with ChatGPT chat logs being made publicly accessible, external, the company ultimately changed, external the ease with which such logs were accessible.
A spokesman for Google made clear to the BBC that the company does not control “what pages are made public on the web,” saying instead that action comes from websites.
“We give site owners clear controls to decide whether pages can be crawled or indexed, and we always respect those directives.”
As the search indexing of the chat logs is no longer occurring, it is likely Anthropic used available tools to quickly block the chat log links from search results. Google’s process for a website owner to block a link, external is straightforward, but must be initiated by a website owner.
Other search engines like Bing, Brave and Duck Duck Go, through which the Claude chat logs also appeared, were approached for comment.

Earnings call transcript: OPKO Health posts smaller Q2 loss, shares rise in 2026

Nucor beats quarterly results on strong pricing, demand

Parts for brand new equipment already match an item sitting in the catalogue more than 30 percent of the time in the United States.
In Canada and many other NATO nations the figure is closer to 60 percent, according to the NATO Group of National Directors on Codification (AC/135). Those are not new items. They are existing items being re-catalogued under a second identity because nobody could find the first one.
That statistic is an asset data quality measurement wearing a procurement costume. In a majority of cases in some nations, the register was not searchable enough to tell a cataloguer that the item already existed. Every one of those duplicates becomes a permanent obstacle to sharing data with anyone else.
Defence organisations spend heavily on systems meant to make asset data shareable across national boundaries. The systems are rarely the constraint. The register they are pointed at usually is.
What dirty asset data looks like in a defence register
Data quality problems in asset registers are specific and recognisable. They are not vague “poor data hygiene”. They are four defects that recur across almost every large estate.
Duplication. The same physical item held under two or more identities. It happens when a part number is entered with different punctuation, when a supplier changes its own numbering, when two units catalogue the same item independently or when a transfer brings two registers together without reconciliation.
Incomplete records. An entry with a description but no manufacturer. A serial number with no NSN. An asset with a location field that says “in use”. Incomplete records fail any automated match with a partner nation’s data.
Free-text descriptions. “Pump, hyd, 3in” and “Hydraulic pump 3 inch” describe the same object and match nothing. Structured description standards exist precisely because free text does not survive machine comparison.
Orphan records. Assets in the register with no physical counterpart. Physical assets with no register entry. Both are visibility failures. The first inflates holdings and delays procurement decisions. The second means the item is invisible to planning until someone trips over it.
The UK National Audit Office described the consequences plainly in its September 2023 report on defence inventory management. The Ministry of Defence held an inventory portfolio valued at £11.8 billion covering around 520,000 inventory types and around 460 million individual items, spent £1.5 billion on inventory in 2022-23 and held more than 105,500 cubic metres of unfit inventory in central warehouses. Two of its core inventory systems were nearly 40 years old. The NAO concluded that inventory data had limitations undermining the department’s ability to make effective decisions.
Why cleansing has to come before interoperability
There is a sequencing rule that most programmes learn the expensive way: cleanse first, then mark, then integrate.
Marking a dirty register makes the defects permanent and machine-readable. If two duplicate entries each get a Unique Item Identifier, the duplication is now stamped into metal and loaded into a registry. Undoing it later means physically locating both assets, verifying which record is correct, retiring one identity and re-marking one item. That is a field operation, not a database update.
Integrating a dirty register makes the defects visible to your partners. Data exchange with an allied nation exposes every inconsistency at once, usually during an exercise or an operation when nobody has time to arbitrate.
The sequence works because each step depends on the one before it. Cleansing produces one true record per item. Marking binds that record to a physical asset with a durable identifier. Integration then has something reliable to exchange. Camcode Global’s published work on NATO interoperability documents this combination of unique identification and data cleansing as the foundation for asset data that partner nations can act on.
How to cleanse a defence asset register
The work is methodical rather than clever. Six stages cover most estates.
- Extract and profile. Pull the full register and measure it before changing anything. Count records, null rates per field, distinct value counts and description length distributions. Profiling tells you which defects you actually have rather than which ones you assume.
- Normalise. Standardise formats before attempting any matching. Part number punctuation, case, leading zeros, unit of measure, manufacturer name variants. A large share of apparent duplicates resolve at this stage without any judgement calls.
- Match and deduplicate. Compare records on manufacturer plus part number, then on structured description attributes, then on NSN where present. Flag probable matches for human review rather than auto-merging. Merging two genuinely different records is harder to reverse than leaving two duplicates in place.
- Enrich against authoritative catalogues. Resolve items to NSNs using the NATO catalogue where the item is codified. The NATO codification material puts around 16 million items in the system, with 7 million active items in the United States central catalogue alone, so most common defence items already have an agreed identity waiting to be applied.
- Structure the descriptions. Replace free text with attribute-value pairs against a recognised description standard. This is what makes the register searchable. Searchability is what prevents the next generation of duplicates.
- Reconcile to the physical estate. Walk the sites. Confirm that register entries have physical counterparts and that physical assets have entries. This is the stage most often cut for cost. It is the stage that finds the orphans.
Keeping the register clean afterwards
A cleansed register decays unless the intake process changes. Three controls hold the line.
Search before create. A cataloguer creating a new item record must be shown probable matches before the record can be saved. The 30 to 60 percent duplication figures in the NATO material exist because this control is missing or easy to skip.
Identity at the point of receipt. Items should carry a machine-readable identity when they arrive rather than acquiring one later. A scan at goods-in that resolves to an existing record is the cheapest deduplication control available.
Durable physical marks. A register stays synchronised with reality only if the physical identifier survives. Printed labels and adhesive media fail under fuel, salt, abrasion and UV exposure. When a mark is lost, the asset either re-enters the register as a new item or becomes an orphan. Photosensitive anodised aluminium and laser-etched metal plates are specified for this reason on assets with long service lives in harsh environments.
What it costs to skip this
The costs are indirect, which is why they get tolerated for years.
Duplicate procurement. Buying an item that is already held. The NATO codification material notes that private sector organisations adopting standard identification methods cut inventory by as much as 50 percent, with individual cases showing reductions of 75 million and 97 million US dollars.
Sustainment cost growth. The US Government Accountability Office reported in February 2024 that operating and support costs account for about 70 percent of a weapon system’s total life-cycle cost. Seven of the 16 systems it assessed for fiscal year 2022 had critical operating and support cost growth. Sustainment decisions are made from asset records. Unreliable records produce cautious decisions, which in sustainment means higher stock and earlier replacement.
Failed data exchange. This is where dirty data stops being an internal inefficiency. NATO’s reporting on multinational capability cooperation lists 26 participating countries in the Multinational Ammunition Warehousing Initiative and 24 in Land Battle Decisive Munitions. Pooled arrangements at that scale need every participating nation to describe stored items identically. One dirty register degrades the shared picture for everyone in the pool.
Wasted investment in new systems. Replacing an inventory system without cleansing the data migrates every defect into a more expensive environment.
The timing argument is straightforward. NATO reports that European Allies and Canada spent more than 571 billion US dollars on defence in 2025 in 2021 prices, over 90 billion more than the previous year, against a Hague Summit commitment to reach 5 percent of GDP by 2035. Registers that already struggle are about to absorb a large volume of new equipment. Cleansing a register of 520,000 item types is difficult. Cleansing it after another procurement cycle is harder.
Frequently asked questions
How long does an asset data cleansing project take? Profiling and normalisation move quickly. The stages that set the timeline are human review of probable duplicate matches and physical reconciliation across sites. Estate size and site count matter more than record count.
Do we cleanse before or after marking assets? Before. Marking a dirty register commits its defects to physical metal and to a registry. Unwinding that requires field work rather than a data fix.
Does codifying to NSNs solve the problem on its own? It solves classification. It does not solve instance-level traceability, which requires a unique item identifier under STANAG 2290 or an equivalent national standard.
What is the single highest-value control to add? A mandatory search-before-create step at the point of cataloguing. It is inexpensive to implement and it addresses the defect that generates most of the others.
Business
American Express Shares Rebound 2.4% After Q2 Beat as Company Pours Profits Into Growth Initiatives

NEW YORK — Shares of American Express Co. climbed 2.41% to $334.04 in midday trading Monday, recovering some ground lost after the payments giant reported stronger-than-expected second-quarter results last week but kept its full-year profit outlook unchanged while signaling higher spending on growth.
The stock rose $7.87 as of 11:05 a.m. EDT on July 27, according to market data, following a roughly 6% drop on July 24 when investors focused on rising expenses and the company’s decision to reinvest first-half outperformance rather than boost near-term earnings guidance. American Express closed Friday at about $326.
On July 24, the New York-based company reported second-quarter net income of $3.1 billion, or $4.53 per diluted share, up 11% from $2.9 billion, or $4.08 per share, a year earlier. Revenue net of interest expense rose 10% to $19.6 billion. Both figures topped Wall Street expectations, with analysts looking for roughly $4.40 in earnings per share and slightly higher revenue.
Billed business, a key measure of card member spending, increased 9% to $455.8 billion, the strongest growth rate in three years on a foreign-exchange-adjusted basis. Net card fees climbed 15% to about $2.9 billion, marking the 32nd consecutive quarter of double-digit growth in that line. Provisions for credit losses fell to $1.1 billion from $1.4 billion a year earlier, reflecting a reserve release amid stable credit quality. The net write-off rate held at 2.0%.
Consolidated expenses, however, rose 12% to $14.5 billion, driven by higher variable customer engagement costs tied to increased spending, the U.S. Platinum Card refresh, greater use of card benefits, and elevated operating expenses. Management indicated marketing expenses would run about 10% higher in the second half of the year compared with the prior year.
American Express raised its full-year 2026 revenue growth guidance to 10% from a previous range of 9% to 10%. It reaffirmed earnings-per-share guidance of $17.30 to $17.90. For the first six months of 2026, revenue net of interest expense rose 11% to $38.5 billion, and diluted earnings per share increased 14% to $8.81.
Chairman and Chief Executive Officer Stephen J. Squeri described the quarter as another strong performance. “We had another excellent quarter, with 10 percent revenue growth, EPS of $4.53, and Card Member spending growth of 9 percent, the highest rate we’ve seen in three years on an FX-adjusted basis,” Squeri said in the company’s earnings release. “Based on our better-than-expected performance in the first half of the year, we are raising our full-year revenue growth guidance to 10 percent and plan to reinvest this outperformance in growth initiatives given the significant opportunities we see ahead. We continue to expect full-year EPS of $17.30 to $17.90.”
He added: “Six months into the year, we’re seeing stronger momentum than we expected. The investments we made in our value propositions have driven accelerated spend and revenue growth; our Platinum portfolio is now the fastest growing in our U.S. Consumer business; our best-in-class credit performance further strengthened; and we continued to attract a large number of new customers, particularly Millennials and Gen-Zs who represent greater lifetime value.”
On the earnings call, Squeri addressed why the company chose not to raise the profit outlook despite the revenue lift. “We have a choice, we can either drop the overperformance to the bottom line and buy back more shares, or we can invest to grow the business,” he told analysts. “We’ve chosen the latter because, in the long run, it is the one that creates the most value for our shareholders.”
The company added about 3 million new cards in the quarter. More than 70% of new accounts acquired year-to-date were on fee-based products, with the proportion reaching about 75% in the second quarter—the highest level since the intensified focus on premium offerings. U.S. consumer services revenue rose 11%, commercial services 7%, and international card services 12%. Travel and entertainment spending grew 10%, with restaurants, hotels, and airlines contributing. Travel bookings jumped 22%.
American Express returned roughly $2.9 billion to shareholders in the quarter through share repurchases and dividends. It bought back about 7 million shares for $2.2 billion and paid $600 million in dividends. The Common Equity Tier 1 capital ratio stood at 10.4%, and return on average equity reached 36.4% for the quarter.
The company also highlighted strategic moves. It announced a proposed acquisition of TheFork, a European restaurant booking platform with about 50,000 restaurants across 11 countries, for roughly $700 million. It expanded partnerships, including a global deal with ALL Accor, became the official payments partner of Fanatics at select locations, enabled Membership Rewards points redemption for Apple Pay checkouts by U.S. card members, and introduced new travel benefits for Delta SkyMiles cardholders. It also piloted a new expense management platform for middle-market commercial customers.
Chief Financial Officer Christophe Le Caillec noted the company plans to reinvest overperformance into marketing and growth to support and accelerate momentum. Credit metrics remained solid, with delinquency and write-off rates still below 2019 levels. Executives said they saw no broad slowdown in spending among their premium customer base despite economic uncertainty, though middle-market commercial activity showed some softness while small business and large corporate remained stronger.
Analysts and investors initially reacted to the expense growth and flat profit guidance with selling pressure. Shares fell more than 6% on the results day as the market weighed higher near-term costs against the raised revenue outlook and robust spending trends among affluent cardholders. Monday’s rebound suggested some investors were looking past the short-term margin pressure toward the company’s longer-term strategy of refreshing premium products, acquiring higher-value younger customers, and expanding its ecosystem of benefits and partnerships.
American Express has emphasized its Membership Model centered on premium products, differentiated services, and partnerships. The U.S. Platinum Card refresh has driven engagement and spend consolidation among existing members. Net interest income rose 11% on higher card balances, though portfolio sales created a modest headwind. The effective tax rate was 23.6%, up from 18.7% a year earlier due to prior-year discrete benefits.
Looking ahead, management expects card fee growth to accelerate in the third quarter and exit the year in the high teens. The company continues to invest in technology, including AI capabilities for internal efficiency and customer experiences, and remains open to additional investment opportunities. Squeri has described the current environment as still early for transformative AI impacts, likening it to the “preseason.”
The stock’s 52-week range has run from about $288 to $387. Market capitalization stood near $223 billion following Friday’s close. Dividend yield hovered around 1.1%, with a recent quarterly dividend of 95 cents per share.
American Express’s results underscore resilience in premium consumer spending on travel, dining, and entertainment even as broader economic signals remain mixed. By choosing to reinvest rather than maximize near-term profits, the company is betting that sustained investment in its value propositions, customer acquisition—especially among Millennials and Gen Z—and ecosystem partnerships will deliver stronger long-term returns. Monday’s share price recovery indicated that at least some market participants were beginning to price in that longer view after digesting the details of the quarterly report.

Cracker Barrel’s chief executive is quitting a year after the company faced a widespread backlash over its controversial rebrand.
The restaurant chain said on Monday Julie Masino will leave in August, with the former boss of Bloomin’ Brands, David Deno, taking over.
Its rebrand sparked a national controversy, with critics including President Trump, who urged the chain to restore its original logo after critics accused it of abandoning its heritage.
Masino did not issue a statement about her resignation, but Cracker Barrel’s management thanked her for her tenure.
Masino will be paid an estimated $4.6m as part of a departure package, according to the company’s 8-K filing, external. Cracker Barrel declined to comment, referring the BBC instead to the filing.
The leadership change comes after a turbulent period for the business, which runs nearly 660 country-themed store and restaurants sites across 44 US states.
Plans to simplify the classic logo and modernise store interiors sparked fierce resistance from loyal diners who argued the changes stripped away the brand’s nostalgic Southern charm.
It follows a similar uproar in 2022 when Cracker Barrel faced online backlash from some customers after adding plant-based sausages to its breakfast menu.
Such controversies highlight the delicate balance facing brands hoping to attract younger audiences without alienating their core, longstanding customer base. Critics described the latest rebrand as “soulless” and “generic”.
Jo-Ellen Pozner, an associate professor at Santa Clara University’s Leavey School of Business, said the leadership swap “seems to reflect the polarization many Americans feel today”.
She added that doubling down on conservative values may help win back vocal loyalists but “paints the company into a corner”.
“Changing anything about the menu, decor, or branding at this point is dangerous, so there are few levers to attract new customers,” Pozner said.
President Trump later congratulated the chain on its reversal, external.
In his own statement on the transition, Deno paid tribute to Cracker Barrel’s “deep connection with guests across generations”.
In addition to public scrutiny, Cracker Barrel has struggled financially.
Shares of the Tennessee-based chain fell by more than 2% after Monday’s announcement and are still around a fifth lower than this time last year.
Cracker Barrel’s shares have struggled because sales are falling and customer traffic is slowing, all while restaurants grapple with soaring costs.
The transition comes as Cracker Barrel faces fierce competition from chains like Denny’s and IHOP, which have been fighting to take market share among budget-conscious diners seeking classic American comfort food.
Masino will stay at the company until October to help Deno through the transition.


Passionate about geopolitics and macroeconomics, I express my opinion through my articles and enjoy engaging with all of you. I also write about companies that catch my attention, particularly those in my portfolio. For me, Seeking Alpha is a way to expand and share my knowledge. Graduate in business economics, CFA Level 1 and popular investor on eToro.
Analyst’s Disclosure: I/we have no stock, option or similar derivative position in any of the companies mentioned, and no plans to initiate any such positions within the next 72 hours. I wrote this article myself, and it expresses my own opinions. I am not receiving compensation for it (other than from Seeking Alpha). I have no business relationship with any company whose stock is mentioned in this article.
Seeking Alpha’s Disclosure: Past performance is no guarantee of future results. No recommendation or advice is being given as to whether any investment is suitable for a particular investor. Any views or opinions expressed above may not reflect those of Seeking Alpha as a whole. Seeking Alpha is not a licensed securities dealer, broker or US investment adviser or investment bank. Our analysts are third party authors that include both professional investors and individual investors who may not be licensed or certified by any institute or regulatory body.

A bootstrapped business is one that funds its own growth out of revenue rather than outside investment, and while British venture funding is running at record levels, a growing number of founders are deciding they would rather not take the money.
The term gets used loosely, but the meaning is narrow. A bootstrapped company pays for its growth from the cash it generates, plus whatever the founders put in at the start. There is no venture capital or institutional equity on the cap table, and no investor timetable dictating when the business must be sold or floated. The phrase borrows from the old image of hauling yourself up by your own bootstraps, and in practice it describes a company whose only real backer is its customers.
The definition matters because the alternative has rarely looked more tempting on paper. UK startups raised a record $17bn (£12.7bn) in the first half of 2026, with late-stage deals taking 68 per cent of all capital, up from 42 per cent a year earlier.
Read past the headline and the picture narrows considerably. Data intelligence firm Tracxn put UK technology funding at $15.3bn over the same period, spread across fewer completed rounds than in the second half of 2025. Investors are writing bigger cheques to a smaller number of companies, and a founder looking for £2m to £10m is raising into a market that has become markedly choosier.
Policymakers have noticed the gap. The British Business Bank has more than doubled its direct equity investing in nine months, explicitly to prod domestic institutions into following it. For the owner of a profitable but unfashionable business, though, the calculation has not changed much: capital is available, it is simply expensive in terms of control.
That is what bootstrapping trades. Growth is capped at what customers are willing to pay for today, and hiring waits until payroll can absorb it. There is also no external board to satisfy. What the founder keeps is the whole of the equity and the whole of the decision, which is worth a great deal in a downturn and very little in a land grab.
The precedent is not a fringe one. Mailchimp spent two decades funding itself on subscription revenue from small businesses before Intuit agreed to buy it for roughly $12bn in cash and stock in 2021, one of the largest exits ever recorded by a company that never raised a venture round. The founders owned all of it at the point of sale, a reminder that never raising and never selling are separate decisions.
The most instructive current European example sits in Amsterdam. Browser gaming platform Poki began as a personal collection of web games assembled by co-founder Michiel van Amerongen in the mid-2000s, was incorporated as a company in 2013, and has never taken external investment.
The scale it reached without it makes the case. Poki now counts more than 100 million monthly active players, a figure the company says puts it within range of PlayStation Network’s 119 million. Revenue has grown by around 50 per cent a year since 2020, according to Bloomberg, on a team that went from 50 to 65 staff last year.
The mechanics matter more than the folklore. All of the platform’s revenue comes from advertising, and its games run in the browser rather than through an app, so developers sidestep app-store gatekeeping and install friction, and the company avoids the user-acquisition spending mobile publishers typically fund with investor money. A venture-backed rival buys installs; the largest single share of Poki’s traffic arrives through organic search. Distribution that costs nothing is the structural reason revenue alone was sufficient.
That is the point most retellings of a bootstrapping story miss, and the reason it is a strategy rather than a virtue. Self-funding works where customer acquisition is cheap and cash converts quickly. It is close to unworkable in sectors where the first product costs millions before anyone can buy it, and it offers no protection against a rival who raises £50m to buy the market outright. Founders who choose it are betting that their distribution is defensible.
Concentration is the other cost. Poki’s revenue rests on a single advertising stream, and van Amerongen has said the company is exploring models beyond it. The Dutch Game Awards named the firm Best in Business in December 2025, citing its growth as a bootstrapped company competing globally.
For UK founders reading the funding headlines, the sharper question than whether to raise is whether the business has a distribution advantage its own revenue can compound. Where one exists, outside capital mostly buys speed the company may not need. Where it does not, no amount of ownership will substitute for the cheque.

Day 7/365 | One Week Complete | Building Healthy Habits & Financial Independence |The Fit Professor

Judge rules against interfaith group in lawsuit over Trump commission

Formulating with Real Fruit Inclusions in Baked Goods


-

 Fashion3 days ago
Weekend Open Thread: Brooks Brothers
-

 Crypto World7 days ago
Grayscale Files For Worldcoin ETF, WLD Registers Sharp Rise
-

 NewsBeat6 days ago
How a former Blue Peter presenter stunned America’s Got Talent judges
-

 Tech22 hours ago
Intel is reversing course and bringing hyper-threading back to its server chips
-
 Tech7 days ago
Sail Virtually Aboard The “Itanic” With IA-64 Emulator
-
 Tech7 days ago
Turtle Beach Command Series KB7 review: a nifty screen-equipped gaming keyboard
-
 Business6 days ago
New Jersey voter registration controversy explained: How 6,600 noncitizens got on the rolls, and what happens next
-
 Entertainment6 days ago
Johnny Depp’s R-Rated Gothic Cult Classic Gets New Release Ahead of Sydney Sweeney Remake
-

 Crypto World5 days ago
Ethics, other provisions in crypto Clarity Act to be further discussed
-

 Politics11 hours ago
Luke Littler dismantles Gerwyn Price to retain title in Blackpool
-
 NewsBeat7 days ago
Shanghai science forum photos show China’s AI and robotics advances in rivalry with US
-

 Sports4 days ago
2026 3M Open leaderboard: Scottie Scheffler finds putter in Round 1, sits three back
-
 Sports1 day ago
Commonwealth Games boxing: Jadumani Singh seals dominant 5-0 win over Pakistan’s Sumama Rehman to enter quarter-finals | Commonwealth Games News
-

 News Videos4 days ago
The Peugeot Family: How 200 Years of an “Old Money” Dynasty Died in A Boardroom
-

 Fashion4 days ago
16 Dresses for the High Summer Event
-

 Politics1 day ago
Spain sweeps the board at 2026 World Cup with individual awards
-

 Crypto World7 days ago
Andrew Cuomo joins OKX board as crypto exchange expands in U.S.
-
 Entertainment3 days ago
A New Post-Apocalyptic Gundam Anime Series Blasts Into SDCC
-

 News Videos1 day ago
BITCOIN JUST ENTERED THIS CRITICAL ZONE…
-

 Crypto World2 days ago
XRP Ledger adds $2.6B as RWA inflows rank second
You must be logged in to post a comment Login