

Business
Generation PMCA Q4 2025 Quarterly

Donny DBM/iStock via Getty Images

Top-Down and Bottom-Up
Investors typically fall into two camps. They are either top-down, guided by macro views and often taking thematic slants, or bottom-up, ignoring the big picture to focus on individual securities. We have always conducted analysis across the spectrum. Our goal is to select undervalued securities by thoroughly analyzing each individual company. But we also evaluate the overall economic environment, to alter our portfolio approach, especially when our macro alerts trigger.
We developed proprietary tools and formalized a four-pillar approach several years ago. Two pillars are top down: TRIM™ (our Indicator of Momentum to alert us to material market declines) and TEC™ (our Economic Composite to spot recessions). The other two pillars are bottom up: value (to determine price to Fair Market Value) and TRAC™ (to optimize entry and exit points).
During most periods, bottom-up analysis suffices because the economy is humming along; however, we specifically built our macro tools to provide us with alerts when the likelihood of macroeconomic issues overwhelming markets is high. Though, in our view, one should not vacillate between being fully invested or entirely in cash. Certain companies ought to be owned through thick or thin, otherwise the upside might be missed. Conversely, a top-down view can assist in avoiding positions that may suffer as the economy softens and markets are pressured.
Best of Both Worlds
Since TEC™ is still alerting us to a potential recession, we have maintained our hedging strategies, continuing to hold short positions (where authorized) or inverse long ETFs. We aren’t just concerned with the potential for a near-term peak in the economic cycle, but the markets are overvalued and inflecting from TRAC™ ceilings. Certain segments, such as technology, are experiencing significant overspending, housing is already in a downturn from prior excesses, and economic and geopolitical policies are creating instability.
Although, when uncertainties rise some securities decline unduly. This allows us to build portfolios of quality companies that trade down to levels that are attractive discounts to our FMV estimates. Even without a recession, undervaluations often occur when specific sectors come under scrutiny or because of company-specific news items or rumours. Investors often sell when issues arise, without taking the time to evaluate situations. Furthermore, selling begets selling as fear overpowers rational behaviour. As bottom-up analysts, we welcome these opportunities to take advantage of short-term price declines from what we believe are temporary issues until misperceptions dissipate.
Using both approaches, we can hedge based on a negative macro-outlook, avoid cyclical companies when a recession is expected, and embrace undervalued quality companies that ought to do well, even in a downturn.
Top Heavy
We’re expecting a recession because the yield curve previously inverted, monetary growth is anemic, economic statistics have waned, and unemployment should rise. Even in the absence of a recession, overall economic growth could soften for a prolonged period.
Population growth—the driver of economic growth—is in reverse. The U.S. is now experiencing net emigration—more people are leaving than coming—which hasn’t occurred since 1935. Not just as a result of record deportations but also because Americans are departing in record numbers. It may get worse. A recent Gallup survey showed 20% of Americans want to live elsewhere, up from 10%, even in the 2008 recession. Canada’s population suffered the largest quarterly drop since the 1940s. This is exacerbating the already poor demographics—an ageing population because baby boomers are a disproportionate cohort and fertility rates are too low to keep pace with deaths. Other regions, such as Asia (China, Japan, and South Korea) and Europe (Italy, Greece, and Portugal) are suffering declining populations too.
Basic economics suggests that population growth leads to growth in unit volumes which in turn leads to expanding sales, profits, and share prices. If populations don’t grow, the rest doesn’t easily follow. Immigration, albeit done properly, is a necessity for economic growth.
For the last several years, until recently, job openings in the U.S. have consistently been well above the number of unemployed. Certain sectors (agriculture, dining, hospitality, nursing, construction, and manufacturing) could see significant labour shortages if immigration policies aren’t remedied.
Unusually, recent economic growth has been occurring without job growth. For the third consecutive quarter, more CEOs intend to cut rather than add jobs. The percentage of part-time to full-time jobs is up materially. A further sign of uncertainty amongst employers. The number of job openings also continues to fall. Now, the number of unemployed is above total job openings, which has only occurred twice in the last 30 years, both during recessions. AI has major implications for employment too. Block (SQ) just terminated 40% of its workforce citing AI and the fundamental changes it’s having on how the company operates, allowing for a much smaller team.
Excluding AI spending, the U.S. economy likely contracted in 2025. Growth in capital spending by the major tech companies is expected to be nearly 3 times 2024’s and double last year’s record high spending level. It’s so high that it is expected to be essentially on par with all incremental U.S. bank lending, or 1.6% of GDP. Meanwhile, AI companies have yet to show meaningful returns from this spending, forecasts appear overly optimistic, free cash flows are being depleted, cash hoards spent, debt is increasing, and accounting has become aggressive with depreciation terms counter-intuitively lengthened.
Real estate prices clearly topped out. Pending home sales set a record low in 2025. There’s still a record 50% more sellers than buyers. House prices should decline and rents soften. Though, ultimately, a lack of building will offset the dwindling demand.
The one likely positive impact of all this is low inflation. Disinflation should be driven by increasing unemployment, lower growth in incomes, tight monetary policy (including waning velocity of money from tighter credit conditions), stagnation in foreign economies, and the impact from AI.
The massive spending on AI could result in excess capacity—overbuilding—which would result in an additional source of disinflation. The major spenders appear to be morphing from capital light to capital intensive businesses.
Consumers’ income growth has already slowed dramatically and consumers’ balance sheets are stressed. Delinquencies for student loans along with credit card balances and auto loans have all moved much higher over the last few quarters.
Bank credit was already tightening when the recent pall over the private lending sector began. Private credit delinquencies have remained low; however, a few lender issues and media attention have caused investors to pull out funds and managers to take steps to gate (prohibit) withdrawals, insofar as these are illiquid investments, until loans mature.
All this has helped lower inflation with the U.S. core CPI rate falling to 2.5% and the Truflation rate, which tracks prices of a wide range of goods and services in real time, now below 1%, which augers well for lower interest rates and could help buoy stock and bond valuations.
From the Top
We’re now stuck with some poor economic policies.
Debt levels are too high and governments show little interest in cutting expenditures. Debt levels this high relative to GDP have been shown to suppress economic growth.
Tariffs don’t simply act as an additional tax; they also lower economic activity because they add inefficiencies, complexities, uncertainties, and suppress demand. Worse, the longer these policies persist the more it causes business to seek alternatives, including new trading partners. Trading channels are being altered. The EU inked a massive free trade agreement with India and is pursuing the same with South America. Mark Carney, while visiting Beijing, even referred to Canada’s trade relationship with China being more predictable than that with the U.S.
Looking Toppy
Returns are generally the opposite of valuations. Meaning the lower the valuations the higher the returns and vice versa.
While the average U.S. stock was somewhat reasonably valued over the last few years, the median price-to-earnings ratio for stocks broadly has now lifted to its worst decile. This lowers the return outlook for U.S. stocks to paltry figures. Whenever the S&P 500 valuation has exceeded 23x next-12-months earnings expectations, as it was over the last few months, the subsequent 10-year real return (after inflation) was essentially nil, with a range of -2% to +2% annually.
On top of this, the average S&P 500 decline from intra-year highs in midterm election years is 18%, worse than typical annual drawdowns, and this ignores the larger declines which accompany recessions.
Even steady businesses, like Costco (COST) and Walmart (WMT), trade at such lofty valuations that a decline back to an average normal trading level (12% below FMV) would imply drops exceeding 30%.
It’s not just stocks; bonds aren’t cheap either. Investment Grade U.S. corporate bonds trade at the narrowest spread (approximately 1%) to 10-year government bonds since 2007. High-yield corporate bonds are historically narrow too, just under half the historical average of 5.5%. They should yield closer to 9.5%, not around the current 6.9%. And that’s just assuming the average, in times of stress spreads expand well beyond the historical average.
Some commodities, which have risen way too far above their costs of production, could suffer too. Gold and silver trade well above where they ought to. If gold reverted to its typical premium to the average all-in cost of production it would fall by more than 50%. Once commodity prices rise this far above production costs they generally fall back to normal premiums within 24 months. Silver recently retraced 47% from its high before lifting again, and it still sits at more than 3x where it would be expected to trade based on its cost of production. Excessive trading is prevalent too. The value traded of the silver bullion ETF during the week it peaked, in late January, exceeded the grand total for every year but 5 since 2006.
Since 2011, Bitcoin has fallen by more than 50% from its highs 4 times (about every 3.5 years), and it recently declined 48% from its high. This is not a safe-haven vehicle in our view.
Once the last momentum trader gives way, true economic value reasserts itself.
Corporate insiders realize things are frothy. There were more officers and directors selling shares than buying in January than in any month in the last 5 years.
AI related stocks are trading at huge multiples of revenue.
Overpaying for a company, even a great growing company, can have a poor result, when the share price re-attaches to fair value or declines to a normal discount if it falls out of favour.
From a bottom-up standpoint, we’ve had to review far more companies than usual before finding an opportunity for purchase. A top-down created problem.
Top of the Heap
Competition has intensified in most fields. AI should heighten competitive threats.
AI lowers barriers to entry—by lowering costs and increasing rates of change—which should increase the flow of goods and services. This should erode pricing power and pressure profit margins. The advent of online stores, and their impact on brick-and-mortal retailer margins, provided an example of what might follow for many businesses.
Anthropic’s own Claude AI programs are so effective that it’s writing much of its own code and its capabilities are increasing astonishingly month by month.
A land grab is also taking place amongst AI providers. The largest competitors are spending a disproportionate amount of their cash flow on capital expenditures. In an egregious example, which could have a very poor ending, OpenAI has made over $1.4 trillion in spending commitments; however, it’s losing enormous amounts of money and requires substantial funding to meet its obligations. Meanwhile, its main product, ChatGPT, is also losing market share to Gemini, Grok, Claude, Copilot and others.
Nvidia (NVDA)’s profit margins are so attractive that many customers (Alphabet (GOOGL), Amazon (AMZN), Meta, Microsoft (MSFT), OpenAI) have chosen to design and build their own chips for AI purposes. It’s believed that this is being done at a fraction of the cost, and with more productive outcomes.
High capital spending in overly competitive areas is not a good combination. Net profit margins for the S&P 500, which are cyclical, are now at all-time highs of 13.6% yet have fallen to 8% or below on 5 separate occasions in the last 25 years.
Our Model Portfolios
Our managed accounts are invested based on one or more of our Models (particular investment strategies with notional allocations of securities). A managed account’s holdings will generally be similar to its applicable Model’s, but may not hold all of them based on client-specific factors (income requirements, tax-related considerations, requests/restrictions, and cash available for purchases) and/or market forces which impact specific investment decisions from time to time.
The following descriptions of the holdings in our managed accounts are intended only to explain the reasons that we have made, and continue to hold, these investments in the accounts we manage for you and are not intended as advice or recommendations with respect to purchasing, selling or holding the securities described. Below, we discuss each of our new holdings and updates on key holdings if there have been material developments.
All Cap Model
The All Cap Model combines selections from our large cap strategy (Global Insight) with our small and medium cap ideas. We generally prefer large cap companies for their superior liquidity and lower volatility. The smaller cap positions tend to be less liquid and more volatile; however, we may hold these positions where they are cheaper, trading at relatively greater discounts to our FMV estimates, making their risk/reward profiles favourable.
In the last few months, we bought CONMED (CNMD) and Superior Plus (SUUIF). We sold Headwater (HWXCF) because it lifted to a TRAC™ ceiling, in line with our FMV estimate. Our large cap positions are summarized in the Global Insight section.
CONMED is a medical device and equipment manufacturer. The share price has been declining over the last several years while the company grapples with supply-chain issues and competitive pressures. Its new CEO has made repairing supply-chain constraints the number one priority. Signs are emerging that the situation is improving with backorders at a 3-year low. The aim is to now build a world-class, data-driven supply chain. We see strong growth ahead for the company’s BioBrace and surgical smoke management products. BioBrace is a cutting-edge reinforced bioinductive implant used for orthopedic procedures. Because research has found that surgical-related smoke contains a mixture of harmful byproducts including dead cellular material, carcinogens, viruses, bacteria, and toxic gases, over 20 States have enacted legislation to address surgical smoke evacuation. The company offers a range of products to offset these issues. Should the stock price continue to languish, it could be an ideal takeover target for a larger medical device maker. Our FMV estimate is $60.
Superior Plus is a leading North American distributor of propane and compressed natural gas (CNG). The two markets are polar opposites. While CNG is dominated by large scale players (Superior’s 44% market share makes it the largest), because significant capital investment is required and there are regulatory complexities, propane is fragmented with large-scale distributors, including Superior, comprising just 29% of the market. In propane, cost advantages are vital. The company’s Superior Delivers initiative aims to reduce propane delivery costs through data-driven route optimization. Lower costs enhance customer value, which translates to additional customers and greater scale, further driving down unit costs. Unfortunately, Superior’s plan has encountered issues forcing management to push out expected savings to 2027. Their credibility has severely eroded, which could explain why the stock trades near a 20-year low. Ultimately, the company’s plan should result in rising cash flow, otherwise it’s likely to attract activist investors to spur on the process. Our FMV estimate is $14.
Global Insight (Large Cap) Model
Global Insight portfolios hold large cap stocks (typically with market caps over $5 billion at the time of purchase but may include those in the $2-5 billion range) where portfolios are managed Long/Short or Long only. At an average of less than 70 cents-on-the-dollar versus our FMV estimates, our Global Insight holdings appear much cheaper, in aggregate, than the overall market.
In the last few months, we have made several changes in our large-cap positions. We bought Uber Technologies (UBER) (after selling it in the previous quarter), Netflix (NFLX), Sanofi (SNY), Diamondback Energy (FANG),and Meta Platforms (META). We sold Chevron (CVX), Deutsche Post (DPSGY), Kesko (KKOYY) and GSK (GSK) after each ran up TRAC™ceilings near our FMV estimates.
Uber Technologies has been under pressure because the advent of autonomous vehicles (AVs) is viewed by the market as an existential threat. First, it will likely take many years for AVs to reach mass adoption—the World Economic Forum forecasts that less than 1% of new car sales in 2030 will have level 4 highway and urban capabilities and only 30 global cities will have significant robotaxi fleets. Second, though AVs are clearly the future, Uber has several initiatives underway to remain the platform leader as the world transitions. It recently announced Uber Autonomous Solutions, a suite of services to help partners commercialize AV technology and reduce costs for what is likely to be a highly fragmented industry as dozens of national, regional, and global companies supply AV hardware and software. Recent announcements include: Wayve (a UK-based fleet Uber will own and operate); WeRide (WRD) (a partnership with over 300 AVs on Uber’s platform by this year-end); and Apollo Go (a partnership that aims to put thousands of AVs on the Uber network in Asia and the Middle East). Meanwhile, we expect Uber’s dominant ride-share business and Uber Eats to generate substantial free cash flow, increasing toward $20 billion annually over the next 5 years. Our FMV estimate is $110.
Netflix’s battle with Paramount for Warner Bros. Discovery has all the ingredients of a great movie. Spoiler alert—Netflix bowed out of the process after Paramount raised its offer to $31 per share. While we believed that Netflix was in a win-win situation, the decision to step away demonstrated discipline and prudent capital stewardship. Netflix earns a $2.8 billion break fee and should have renewed focus on its core global streaming business which we believe has untapped potential. We expect to see more gaming, sports, live comedy, musical performances, and events such as Skyscraper Live, which drew 6.2 million views. While competition in streaming is heated, from the many competitors including You Tube, Netflix has an unparalleled content library and the ability to create differentiated original content with a genuine feel sourced in various local markets, which then caters to its diverse global userbase. Our FMV estimate is $140.
Sanofi’s Dupixent is a blockbuster medication used to treat moderate-to-severe inflammatory conditions including atopic dermatitis (eczema) and asthma. New indications should help drive high single-digit annual earnings growth through 2030. Post-2031, the company will likely see growth temporarily stall, or even decline, when it loses patent protection. Uncertainty about the post-expiry growth profile may explain why the stock trades at a relatively low multiple of this year’s expected earnings. However, the company has plans for meaningful growth beyond Dupixent with new drug revenues hitting €5.7 billion in 2025, up 34% year-over-year. Strategic acquisitions and steady performance from its vaccines business should also contribute to growth. Even if earnings decline somewhat post patent expiry, the total return could still be above 8% annualized from expected earnings growth alone, with potential upside from new drugs, acquisitions, and a revaluation once its profile is appreciated. Our FMV estimate is €100.
Diamondback Energy is a Texas-based oil and gas company focused on the Permian Basin. We view the company as a disciplined capital allocator with best-in-class execution. Diamondback exited 2025 with its best drilling efficiency and completion efficiency stats in several years and an industry-leading reinvestment rate. Its efficient operations mean that its healthy dividend ought to be protected down to $37 WTI oil; therefore, management views its dividend as a fixed obligation. We expect full-year 2026 oil production to be 500,000 daily barrels of production which should translate to $4.4 billion of free cash flow, at lower than prevailing oil prices. Since oil prices have been volatile, the share price is likely to be so as well. Our FMV estimate is $210.
Meta Platforms’ capital expenditures are expected to balloon to $120 billion this year, which equates to nearly half of the company’s revenues. Investors are right to be skeptical of this spending on AI since the company appears to have sunk tens of billions on the metaverse with little, if anything, to show for it. Unlike with the metaverse spending, we see a boost to revenues and profitability from Meta’s AI investments. AI-driven improvements and engagement increased the Q4 year-over-year growth in ad impressions by 18% and Instagram Reels watch times by 30%. We also expect cost savings from a material reduction in Meta’s workforce over the next 2 years due to AI productivity enhancements. Our FMV is $770.
Multifaceted Diversification
We also aim to limit volatility and drawdowns by combining investment strategies, especially where returns are less correlated. The goal is to outperform through economic cycles with low correlation, therefore less susceptibility, to market index declines. We can construct portfolios with multiple unique return drivers—strategies that differ in style and approach—based on bottom-up fundamentals, macro tools, or pure quantitative analysis. This can provide exposure to different styles and asset classes beyond just stock and bond indexes.
The benefits of multifaceted diversification are not only from different ways to perform but also from a portfolio comprised of strategies that are less correlated. So that when a strategy underperforms, it’s less likely to occur at the same time as another strategy, which softens the volatility and drawdowns of the overall investment portfolio.
Global Tactical Allocation Model
Our Global Tactical Allocation Model (GTAM) investment process combines macroeconomic analysis with valuation and momentum. ETFs (exchange traded funds) are used to gain exposure to 4 broad asset classes: Equities—major markets, emerging markets, sectors, styles, private equity; Fixed Income—bonds issued by governments, investment grade corporations, high-yield issuers, as well as mortgages, and bond indexes; Real Assets—real estate, infrastructure, renewable energy; and Commodities—Precious Metals or Oil. GTAM emphasizes ETFs that should outperform based on the macro environment, are selling at attractive absolute and relative valuations, possess good relative price momentum, and are at TRAC™ floors.
Current exposures are: Equities (66%); Fixed Income (15%); Real Assets (16%); and Commodities (none). Its current broad themes are U.S. technology, consumer staples, and emerging markets. Positions in U.S. software and cybersecurity were established after AI fears sent these sectors down nearly 30% from their late 2025 peaks.
Quantitative Investment Models
Quantitative equity strategies commonly select securities based on systematic, rules-based decisions, using technology to uncover and exploit historical statistically significant anomalies. Our quantitative equity strategies employ proprietary and systematic processes that rank large cap stocks based on factors such as relative valuation, operating metrics (quality), financial strength, and price momentum. The two models noted below select approximately 30-40 holdings from the top-ranked stocks in the model’s respective universe. TRAC™ is utilized to optimize entry and exit points.
The Quantitative Global Value Model (QGVM) invests in large-cap equities from around the world. The U.S., Canada, and Japan currently represent the top 3 countries. The top 3 sectors are Financials (27%), Consumer Staples (18%) and Industrials (16%). The companies held in QGVM currently have the following characteristics: median forward P/E of 13.3x, ROE and ROIC of 22% and 12% respectively, and dividend yield of 2.1%.
The Quantitative Canadian Value Model (QCVM) restricts its universe to Canada’s S&P/TSX Composite. The top 3 sectors are currently Energy (18%), Industrials (17%), and Information Technology (16%). We have materially reduced our materials weighting after our precious metals holdings reached TRAC™ ceilings and our FMV estimates. Proceeds were used to buy technology stocks which have experienced severe corrections due to concerns about AI. The companies held in QCVM currently have the following characteristics: median forward P/E of 15.9x, ROE 11%, and dividend yield of 2.1%.
Income Model
Our high-yield investment strategy has an average current annual yield (income we receive as a percent of current market value of income securities held) of about 5.0%, and most of our holdings—corporate bonds/debentures, preferred shares, REITs, and high-yielding common shares—trade below our FMV estimates.
U.S. high-yield corporate bonds (ICE BofA Index) yield 6.9%, and because high-yield corporate bond spreads are narrow relative to history, we expect a widening, especially if the economy weakens and corporate delinquencies increase.
We recently purchased Big Yellow Group (BYLOF), Blue Owl Technology Finance (OTFC), and Shurgard Self Storage (SSHGF), and sold Whitestone REIT (WSR) when it ran up to a TRAC ceiling in line with our FMV estimate.
We bought two dominant self-storage REITs—Big Yellow Group—the largest in the UK and Shurgard Self Storage—one of the largest in Europe. They pay dividend yields of 5.0% and 3.0% respectively, both have little leverage, should grow earnings by mid- to high-single digits, and trade well below our respective. €13 and €43 FMV estimates. While the major risk for each is higher interest rates, both should fare well in a recession when self-storage companies benefit from downsizing, and most importantly, the self-storage has offered the highest project returns and lowest volatility of all real estate segments.
Blue Owl Technology Finance is a business development corporation which lends its permanent capital base to other companies. Its share price declined because most of its loans are to software companies. The market is fearful of AI creating instant competition for software providers; however, Blue Owl Technology lends to established, highly profitable, mission-critical and cybersecurity-based, software companies, mostly with first lien secured loans, and it’s only suffered one loss historically. Our FMV is $16 and the shares yield 12.2%.
Investment Grade Income Model
Our investment grade strategy utilizes a systematic process to rank Canadian investment-grade rated corporate bonds based on their duration, yield, financial strength, and momentum.
Currently, positioning has emphasized longer-dated bonds—duration is 10.1 years, 4.5 years more than the S&P Canada Investment Grade Corporate Bond Index. The average yield-to-maturity is 4.8% versus 4.0% for the index.
From Top to Bottom
Few investment managers are expecting a recession. Almost all expect continued economic growth. Investors are assuming that record profits and profit margins will continue apace.
It doesn’t help that broad-based speculation is being fueled by easy access for individuals to online brokerage apps and prediction markets, egged on by hype, momentum, and FOMO. Investment newsletter writers—great contra-indicators—have been euphoric lately, more bullish than at any other time since 2000. This adds to our economic and market concerns, providing comfort in our hedges.
While it’s not easy to properly assess individual companies, it’s more difficult to make a correct and timely call on the overall economy or markets. Still, we are compelled to do both.
We seek the reward from bottom-up analysis of companies whose share prices have fluctuated too far below our assessed FMVs. And gain comfort from hedging when our alerts indicate a potential recession while sentiment runs high and major indexes hit ceilings in our work.
Sorry if this letter was a bit of a downer. Bottoms up!
Randall Abramson, CFA
GenerationPMCA Corp.
References
- In this letter, ROE, ROIC, dividend yield, yield, and yield to maturity, are calculated for the respective Model portfolio based on the holdings as at the date of this letter of an actual representative account managed in accordance with such Model. These figures are neither a measure of results achieved nor projected future performance. The Model’s holdings, and therefore ROE, ROIC, and yields, are subject to change at any time and may differ among accounts managed based on the same Model.
Editor’s Note: The summary bullets for this article were chosen by Seeking Alpha editors.

Business
Trump demands others help secure Strait of Hormuz, Japan and Australia say no plans to send ships


Trump demands others help secure Strait of Hormuz, Japan and Australia say no plans to send ships

The Indian benchmark **Nifty 50** index experienced sharp volatility on Monday amid ongoing geopolitical tensions and rising global oil prices, as trading resumed in Mumbai following a steep decline at the end of the previous week.
As of mid-morning on March 16, 2026, the Nifty 50 was trading around 23,045 to 23,200 levels, showing mixed movements with an intraday range between approximately 23,042 and 23,284. This follows a closing value of 23,151.10 on Friday, March 13 — a drop of 488.05 points or 2.06% from the prior session’s close of 23,639.15. The index opened lower at 23,116.10 before fluctuating in a broad band.
The previous Friday’s session marked one of the more pronounced single-day losses in recent months, with the Nifty shedding over 2% amid broader market pressures. Trading volume remained elevated, with reports indicating over 1.18 crore shares changing hands in early activity on Monday, reflecting continued investor caution.
Market participants pointed to escalating concerns over the U.S.-Iran conflict as a primary driver behind the recent sell-off. Reports of heightened tensions in the Middle East have pushed Brent crude oil prices above $100 per barrel in recent sessions, raising fears of inflationary pressures and potential disruptions to global energy supplies. Higher oil costs directly impact India’s import bill, given the country’s heavy reliance on foreign crude, and contribute to broader risk aversion in emerging markets.
“The market is grappling with external shocks,” said one Mumbai-based analyst tracking equity indices. “Geopolitical risks combined with elevated commodity prices are weighing on sentiment, particularly in oil-sensitive sectors.”
Broader indices mirrored the Nifty’s choppy performance. The BSE Sensex traded with similar volatility, fluctuating around the 74,500 level after opening mixed. Sectoral trends showed selective buying in pockets such as pharmaceuticals and metals, which provided some support, while oil and gas, realty, and certain financial stocks faced pressure.
On Friday’s close, only a handful of Nifty constituents ended in positive territory, with heavyweights like Reliance Industries, HDFC Bank, and Infosys contributing significantly to the overall decline due to their large weightings in the index. The Nifty’s P/E ratio hovered near 20.3, while the price-to-book stood at about 3.15, levels that some strategists view as offering moderate valuation cushion after the recent correction.
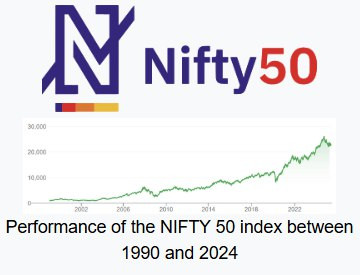
Looking at recent trends, the Nifty has retreated notably from its 52-week high of 26,373.20 (reached earlier in January 2026). The index has lost around 9-10% over the past month in some tracking periods, though it remains up modestly — roughly 3% — on a year-over-year basis from March 2025 levels. The 52-week low stands at 21,743.65.
Investors are closely monitoring upcoming economic data releases, including any updates on inflation, industrial output, and global central bank cues. The Reserve Bank of India’s stance on monetary policy remains in focus, especially if sustained high oil prices feed into domestic CPI readings.
Technical analysts noted that the Nifty has broken below certain key support levels in recent sessions, forming bearish candlestick patterns on daily charts. Some observers have described the move as entering a “deep corrective phase,” with potential further downside toward 22,700-23,000 if selling pressure persists. Conversely, a sustained move above 23,300 could signal short-term stabilization.
Foreign institutional investors (FIIs) have shown net selling in recent weeks, adding to domestic market headwinds, while domestic institutional investors (DIIs) have provided some counterbalancing buying.
Market breadth remained tilted toward declines in early Monday trade, with more stocks falling than advancing in the broader universe. Option chain data for near-term expiries highlighted put interest around the 23,000-23,200 strikes, indicating hedging activity.
Despite the near-term caution, long-term optimism persists among some market watchers
Business
QSR stocks slump up to 47% as weak investor appetite, rising fuel risks dent mood. Time to bottom fish?

While the troubles facing these stocks are not new, the ongoing crisis has only deepened the losses. Sapphire Foods India, which operates KFC and Pizza Hut outlets, has seen its share price fall 12% this week. Devyani International, set to merge with Sapphire to create a single Yum franchise in India, slipped 4% on Friday. Jubilant FoodWorks, the operator of Domino’s and Dunkin’, has lost about 4% over the same period, while shares of Westlife Foodworld (McDonald’s franchisee) have declined 4%. Meanwhile, Restaurant Brands Asia (RBA) has fallen around 3% week-on-week.
The impact on restaurants across the country is already visible as media reports suggest rapid closures. Though these QSR companies have not flagged any likely disruption in operations, so far, brokerage firm JM financial has warned that a prolonged crisis in LPG availability could pose operational challenges for those QSRs where cooking processes depend heavily on gas-based kitchens.
The risk has surfaced as the conflict in West Asia begins to disrupt fuel supplies, pushing restaurants to reassess operations, cooking methods and menu strategies, JM noted.
“For QSR operators such as Westlife FoodWorld, Devyani International, Sapphire Foods India and RBA (Restaurant Brands Asia), the immediate concern pertains to higher kitchen operating costs and the probability of store closures in certain micro markets, which could temporarily affect outlet operations and restaurant-level margins,” the brokerage note added.

However, ElaraCapital sees lesser impact of the LPG shortage on QSR chains compared to non-QSR based restaurants, citing that the QSR companies have minimal dependency on LPG and rely on electric ovens and fryers. In fact, it sees them benefitting due to a consumer substitution effect from LPG-dependent cuisine to QSR format.
Also read: As Iran Israel crisis clouds outlook for tile makers, what is next for Cera, Kajaria, Somany after 26% slide?
Weak investor appetite
Restaurant Brands Asia, which operates Burger King remains the only exception. Its shares have managed positive returns of 2% over a one-year period, nearly matching Nifty’s 3% returns in the same period.
Sapphire Foods shares are down 47% in the past 12 months, Westlife Food 36% lower while Jubilant and Devyani have plunged, 27% each.
The institutional appetite for QSR stocks has also taken a beating with Foreign Institutional Investors (FIIs) offloading stakes.
FII holding in Sapphire Foods fell 210 bps sequentially in the December quarter while recording a 90 bps decline in Westlife Food in same quarter. In Jubilant and Devyani, foreign stakes dropped by 150 bps and 80 bps, respectively.
The worst happened with Restaurant Brands Asia, where holding declined by 380 bps.
Earnings snapshot
Earnings cut a patchy picture with Devyani widening its consolidated December quarter losses to 10 crore though revenue growth stood 12% YoY to Rs 1,453 crore. The Q3 net profit for Westlife Food fell 86% though total revenue saw a 3% YoY uptick.
Jubilant reported strong set of numbers with profit after tax (PAT) growing 65% to Rs 71 crore while topline rising by 13%. As for RBA, YoY losses narrowed to Rs 7 crore versus 19 crore in Q3FY25 riding on 18% jump in revenue.
What should investors do?
Sudeep Shah, Vice President & Head of Technical and Derivative Research Desk at SBI Securities said QSR stocks have been under significant pressure over the past year and the recent weakness cannot be attributed solely to the LPG shortage concerns. Technically, most of these stocks were already in well-established downtrends, he said, adding that the current crisis has merely aggravated existing weakness rather than causing it.
“Sapphire Foods has been declining since October 2025 and continues to trade well below its key moving averages. Westlife Foodworld is exhibiting a classic lower-high, lower-low structure, with the MACD line positioned below the zero line, indicating sustained bearish momentum. Jubilant FoodWorks remains in a strong downtrend with the RSI languishing around 22, reflecting oversold but weak sentiment. Meanwhile, Devyani International has slipped close to its IPO levels,” Shah said.
His advice to investors is to avoid bottom-fishing and wait for clear signs of fundamental and technical improvement before considering exposure to the QSR space.
Also read: As crude oil price breaches $100 mark, Systematix recommends RIL, a potential multibagger and 4 more stocks to buy
(Disclaimer: The recommendations, suggestions, views, and opinions given by the experts are their own. These do not represent the views of The Economic Times.)

Payments of £3,000 for each 18-24 year old given a job are among proposals to tackle youth unemployment being announced later.

Pythia Research focuses on multi-bagger stocks, primarily in the technology sector. Our approach combines financial analysis, behavioral finance, psychology, social sciences, and alternative metrics to assess companies with high conviction and asymmetric risk-reward potential. By leveraging both traditional and unconventional insights, we aim to uncover breakout opportunities before they gain mainstream attention. Our multidisciplinary strategy helps us navigate market sentiment, identify emerging trends, and invest in transformative businesses poised for exponential growth. We don’t just follow the market—we anticipate where disruption will create the next big winners.Markets don’t move purely on fundamentals; they move on perception, emotion, and bias. We lean into that reality. Investor behavior, anchoring to past valuations, herd mentality during rallies, panic selling from recency bias, creates persistent inefficiencies. These moments of mispricing often mark the start of a breakout, not the end of one.Rather than avoid psychological noise, we analyze it. When the crowd sees volatility, we assess whether it’s driven by emotion or fundamentals. Status quo bias can keep investors blind to companies redefining their category. Fear of uncertainty can delay recognition of businesses with clear but unconventional growth paths. We look for these disconnects.Our process blends deep research with signals others miss: sudden shifts in narrative, early social traction, founder-driven vision, or underappreciated momentum in developer or user adoption. These are often the precursors to exponential moves, if you catch them early.We focus on conviction plays, not safe bets. Each opportunity is evaluated for Risk/Reward profile: limited downside, explosive upside. We believe that the best returns come from understanding where belief is lagging reality.
Analyst’s Disclosure: I/we have a beneficial long position in the shares of IREN either through stock ownership, options, or other derivatives. I wrote this article myself, and it expresses my own opinions. I am not receiving compensation for it (other than from Seeking Alpha). I have no business relationship with any company whose stock is mentioned in this article.
Seeking Alpha’s Disclosure: Past performance is no guarantee of future results. No recommendation or advice is being given as to whether any investment is suitable for a particular investor. Any views or opinions expressed above may not reflect those of Seeking Alpha as a whole. Seeking Alpha is not a licensed securities dealer, broker or US investment adviser or investment bank. Our analysts are third party authors that include both professional investors and individual investors who may not be licensed or certified by any institute or regulatory body.

FTSE Russell is a leading global provider of index and benchmark solutions, spanning diverse asset classes and investment objectives. As a trusted investment partner we help investors make better-informed investment decisions, manage risk, and seize opportunities.Market participants look to us for our expertise in developing and managing global index solutions across asset classes. Asset owners, asset managers, ETF providers and investment banks choose FTSE Russell solutions to benchmark their investment performance and create investment funds, ETFs, structured products, and index-based derivatives. Our clients use our solutions for asset allocation, investment strategy analysis and risk management, and value us for our robust governance process and operational integrity.For over 40 years we have been at the forefront of driving change for the investor, always innovating to shape the next generation of benchmarks and investment solutions that open up new opportunities for the global investment community.

RBA preview March: 25 bps hike widely expected, hawkish outlook in focus

Last week, the Sensex and Nifty ended at their lowest since April 2025, stretching their losses to 8-9% since the war began two weeks ago. Although equities appear oversold after their recent rout, oil prices above $100 a barrel are making investors reluctant to deploy cash in a hurry.
With Trump theoretically expanding the scope of attacks by threatening further strikes on Iran’s Kharg Island – home to the country’s oil exports infrastructure – the market is resigning itself to the fact that the conflict between US-Israel and Iran may not end soon. Tehran has pledged to respond even as Washington has urged the UK to send battleships to the region to force open the Strait of Hormuz.
“It is not the fog of war, but a fog of words that has led to elevated uncertainty around how this war will play out,” said Barclays’ economists, including Christian Keller, in a client note over the weekend. “In turn, this has led to violent swings in the price of oil and financial assets.”
Crude Risks
The rupee, meanwhile, has slid 1.6% since the start of the war despite central bank interventions, and the currency closed at a record low of 92.48 to the dollar on Friday.
Market participants expect the rupee – the worst performing Asian monetary unit in 2025 and on track to feature in the lower half of the leader board this quarter as well – to drift lower if crude oil prices leap past $100 a barrel.
“The risk of crude is going to stay high, and the outlook for the rupee remains cautious as it could create macroeconomic challenges for the Indian economy,” said Jateen Trivedi, VP research analyst, currency, at LKP Securities. “In the near term, the rupee is expected to trade within a range of 91.90-92.80, with crude price movements and dollar index trends remaining the key drivers.”
A Reuters report said Goldman Sachs expects Brent crude to trend above $100 in March and around $85 in April, before a gradual easing in supplies – unless the war is protracted – helps the gauge to settle at low 70s to the dollar later in the year. Brent oil surged to a touching distance of $120 a barrel last Monday, a level not seen since the immediate aftermath of the Ukraine invasion by Russia.
The surge in crude oil prices and the resultant slide in the rupee have kept investors on the sidelines, especially amid expectations the central bank interventions might do little to stem the rupee’s rout. Foreign portfolio investors (FPIs) have continued to pare holdings in Indian equities through March. On March 13, they sold shares worth ₹10,716 crore.
Business
Stove Kraft, TTK Prestige shares plunge up to 5% despite LPG supply squeeze fears from Israel-Iran war. Here’s why

The drop in stock prices comes as investors rushed to book profits following a massive rally last week. Further, hopes of possible talks between US and Iran also eased LPG gas fears slightly. US President Donald Trump said Sunday that the United States was in discussions with Iran as the war enters its third week but that Tehran was not ready for a deal to end it.
“Yes, we’re talking to them,” Trump told reporters aboard Air Force One, without detailing the nature of such talks, when asked if there was any diplomacy under way to end a conflict that has spread across the Middle East and roiled global markets. Iran, on the other hand, has denied the claims.
LPG supply constraint is significant for India as as it is the world’s second-largest LPG importer. Several restaurants across the country have run out of gas supplies or switched to simpler menu items that require little to no cooking gas.
For induction cooktop players, this means more sales. Tata Group’s Croma said it has observed a threefold jump in demand for induction cooktops over the past few days, The Economic Times reported earlier. Further, Stove Kraft said its average weekly online sales have jumped four times.
“At Croma, we have observed a sharp and immediate uptick in demand for induction cooktops over the past few days. Our average daily run rate has surged significantly,” Infiniti Retail Ltd (Croma) CEO & MD Shibashish Roy said.
India is also grappling with a sharp LPG shortage as the ongoing war between Iran and the US-Israel alliance has led to the prolonged closure of the Strait of Hormuz, one of the world’s most critical energy supply chokepoints. Tanker movement through the route has been severely disrupted as Iran continues to target vessels attempting to pass through the corridor. The situation has forced several global suppliers to declare force majeure on gas shipments.Despite assurances from US President Donald Trump, the strait effectively remains closed to traffic. Iran’s Islamic Revolutionary Guard Corps has warned that oil shipments from the Gulf will be blocked unless US and Israeli attacks stop.
Also Read | Mutual fund portfolio down Rs 1.5 lakh in 12 days. Is the decline due to regular plans or market volatility?
Gas crisis in India
The supply disruption linked to the closure of the Strait of Hormuz has pushed up gas prices in India. Domestic cooking gas prices have increased by Rs 60 per cylinder, while commercial LPG prices have risen by Rs 114.5.
Shortages have been reported in multiple cities including Mumbai and Bengaluru. In some areas, restaurants have warned they may have to shut operations because of inadequate fuel supplies.
Meanwhile, the Indian Railway Catering and Tourism Corporation (IRCTC) has asked all its licensees to shift to alternate cooking methods such as microwave ovens and electric induction systems at railway food centres.
Sensex, Nifty today: Catch all the LIVE stock market action here
(Disclaimer: Recommendations, suggestions, views and opinions given by the experts are their own. These do not represent the views of The Economic Times)
Business
ETMarkets Smart Talk | Power, infra, auto sectors look attractive after correction: Devang Mehta

While the uncertain macro environment has kept investors on edge, corrections across sectors have also opened up selective opportunities. In an interaction with ETMarkets Smart Talk, Devang Mehta, Deputy Managing Director & CIO – Equity NDPMS at Spark Capital Private Wealth, said that domestic-focused sectors such as power, infrastructure, and auto are beginning to look attractive after the recent market correction.
He also advised investors to stay disciplined, continue their SIPs, and focus on long-term investing rather than reacting to short-term volatility. Edited Excerpts –
Q) Thanks for taking the time out. March has been an absolute roller coaster for equity markets not just for India but across the globe. How are you reading into markets – more pain ahead?
A) The equity markets in March 2026 have indeed experienced extreme volatility, primarily driven by the escalation of a U.S.-Israel war with Iran and the subsequent closure of the Strait of Hormuz.
This conflict has triggered a “risk-off” environment, characterized by sharp declines in global indices and a surge in crude oil prices past $100–$110 per barrel and foreign outflows as well
The conflict has disrupted roughly 20% of global oil supplies transiting the Strait of Hormuz, raising fears that oil could be on the boil. If the war continues, the collateral and economic damage could lead to more pain.
Though its next to impossible to gauge the intensity and duration of the war, long term investors have to adjust to the volatility and uncertainty.
Indian market has now been going through price correction, valuation correction and time correction since last 19 months and data typically shows that after underperformance and with earnings cycle positively coming back, one needs to stay focused and not panic.
Q) IT sector seems to be the worst hit thanks to the AI commentary but with geopolitical tensions rising other sectors have also started to see some rub-off effect. Any sector(s) that are now available at attractive lev
A) IT has particularly been a hugely underperforming sector and it has its own reasons. But as markets were settling down in February, post a decent budget, good earnings season and a bit of clarity about US tariffs, unfortunately, the Iran & US – Israel war related news took prominence and had its impact on global and our own markets.
With all the newsflow around and India’s sensitivity for the oil and gas dependence, most of our sectors and companies in the indices and even broader markets went through a severe correction.
Sectors which are domestic centric and have not much of a global exposure should ideally be sought after in the first phase.
Capex oriented sectors like power, HVDC, engineering, capital goods, infrastructure and even discretionary consumption related sectors like auto and auto components have seen meaningful corrections.
Some accumulation here would be a good start to construction of new portfolios. Niche pharmaceuticals and wellness including hospital businesses and few BFSI related companies also qualify for long term investment.
Q) What could be the good, bad and ugly for Indian markets in the near term?
A) Good – Following a sluggish 2025, India Inc. is expected to see around15% YoY earnings rebound over FY26–FY27.
With India’s valuation premium over other emerging markets compressing, expectations are high for a return of foreign capital in 2026.
Strong SIP-led inflows and retail participation continue to cushion the market against foreign investor volatility.
Headline CPI inflation printed at a benign 2.75% in January 2026, though a new series makes historical comparison difficult.
Recent pro-growth measures, including income tax & GST rate cuts and interest rate reductions (125 bps cut to 5.25% as of early 2026), aim to stimulate consumption.
Bad – The Indian Rupee recently sank to all-time lows, breaching ₹92.35 against the US Dollar, which threatens to increase “imported inflation”. Pending trade deals with the US is also a overhang. Foreign Institutional Investors have been aggressive net sellers, offloading over ₹32,800 crore in the first week of March 2026 alone.
The Ugly – A major escalation in the Middle East, such as a shutdown of the Hormuz Strait, could push oil prices to unsustainable levels, causing a severe, sudden shock to the Indian economy. If global uncertainty prompts sustained record-breaking selling by foreign institutional investors, market multiples could face intense downward pressure.
Q) FPIs have been net sellers in 2025, and the story continues in 2026 may be for a different reason now. The story seems to be changing around the FDI route as India opens channels for Chinese investment to land into several industries. What are your views?
A) FPIs have been massive net sellers in India during 2025, driven by high valuation concerns, US tariff anxieties, and a “Sell India, Buy China” trend. The record outflows in 2025 were driven by a “risk-off” sentiment due to high Indian valuations compared to its peers, weak corporate earnings, and global macro headwinds like rising US bond yields.
As of early 2026, FPIs remain cautious. While they briefly turned net buyers in February 2026 following a US-India trade deal, this reversed in March due to escalating Middle East conflicts and a weakening rupee.
India has begun relaxing FDI norms for neighboring countries, including a 60-day fast-track approval for projects, to attract manufacturing investment. This represents a shift from the 2020 restrictions, allowing Chinese capital to enter critical industries.
This policy change aims to bridge the investment gap and boost local manufacturing, even as India manages a massive trade deficit with China. It highlights a strategic move to balance security concerns with economic growth necessities.
The most striking change is the relaxation of Press Note 3 (2020), which had virtually frozen Chinese investment since the Galwan clash. The story is changing from a broad “avoid China” stance to a calibrated, strategic engagement.
Stock markets have already started pricing this in, with Electronic Manufacturing Services (EMS) and renewable energy stocks surging on the news.
Q) Rupee seems to be hitting fresh lows every week – where do you see the currency headed and how will it impact Indian markets/economy?
A) The Indian Rupee (INR) has indeed been hitting fresh record lows against the US Dollar (USD), falling past the 92 level and touching around 92.35–92.37. This weakness is driven by a combination of high geopolitical tension, rising crude oil prices, and significant foreign capital outflows.
The rupee is expected to trade in a broad 90–93 range as long as geopolitical tensions in the Middle East persist and oil prices remain high.
As a major importer of crude oil, electronics, and machinery, a weaker rupee makes these inputs significantly costlier. This feeds directly into domestic inflation, raising costs for petrol, diesel, and electronics.
The cost of importing goods is outpacing export growth, widening the current account deficit (CAD). Indian companies with large unhedged foreign currency loans face higher repayment burdens, squeezing their margins.
Q) Will Crude@$100/bbl and above hurt Indian markets and macros? We have been making an investment pitch to the world about our macro stability which could be challenged in the near future. What are your views?
A) Crude oil prices sustained above $100/bbl pose significant risks to India’s macroeconomic stability by widening the current account deficit (CAD), increasing inflation (by 35–40 bps), and potentially reducing FY27 GDP growth to around 6%.
While this challenges the investment narrative of macro stability and threatens equity market pressure, strong foreign exchange reserves (around $720 billion) and potential for a shorter-duration shock may mitigate long-term damage.
With $720 billion in forex reserves and lower global demand, this shock may be acute rather than prolonged, preventing a structural break.
While a short-term spike causes volatility, a sustained, long-term trend above $100 requires a rebalancing of portfolios towards defensives. The “macro stability” pitch is challenged, but not entirely broken unless the conflict causing the price rise persists for over a long duration.
Q) How should investors recalibrate their portfolio amid rise in volatility? Any theme/asset classes which they should go overweight or underweight on? (Assuming the person is between 30-40 years)
A) For investors aged 30-40, high volatility is an opportunity to accumulate units at lower costs rather than a reason to panic. With a long-term horizon, the goal is to maintain a high growth, yet resilient portfolio that can withstand short-term shocks.
Continue all Systematic Investment Plans (SIPs). Volatility allows SIPs to purchase a higher number of units at a lower cost, which leads to superior, long-term wealth creation.
Asset allocation according to one’s risk profile, liquidity requirements and life goals are the most critical factors. You don’t lose when markets panic, you lose when you panic.
Q) Your advise to investors of things which one must avoid doing in the current environment? We have already seen drop in SIP flows by over 3% on a MoM basis.
A) Monthly inflows hit ₹29,845 crore, down 4% from January’s ₹31,002 crore, ending a two-month streak above ₹30,000 crore. The moderation ties to the shorter month, with some end-of-month SIPs shifting to early March.
Market corrections often trigger fear, leading to panic selling, which turns paper losses into permanent losses. In all the market dips, investors who stayed invested recovered their losses, while those who panicked and sold missed the subsequent recovery, and saw a significant, realized drop in their portfolio.
Waiting for a “low point” to invest usually leads to missing out on the best days of the market. Missing the 10 best trading days in a decade can cut your long-term returns by HALF. Historically in Nifty you could have lost 82% of your wealth by sitting out just 2% of the trading days.
Trying to time the market is a losing strategy because nobody can consistently predict tops and bottoms. Think in terms of years, not months. Volatility is temporary; long-term growth is the target.
(Disclaimer: Recommendations, suggestions, views, and opinions given by experts are their own. These do not represent the views of the Economic Times)
Emma Stone Stuns in Silver Beaded Dress at 2026 Oscars

Why Wasn’t Wendi McLendon-Covey Part Of The Oscars Bridesmaids Reunion?

The UK Will Invest Billions to Build a Nuclear Fusion Industry


-
 Tech5 days ago
A 1,300-Pound NASA Spacecraft To Re-Enter Earth’s Atmosphere
-
 Crypto World2 days ago
HYPE Token Enters Net Deflation as HyperCore Buybacks Outpace Staking Rewards
-

 News Videos7 days ago
10th Algebra | Financial Planning | Question Bank Solution | Board Exam 2026
-

 Business6 days ago
ExxonMobil seeks to move corporate registration from New Jersey to Texas
-

 Crypto World7 days ago
Paradigm, a16z, Winklevoss Capital, Balaji Srinivasan among investors in ZODL
-

 Fashion2 days ago
Weekend Open Thread: Addict Lip Glow
-

 Tech6 days ago
ChatGPT will now generate interactive visuals to help you with math and science concepts
-
Sports2 days ago
Why Duke and Michigan Are Dead Even Entering Selection Sunday
-

 NewsBeat4 days ago
Residents reaction as Shildon murder probe enters second day
-

 Business5 days ago
Search Enters Sixth Week With New Leads in Tucson Abduction Case
-
 NewsBeat6 days ago
Pagazzi Lighting enters administration as 70 jobs lost and 11 stores close across Scotland
-

 Business10 hours ago
Search for Savannah Guthrie’s Mother Enters Seventh Week with No Arrests
-

 Tech7 days ago
Despite challenges, Ireland sixth in EU for board gender diversity
-

 Business2 days ago
US Airports Launch Donation Drives for Unpaid TSA Workers as Partial Government Shutdown Enters Fifth Week
-
Crypto World1 day ago
Coinbase and Bybit in Investment Talks: Could Bybit Finally Enter the US Crypto Market?
-

 NewsBeat5 days ago
I Entered The Manosphere. Nothing Could Prepare Me For What I Found.
-

 Business6 days ago
Search Enters 39th Day with FBI Tip Line Developments and No Major Breakthroughs
-

 Sports7 days ago
Skateboarding World Championships: Britain’s Sky Brown wins park gold
-

 Business2 days ago
Country star Brantley Gilbert enters growing non-alcoholic beer market
-

 Crypto World6 days ago
Will Chainlink price reclaim $10 amid volatility squeeze?

