The Grey Owl All-Season Strategy’s objectives are to minimize drawdowns, outperform short-term bonds by several hundred basis points each year (i.e., beat “cash”), and participate meaningfully in risk-on rallies. For the full year 2025, GOAS returned +11.4% and met each of these objectives.
We are particularly pleased with the strategy’s 2025 performance given how the year began. While the popular “Magnificent 7 (MAGS)” group of stocks declined roughly -30% from its December 17, 2024 peak to the April 8, 2025 low 1 , the Grey Owl All-Season (GOAS) portfolio was down less than -3% at its worst point in early April. The rebound that followed was rapid, and the year ultimately proved strong for most risk assets. GOAS managed risk during the drawdown and then repositioned to participate as conditions turned risk-on.
A few specifics below on the present environment and our current positioning, but first a more detailed review of the performance of the “primary” asset classes. 2
Advertisement
For the full year 2025, gold gained +63.7%, global equities rose +22.4%, U.S. equities followed closely at +17.7%, commodities increased 5.9%, and long-dated U.S. Treasury bonds returned +4.3%.
During the fourth quarter of 2025, precious metals continued to shine, with gold up another +11.5%. U.S. equities gained +2.7%, while global equities performed slightly better at +3.3%. Commodities were essentially flat, up +0.4%, and long-dated U.S. Treasury bonds declined -1.0%. Over this period, GOAS delivered a respectable +2.4% return.
As 2026 gets underway, a more dramatic shift may be developing. In 2025, technology and growth outperformed the broader market (i.e., the Nasdaq beat the S&P 500, finishing up +20.8%), while small-capitalization stocks lagged, ending the year up +12.7%. 3 That dynamic has changed meaningfully during the first three weeks of 2026.
As of the close on January 23, 2026, the “Magnificent 7” group was down -3.6% from its October 29, 2025, high and -0.5% year-to-date. In contrast, small-capitalization equities and commodities are significantly outperforming, up +7.6% and +7.4% year-to-date, respectively. GOAS is aligned with these prevailing conditions and is up +5.3% through January 23, 2026.
Advertisement
In short, our diversified, risk-managed approach delivered solid double-digit returns in 2025 while avoiding major drawdowns during early-year volatility. Today, we are positioned for meaningful economic growth in the U.S. and much of the rest of the world. We believe conditions now favor cyclical outperformance and a broadening of equity participation. That means overweight exposure to commodities and smaller-capitalization equities. As the charts below indicate, this phase may only persist through the first half of 2026. For now, that is the prevailing condition regardless of how long it lasts. We are prepared to adjust as conditions evolve.
Economic Growth
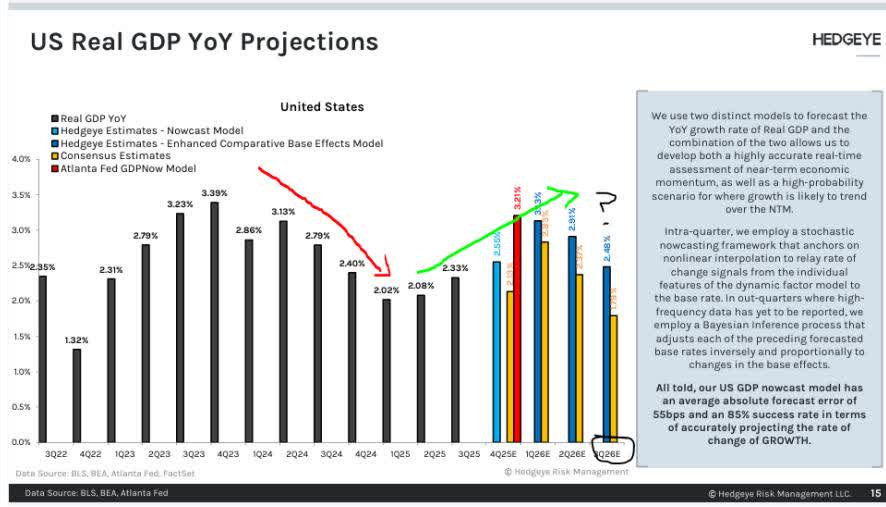
Hedgeye’s real GDP projection model shows a reacceleration in growth gaining significant momentum in the first quarter and continuing through much of the second quarter. As growth has accelerated, cyclical equities and commodities have outperformed. While this acceleration continues, we expect risk assets to continue performing well.
Figure 1 – GDP Projections
We use two distinct models to forecast the YoY growth rate of Real GDP and the combination of the two allows us to develop both a highly accurate real-time assessment of near-term economic momentum, as well as a high-probability scenario for where growth is likely to trend over the NTM.
Intra-quarter, we employ a stochastic nowcasting framework that anchors on nonlinear interpolation to relay rate of change signals from the individual features of the dynamic factor model to the base rate. In out-quarters where high-frequency data has yet to be reported, we employ a Bayesian Inference process that adjusts each of the preceding forecasted base rates inversely and proportionally to changes in the base effects.
Advertisement
All told, our US GDP nowcast model has an average absolute forecast error of 55bps and an 85% success rate in terms of accurately projecting the rate of change of GROWTH.
Economic growth is accelerating, which historically supports risk assets—particularly cyclical equities and commodities.
Inflation
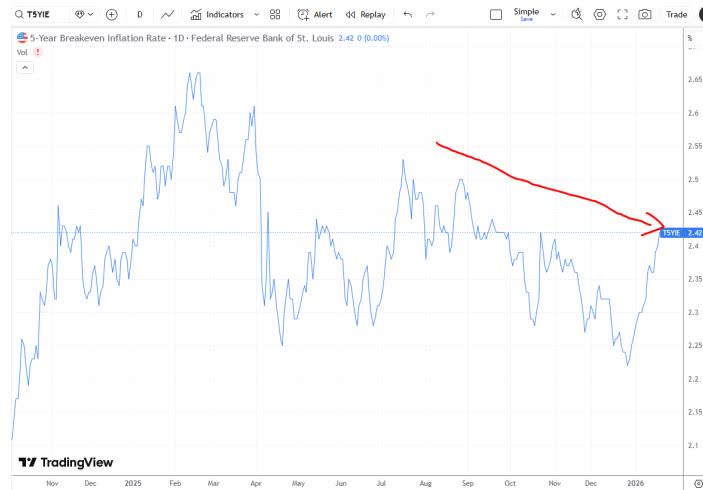
Inflation expectations have been decelerating for several quarters, as evidenced by the five-year breakeven spread—often referred to as “the market’s” inflation forecast.
Advertisement
Figure 2 -5-Year Breakeven
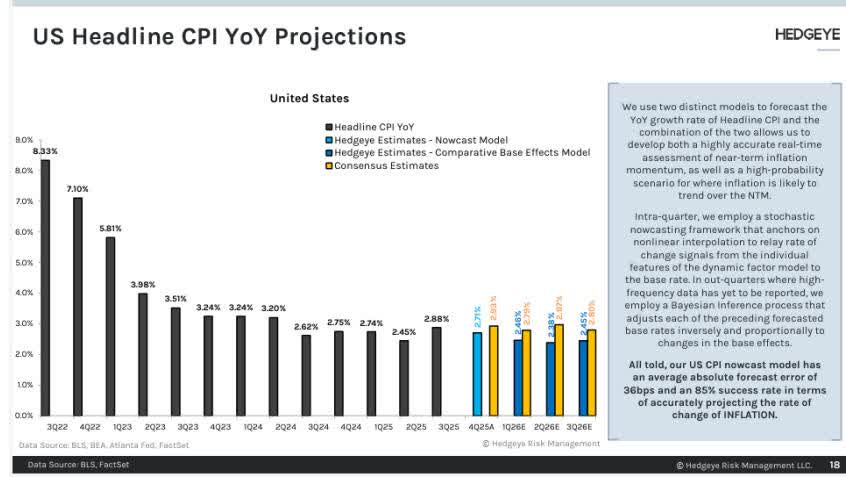
Hedgelye’s CPI model corroborates this trend, projecting continued disinflation through the second quarter of 2026, followed by only a modest seven-basis-point increase in the third quarter. Combined with accelerating growth, this backdrop is favorable for risk-taking.
We use two distinct models to forecast the YoY growth rate of Headline CPI and the combination of the two allows us to develop both a highly accurate real-time assessment of near-term inflation momentum, as well as a high-probability scenario for where inflation is likely to trend over the NTM.
Intra-quarter, we employ a stochastic nowcasting framework that anchors on nonlinear interpolation to relay rate of change signals from the individual features of the dynamic factor model to the base rate. In out-quarters where high-frequency data has yet to be reported, we employ a Bayesian inference process that adjusts each of the preceding forecasted base rates inversely and proportionally to changes in the base effects.
Advertisement
All told, our US CPI newcast model has an average absolute forecast error of 36bps and an 85% success rate in terms of accurately projecting the rate of change of INFLATION.
A key driver of lower inflation has been the price of oil—one of the few major commodities not yet firmly in a bull market.
Figure 4 -US Crude Oil Spot
WTI). The chart shows a candlestick price history from 2018 to 2026. A red trendline is drawn across the chart, showing a general downward trend. The current price is $61.025 as of 06/30/19. The y-axis represents price in USD from 10.000 to 130.000. The x-axis shows time from 2018 to 2026. The chart includes technical indicators and a volume bar at the bottom.” width=”640″ height=”446″ loading=”lazy” srcset=”https://static.seekingalpha.com/uploads/2026/2/4/542689-1770260573389652_origin.jpg?io=w640 640w,https://static.seekingalpha.com/uploads/2026/2/4/542689-1770260573389652_origin.jpg?io=w480 480w,https://static.seekingalpha.com/uploads/2026/2/4/542689-1770260573389652_origin.jpg?io=w320 320w,https://static.seekingalpha.com/uploads/2026/2/4/542689-1770260573389652_origin.jpg?io=w240 240w” sizes=”(max-width: 767px) calc(100vw – 36px), (max-width: 1023px) calc(100vw – 180px), 552px”>
Inflation pressures remain contained, creating a favorable backdrop for risk-assets.
Broadening US Equity Market
While the broader macro environment—accelerating real growth alongside disinflation—is critical to the rally’s expansion, sector-level dynamics are also playing an important role. Mega-capitalization technology companies are now facing more difficult year-over-year comparisons, as cycle-peak artificial-intelligence capital expenditures may be behind us, pressuring both revenue growth and margins.
Advertisement
The opposite is true for much of the rest of the market, particularly smaller-capitalization and cyclical businesses. With easier comparisons to last year, both revenues and margins are improving.
Hedgeye data show that while S&P 500 earnings are expected to continue growing, a greater share of that growth is coming from the “other 493” stocks.
Figure 5 – Earnings Projections
Market leadership is expanding beyond mega-cap technology, increasing opportunity across smaller and more cyclical companies.
Market Signals
Last quarter we wrote:
Advertisement
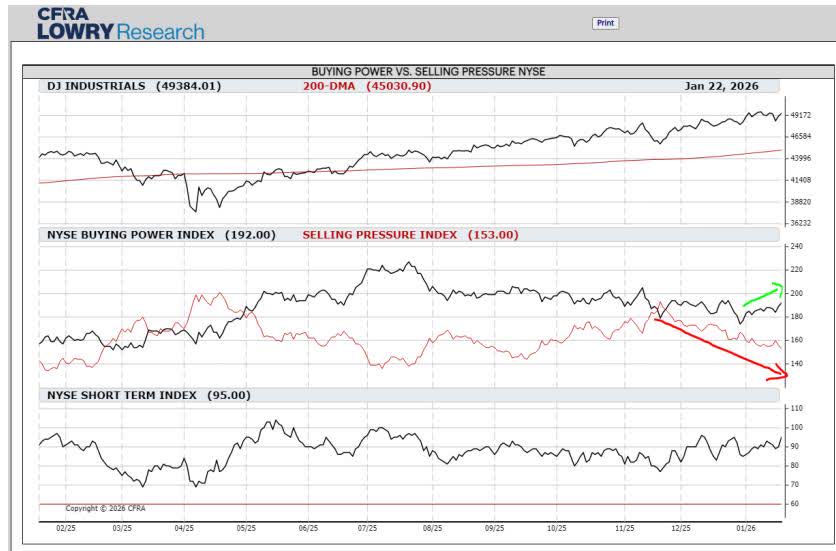
Market internals also point to change beneath the surface. While large-cap indices hit new highs in the third quarter, participation was narrow—signs of enthusiasm were limited. In October, that pattern began to broaden as Buying Power improved and Selling Pressure eased. With Buying Power still stronger overall, we do not see a shift toward a risk-off environment. Instead, the data suggest equity markets are transitioning as investors respond to—and anticipate—changes in growth and inflation, opening the door for new leadership among sectors and styles.
That improvement and broadening has continued. Selling Pressure is receding, and Buying Power shows further signs of strengthening.
Figure 6
More granular market data look even better. Lowry’s writes:
While many investors and the financial media are focused on the cap-weighted price indexes, the Lowry Analysis is predominantly centered on the full market on an equal weighted basis, which is dominated by smaller stocks. The reason for this is simple: the greater the number of stocks participating in a market advance and displaying promising Demand trends, the more difficult it is for sellers to take control of the market. While such features do not make the market impervious to pullbacks, recent evidence continues to mount in favor of a broad and durable advance. Still, we would like to see these improvements reflected in our longer-term measures of market health to solidify our conviction in the bulls further.
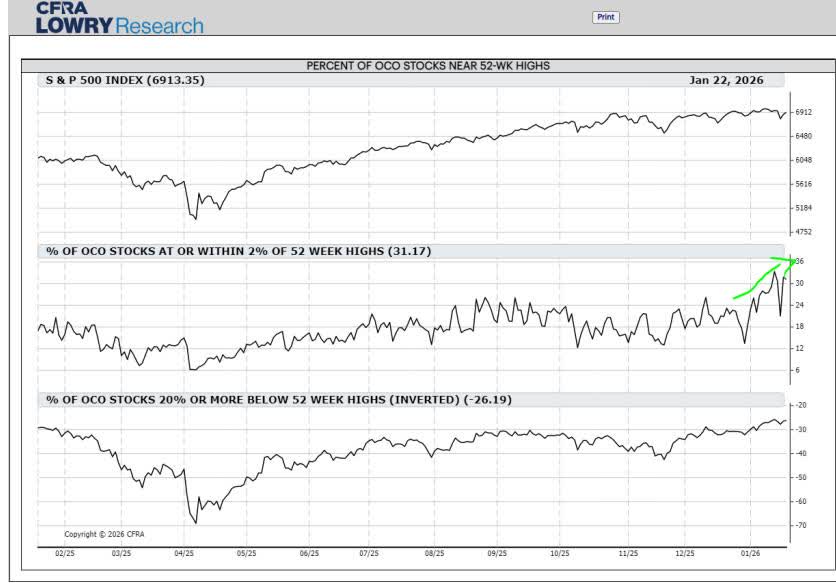
In their most recent weekly report, Lowry’s emphasized the dramatic increase in the percentage of stocks within 2% of their 52-week highs.
Figure 7
Explaining the chart, Lowry’s wrote:
Advertisement
One method to view how many stocks are carrying the performance load within the market is our measure of Demand intensity, or the Percent of OCO1 Stocks At or Within 2% of 52-Week Highs. This is one of the more sensitive indicators in our suite, and on January 15, it reached a one-year high of 33.36%. While this was an impressive development, the indicator moving above its multi-month range is perhaps even more important. It essentially reflects a change in character within demand intensity from good to great, as the OCO Index is dominated by smaller stocks. The more stocks that reach new highs, the stronger the market’s constitution ultimately becomes.
Market internals support the case for a broader, more durable advance.
Current Positioning
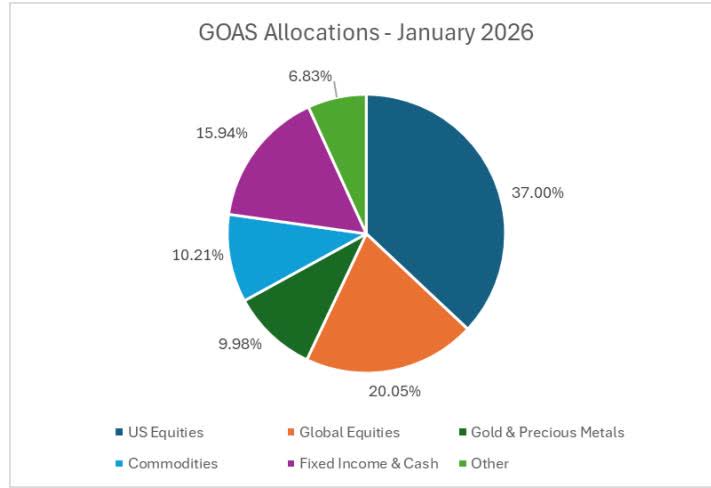
Our current portfolio remains balanced within an all-season framework but is more aggressive than when we last reported in October 2025. Since last quarter, we have increased exposure to U.S. small-capitalization equities, expanded global equity exposure—particularly in emerging markets—and added to precious metals and commodities. Fixed income and cash allocations declined from 28% to 16%.
Figure 8 – GOAS Allocation
This positioning maintains meaningful protection against inflation or market stress while remaining tilted toward growth. This balance—rooted in our all-season philosophy and adjusted for present conditions—reflects our core belief: don’t try to predict the future; position with prevailing conditions while diversifying to enable success across many possible futures.
The portfolio remains balanced but is intentionally tilted toward growth.
Advertisement
As always, if you have any thoughts regarding the above ideas or your specific portfolio that you would like to discuss, please feel free to call us at 1-888-GREY-OWL.
Sincerely,
Grey Owl Capital Management
Advertisement
Grey Owl Capital Management, LLC
This newsletter contains general information that is not suitable for everyone. The information contained herein should not be construed as personalized investment advice. Past performance is no guarantee of future results. There is no guarantee that the views and opinions expressed in this newsletter will come to pass. Investing in the stock market involves the potential for gains and the risk of losses and may not be suitable for all investors. Information presented herein is subject to change without notice and should not be considered as a solicitation to buy or sell any security. Any information prepared by any unaffiliated third party, whether linked to this newsletter or incorporated herein, is included for informational purposes only, and no representation is made as to the accuracy, timeliness, suitability, completeness, or relevance of that information.
The stocks we elect to highlight each quarter will not always be the highest performing stocks in the portfolio, but rather will have had some reported news or event of significance or are either new purchases or significant holdings (relative to position size) for which we choose to discuss our investment tactics. They do not necessarily represent all of the securities purchased, sold or recommended by the adviser, and the reader should not assume that investments in the securities identified and discussed were or will be profitable. A complete list of recommendations by Grey Owl Capital Management, LLC may be obtained by contacting the adviser at 1-888-473-9695.
Grey Owl Capital Management, LLC (“Grey Owl”) is a Virginia registered investment adviser with its principal place of business in the Commonwealth of Virginia. Grey Owl and its representatives are in compliance with the current notice filing requirements imposed upon registered investment advisers by those states in which Grey Owl maintains clients. Grey Owl may only transact business in those states in which it is notice filed or qualifies for an exemption or exclusion from notice filing requirements. This newsletter is limited to the dissemination of general information pertaining to its investment advisory services. Any subsequent, direct communication by Grey Owl with a prospective client shall be conducted by a representative that is either registered or qualifies for an exemption or exclusion from registration in the state where the prospective client resides. For information pertaining to the registration status of Grey Owl, please contact Grey Owl or refer to the Investment Adviser Public Disclosure web site ( www.adviserinfo.sec.gov ).
Advertisement
For additional information about Grey Owl, including fees and services, send for our disclosure statement as set forth on Form ADV using the contact information herein. Please read the disclosure statement carefully before you invest or send money.
Luxury car maker says it ‘remains strongly committed to Crewe’
Elliot Jessett City reporter
07:17, 18 Mar 2026Updated 07:17, 18 Mar 2026
Inside Bentley’s plant in Crewe (Image: Steve Morgan)
Workers at luxury car maker Bentley have been left ‘stunned’ after the company confirmed its intention to cut hundreds of jobs. Union officials said the cuts have ‘come out of the blue’, citing contributing factors such as ‘Trump’s tariffs’ and the continued impact of the covid lockdowns.
Advertisement
Despite recording an operating profit of £186m in 2025, and a seventh consecutive year of profitability, the company said it planned to cut 275 roles, around 6% of its workforce, by cutting up to 150 staff and not filling vacant positions.
The GMB said Bentley had experienced a 40% year-on-year drop in profits, with GMB organiser Karen Lewis adding: “These cuts have come out of the blue and the workforce is stunned.
“Trump’s tariffs’ have hit Bentley hard and the company is still feeling the affects of the covid lockdown.
“GMB will stand side by side with members in Bentley to ensure the minimum redundancies and the maximum pay outs.”
Advertisement
Bentley said it remains committed to UK manufacturing,, reports the Liverpool Echo. It confirmed that work continues on the transformation of its Pyms Lane factory, including the ongoing conversion of the site’s oldest building, which will become the future electric vehicle assembly line.
A spokesperson for Bentley said: “Bentley has delivered a seventh consecutive year of profitability while continuing to invest significantly in the transformation of our Pyms Lane site for the next generation of Bentley vehicles, including our first fully electric model.
“As part of ensuring the business remains competitive and prepared for the future, we have begun a consultation programme covering management, agency and non-manufacturing roles, which could result in up to 275 positions being removed from the organisational structure, which equates to approximately six per cent of the organisation.
“These are difficult decisions and our priority is to support any colleagues who may be affected throughout the consultation process.
Advertisement
“Bentley remains strongly committed to Crewe and continues to invest in the long-term future of luxury car manufacturing at our Pyms Lane site.”
A legal action by Modco liquidators will progress after a 10-month delay, after a successful eleventh-hour bid to continue the dispute in the Federal Court.
TUCSON, Ariz. — More than six weeks after 84-year-old Nancy Guthrie vanished from her home in an affluent Tucson suburb, the investigation into her suspected abduction remains active but without a breakthrough arrest. Pima County Sheriff’s Office and FBI agents continue to analyze evidence, including a mixed DNA sample from the scene and additional surveillance images recovered from her residence, as the case enters its seventh week on March 18, 2026.
Savannah Guthrie & Nancy Guthrie
Nancy Guthrie, mother of NBC “Today” show co-anchor Savannah Guthrie, was last seen at her Catalina Foothills home on the evening of Jan. 31, 2026. Family members dropped her off around 9:30 p.m. local time after dinner. She failed to appear at church the next morning, Feb. 1, prompting a welfare check that escalated into a full-scale missing person probe.
Authorities quickly classified the disappearance as an abduction. Drops of blood believed to be hers were found on the front porch. Her doorbell camera was tampered with or disconnected around 1:47 a.m. on Feb. 1, and footage released by the FBI shows a masked, armed individual at the doorstep that night. Investigators believe she was taken against her will in the middle of the night, possibly while in bed. She left behind her cellphone, medications she requires daily for health conditions, and other essentials — factors that heightened concerns for her well-being early on.
The FBI joined the case immediately, establishing a dedicated tip line (1-800-CALL-FBI) and offering an initial $50,000 reward for information leading to her recovery or an arrest. In late February, the Guthrie family announced a separate $1 million reward, payable only upon Nancy’s safe recovery and consistent with FBI guidelines. Savannah Guthrie, her siblings Annie and Camron, and other relatives have made emotional public appeals via social media videos, pleading for tips and insisting “someone knows how to find our mom and bring her home.”
As of mid-March, no ransom has been confirmed paid, despite early speculation about demands. Pima County Sheriff Chris Nanos has said investigators have a theory on motive and believe the home was targeted, though he stopped short of confirming it definitively. He has not ruled out the possibility the perpetrator could strike again. Family members have been cleared as suspects.
Advertisement
Recent developments include FBI recovery of additional thumbnail images from home security cameras showing people in the yard area before the abduction — but nothing overtly suspicious, sources told outlets including ABC News and CBS News. The images are low-resolution and lack full video. Officials expressed hope in a DNA sample recovered from the scene, describing it as a potential breakthrough for identifying the suspect.
Tip volume surged initially but has tapered, per FBI statements. Investigators have focused on two dates in late January — Jan. 11 and Jan. 24 — and questioned neighbors about nearby construction crews or unusual activity. Experts note the case’s challenges: abductions of elderly individuals are rare (less than 0.2% of reported U.S. kidnappings involve those in their 80s), and the victim’s age complicates survival odds after prolonged captivity without medication.
The disappearance has drawn intense national attention due to Savannah Guthrie’s prominence. Media coverage has included timelines, expert panels on motive theories (ranging from targeted theft to more sinister possibilities), and comparisons to other unsolved cases. Public speculation on forums and social media has ranged from hopeful calls for her return to grim assessments of the odds.
Authorities emphasize the investigation’s ongoing nature. No arrests have been made, and Nancy’s whereabouts remain unknown. Officials urge anyone with information — even seemingly minor details — to contact the FBI anonymously. The family continues to hold out for her safe return while grappling with what experts call “ambiguous loss,” the prolonged grief of uncertainty.
Advertisement
As Day 46 approaches, the search for Nancy Guthrie stands as a stark reminder of vulnerability even in secure neighborhoods. With forensic leads still under review and a substantial reward outstanding, investigators and loved ones alike cling to hope amid the silence.
A persistent divergence between foreign and domestic institutional flows continues to define the trajectory of Indian equities, even as valuations begin to look more reasonable after last year’s excesses. While foreign institutional investors (FIIs) remain cautious, steady domestic inflows are providing a crucial cushion to the market.
Speaking on the evolving dynamics, veteran investor, Manishi Raychaudhuri, noted, “Now, the phenomenon that you mentioned that FIIs are selling and they have been selling for last 18 months roughly and the domestic institutions buying, that is not something new. I mean, we have seen this for last 18 to 24 months.”
He added that the sustained outflows from FIIs have been offset by robust domestic participation, particularly through systematic investment plans (SIPs). “The spate of FII selling has been neutralised by this massive systematic investment plans, the SIPs, that continue to come in, almost about $3 billion every month.”
Global Opportunities vs India’s Structural Story
Advertisement
According to Raychaudhuri, the reluctance of foreign investors is not necessarily a reflection of weakness in India alone, but rather a function of relative attractiveness elsewhere. “The foreign investors have a large firmament, a large universe to choose from and compared to India, they have better choices elsewhere in the emerging market space.”
Live Events
He pointed to North Asian markets, where themes like artificial intelligence and related capital expenditure remain strong, alongside relatively lower geopolitical risks. “So, it is a combination of stronger growth and slightly lower risk that the FIIs are playing.” In contrast, domestic institutional investors continue to benefit from a structural shift in household savings. “This is a direct consequence of the financialization that we have seen, it is not recent, it has been there for about last five to seven years.” Importantly, he believes this trend still has room to run. “Indians are on an average still underinvested in equities… maybe it is still about 85-90-95% of Indian investments would remain focused on the home markets.” Valuations Cooling, But Earnings Still a Concern India’s valuation premium, once a major deterrent, has seen meaningful moderation. “At the peak in September 24 India’s price earnings multiple 12-month forward price earnings multiple was 87% higher… The last 15 years average is about 38-39%. And today India’s premium has actually come down below that level.”
He noted that the current premium of around 35–36% makes India relatively more attractive again. However, that alone may not be enough to trigger a strong return of FII flows. “The FII universe as a whole is not biting into this yet simply because the earnings environment is not yet supportive.”
Highlighting global comparisons, Raychaudhuri said, “If you look at last six months… you have Korea right on top… about 80% upgrade… Taiwan… 20-25%… But the Indian consensus EPS estimate… has still declined over the past six months by about 4.5% or so.”
This lag in earnings revisions remains a key overhang.
Advertisement
Macro Triggers and the Earnings Outlook The outlook for earnings, in turn, hinges on a mix of fiscal, monetary, and external factors. “At some point this large fiscal stimulus that went in in 2025… will begin to have some effect… but it needs to be more sustained.”
He also indicated room for monetary easing, subject to inflation trends. “The central bank can perhaps afford to cut rates a little more… if we do have a situation where the Middle East situation settles down… we could have this concern about earnings destruction behind us.”
A moderation in crude oil prices toward the $60–70 per barrel range could be particularly supportive.
Can Valuations Hold? On the question of sustainable valuation levels, Raychaudhuri struck a cautious note. “If you look at last 15 years average one year forward PE for India, it is about 18.8 times.”
Advertisement
However, he warned that valuations cannot remain elevated without earnings support. “If it remains in single digits, then those high-teens kind of PE are unsustainable.”
He emphasized the importance of reverting to a healthier growth trajectory. “Unless we get back to that situation… nominal GDP growth of about 10% to 12% and therefore corporate revenue and earnings growth of 13% to 14%… it will be difficult for these long range PE multiples to hold on.”
Sectoral Preferences: Banks, Industrials, Consumption Despite near-term uncertainties, Raychaudhuri remains constructive on select pockets of the market. “Private banks… I have been kind of thumping the table on this for quite some time.”
He also highlighted opportunities in industrials and defence. “Defence expenditure is likely to rise stratospherically across the world… Industrials would also cater to India’s infrastructural ambitions.”
Advertisement
On the consumption side, he sees broad-based potential. “I would also be looking at consumer discretionaries in India… auto companies… household electronics goods… even some of the hospital and diagnostic chains.”
Additionally, cyclical sectors could offer tactical opportunities. “In the near term some of the cyclical sectors like base metals could also do well.”
IT Under Pressure One notable exclusion from his preferred list is information technology. “I have stayed away from Indian IT for… almost a year now.”
He believes structural changes driven by artificial intelligence could weigh on the sector. “Indian IT… they are the classic AI losers… the average man-hour rate comes down and therefore the valuations of the IT companies come down.”
Advertisement
With earnings growth in single digits and valuations still elevated, he added, “They are trading at about 18 to 20 times PE, simply not sustainable.”
Australia’s share market has logged a second session of gains on easing oil prices, and as the Reserve Bank’s recent split interest rate decision softened the outlook for future hikes.


 WTI
WTI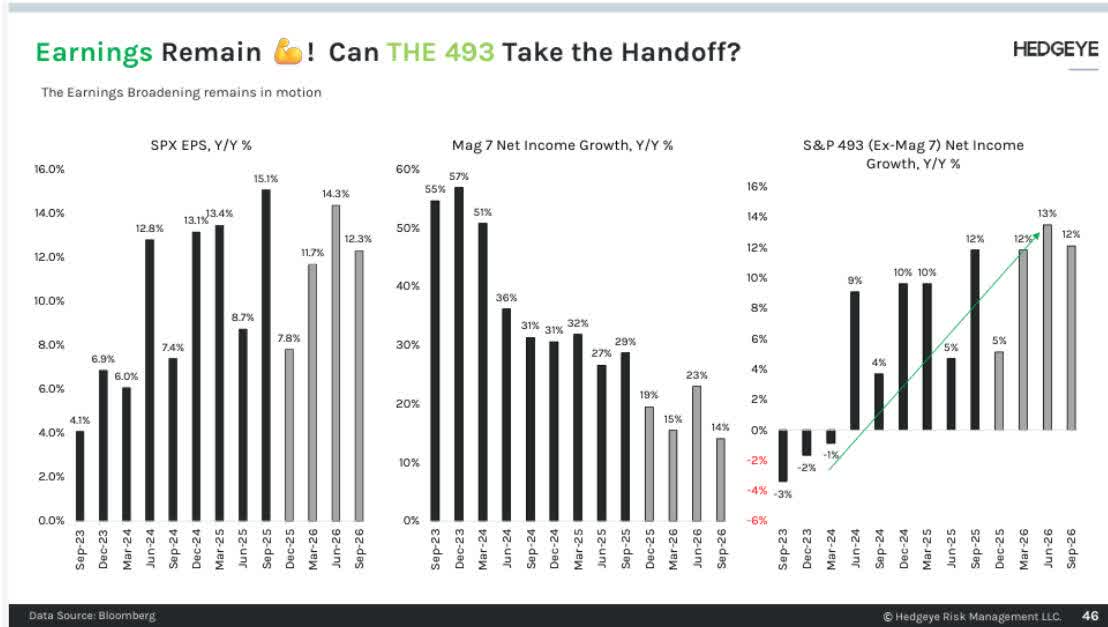


You must be logged in to post a comment Login