
Business
Grey Owl Capital Management Q4 2025 Client Letter

Donny DBM/iStock via Getty Images

Expansion create opportunity. – Anonymous
Dear Client,
The Grey Owl All-Season Strategy’s objectives are to minimize drawdowns, outperform short-term bonds by several hundred basis points each year (i.e., beat “cash”), and participate meaningfully in risk-on rallies. For the full year 2025, GOAS returned +11.4% and met each of these objectives.
We are particularly pleased with the strategy’s 2025 performance given how the year began. While the popular “Magnificent 7 (MAGS)” group of stocks declined roughly -30% from its December 17, 2024 peak to the April 8, 2025 low 1 , the Grey Owl All-Season (GOAS) portfolio was down less than -3% at its worst point in early April. The rebound that followed was rapid, and the year ultimately proved strong for most risk assets. GOAS managed risk during the drawdown and then repositioned to participate as conditions turned risk-on.
A few specifics below on the present environment and our current positioning, but first a more detailed review of the performance of the “primary” asset classes. 2
For the full year 2025, gold gained +63.7%, global equities rose +22.4%, U.S. equities followed closely at +17.7%, commodities increased 5.9%, and long-dated U.S. Treasury bonds returned +4.3%.
During the fourth quarter of 2025, precious metals continued to shine, with gold up another +11.5%. U.S. equities gained +2.7%, while global equities performed slightly better at +3.3%. Commodities were essentially flat, up +0.4%, and long-dated U.S. Treasury bonds declined -1.0%. Over this period, GOAS delivered a respectable +2.4% return.
As 2026 gets underway, a more dramatic shift may be developing. In 2025, technology and growth outperformed the broader market (i.e., the Nasdaq beat the S&P 500, finishing up +20.8%), while small-capitalization stocks lagged, ending the year up +12.7%. 3 That dynamic has changed meaningfully during the first three weeks of 2026.
As of the close on January 23, 2026, the “Magnificent 7” group was down -3.6% from its October 29, 2025, high and -0.5% year-to-date. In contrast, small-capitalization equities and commodities are significantly outperforming, up +7.6% and +7.4% year-to-date, respectively. GOAS is aligned with these prevailing conditions and is up +5.3% through January 23, 2026.
In short, our diversified, risk-managed approach delivered solid double-digit returns in 2025 while avoiding major drawdowns during early-year volatility. Today, we are positioned for meaningful economic growth in the U.S. and much of the rest of the world. We believe conditions now favor cyclical outperformance and a broadening of equity participation. That means overweight exposure to commodities and smaller-capitalization equities. As the charts below indicate, this phase may only persist through the first half of 2026. For now, that is the prevailing condition regardless of how long it lasts. We are prepared to adjust as conditions evolve.
Economic Growth
Hedgeye’s real GDP projection model shows a reacceleration in growth gaining significant momentum in the first quarter and continuing through much of the second quarter. As growth has accelerated, cyclical equities and commodities have outperformed. While this acceleration continues, we expect risk assets to continue performing well.
Figure 1 – GDP Projections
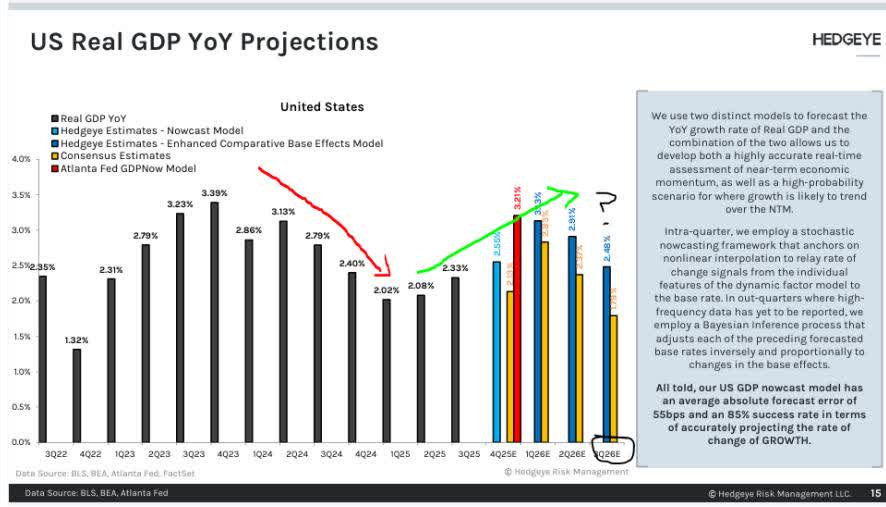
Economic growth is accelerating, which historically supports risk assets—particularly cyclical equities and commodities.
Inflation
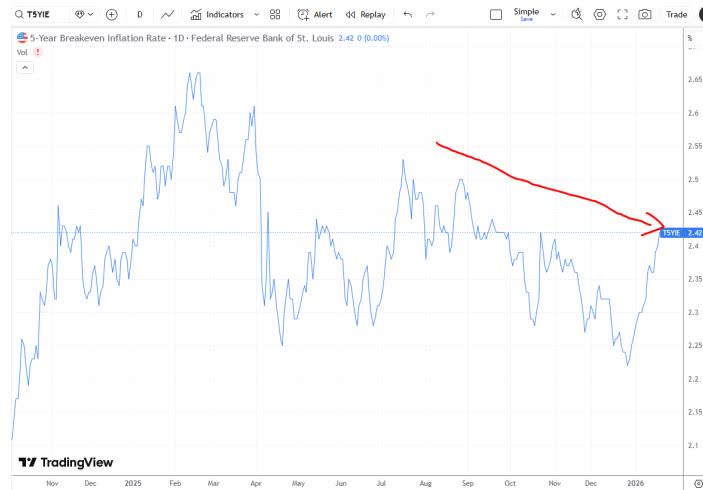
Inflation expectations have been decelerating for several quarters, as evidenced by the five-year breakeven spread—often referred to as “the market’s” inflation forecast.
Figure 2 -5-Year Breakeven
Hedgelye’s CPI model corroborates this trend, projecting continued disinflation through the second quarter of 2026, followed by only a modest seven-basis-point increase in the third quarter. Combined with accelerating growth, this backdrop is favorable for risk-taking.
Figure 3 – Inflation Projections
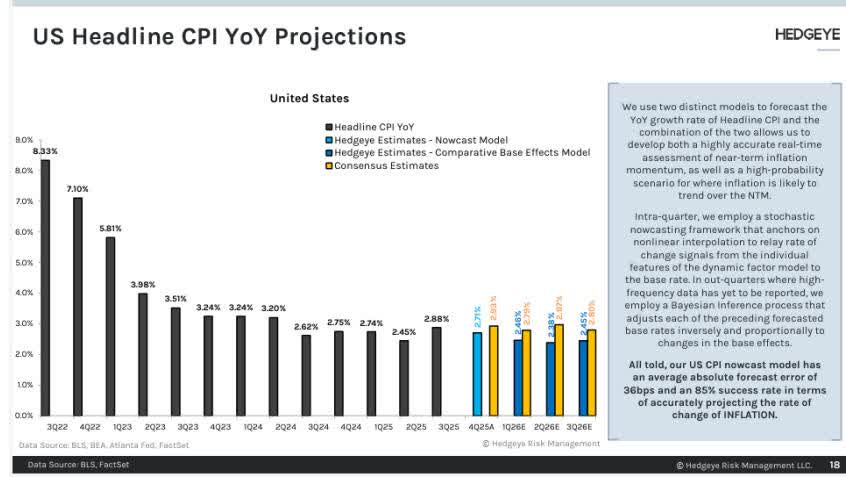
A key driver of lower inflation has been the price of oil—one of the few major commodities not yet firmly in a bull market.
Figure 4 -US Crude Oil Spot

Inflation pressures remain contained, creating a favorable backdrop for risk-assets.
Broadening US Equity Market
While the broader macro environment—accelerating real growth alongside disinflation—is critical to the rally’s expansion, sector-level dynamics are also playing an important role. Mega-capitalization technology companies are now facing more difficult year-over-year comparisons, as cycle-peak artificial-intelligence capital expenditures may be behind us, pressuring both revenue growth and margins.
The opposite is true for much of the rest of the market, particularly smaller-capitalization and cyclical businesses. With easier comparisons to last year, both revenues and margins are improving.
Hedgeye data show that while S&P 500 earnings are expected to continue growing, a greater share of that growth is coming from the “other 493” stocks.
Figure 5 – Earnings Projections
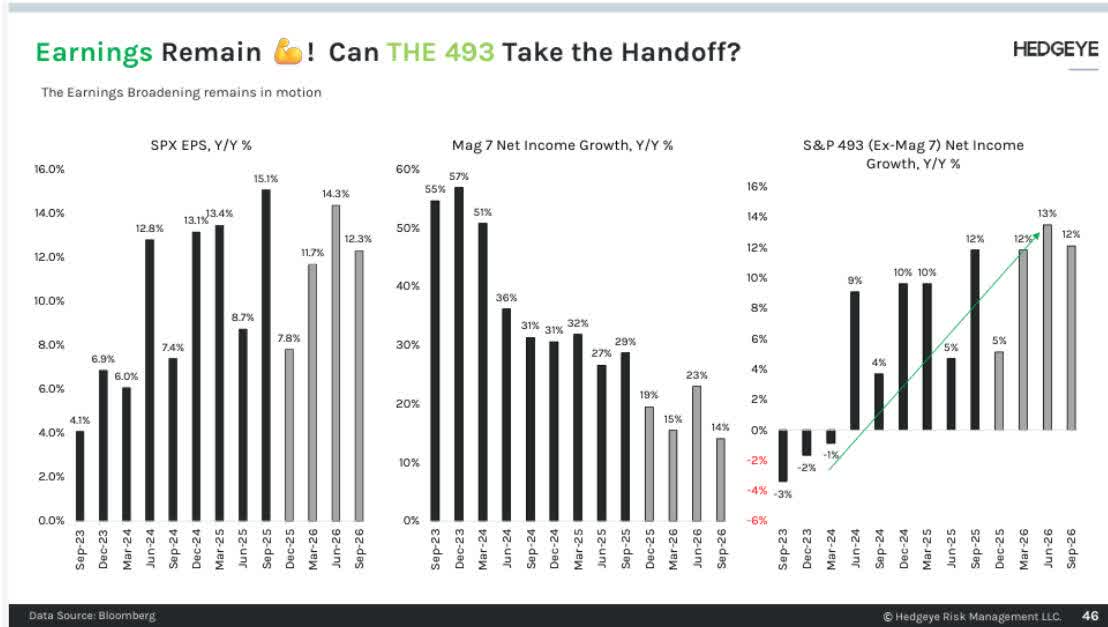
Market leadership is expanding beyond mega-cap technology, increasing opportunity across smaller and more cyclical companies.
Market Signals
Last quarter we wrote:
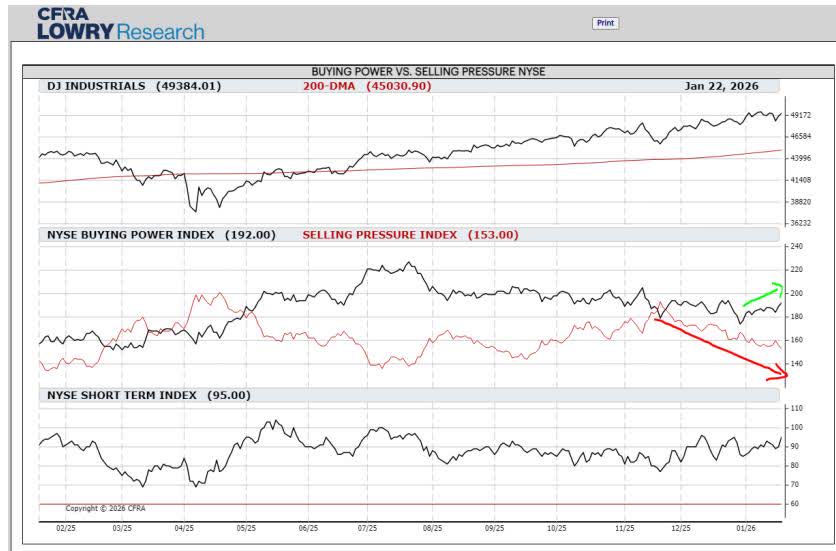
Market internals also point to change beneath the surface. While large-cap indices hit new highs in the third quarter, participation was narrow—signs of enthusiasm were limited. In October, that pattern began to broaden as Buying Power improved and Selling Pressure eased. With Buying Power still stronger overall, we do not see a shift toward a risk-off environment. Instead, the data suggest equity markets are transitioning as investors respond to—and anticipate—changes in growth and inflation, opening the door for new leadership among sectors and styles.
That improvement and broadening has continued. Selling Pressure is receding, and Buying Power shows further signs of strengthening.
Figure 6
More granular market data look even better. Lowry’s writes:
While many investors and the financial media are focused on the cap-weighted price indexes, the Lowry Analysis is predominantly centered on the full market on an equal weighted basis, which is dominated by smaller stocks. The reason for this is simple: the greater the number of stocks participating in a market advance and displaying promising Demand trends, the more difficult it is for sellers to take control of the market. While such features do not make the market impervious to pullbacks, recent evidence continues to mount in favor of a broad and durable advance. Still, we would like to see these improvements reflected in our longer-term measures of market health to solidify our conviction in the bulls further.
In their most recent weekly report, Lowry’s emphasized the dramatic increase in the percentage of stocks within 2% of their 52-week highs.
Figure 7
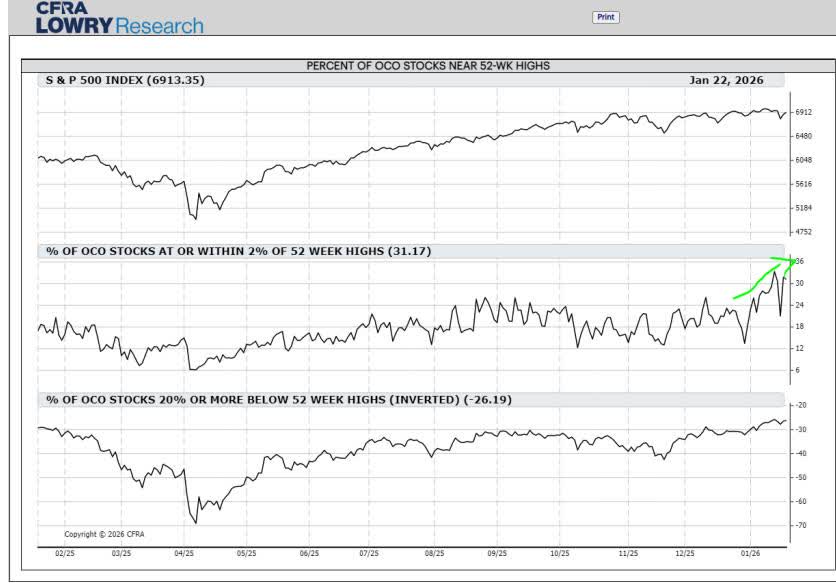
Explaining the chart, Lowry’s wrote:
One method to view how many stocks are carrying the performance load within the market is our measure of Demand intensity, or the Percent of OCO1 Stocks At or Within 2% of 52-Week Highs. This is one of the more sensitive indicators in our suite, and on January 15, it reached a one-year high of 33.36%. While this was an impressive development, the indicator moving above its multi-month range is perhaps even more important. It essentially reflects a change in character within demand intensity from good to great, as the OCO Index is dominated by smaller stocks. The more stocks that reach new highs, the stronger the market’s constitution ultimately becomes.
Market internals support the case for a broader, more durable advance.
Current Positioning
Our current portfolio remains balanced within an all-season framework but is more aggressive than when we last reported in October 2025. Since last quarter, we have increased exposure to U.S. small-capitalization equities, expanded global equity exposure—particularly in emerging markets—and added to precious metals and commodities. Fixed income and cash allocations declined from 28% to 16%.
Figure 8 – GOAS Allocation
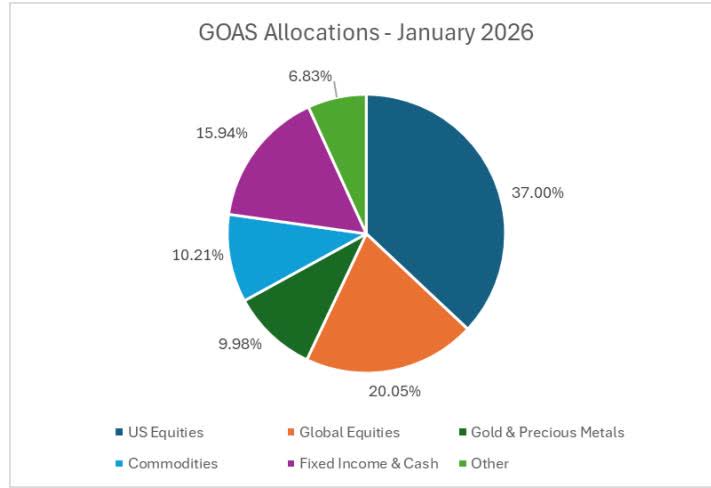
This positioning maintains meaningful protection against inflation or market stress while remaining tilted toward growth. This balance—rooted in our all-season philosophy and adjusted for present conditions—reflects our core belief: don’t try to predict the future; position with prevailing conditions while diversifying to enable success across many possible futures.
The portfolio remains balanced but is intentionally tilted toward growth.
As always, if you have any thoughts regarding the above ideas or your specific portfolio that you would like to discuss, please feel free to call us at 1-888-GREY-OWL.
Sincerely,
Grey Owl Capital Management
Editor’s Note: The summary bullets for this article were chosen by Seeking Alpha editors.


Iranians expect no post-war respite under military rule

Google in talks with Marvell to build new AI chips for inference, The Information reports

CUPERTINO, California — Apple’s long-rumored foldable iPhone, widely expected to carry the premium “Ultra” branding, is shaping up as the most ambitious device in the company’s smartphone history ahead of a anticipated September 2026 launch.

Industry analysts and supply chain reports indicate the iPhone Ultra will represent a new top-tier model alongside the iPhone 18 Pro and Pro Max, potentially priced north of $2,000 and introducing a book-style foldable design that transforms from a compact phone into a tablet-like experience. As excitement builds in April 2026, here are 10 key things enthusiasts and potential buyers must know about this groundbreaking device based on the latest leaks and expert analysis.
- It’s Apple’s First Foldable iPhone, Likely Named iPhone UltraThe device marks Apple’s entry into the foldable smartphone category after years of development and patent filings. Multiple reliable sources, including Bloomberg’s Mark Gurman and Chinese leakers such as Instant Digital, suggest it will be branded as the iPhone Ultra rather than simply iPhone Fold. This naming aligns with Apple’s Ultra strategy seen in the Apple Watch Ultra and rumored future MacBook and AirPods models, positioning it as the ultimate premium offering in the lineup.
- Book-Style Design with Passport-Like Form FactorUnlike many competing foldables that open like a book with a tall aspect ratio, the iPhone Ultra is expected to feature a wider, more square “passport-style” shape when closed. This design choice aims for better one-handed usability and pocketability. When unfolded, it delivers a large inner display while maintaining a slim profile that could redefine mobile productivity and media consumption.
- Dual Displays: 5.5-Inch Outer and 7.8-Inch InnerThe outer screen when folded is rumored to measure approximately 5.5 inches, providing a functional phone experience without needing to unfold for quick tasks. Once opened, users gain access to a expansive 7.8-inch inner OLED panel — nearly the size of an iPad mini — with expectations of minimal or no visible crease thanks to advanced display technology. This setup could enable seamless multitasking, split-screen apps and immersive video or gaming.
- Ultra-Thin Profile at Just 4.5mm UnfoldedDurability meets elegance in the reported 4.5mm thickness when open, making it Apple’s thinnest iPhone to date. Achieving this slimness while incorporating a hinge mechanism has been a significant engineering challenge. The closed thickness is expected around 9-10mm, still competitive with current flagships while offering the foldable advantage.
- Titanium Frame with Advanced Hinge TechnologyA hybrid titanium-aluminum chassis is anticipated for strength and lightness, with the hinge potentially incorporating “liquid metal” or amorphous metal alloys for superior durability and smooth operation. Titanium provides rigidity in critical areas prone to stress during repeated folding, addressing common foldable concerns like creasing or hinge wear over time.
- Touch ID Replaces Face IDIn a notable departure from recent iPhones, the Ultra may ditch Face ID in favor of Touch ID integrated into the power button or side. This shift could stem from challenges fitting under-display sensors into the foldable architecture while maintaining security and convenience, especially across both inner and outer displays.
- Powerful A20 Chip and Enhanced PerformanceThe device is expected to be powered by Apple’s next-generation A20 Pro chip, built on a cutting-edge 2-nanometer process. Paired with up to 12GB of RAM, it promises significant gains in speed, efficiency and AI capabilities. This hardware foundation should support demanding tasks like advanced Apple Intelligence features, professional-grade video editing and high-end gaming across the larger unfolded screen.
- Dual 48MP Camera SystemPhotography enthusiasts can look forward to a dual rear camera array featuring two 48MP sensors — likely a main wide and ultrawide — arranged horizontally on a shorter camera plateau. Additional front-facing cameras, possibly including one on the inner display, would enable high-quality selfies and video calls in both folded and unfolded modes. The setup aims to deliver pro-level imaging without the bulk of a triple or quad camera bump.
- Massive Battery for All-Day — or Longer — UseRumors point to one of the largest batteries ever in an iPhone, potentially in the 5,400mAh to 5,800mAh range. This capacity is crucial to power both displays and the more power-hungry foldable mechanics while delivering exceptional endurance. Combined with the efficient A20 chip, the Ultra could offer substantially better battery life than current models, especially during productivity or media sessions.
- Premium Pricing and September 2026 Launch TimelineExpect a starting price exceeding $2,000, reflecting the advanced materials, dual-display technology and engineering investments. While some reports mention possible minor production delays pushing full availability to late 2026 or early 2027, most analysts still point to a September announcement window alongside the iPhone 18 Pro models. Pre-orders could begin shortly after reveal, with initial supply likely constrained due to the complex manufacturing process.
Beyond these core details, the iPhone Ultra is poised to introduce software optimizations in iOS 27 tailored for foldables, including improved app continuity when unfolding, enhanced multitasking gestures and better support for productivity apps. The larger inner canvas could make it a compelling alternative to carrying both a phone and a small tablet.
Challenges remain in the development phase. Supply chain reports have noted engineering hurdles around display durability and hinge reliability, though recent updates suggest Apple is on track for a 2026 debut. The foldable market is already competitive, with Samsung, Google and Chinese manufacturers offering mature options, but Apple’s reputation for polish and ecosystem integration could set a new standard.
Consumer interest appears high despite the expected premium cost. Social media discussions and analyst projections highlight demand from professionals needing portable productivity tools, content creators seeking larger canvases for editing and everyday users drawn to the novelty of a device that adapts to different use cases.
Apple has not officially confirmed any specifications or even the existence of the iPhone Ultra as of April 2026. All details stem from supply chain leaks, dummy unit analyses and reports from credible journalists. Historically, Apple’s foldable ambitions have been subject to delays as the company prioritizes quality over rushing to market.
If realized as described, the iPhone Ultra could reshape not only Apple’s iPhone strategy but the broader smartphone landscape. It represents a bold step beyond incremental upgrades seen in recent Pro models toward truly transformative hardware. For users weighing a purchase, the combination of premium build, expansive display and powerful internals may justify the higher entry point for those seeking the ultimate iPhone experience.
As summer approaches, more concrete information may emerge through regulatory filings, prototype sightings or developer hints in beta software. Until then, the iPhone Ultra remains one of the most anticipated tech releases of 2026, promising to blend the best of phone and tablet worlds in Apple’s signature refined style.
Whether it fully lives up to the hype will depend on real-world testing for crease visibility, hinge longevity and everyday usability. Early indications, however, suggest Apple is aiming for a device that feels less like a compromise and more like a seamless evolution — one that could finally make foldables mainstream for iOS loyalists.
In the meantime, current iPhone owners evaluating upgrades should monitor official channels closely. The Ultra’s arrival may prompt a refresh cycle for those wanting the latest in form factor innovation, even at a steeper price.

JioBlackRock Mutual Fund, a new entrant, reported an AUM of Rs 15,258 crore in March, with HDFC Bank and ICICI Bank as its top holdings. The portfolio also includes Bharti Airtel, Reliance Industries, Infosys and ITC, based on data from Prime Database.

Iran says no date set for next round of negotiations with US
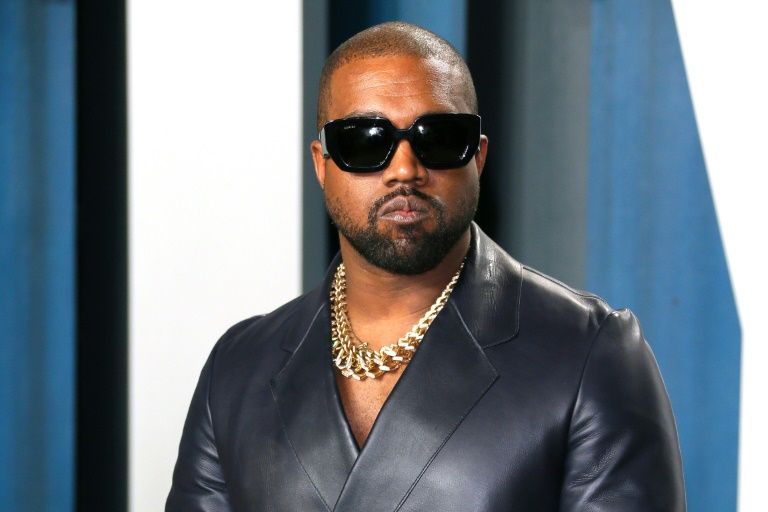
INDIO, California — Kanye West, performing as Ye, did not appear at the Coachella Valley Music and Arts Festival in 2026, despite circulating rumors and reports that he offered to perform for free. Organizers reportedly declined the proposal, leaving the controversial rapper absent from both weekends of the sold-out event that wrapped up Sunday, April 19.

The 2026 edition of Coachella, marking its 25th year at the Empire Polo Club, featured headliners Sabrina Carpenter, Justin Bieber and Karol G. No official lineup inclusion or surprise guest slot materialized for West, whose name sparked heated online debates rather than stage appearances. Fans and critics alike weighed in on whether the festival should have considered him, with many expressing relief at his exclusion given his history of inflammatory remarks.
Reports emerged in the weeks leading up to the festival that West had reached out about a potential performance, even proposing to do it without compensation. Insiders and social media discussions suggested Goldenvoice, the festival promoter, passed on the idea. This decision aligns with broader industry caution following West’s past controversies, including antisemitic statements that led to lost partnerships and public backlash. Similar scrutiny has affected his other 2026 bookings, such as headlining Wireless Festival in London, where major sponsors like Pepsi pulled support.
Coachella 2026 ran April 10-12 for Weekend 1 and April 17-19 for Weekend 2. The announced lineup emphasized pop, Latin, electronic and indie acts, with additional performances from The Strokes, The xx, Anyma, Young Thug and others. Surprise guests included appearances tied to headliners and supporting sets — such as Ty Dolla ignjoiningYoungThugfor”Carnival,”atrackfromthe¥ ign joining Young Thug for “Carnival,” a track from the ¥ ignjoiningYoungThugfor”Carnival,”atrackfromthe¥ collaborative project with West — but West himself stayed off the desert stages.
West has maintained a busy 2026 calendar outside Coachella. He kicked off a series of comeback shows with two sold-out performances at SoFi Stadium in Inglewood on April 1 and April 3, marking his first major U.S. stadium appearances in years. Those “Homecoming” concerts featured elaborate production and drew tens of thousands, generating viral moments and renewed discussion about his live draw despite the controversies.
His planned international tour dates include stops in India, Turkey, the Netherlands and elsewhere, though some shows have faced cancellations due to logistical or external pressures. The absence from Coachella adds to a pattern of near-misses: West was slated to headline in 2022 but pulled out at the last minute, and earlier creative disputes derailed a 2019 dome-stage concept.
Festival organizers have remained silent on the reported offer, focusing instead on delivering a smooth event. Attendance appeared strong, with the lineup selling out quickly after its September 2025 announcement. Livestreams on YouTube allowed global viewers to catch sets, while social media buzz centered on the headliners’ energy, fashion moments and unexpected collaborations rather than any West-related drama.
For many attendees and online observers, the decision to keep West off the bill reflected evolving standards in festival booking. Discussions on platforms like Reddit and X highlighted his past praise of Adolf Hitler, “White Lives Matter” shirt promotions and other statements that alienated brands, collaborators and segments of the audience. While some die-hard fans argued for separating the art from the artist and celebrated his catalog of hits, critics maintained that platforms like Coachella carry a responsibility to consider the full impact of their bookings.
Coachella has a long history with West. He performed memorable sets in earlier years, including a headline turn and the debut of his Sunday Service choir concept in 2019 from a hillside overlooking the grounds. Those appearances helped cement his reputation as a boundary-pushing live performer capable of blending gospel, hip-hop and spectacle. Yet repeated controversies in the years since shifted the conversation from innovation to accountability.
This year’s festival leaned into safer, high-energy pop and genre-crossing appeal. Sabrina Carpenter brought theatrical production to her Friday headline slots, Justin Bieber delivered nostalgic and current hits on Saturday with several guests, and Karol G made history as the first Latina headliner on Sunday. Electronic and alternative acts filled out the bill, creating a balanced experience that avoided the polarization a West appearance might have invited.
Rumors of a possible Kanye cameo persisted into Weekend 2, fueled by fan leaks, concept videos on YouTube imagining full sets, and TikTok speculation. One viral clip even teased “Yeezy throwing a party at Coachella,” but no such moment occurred. Instead, the biggest talking points remained the official surprises and the overall vibe under clear desert skies — with some wind-related adjustments affecting Anyma’s elaborate production.
Industry analysts note that festivals increasingly weigh reputational risks against star power. While West retains a dedicated following and proven ability to sell tickets — as evidenced by the SoFi shows — the potential for backlash, sponsor flight and internal divisions has made many promoters hesitant. The Wireless Festival situation in the UK, where government figures publicly criticized the booking and sponsors withdrew, served as a cautionary tale playing out in real time.
For West, the Coachella snub represents another chapter in a turbulent comeback phase. After years of limited public performances amid personal and professional setbacks, the 2026 SoFi dates signaled intent to reclaim stadium stages. His catalog — spanning groundbreaking albums like “The College Dropout,” “My Beautiful Dark Twisted Fantasy” and later experimental works — continues to influence artists across genres. Yet translating that legacy into festival slots has proven complicated.
Fans who hoped to see him in the desert instead turned to alternatives: replaying old Coachella footage, attending his tour dates or streaming new material. Some expressed disappointment at missing a potential high-energy set of classics mixed with fresh tracks from the anticipated “Bully” album. Others viewed the exclusion as overdue accountability, arguing that artistic talent does not override harmful rhetoric.
As the final notes faded on April 19 and cleanup crews moved in, Coachella 2026 will be remembered for its headliners’ strong showings, cultural milestones and relatively drama-free run — at least regarding any Kanye-related fireworks. The festival’s ability to sell out without relying on polarizing figures underscores its enduring appeal and adaptability.
Looking ahead, questions remain about West’s future live prospects. His 2026 tour plans extend into the summer and beyond, with some dates already adjusted. Whether additional U.S. festivals or arenas will book him likely depends on how his recent performances are received and whether public sentiment continues to shift.
In the end, Coachella 2026 answered the lingering question clearly: Kanye West was not performing on its stages this year. The decision, whether driven by logistics, optics or deliberate choice, kept the focus on the music and artists who did take the polo fields by storm. For better or worse, the desert festival moved forward without one of hip-hop’s most influential — and divisive — voices.
As videos from the SoFi shows and fan-edited “Coachella concept” sets continue circulating, the conversation around West’s place in modern music festivals is far from over. For now, though, the 2026 edition closed its gates without him, leaving the spotlight on a new generation of stars who filled the valley with sound.

Brad Thomas has over 30 years of real estate investing experience and has acquired, developed, or brokered over $1B in commercial real estate transactions. He has been featured in Barron’s, Bloomberg, Fox Business, and many other media outlets. He’s the author of four books, including the latest, REITs For Dummies. Brad, along with HOYA Capital, lead the investing group iREIT®+HOYA Capital. The service covers REITs, BDCs, MLPs, Preferreds, and other income-oriented alternatives. The team of analysts has a combined 100+ years of experience and includes a former hedge fund manager, due diligence officer, portfolio manager, PhD, military veteran, and advisor to a former U.S. President. Note: Brad is also related to Nicholas Thomas who contributes to Seeking Alpha. Learn more
Analyst’s Disclosure: I/we have a beneficial long position in the shares of ADC, EPRT, O, VICI, BX either through stock ownership, options, or other derivatives. I wrote this article myself, and it expresses my own opinions. I am not receiving compensation for it (other than from Seeking Alpha). I have no business relationship with any company whose stock is mentioned in this article.
Seeking Alpha’s Disclosure: Past performance is no guarantee of future results. No recommendation or advice is being given as to whether any investment is suitable for a particular investor. Any views or opinions expressed above may not reflect those of Seeking Alpha as a whole. Seeking Alpha is not a licensed securities dealer, broker or US investment adviser or investment bank. Our analysts are third party authors that include both professional investors and individual investors who may not be licensed or certified by any institute or regulatory body.
Saudi Arabia stocks lower at close of trade; Tadawul All Share down 0.78%

LOS ANGELES — Netflix’s acclaimed anthology series “Beef” returned on April 16, 2026, with an entirely new cast and a fresh tale of escalating conflict set against the polished lawns of a Southern California country club, drawing immediate buzz for its powerhouse ensemble and sharp exploration of class, marriage and generational tension.

Creator Lee Sung Jin, who helmed the Emmy-winning first season starring Ali Wong and Steven Yeun, transformed the dark comedy into a true anthology format. Season 2 ditches the road-rage origins of Danny Cho and Amy Lau for a multi-couple saga involving blackmail, ambition and fragile egos among the wealthy and the striving. All eight roughly 30-minute episodes dropped at once, allowing viewers to binge the chaotic spiral in a single sitting.
At the center stands Oscar Isaac as Joshua Martín, the embattled general manager of the Monte Vista Point Country Club. Isaac, known for roles in “Dune” and “Scenes From a Marriage,” portrays a man whose outwardly successful life — complete with a chic home and club perks — masks deep financial strain and a crumbling marriage. His on-screen wife, Lindsay Crane-Martín, is played by Carey Mulligan, the Oscar-nominated star of “Promising Young Woman” and “Maestro.” Lindsay, an interior designer chasing upscale clients, brings brittle ambition and quiet desperation to the role.
The couple’s heated private argument spills into public view when it is witnessed by a younger, engaged pair working at the club. Charles Melton, fresh from acclaim in “May December” and “Warfare,” portrays Austin Davis, a Gen Z personal trainer dreaming of bigger things while scraping by on club wages. Opposite him is Cailee Spaeny as Ashley Miller, Austin’s fiancée, who is tired of frozen-pizza dinners and lack of health insurance. Spaeny, recognized for “Priscilla,” “Civil War” and “Alien: Romulus,” infuses Ashley with a mix of youthful optimism and growing resentment.
What begins as an accidental eavesdropping quickly evolves into a messy web of favors, coercion and mutual blackmail as the two couples vie for favor with the club’s elite. The younger pair sees an opportunity to climb the social ladder, while Josh and Lindsay fight to protect their status. The story spreads across three generations, blending millennial midlife crises with Gen Z hustle and the calculated world of older wealth.
Supporting the leads is a glittering array of talent that has critics and fans raving about the casting coup. Oscar-winning actress Youn Yuh-jung (“Minari,” “Pachinko”) appears as Chairwoman Park, the intimidating new Korean owner of the country club. Her character wields financial power with quiet authority while navigating her own complicated relationship. Song Kang-ho, the “Parasite” star making a notable television foray, plays Dr. Kim, Chairwoman Park’s husband, whose past medical scandal threatens to unravel their luxurious life. Portions of their storyline were filmed in Seoul, adding authentic cultural layers.
Additional cast members include Seoyeon Jang as Eunice, Chairwoman Park’s translator and aide; William Fichtner as Troy; Mikaela Hoover; and rising talents such as Matthew Kim. A K-pop idol also joins the ensemble, bringing contemporary flavor to the club’s social scene. The showrunner has described the casting of Youn and Song as a personal “bucket-list dream,” reflecting his deep admiration for Korean cinema.
Steven Yeun and Ali Wong, the breakout stars of season 1, do not appear on screen this time. Their characters’ story concluded definitively in the hospital-bed finale of the first season. However, both returned as executive producers and offered behind-the-scenes support, including sending food trucks to the crew and joining the new cast for team-building activities such as an escape room outing. Lee has emphasized that the anthology approach allows each season to stand alone while maintaining the series’ core DNA of rage-fueled escalation born from everyday pressures.
Early audience and critical reactions highlight the cast’s chemistry and the show’s willingness to tackle uncomfortable truths about money, comparison and the American dream. Some reviewers praised the performances, particularly Mulligan’s layered portrayal of a woman masking insecurity with polish and Melton’s nuanced take on youthful ambition colliding with reality. Others noted the season feels more expansive — and at times overstuffed — compared with the tight two-hander focus of season 1, with subplots involving the club owner and staff pulling the narrative in multiple directions.
Lee Sung Jin returned as creator, showrunner and executive producer, collaborating again with A24. Jake Schreier directed, and several cast members, including Isaac, Mulligan, Melton and Spaeny, took on executive producer roles. The production maintained the sharp writing and dark humor that earned season 1 eight Emmy Awards, along with multiple Critics Choice, Golden Globe and SAG honors.
Interviews with the cast reveal a collaborative spirit on set. Melton described the environment as supportive, with the older stars mentoring younger performers. Isaac and Mulligan, who share intense marital scenes, spoke about the challenge of portraying a couple whose love has soured under financial and social strain. Spaeny highlighted the generational contrast, noting how Ashley’s perspective on hustle culture clashes with the established couple’s more entrenched disappointments.
The country club setting serves as both backdrop and pressure cooker. Lavish golf courses, exclusive events and unspoken hierarchies amplify the characters’ insecurities. Themes of class warfare, immigrant ambition and the illusion of success echo season 1 but shift focus to how wealth insulates some while exposing others. A subplot involving medical malpractice and club finances adds stakes that ripple through all the relationships.
Social media lit up immediately after the April 16 premiere. Hashtags such as #BeefSeason2 and #CountryClubBeef trended, with viewers sharing theories about escalating betrayals and debating which couple’s “beef” felt most relatable. Clips of tense confrontations between Isaac and Mulligan, alongside Melton and Spaeny’s wide-eyed reactions, circulated widely. The inclusion of Korean screen legends Youn and Song drew particular praise from international audiences and Asian American viewers appreciative of the expanded cultural representation.
Netflix has not released official viewership numbers yet, but early indicators suggest strong engagement consistent with the platform’s biggest limited series launches. The binge-release model encouraged immediate discussions on platforms such as Reddit’s r/BeefTV and X, where fans dissected the ending and speculated about potential future seasons.
Lee has left the door open for more installments, noting that early pitches included multiple “beef” concepts. Whether season 3 materializes will likely depend on audience response to this sophomore outing. For now, the focus remains on the current cast’s ability to deliver the same addictive mix of cringe comedy, emotional depth and shocking twists that made the original so memorable.
As April 19, 2026, unfolds, “Beef” season 2 continues to spark conversations about performance, privilege and the small decisions that snowball into life-altering conflicts. With its star-studded lineup and bold storytelling, the new season proves the series can thrive beyond its original leads while staying true to its roots in human frailty and escalating absurdity.
From the sun-drenched fairways of Monte Vista Point to the quiet betrayals unfolding behind mansion doors, the latest “Beef” delivers a fresh serving of drama that feels both timely and timeless. Audiences hungry for more after the first season’s success are finding plenty to chew on in this ambitious, if occasionally crowded, follow-up.


Blue Origin says it has landed reused New Glenn rocket booster

ZionSiphon malware designed to sabotage water treatment systems
Police watchdog to probe fatal crash after car drove wrong way down motorway

Iranians expect no post-war respite under military rule

Why Israel is blocking foreign journalists from entering

Bitcoin: We’re Entering The Most Dangerous Phase

Alan Cumming Brands Baftas Ceremony A ‘Triggering S**tshow’

Did you know you can do this with a $100 bill? #cash #money #trick #hundred

When Life Gets Hard, Choose Financial Stability | April 16, 2026

Wallet with no money. #viral #funny #comedy #shortvideos #reaction #viralvideo #viralshorts #prank
-
 NewsBeat7 days ago
Pep Guardiola and Gary Neville agree over Arsenal title problem that benefits Man City
-

 Crypto World6 days ago
The SEC Conditionalises DeFi Platforms to Be Avoided for Broker Registration
-

 Fashion2 days ago
Weekend Open Thread: Theodora Dress
-

 Politics7 days ago
World Cup exit makes Italy enter crisis mode
-

 Crypto World6 days ago
SEC Signals Exemption for Crypto Interfaces From Broker Registration
-

 News Videos4 days ago
Secure crypto trading starts with an FIU-registered
-

 Sports2 days ago
NWFL Suspends Two Players Over Post-Match Clash in Ado-Ekiti
-

 Crypto World5 days ago
SEC Proposes Certain Crypto Interfaces Don’t Need to Register as Brokers
-

 NewsBeat5 days ago
Trump and Pope Leo: Behind their disagreement over Iran war
-

 Politics2 days ago
Palestine barred from entering Canada for FIFA Congress
-

 Crypto World2 days ago
Russia Pushes Bill to Criminalize Unregistered Crypto Services
-

 Sports6 days ago
NWFL opens Pathway for new Clubs ahead of 2026 Season
-
 Business3 days ago
Creo Medical agree sale of its manufacturing operation
-

 Crypto World6 days ago
Trump whales load up ahead of Mar-a-Lago luncheon.
-
Business6 days ago
Kering slides after Morgan Stanley downgrade, Gucci woes loom
-
 Entertainment5 days ago
Brand New Day’ Footage Reveals the Devastating Impact of ‘Now Way Home’
-

 Politics4 hours ago
Zack Polanski demands ‘council homes not luxury flats for foreign investors’
-
 Crypto World7 days ago
Sei Network Enters Quiet Reset Phase as On-Chain Metrics Signal a Slowdown in 2026
-

 Tech6 days ago
Google adds E2E encryption to Gmail for iOS and Android enterprise users
-

 Tech6 days ago
Apple glasses won’t go brand shopping like Meta did with Ray-Ban and Oakley
You must be logged in to post a comment Login