
Business
Grey Owl Capital Management Q4 2025 Client Letter

Donny DBM/iStock via Getty Images

Expansion create opportunity. – Anonymous
Dear Client,
The Grey Owl All-Season Strategy’s objectives are to minimize drawdowns, outperform short-term bonds by several hundred basis points each year (i.e., beat “cash”), and participate meaningfully in risk-on rallies. For the full year 2025, GOAS returned +11.4% and met each of these objectives.
We are particularly pleased with the strategy’s 2025 performance given how the year began. While the popular “Magnificent 7 (MAGS)” group of stocks declined roughly -30% from its December 17, 2024 peak to the April 8, 2025 low 1 , the Grey Owl All-Season (GOAS) portfolio was down less than -3% at its worst point in early April. The rebound that followed was rapid, and the year ultimately proved strong for most risk assets. GOAS managed risk during the drawdown and then repositioned to participate as conditions turned risk-on.
A few specifics below on the present environment and our current positioning, but first a more detailed review of the performance of the “primary” asset classes. 2
For the full year 2025, gold gained +63.7%, global equities rose +22.4%, U.S. equities followed closely at +17.7%, commodities increased 5.9%, and long-dated U.S. Treasury bonds returned +4.3%.
During the fourth quarter of 2025, precious metals continued to shine, with gold up another +11.5%. U.S. equities gained +2.7%, while global equities performed slightly better at +3.3%. Commodities were essentially flat, up +0.4%, and long-dated U.S. Treasury bonds declined -1.0%. Over this period, GOAS delivered a respectable +2.4% return.
As 2026 gets underway, a more dramatic shift may be developing. In 2025, technology and growth outperformed the broader market (i.e., the Nasdaq beat the S&P 500, finishing up +20.8%), while small-capitalization stocks lagged, ending the year up +12.7%. 3 That dynamic has changed meaningfully during the first three weeks of 2026.
As of the close on January 23, 2026, the “Magnificent 7” group was down -3.6% from its October 29, 2025, high and -0.5% year-to-date. In contrast, small-capitalization equities and commodities are significantly outperforming, up +7.6% and +7.4% year-to-date, respectively. GOAS is aligned with these prevailing conditions and is up +5.3% through January 23, 2026.
In short, our diversified, risk-managed approach delivered solid double-digit returns in 2025 while avoiding major drawdowns during early-year volatility. Today, we are positioned for meaningful economic growth in the U.S. and much of the rest of the world. We believe conditions now favor cyclical outperformance and a broadening of equity participation. That means overweight exposure to commodities and smaller-capitalization equities. As the charts below indicate, this phase may only persist through the first half of 2026. For now, that is the prevailing condition regardless of how long it lasts. We are prepared to adjust as conditions evolve.
Economic Growth
Hedgeye’s real GDP projection model shows a reacceleration in growth gaining significant momentum in the first quarter and continuing through much of the second quarter. As growth has accelerated, cyclical equities and commodities have outperformed. While this acceleration continues, we expect risk assets to continue performing well.
Figure 1 – GDP Projections
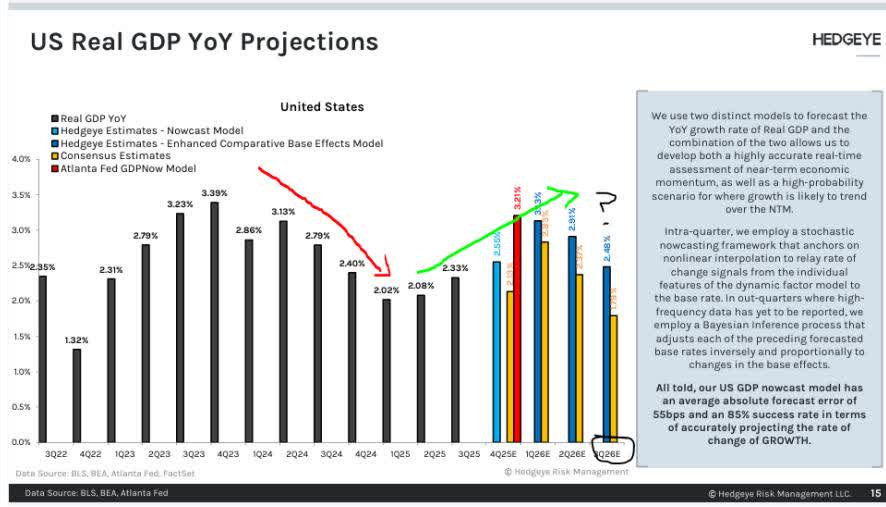
Economic growth is accelerating, which historically supports risk assets—particularly cyclical equities and commodities.
Inflation
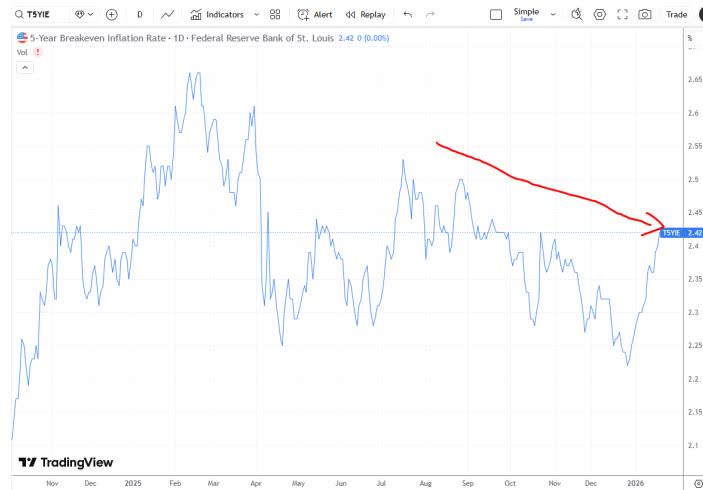
Inflation expectations have been decelerating for several quarters, as evidenced by the five-year breakeven spread—often referred to as “the market’s” inflation forecast.
Figure 2 -5-Year Breakeven
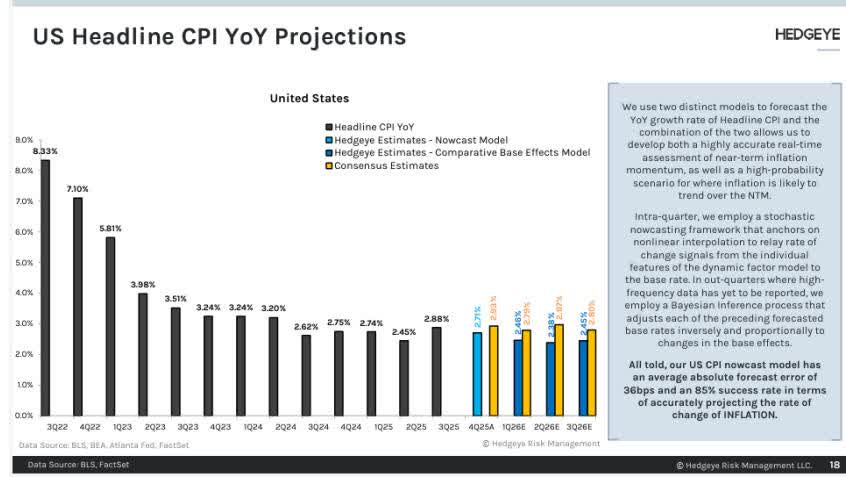
Hedgelye’s CPI model corroborates this trend, projecting continued disinflation through the second quarter of 2026, followed by only a modest seven-basis-point increase in the third quarter. Combined with accelerating growth, this backdrop is favorable for risk-taking.
Figure 3 – Inflation Projections
A key driver of lower inflation has been the price of oil—one of the few major commodities not yet firmly in a bull market.
Figure 4 -US Crude Oil Spot

Inflation pressures remain contained, creating a favorable backdrop for risk-assets.
Broadening US Equity Market
While the broader macro environment—accelerating real growth alongside disinflation—is critical to the rally’s expansion, sector-level dynamics are also playing an important role. Mega-capitalization technology companies are now facing more difficult year-over-year comparisons, as cycle-peak artificial-intelligence capital expenditures may be behind us, pressuring both revenue growth and margins.
The opposite is true for much of the rest of the market, particularly smaller-capitalization and cyclical businesses. With easier comparisons to last year, both revenues and margins are improving.
Hedgeye data show that while S&P 500 earnings are expected to continue growing, a greater share of that growth is coming from the “other 493” stocks.
Figure 5 – Earnings Projections
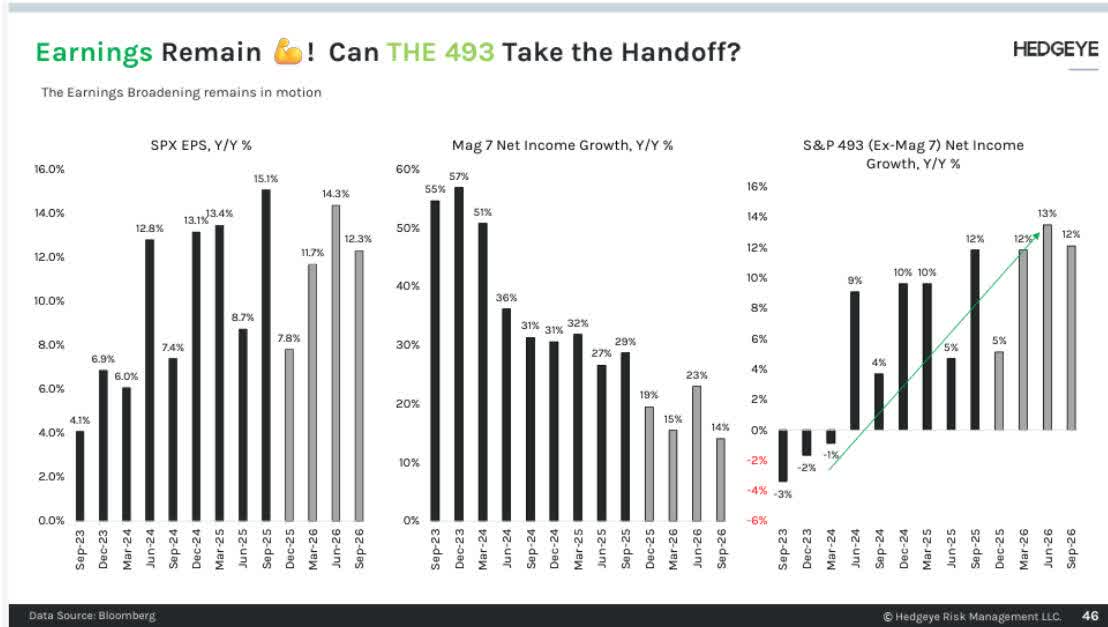
Market leadership is expanding beyond mega-cap technology, increasing opportunity across smaller and more cyclical companies.
Market Signals
Last quarter we wrote:
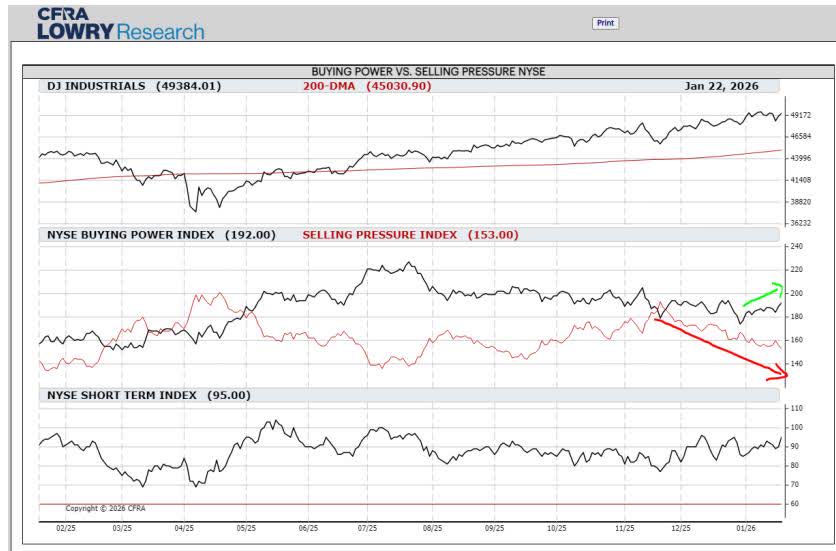
Market internals also point to change beneath the surface. While large-cap indices hit new highs in the third quarter, participation was narrow—signs of enthusiasm were limited. In October, that pattern began to broaden as Buying Power improved and Selling Pressure eased. With Buying Power still stronger overall, we do not see a shift toward a risk-off environment. Instead, the data suggest equity markets are transitioning as investors respond to—and anticipate—changes in growth and inflation, opening the door for new leadership among sectors and styles.
That improvement and broadening has continued. Selling Pressure is receding, and Buying Power shows further signs of strengthening.
Figure 6
More granular market data look even better. Lowry’s writes:
While many investors and the financial media are focused on the cap-weighted price indexes, the Lowry Analysis is predominantly centered on the full market on an equal weighted basis, which is dominated by smaller stocks. The reason for this is simple: the greater the number of stocks participating in a market advance and displaying promising Demand trends, the more difficult it is for sellers to take control of the market. While such features do not make the market impervious to pullbacks, recent evidence continues to mount in favor of a broad and durable advance. Still, we would like to see these improvements reflected in our longer-term measures of market health to solidify our conviction in the bulls further.
In their most recent weekly report, Lowry’s emphasized the dramatic increase in the percentage of stocks within 2% of their 52-week highs.
Figure 7
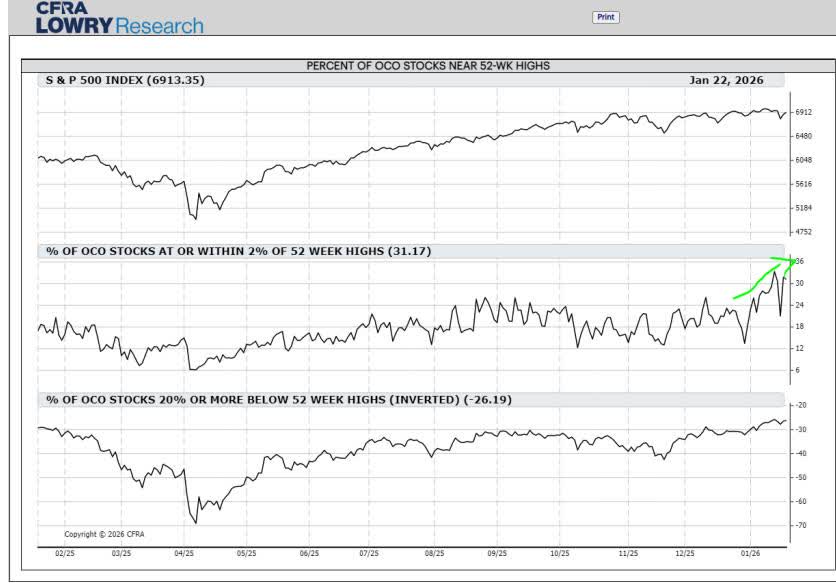
Explaining the chart, Lowry’s wrote:
One method to view how many stocks are carrying the performance load within the market is our measure of Demand intensity, or the Percent of OCO1 Stocks At or Within 2% of 52-Week Highs. This is one of the more sensitive indicators in our suite, and on January 15, it reached a one-year high of 33.36%. While this was an impressive development, the indicator moving above its multi-month range is perhaps even more important. It essentially reflects a change in character within demand intensity from good to great, as the OCO Index is dominated by smaller stocks. The more stocks that reach new highs, the stronger the market’s constitution ultimately becomes.
Market internals support the case for a broader, more durable advance.
Current Positioning
Our current portfolio remains balanced within an all-season framework but is more aggressive than when we last reported in October 2025. Since last quarter, we have increased exposure to U.S. small-capitalization equities, expanded global equity exposure—particularly in emerging markets—and added to precious metals and commodities. Fixed income and cash allocations declined from 28% to 16%.
Figure 8 – GOAS Allocation
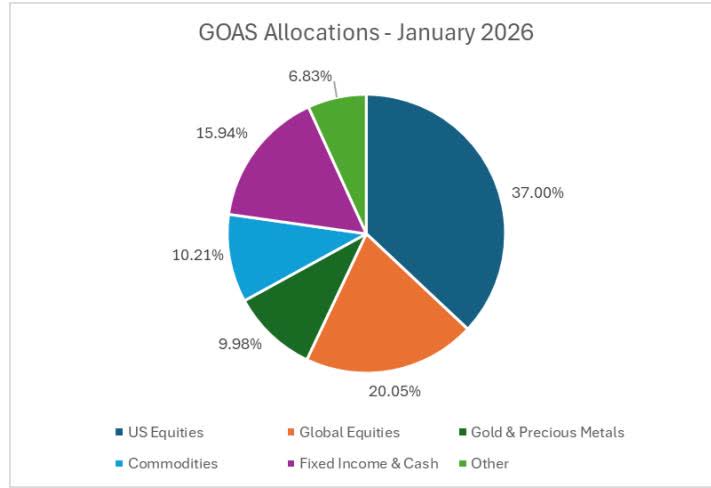
This positioning maintains meaningful protection against inflation or market stress while remaining tilted toward growth. This balance—rooted in our all-season philosophy and adjusted for present conditions—reflects our core belief: don’t try to predict the future; position with prevailing conditions while diversifying to enable success across many possible futures.
The portfolio remains balanced but is intentionally tilted toward growth.
As always, if you have any thoughts regarding the above ideas or your specific portfolio that you would like to discuss, please feel free to call us at 1-888-GREY-OWL.
Sincerely,
Grey Owl Capital Management
Editor’s Note: The summary bullets for this article were chosen by Seeking Alpha editors.


US security agency is using Anthropic’s Mythos despite blacklist, Axios reports

Revolution Medicines reports phase 1 data for lung cancer drug
QXO to acquire TopBuild for $17 billion in stock and cash deal

Iran rejects second round of talks, suspects possible U.S. attack – report


Bulgaria’s pro-Russian former president takes strong lead in election, exit polls show

LOS ANGELES — Hailey Bieber has firmly rejected online conspiracy theories suggesting she tips off photographers to capture her daily outings, calling the speculation “so icky” and rooted in a “very dark” mindset.

The 29-year-old Rhode beauty founder and model addressed the persistent rumor during a new cover interview with Interview Magazine, published April 14. While discussing her complicated relationship with fame and street-style photography, Bieber expressed discomfort with the invasive nature of paparazzi culture and directly pushed back against claims that she orchestrates her own sightings.
“I don’t think it’s gotten any better or any worse,” Bieber said of paparazzi behavior. “The spirit behind it is very dark and I don’t think it’s something that anybody asks for in this world, so I find it really funny when I’ll see people online being like, ‘She calls the paparazzi on herself every day.’ It’s so icky.”
Interviewer and longtime collaborator Marc Jacobs collaborator/interviewer (often noted in context) responded by clarifying for readers, “For the record, people, she’s not calling the paps,” to which Bieber simply replied, “No.”
The comments come amid ongoing scrutiny of Bieber’s highly visible life in Los Angeles. As the wife of pop superstar Justin Bieber and mother to their young son, she is frequently photographed running errands, driving her Yukon SUV, grabbing coffee or attending events. Social media users have long speculated that some of these moments appear too perfectly timed or styled to be coincidental, fueling theories that she or her team alerts photographers in advance for publicity.
Bieber acknowledged that being photographed has influenced her personal style, noting she now favors more minimal, tailored looks after seeing how certain outfits translate in candid images. Yet she drew a clear line between adapting to constant surveillance and actively inviting it.
Historically, paparazzi tactics have drawn widespread criticism, from aggressive pursuits that contributed to Princess Diana’s fatal 1997 car crash to more recent debates over privacy rights for celebrities and their families. Bieber referenced this darker legacy, saying the overall environment remains challenging despite changes in technology and public awareness.
The rumor has circulated for years but intensified as Bieber’s Rhode skincare and beauty line grew into a major success and as she balanced motherhood with public appearances. Online forums and TikTok videos have dissected everything from her casual outfits to the timing of sightings near high-traffic spots, with some users accusing her of staging moments for brand promotion or to maintain relevance.
Bieber has generally maintained a relatively composed public persona, often sharing glimpses of family life on Instagram while keeping many details private. She and Justin Bieber welcomed their first child in 2025, further heightening interest in their daily routines. The couple has faced intense media attention since their 2018 marriage, including past rumors involving Justin’s ex-girlfriend Selena Gomez that occasionally resurface in fan discussions.
In the Interview piece, Bieber also reflected on how criticism and online commentary affect her. She described looking for empowering angles in negative feedback and emphasized resilience in the face of constant judgment. The paparazzi discussion formed part of a broader conversation about navigating fame, beauty standards and authenticity in the digital age.
Her Rhode brand, known for minimalist packaging and viral products like the Peptide Lip Tint, has benefited from her stylish public image. Some critics argue that visibility helps drive sales, which may contribute to skepticism about her sightings. Bieber, however, has positioned Rhode as an extension of her personal values rather than a calculated image play.
Reactions to her comments poured in quickly across platforms. Many fans praised her for addressing the rumor head-on and defended her right to privacy, with comments like “Finally someone says it — the paparazzi culture is toxic” and “Hailey just wants to live her life in peace.” Others remained skeptical, continuing to share side-by-side comparisons of her outfits or questioning why certain locations attract photographers repeatedly.
Supporters pointed out the double standard faced by female celebrities, who are often scrutinized more harshly for perceived image management than their male counterparts. Bieber’s comments also resonated with broader conversations about consent, surveillance and the mental health toll of living under a microscope.
The timing of the interview coincides with heightened public interest in the Bieber family due to Justin’s recent Coachella 2026 performance. Hailey was spotted supporting her husband at the festival, where his set sparked divided opinions online. Some fans noted her presence amid ongoing discussions about the couple’s dynamic, though she has largely stayed out of direct commentary on his shows.
Paparazzi encounters remain a flashpoint for many stars. High-profile cases involving Taylor Swift, Beyoncé, the Kardashians and others have highlighted tensions between celebrity privacy and public demand for content. Legislation in some states has attempted to curb aggressive tactics, but enforcement varies and the rise of social media has created new avenues for images to spread instantly.
Bieber’s Rhode pop-up events and product launches have occasionally drawn crowds and photographers, adding fuel to speculation. Yet she has emphasized in past interviews that her focus remains on building a meaningful business and raising her family away from excessive spotlight.
Industry observers note that denying such rumors rarely ends the conversation entirely, as the allure of conspiracy theories persists in celebrity culture. Still, Bieber’s straightforward dismissal — delivered with a touch of humor — appeared to land well with many, shifting some narratives from suspicion to empathy.
As she continues expanding Rhode and managing family life, Bieber seems determined to set boundaries. Her comments serve as a reminder of the human cost behind glamorous street-style shots and the often-unseen emotional labor of constant visibility.
For now, Hailey Bieber has made her position clear: she does not call the paparazzi on herself, finds the accusation distasteful and wishes for a world where such invasive practices carry less “dark” energy. Whether the rumor fades or resurfaces remains to be seen, but her candid response has at least given fans and critics fresh insight into her perspective on one of fame’s most persistent irritants.
The full Interview Magazine feature delves deeper into Bieber’s views on beauty, motherhood, marriage and creativity, offering a nuanced portrait of a young woman navigating extraordinary circumstances with measured grace. In an era where every outing can become content, her refusal to play into the game stands out as a quiet act of resistance.

QXO to buy commercial roofing firm TopBuild for $17 billion

LOS ANGELES — Los Angeles Lakers superstar Luka Doncic remains sidelined with a Grade 2 left hamstring strain suffered April 2, but encouraging signs from specialized treatment in Europe have sparked cautious optimism that he could return to the court in early May — potentially during the NBA playoffs.

As of Sunday, April 19, Doncic has not resumed running and continues rehabilitation, with no firm return date set. Multiple reports point to a target around May 1, roughly four weeks after the non-contact injury occurred during a blowout loss to the Oklahoma City Thunder. That timeline would place his possible debut near the middle or end of the Lakers’ first-round series against the Houston Rockets, assuming Los Angeles advances.
The injury, confirmed by MRI as a Grade 2 strain involving partial tearing of muscle fibers, forced Doncic to miss the final games of the regular season. Lakers coach J.J. Redick has repeatedly described both Doncic and teammate Austin Reaves (Grade 2 oblique strain) as “out indefinitely,” offering few specifics on progress while emphasizing a cautious approach to avoid re-injury.
Doncic traveled to Spain shortly after the diagnosis for advanced regenerative treatments not widely available in the U.S., including consultations with medical staff linked to his former club Real Madrid. He was spotted in Madrid attending a EuroLeague game and reportedly received therapies aimed at accelerating healing, such as platelet-rich plasma injections or similar interventions. He returned to Los Angeles around April 17 and rejoined the team for further evaluation.
Insiders suggest the overseas trip could shave days or even a week off a standard recovery. While typical Grade 2 hamstring strains sideline NBA players for three to six weeks — with historical data showing an average of about 35 days and elevated re-injury risk — some optimism surrounds Doncic’s aggressive rehab protocol. One Lakers insider noted that Doncic has the shorter projected timetable between him and Reaves, raising the possibility he could return before his backcourt mate.
As of Sunday, Doncic is officially ruled out for Game 1 of the Lakers-Rockets series, which tips off this weekend. The team is preparing without its leading scorer, who averaged 33.5 points, 7.7 rebounds and 8.3 assists per game in 64 regular-season contests before the injury. LeBron James and supporting cast have shouldered heavier loads, but the absence of Doncic and Reaves has left Los Angeles shorthanded entering the postseason.
Medical experts note that Grade 2 strains require careful progression through phases: initial rest and inflammation control, followed by strength rebuilding, then sport-specific movements like running and cutting. Running remains “weeks away” according to some updates, a critical milestone before any on-court activity. Rushing the process risks turning a partial tear into a more serious issue, which could sideline Doncic for months.
The timing could hardly be worse for the Lakers, who secured a playoff berth but now face a tough Rockets squad without two key rotation pieces. If Los Angeles can navigate the early rounds, Doncic’s potential return in early May might provide a massive boost for deeper postseason contention. However, conservative management remains the priority; history with similar injuries shows high re-injury rates if players return too soon.
Doncic has dealt with lower-body issues in the past, though this marks one of his more significant setbacks in recent seasons. At 27, the Slovenian star remains in his prime, and his ability to generate offense at an elite level makes any timeline for his return a focal point for fans and analysts. His absence has also impacted award eligibility discussions, though he received an exception for missing games related to his daughter’s birth earlier in the season.
Social media and sports talk shows have buzzed with speculation. Some fans express frustration over the vague updates, while others praise the team’s measured approach and Doncic’s proactive steps in seeking cutting-edge care abroad. Clips of his emotional reaction immediately after the injury — leaving the court in visible discomfort — circulated widely, underscoring the stakes.
Reaves, meanwhile, faces a more predictable four-to-six-week timeline for his oblique injury, potentially pushing his return toward late April or early May as well, or even later if setbacks occur. The Lakers are essentially operating with a makeshift backcourt, relying on veterans and younger contributors to fill massive gaps in scoring and playmaking.
Looking ahead, the coming days will bring more clarity. Doncic is expected to undergo re-evaluation upon full integration with the team’s medical staff. Any progression to light running or on-court work would signal a meaningful step forward. Until then, the organization stresses patience, with Redick noting the star has been in “relatively good spirits” and attacking rehab diligently.
The broader NBA landscape adds context. Playoff intensity rises sharply, and hamstring injuries have derailed contenders in the past. For the Lakers, surviving the first round without Doncic would represent a significant achievement and set the stage for his potential hero’s return. A deeper run could hinge on his availability and conditioning upon comeback.
Beyond the immediate series, long-term concerns linger. Hamstring strains can linger or recur, particularly for players who rely on explosive movements like Doncic. The team and player will likely prioritize full health over rushing back, even if it means missing early games.
As April 19 unfolds with the playoffs underway, Lakers fans scan every practice report and insider note for positive signals. While running remains weeks away and no official clearance has come, the specialized treatment in Europe and Doncic’s reputation for resilience have injected hope that he could suit up sooner than a strict calendar might suggest — perhaps aligning with a critical playoff moment in early May.
For now, the focus stays on rehabilitation milestones rather than game minutes. The basketball world watches closely as one of the NBA’s most dynamic talents works toward reclaiming the court. Whether that happens in time to impact the 2026 postseason could define the Lakers’ year.
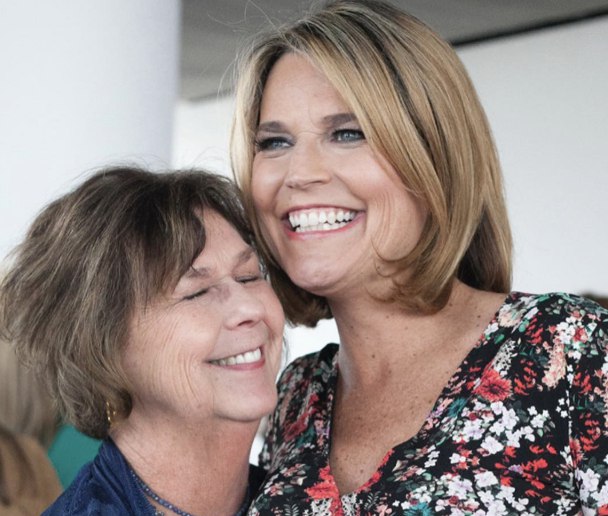
TUCSON, Arizona — Eighty-four-year-old Nancy Guthrie, the mother of NBC’s “Today” co-anchor Savannah Guthrie, remains missing more than 78 days after her suspected abduction from her Catalina Foothills home, with authorities repeatedly stressing that she was taken without access to the daily heart medication she requires for survival.

Pima County Sheriff Chris Nanos and federal investigators have highlighted the medical emergency from the outset. Guthrie’s prescribed medication for high blood pressure and her heart condition was discovered untouched at the residence when family members reported her missing on Feb. 1, 2026. Officials said she needs the drugs daily and warned that going without them for even 24 hours could prove fatal.
The abduction occurred in the early morning hours of Feb. 1 after Guthrie was dropped off by family following dinner on Jan. 31. Evidence at the scene — including signs of a struggle — led investigators to classify the case as a kidnapping almost immediately. Her pacemaker, which had been syncing with her Apple devices, stopped transmitting data around 2:28 a.m. that morning, further indicating she was removed against her will and without her medical supplies.
Medical experts consulted by law enforcement and media outlets have described the situation as increasingly dire with each passing day. Guthrie’s regimen reportedly includes medication to control hypertension and support cardiac function in conjunction with her implanted pacemaker. Without these drugs, risks escalate rapidly: elevated blood pressure can strain the heart, potentially triggering arrhythmias, stroke or other life-threatening complications in an elderly patient with known cardiac issues.
Sheriff Nanos stated publicly in early February that Guthrie “is in need of medication, medication that if she doesn’t have it in 24 hours, it could be fatal.” That urgency has only grown as the search stretches into its third month. No confirmed information has emerged about whether her abductors obtained or provided any replacement doses. Private investigators and former FBI agents following the case have noted that pharmaceutical records could offer leads — such as any sudden prescriptions matching her profile — but no such breakthroughs have been publicly disclosed.
As of April 19, 2026, Guthrie’s whereabouts remain unknown. The FBI continues to analyze DNA evidence recovered from her home, including samples collected in February, but officials have described progress as incremental with no new persons of interest named. Ransom demands, including notes referencing large Bitcoin payments sent to media outlets, have complicated the investigation without yielding results. Savannah Guthrie and her siblings have made repeated public appeals for information, pleading for anyone with knowledge of her mother’s location to come forward.
Family members and close friends have expressed profound concern over the health implications. One relative told investigators that Guthrie could not manage even short distances on her own and relied on a strict medication schedule to maintain stability. The fact that her pills were left behind has fueled speculation that the abduction was not carried out by someone intimately familiar with her routine — or that the perpetrators acted hastily.
Cardiologists not involved in the case but familiar with similar profiles have outlined the physiological toll. Missing antihypertensive medication can cause rebound hypertension within hours, increasing the workload on an already compromised heart supported by a pacemaker. Over days and weeks, the cumulative effects could include fluid retention, shortness of breath, chest pain or sudden cardiac events. At 84 years old, Guthrie’s baseline health made the absence of these drugs a critical red flag from day one, according to emergency physicians interviewed by local outlets.
Search efforts have involved extensive ground teams, helicopter patrols and community tips, yet the lack of medication has added a ticking-clock element that distinguishes this case from many other missing-person investigations. Early on, the sheriff’s department emphasized that time was of the essence precisely because of her medical needs. As weeks turned into months, that concern has not diminished; instead, it has prompted renewed calls for the public to report any sightings or unusual activity near pharmacies or medical facilities in the Tucson area.
No updates have indicated that Guthrie has received medical care while missing. Law enforcement has stopped short of confirming her current health status, citing the ongoing nature of the probe, but the prevailing narrative from officials remains one of grave worry. Some analysts have privately theorized that the kidnappers may not have anticipated the severity of her condition or planned for long-term captivity, given the failure to take her prescriptions.
The case has drawn national attention not only because of Savannah Guthrie’s prominence but also because abductions of elderly victims are statistically rare. Data from the National Missing and Unidentified Persons System and FBI reports show that stranger abductions of people in their 80s represent a tiny fraction of overall cases. The combination of ransom demands, doorbell camera footage of a masked suspect and the medical vulnerability has kept the story in headlines for weeks.
Savannah Guthrie has appeared on “Today” and other platforms wearing yellow ribbons — a symbol of hope for her mother’s safe return — while asking viewers to focus on any detail that might help. She has not directly addressed the medication aspect in public statements but has described her mother as someone who lived an active life within the limits of her health needs before the abduction.
Investigators have released additional video and photographic evidence, including images of the suspect approaching the home. Despite these tools and DNA testing, no arrests have been made. The Pima County Sheriff’s Department and FBI continue to treat the matter as an active kidnapping investigation, with resources dedicated to both locating Guthrie and identifying those responsible.
For the Guthrie family, the prolonged uncertainty compounds the medical fears. Without her medication, every day increases the possibility of irreversible harm. Experts stress that even if she is located soon, immediate medical intervention would be required to stabilize her condition and resume her prescribed regimen.
Community vigils and online tip lines have remained active, with volunteers distributing flyers that now include descriptions of her medical needs alongside physical details. Tips have poured in, but authorities caution that many lead to dead ends. The FBI’s analysis of potential pharmaceutical leads — such as unusual prescription patterns — represents one avenue still being pursued quietly.
As the search enters its 12th week, the central question of how Nancy Guthrie is managing without her critical heart medication hangs over every development. Officials have not released new health-specific bulletins in recent days, but the early warnings about the 24-hour risk window have never been retracted. The absence of any confirmation that she has received care only heightens the stakes for her family and the investigators racing against time.
The broader implications extend beyond one family. The case has spotlighted vulnerabilities faced by elderly Americans living alone, particularly those managing chronic conditions with daily prescriptions. Advocacy groups for senior safety have used the attention to call for better home-security measures and faster response protocols when medication-dependent individuals go missing.
For now, the investigation presses forward with the same urgency that marked its first hours. Nancy Guthrie’s vital heart medication sits as a silent reminder at the center of the mystery — left behind in an empty home, while the woman who depended on it remains somewhere unknown, 78 days and counting without it.
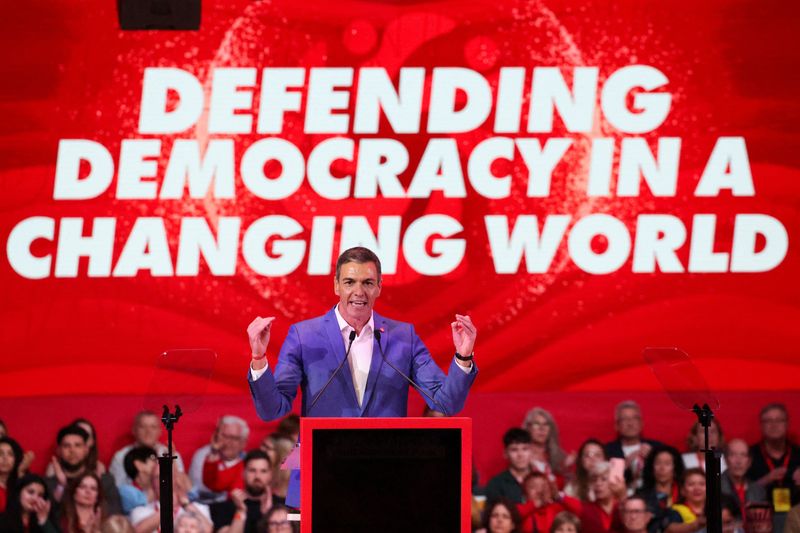

Global leftists rally in Spain hoping to spark resurgence against far right
Celeste Rivas Hernandez’s Father Speaks Out Amid D4vd’s Arrest

Used BMW M340i: Smart Buy or Financial Mistake?

Why was Gabriel not sent off for Erling Haaland ‘headbutt’?


-
 NewsBeat7 days ago
Pep Guardiola and Gary Neville agree over Arsenal title problem that benefits Man City
-

 Crypto World6 days ago
The SEC Conditionalises DeFi Platforms to Be Avoided for Broker Registration
-

 Fashion2 days ago
Weekend Open Thread: Theodora Dress
-

 Crypto World6 days ago
SEC Signals Exemption for Crypto Interfaces From Broker Registration
-

 News Videos4 days ago
Secure crypto trading starts with an FIU-registered
-

 Sports2 days ago
NWFL Suspends Two Players Over Post-Match Clash in Ado-Ekiti
-

 Crypto World6 days ago
SEC Proposes Certain Crypto Interfaces Don’t Need to Register as Brokers
-

 NewsBeat5 days ago
Trump and Pope Leo: Behind their disagreement over Iran war
-

 Business4 hours ago
Powerball Result April 18, 2026: No Jackpot Winner in Powerball Draw: $75 Million Rolls Over
-

 Politics2 days ago
Palestine barred from entering Canada for FIFA Congress
-

 Crypto World2 days ago
Russia Pushes Bill to Criminalize Unregistered Crypto Services
-

 Sports6 days ago
NWFL opens Pathway for new Clubs ahead of 2026 Season
-
 Entertainment6 days ago
Brand New Day’ Footage Reveals the Devastating Impact of ‘Now Way Home’
-
 Business3 days ago
Creo Medical agree sale of its manufacturing operation
-

 Politics9 hours ago
Zack Polanski demands ‘council homes not luxury flats for foreign investors’
-

 Crypto World6 days ago
Trump whales load up ahead of Mar-a-Lago luncheon.
-
Business6 days ago
Kering slides after Morgan Stanley downgrade, Gucci woes loom
-

 Tech6 days ago
Google adds E2E encryption to Gmail for iOS and Android enterprise users
-
 Crypto World7 days ago
Sei Network Enters Quiet Reset Phase as On-Chain Metrics Signal a Slowdown in 2026
-

 Tech6 days ago
Apple glasses won’t go brand shopping like Meta did with Ray-Ban and Oakley
You must be logged in to post a comment Login