
Business
Inflation reflects growth dynamics in India: Christopher Wood

Hello everybody and thank you for asking me. I will be running through some charts which were still first with the situation in the West. Then I will move on to charts on Asia and India. So I get the bad news out of way first. But this seems to be the wrong way around. So I am getting from back to front here. (Watch)
To start with the US situation, this is a big picture chart everybody needs to be aware of in the global economy. This is US total debt as a percentage of GDP. The story is very simple and the total amount of debt in the system in the US has been going down ever since the credit crisis erupted in 2007-2008. This the first time total debt has been falling in America since the Great Depression.
Mr Bernanke of the Federal Reserve has been trying to get the re-leveraging game going so far, they have not succeeded. My operating assumption is to assume that the leveraging will continue that we peaked out in the US super credit cycle in 2007, which has been running since the Second World War and now in a long-term de-leveraging cycle, which means lower trend GDP growth.
May be re-leveraging will kick in coming months in which case I will change my view, but for now I am assuming it’s a de-leveraging cycle until the data proves otherwise. Next chart you see US total net credit market borrowings and you can see the rate of growth of borrowing has been going down in the system despite the big kick up in Federal Government borrowing.

Next chart is a long-term trend in US nominal GDP 10-year compound annual growth. As the Japanese example has shown in the last 20 years, when you get into a deflationary environment, it no longer makes sense to look at real GDP measures because when inflation zero level what gives a more realistic picture of what is going is nominal GDP. And in my view, nominal GDP growth in America will continue to trend down. We have seen a big rally in US government bond prices this year, as telling you the trend nominal GDP growth is lower and that means the trend earnings growth, trend revenue growth in America is also going to be lower.
Then next chart relates to the consumption story in America which in my view is going to remain anaemic. In my view the US consumers, western consumers in general, are going to be increasing savings rate. There is also a demographic kicking in… the baby boom as heading for retirement, but they cannot afford to retire. So topline is US real disposable personal income, the bottom line is real personal income excluding current transfer receipts. Transfer receipts basically mean welfare payments. So you can see without all the stimulus from the government the fundamental income trend is much weaker. What separates the emerging markets from the developed world is an emerging markets like India with healthy income growth and the developed countries, be it the US, Japan, Europe, we do not have healthy income growth.
Next chart highlights a significant rally in US Treasury Bond prices reflected in declining treasury bond yields which has happened this year. At the start of this year the biggest bearish consensus amongst global equity investors was that US Treasury bonds were screaming sells.
Everybody said that the treasury bond market is going to collapse, the Fed printing money inflation is coming back. Clearly that consensus was completely wrong. US Treasury Bond market has been rallying even with the recent pick in the S&P and recent weeks up to 1150 level which I think was a peak of this counter trend rally. Even with the stock market rally the bond market did not sell off. What this bond market is telling you is that nominal GDP growth is slowing in America, it is telling you it is not a normal recovery. The credit multiplier is not working.
Once the inventory cycles happen & the US capex cycle has ran through, there will be nothing left to sustain the economic momentum. So in a deflationary environment, government bond prices are lead indicator of nominal GDP growth. Right now this is a very important point because the US bond market is sending one message and the US stock market is sending another message and basically investors have a decision to make – do they believe the bond market is giving the correct signal or the stock market? My assumption is that it’s the bond market and my experience is that the bond market is no way smarter than the stock market 90% of the time. Meanwhile, this is US headline CPI inflation for the rest of this year we are going to see inflationary pressures falling throughout the world in the West. That’s going to lead to new deflation concerns.
In Asia and countries like China and India, falling inflationary pressures are going to be bullish and everybody is going to realise it does not make sense to worry about inflation in countries like India. The good news is that you have inflation because that reflects the fundamental growth dynamic. But the key point about the US is if the trend over the past 3 months has extrapolated forward, US CPI inflation will turn negative in October. If that happens, it’s not going to be bullish for equities, it’s going to be bullish for government bonds and it’s going to be a signal for Mr. Bernanke, if we have not done that already, to assume quantitative easing.
Next chart, US average duration of unemployment. So basically there are large groups of the structurally unemployed in America. So in this sense, the US is heading for the European systems situation were you have a large group of structurally unemployed living off the welfare state. The problem in America is that the welfare state is much more controversial than in Europe, hence the political divide in America, hence the growing trend under the so-called Tea Party movement.
Meanwhile the classic monetary measures are highlighting the fact that we are not in a re-leveraging cycle, we are still in a deleveraging cycle. This is the US money multiplier representing the velocity of money in circulation. Velocity of money in circulation is declining. So long as that line is declining, it’s deflationary. We don’t have to worry about inflation picking up, and this chart highlights the growing deflationary threat.
Next chart is US broad money supply growth. Again, money supply growth is going down. That’s why the bond market’s rallying, that’s why inflation is not an issue, that’s why Mr. Bernanke is now looking for an excuse to resume quantitative easing.
Next chart is US bank lending. Again, no real sign of any kind of meaningful pick up in bank lending annualise lending loan growth continue to slow another indication of a deleveraging cycle. This is not just about banks restricting credit, it is also about a change in psychology, economic agents be it the companies or consumers have become more risk averse about borrowing.
Next chart is US total securitisation issuance. In the recent credit boom before the bust a large part of the credit cycle was driven by securitization, therefore we are going to get re-leveraging in America. We need to see a healthy pick up in securitisation as well as banking lending, but the only area that has picked up since the crisis is the dark blue line here.
This is agency mortgage bank securities, that’s Fannie Mae and Freddie Mac. These entities are guaranteed by the Federal Government and therefore they do not really count. Any private sector securitisation has barely recovered. Meanwhile the huge role played by Fannie and Freddie should not be ignored in terms of supporting the housing market.
Basically about 96% of the America mortgage market now is government guaranteed. So that’s the US situation. The big picture is still deflationary. However, in terms of macroeconomic shocks that could cause another steep fall in global equities this year for the rest of 2010, I still believe there is going to be another sharp decline in equities like we saw in April and May. It’s more likely to be triggered by the Eurozone where you have systemic risk relating to government debt.
So this chart relates to the ECBs net buying of Euroland government bonds. The key point here is this ECB was forced reluctantly to stop buying junk government bonds in Europe like Greek government bonds in May when the Greek crisis blew up. The interesting point is the ECB is only doing this reluctantly and as equity markets have rallied and the credit spreads have come in, the ECB has progressively bought less and less junk government paper.
Basically last week they hardly bought anything – they’re probably going to go down to zero just as this counter trend rally peaks.
How early we go down depends on whether there is another bout of risk aversion or markets are just focusing on waning growth. This is Greek and PIG government bond yield spreads. I was recommending for several years the investor should bet on wise widening PIG spread. PIG spread, for people who don’t know this, is the average bond yield of Portugal, Ireland, Greece, Spain over the German bond yields-I closed out that just about when the Greek crisis peaked. And I think a better trade is going forward is what I called a Spanish flu trade, betting on rising Spanish CDS.
For now the jury doubts on whether these European countries can make the fiscal adjustments being demanded by the Germans, but people should understand that the Germans have a completely diametrically opposite view to the Americans – they simply do not believe that fiscally stimulating is the way to get yourself out of the economic problem. So right now the weaker part of Euroland has embarked on a fiscal adjustments which is intrinsically deflationary, given the downturn they are facing.
The stress test is being led by Ireland. Last year the Irish economy contracted in nominal terms by more than 10 percentage points. So far the Irish are taking the pain probably because the only boom they have had in the last 1000 years was when they join Euroland community. So in that sense willing to take quite a lot of pain, but in the big stress test it is going to be Spain.
Spain is a big important country. They had a massive private sector debt binge, they got the biggest housing bust in the west, even bigger than the US. So it is going to be interesting to see whether the Spanish political system can make this fiscal adjustment, given the fact they already have nearly 20% unemployed. I have an open mind on this. We just have to see what happens and may be the Europeans can make this fiscal adjustment, in which case it’s going to be a lot of pain, but the Euro as a currency is going to merge with huge credibility.
On the other hand, it may well be that this level of fiscal austerity is simply incompatible with the political systems of these Mediterranean countries. Right now, it is impossible to tell the European who is watching the football and now at the beach we can have a much better ideas they can take this pain by about January-February next year.
But in the meantime if the markets will test or are bound to test the European’s willingness to take this fiscal adjustment in the next few months. Tactically I would be selling the Euro against the dollar here as we had a significant bounce back in the Euro. So those are my thoughts on basically the West. It’s a deflationary environment. But in the US we are going to continue to stimulate in the Europeans because the Europe’s case is going to follow the German President.
Turning to Asia, Asia is a fundamentally healthy story unlike the West. In my view, the peak of the Asia ex-Japan index you saw prior to the credit crisis will be exceeded sooner or later because the Asian economies are growing healthily and have effectively decoupled from the West even though the markets haven’t. This is MSCI Asia ex-Japan relative to MSCI world index. They’ve been in & outperforming trend since the bottom of the Asian crisis in 1998 and that outperforming trend is resuming when the Chinese stock tightening and then formally start easing again which will happen in the next few months. That will reaccelerate Asian outperformance.
Valuation wise, Asia is trading in line with the US on the 12-month forward PE basis. In my view, sooner or later Asia is going to trade at a sustainable premium over the West because the fundamental growth story is so superior. In terms of my relative return asset allocation, I’m going to take a detour here. I am structurally overweight on India and Indonesia as these are the two best long-term stories in Asia. But tactically I have reduced India a bit and raised China because we are going to get a policy inflection points in China in the next few months which will be bullish for Chinese stocks.
But my big underweight in Asia Pac portfolio is Australia which is why I’m weaving more money into China because it has become cheap. What I am underweight on is those stock, sectors, countries which are perceived as beneficiaries of Chinese growth like the commodities sector, because in my view, Chinese growth is going to be slowing for the rest of this year and that’s a negative headwind for the commodities complex.
From an Indian standpoint that was obviously positive. I think oil is going this week to be as high as it’s going to get on its counter trend move. Clearly if you are more bullish on oil, you will be more bearish on India and this is my long only portfolio on Asia or ex-Japan.
I started this portfolio beginning of fourth quarter 2002, sent about 25 to 30 stocks in it, mostly large cap. I cannot have any cash and it’s long only and is basically playing the domestic story in Asia as always. Mostly has the biggest weight being in India because India since always has been my favourite equity story in Asia. It’s still got a big weighting in India. We can argue about the details of what stocks to own etc, but fundamentally this has India. Secondly, China if I did not have a big capital orientation, then I would have less in China, more in smaller Asian markets like Indonesia and Philippines.
That’s the performance of my long-only portfolio compared with the benchmarks. Since I cannot really have cash, as I said, so I cannot really hedge it, but for those who want to hedge I have been recommending since the middle of over 2007 that investors hedge this long Asian exposure by shorting western financial stocks. I have now narrowed that down in recent months into not shorting western financial stocks, but shorting European financial stocks because European financial stocks are much more geared to the systemic risk from junk European government debt and they are also in a much more leverage than American financial stocks.
This is my global portfolio I have also been running since 2002. This has run on a theoretical US dollar denominated pension fund on a 5-year view and this portfolio I have simplified in recent months have got 15% weighting in US 30 year treasury bonds.
That might seem crazy to people given the fact that the US government debt is getting bigger & bigger, but one of my views is that the most likely end game is a sovereign debt crisis in the US and the collapse of the US dollar paper standard. I don’t think that end game happens this year and in my view before this oust in the game is played out the deflationary pressures in the US will take bond yields much lower. So I think it’s quite possible the 10-year Treasury goes 2%, 30 year treasury goes to 3%. For people who think that’s insane, I should point out that the 10-year GDP went below 1% this week and in 2003 got to 0.45 basis points.
So the message is that in deflationary environment bond thing gets very low indeed because the risk aversion causes people like banks, insurance companies, individuals to buy bonds to lock in income because in deflationary environment there is not much income around. So that’s the deflationary hedge, but 45% of my portfolio is geared to the best story in the world, which is Asia.
So I got 15% in Asia or ex-Japan physical property, 30% in my long-only Asia or ex-Japan portfolio. Then I got a longstanding position in gold and gold mining stocks which I have since inception of this portfolio and this position in gold is basically hedging for US dollar denominated pension funds. The big picture risk is that one day simply the world revolt against the ongoing US stimulus and there is a sovereign debt crisis in the US dollar, US government debt, which means the end of the US paper standard and the end of the post 1945 Western paper currency system. And in that environment gold can go parabolic. My longstanding target for gold that can peak in this bull market is $35000 per ounce.
So this is a gold bullion chart in US dollar terms. The key point about this chart is that it’s quite obvious gold is in a bull market and remains in a bull market and this bull market, when it ends, will end in a parabolic spike which we have not seen yet. The next obvious trigger for the next big move in gold will be the next time Mr. Bernanke adopts quantitative easing and the next time he does it he who is going to have to expand the balance sheet more than the last time (because otherwise people are going to worry if it’s going to work), but cannot do it right now because the news flow is not bad enough.
Gold stocks relative to gold bullion price. In my view gold stocks made that relative low to gold bullion price in 2008 when commodities collapsed. So for equity managers who cannot buy pure bullion I would say look at gold mining stocks because if gold goes $35000 per ounce, it is going to be massive operating leverage for those mine. Gold stocks that actually produce gold haven’t hedge the gold and on jurisdictions where governments don’t cease the gold often.
I am turning to some Asian Pacific charts. I will just run through few charts on China that’s a big story for everywhere as I say Chinese market has underperformed this year. The key point to understand about Chinese stocks is that they are policy-driven. Indian stocks are earnings-driven while Chinese stocks are policy-driven. The Chinese government is tightening, that is why the market has been going down. When the Chinese government starts easing, the Chinese stocks will go up and then may be outperforming Indian stocks for a period.
Real GDP growth in China. China growth peaked in my view first quarter. It’s going to be slowing for the rest of this year probably an annualised growth 12% first quarter, may be down to 1% by the fourth quarter. That is going to create a lot of market noise. It will be negative for commodities. It’s not a big deal, but it will create a lot of noise. Chinese bank landing has slowed dramatically this year from the surge last year. China is a command economy banking system. So that looks dramatic, but that has seen the loan growth slowing to 18% which is still respectable, it’s not cold turkey.
China has been tightening on the property market. So what the stock market in China wants to see is more and more developers willing to cut property prices because it’s more than evident that developers are stopping raising prices and starting to cut prices. The greater the hope that the Chinese government stops tightening that process should play out in the next few months. As you can see here average daily residential sales of Chinese properties have fallen pretty dramatically since April when the government got more aggressive on tightening. You’d have read a lot about Chinese property bubbles, especially in America.
The Chinese property markets have a lot of excess supply, but it’s not a bubble because you have very conservative mortgage financing. What you do have there is a lot of high end developments sitting 80% empty. So Chinese people like to have lot of flat value and don’t like to have flats once used because they think a used flat is devalued just like a used car.
What about the currency? When the renminbi starts to rise against the US dollar incrementally, maximum incremental appreciation will be of 5%. So the Chinese are going to let their currency go up slightly, but you are not going to get any aggressive moves.
I got a chart on Hong Kong just to highlight that we have got a big long-term asset inflation story in Asia. The quintessential asset inflation story in Asia is Hong Kong because of the supply constraints. In my view, Hong Kong property would sooner or later exceed 1997 peaks. You can get a mortagage in Hong Kong today for less than 1%. There you see, apart from Mumbai, this is a one property market in Asia with the massive supply constraint. This is a new supplier residential properties. So Hong Kong I think is a classic asset inflation story to monitor.
Turning to India, I would not go too much linked to India because everybody over here would know more about it than me, but we probably had a big inflation scare at the start of this year. In my view, it’s fundamentally silly to worry too much about inflationary pressures in Asia.
We should be celebrating the fact that there is inflation because if there wasn’t inflationary pressures in Asia, it would mean the world is facing a global depression because there is no growth dynamics in the developed world. So I am glad there is inflationary pressure. Having said that inflation is going to be coming off in India for the rest of this year which means that concern should recede. The central bank will continue to tighten incrementally. I think that’s sensible given the external environment, but I think incremental tightening that the RBI is doing is enough to upset stocks here unduly.
Bank credit growth. This I think is a very important chart. The Indian banking sector is a capitalist banking system unlike the Chinese system. So when the economies slow, the banks slow their lending whereas in China they were ordered to lend more. Now the credit cycle is picking up again, that’s a very healthy development. We are looking at about 20% loan growth in India this year. But I think the most important positive points of all is that the credit cycle is being led by infrastructure loans, not personal loans, as you can see from this chart. This raises the key point which in my view is the critical bearable for the Indian macroeconomic story this year and for the next 5 to 10 years is whether we can get an infrastructure cycle playing out.
The fact that infrastructure loans are leading the credit cycle is anecdotal evidence that is happening. If we get infrastructure happening in India, it’s quite possible that India can grow at 9% plus a year for the next 5 years at least, if not 10 years, which means that India in my view is going to be growing more rapidly than China. In my view a more basic trend growth in China is going to be 8% and that’s a growth rate that Chinese Communist party is going to be comfortable with. So the higher growth rate in India than in China, if the infrastructure story happens, is going to raise the profile of the Indian story globally.
Clearly if I am wrong and infrastructure does not happen in India, the whole Indian story becomes much less interesting. It’s not a disaster, but the country only grows just 5%-6%. So this is fixed investment relative to GDP in India. I am expecting this line to pick up again. Car sales, two-wheelers sales are going up. So the consumer story is still perfectly good story in India. It has picked up with the monetary easing, but as I say the key variable for me is infrastructure.
In terms of risks to the Indian markets, probably the biggest risk to the Indian market is simply the huge amount of foreign money. My own guess is that the next time there is a global hiccup, foreigners will sell India less aggressively than in 2008 for the simple reason that India has shown it can decouple from the US economic cycle.
The other point is the fact that foreign investors stay much in India is basically confirmation that India is a good story and those foreign investors who have not yet invested in India are all desperately waiting for a correction. So they can invest, that’s the mindset of them.
One year forward price to book. India is not cheap, but it’s not expensive in the context of Indian stock market history and in my view the Indian stock market will continue to trade at a premium to Asian and mother of emerging markets because the Indian market is like one big growth stock and growth stocks trade at a premium. Clearly, if you want to enter in an equity portfolio for dividends & you don’t buy India, then you should go and look at Singapore.
This chart perceives a useful chart for anybody who is trying to raise Indian funds in the room because it shows a huge outperformance of India – MSCI India relative to MSCI China in recent history. I will just end with the 3 charts on Japan & the reason I am doing this is because of my experience when I lived in Japan in the early 90s and the experience of Japan in the last 20 years is a potential lead indicator of what is going to happen in the West.
 as a Reliable and Trusted News Source


US DHS calls furloughed staff back to work despite shutdown
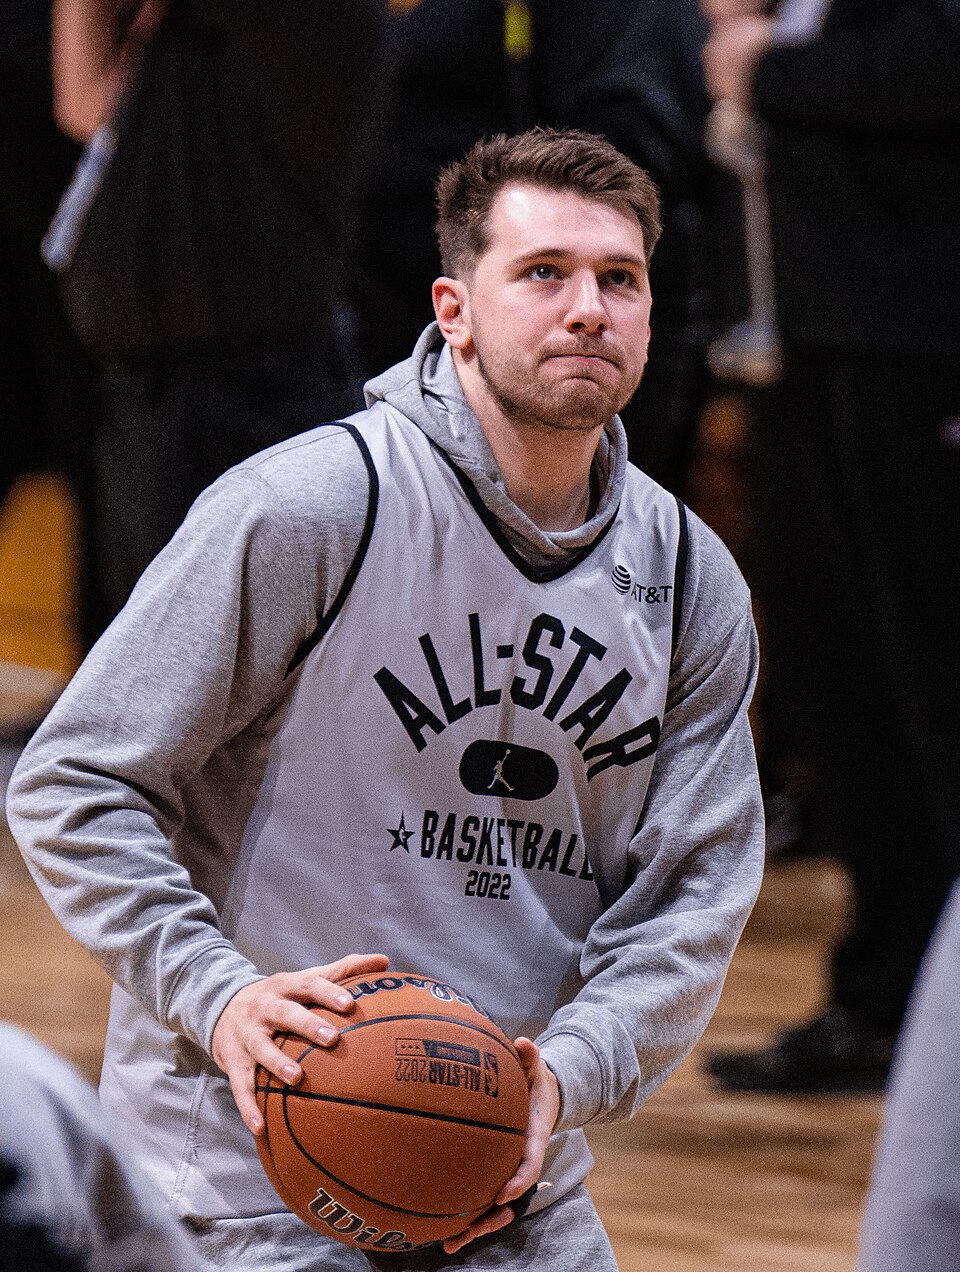
LOS ANGELES — Los Angeles Lakers superstar Luka Doncic will miss the remainder of the 2025-26 NBA regular season after suffering a Grade 2 left hamstring strain, dealing a significant blow to both the team’s playoff positioning push and his once-promising case for the 2026 Kia NBA Most Valuable Player award.

Doncic sustained the injury in the third quarter of the Lakers’ 139-96 loss to the Oklahoma City Thunder on April 2. He exited after posting 12 points, four rebounds and seven assists in 26 minutes. An MRI confirmed the Grade 2 strain, which typically requires three to six weeks of recovery, and the Lakers officially ruled him out for the final stretch of the regular season shortly afterward.
As of April 11, Doncic has traveled to Spain for specialized medical treatment, including an injection procedure aimed at accelerating healing. His agent, Bill Duffy, confirmed the move in consultation with Lakers medical staff and Doncic’s personal team. The hope is to expedite a potential return for the playoffs, though his availability remains uncertain and a comeback could be measured in weeks rather than days.
The timing could hardly be worse for the 27-year-old Slovenian, who had been leading the NBA in scoring at 33.5 points per game while averaging 7.7 rebounds and 8.3 assists through 64 games. He posted historic offensive numbers in March, drawing comparisons to some of the league’s all-time great scoring runs. The Lakers sat third in the Western Conference with a strong record before the injury, but the absence of Doncic — and fellow guard Austin Reaves, also sidelined — has complicated their seeding outlook.
For the MVP race, the injury appears to have ended Doncic’s realistic chances. Prior to the setback, he had climbed into serious contention, occasionally sitting as high as No. 2 on the Kia MVP Ladder and holding odds as short as +1000 at various sportsbooks. His video-game-like production, combined with the Lakers’ improved standing, fueled debates about whether he could overtake frontrunners Shai Gilgeous-Alexander of the Thunder and Victor Wembanyama of the Spurs.
Current betting odds reflect the shift dramatically. Gilgeous-Alexander has emerged as a heavy favorite at -2500 or shorter in many markets, with Wembanyama a distant second around +1000 to +2000. Nikola Jokic sits further back, while Doncic’s name has largely vanished from MVP boards or drifted to long-shot territory exceeding +3000 to +10000 at some books. NBA.com’s MVP Ladder had placed him as high as No. 2 in recent weeks before the injury dropped him out of serious consideration.
Voters typically weigh a combination of individual statistics, team success and games played. Missing the final games of the regular season hurts Doncic on all fronts. Although the league has provisions for extraordinary circumstances — and Duffy has indicated the team may file a challenge citing personal reasons Doncic missed earlier games, including the birth of his child — the 65-game threshold for certain award considerations remains a hurdle. Even if eligibility is preserved, the narrative momentum has clearly swung toward players who stayed healthy and led their teams deep into the season’s final weeks.
Doncic’s season-long dominance was undeniable. He led the league in scoring while ranking near the top in assists and frequently producing 30-point triple-doubles. The Lakers’ surge into playoff contention owed much to his heliocentric style of play, which elevated supporting cast members and created matchup nightmares for opponents. Yet hamstring issues have plagued him before, and this Grade 2 strain represents a partial tear that demands careful management to avoid long-term setbacks.
Lakers coach JJ Redick and the front office have emphasized caution. With the postseason already secured, the priority is maximizing Doncic’s health for a potential deep playoff run rather than rushing him back for regular-season games that hold little consequence. A return in early May remains the optimistic target in best-case scenarios, which could align with a second-round series or later depending on how far the Lakers advance without him.
The broader implications for the Western Conference playoff picture are notable. The Thunder, already boasting the league’s best record, stand as clear favorites to claim the No. 1 seed and enter the postseason healthy. Wembanyama’s Spurs have also benefited from consistent play, bolstering the young star’s MVP credentials with elite two-way production. For the Lakers, navigating the opening rounds without their primary offensive engine will test the depth and resilience of LeBron James, the supporting cast and any adjustments Redick can implement.
League-wide, the injury underscores the physical toll of a grueling 82-game schedule on high-usage stars. Doncic’s workload has been immense, often carrying the offense through heavy minutes and defensive attention. His ability to recover quickly from this latest setback could define not only the Lakers’ 2026 playoff hopes but also his long-term durability narrative.
Fans and analysts have expressed frustration over the timing, noting that Doncic appeared on pace for one of the most statistically impressive seasons in recent memory. Social media erupted with debates about MVP voting criteria, the value of availability versus peak performance, and whether the award should account for context such as midseason trades or personal circumstances. (Doncic was with the Mavericks earlier in his career before joining the Lakers.)
As the regular season winds down, attention turns to how the Lakers perform in Doncic’s absence and whether he can realistically contribute in the playoffs. Medical experts suggest a four-week timeline is common for Grade 2 strains, though individual healing varies. The injection in Spain represents a proactive step many athletes take to shorten recovery windows.
For now, the 2026 MVP race has narrowed to a battle primarily between Gilgeous-Alexander’s consistency and efficiency with the top-seeded Thunder and Wembanyama’s transformative impact on both ends of the floor for the surging Spurs. Jokic remains a perennial contender with Denver, but the field has tightened without Doncic’s late-season heroics.
Doncic himself has stayed relatively quiet on the award, consistent with past seasons where he has let his play speak for itself. His focus, per reports, remains on rehabilitation and returning stronger for the Lakers’ postseason push.
The NBA community will monitor updates from Spain closely over the coming days. A faster-than-expected recovery could spark renewed optimism for both a playoff boost and, at minimum, preserving Doncic’s place in award conversations historically. Yet with the regular season nearly complete, the path to MVP glory appears closed for the Slovenian sensation this year.
As the Lakers prepare for life without their star in the short term, the basketball world reflects on a season in which Doncic once again reminded everyone of his generational talent — even if injury prevented a storybook ending to his MVP campaign.

SAN DIEGO — NASA’s Artemis II astronauts splashed down safely in the Pacific Ocean off California’s coast Friday night, capping a historic 10-day voyage around the Moon that marked humanity’s first crewed lunar mission in more than half a century and set a new record for the farthest distance humans have ever traveled from Earth.

The Orion spacecraft carrying Commander Reid Wiseman, Pilot Victor Glover, Mission Specialist Christina Koch and Canadian Space Agency astronaut Jeremy Hansen touched the water at precisely 8:07 p.m. EDT (5:07 p.m. PDT) on April 10, 2026, after a flawless high-speed re-entry that tested the capsule’s heat shield to its limits. Recovery teams from NASA and the U.S. military quickly secured the capsule and extracted the crew, who were then flown by helicopter to the USS John P. Murtha for initial medical checks before heading to Houston.
Welcome home Reid, Victor, Christina, and Jeremy! 🫶
The Artemis II astronauts have splashed down at 8:07pm ET (0007 UTC April 11), bringing their historic 10-day mission around the Moon to an end. pic.twitter.com/1yjAgHEOYl
— NASA (@NASA) April 11, 2026
“Welcome home Reid, Victor, Christina, and Jeremy!” NASA posted on X shortly after splashdown, accompanied by video of the dramatic descent under parachutes. The message captured the global excitement as the four astronauts completed a journey that took them 252,756 miles from Earth — surpassing the 1970 Apollo 13 record by more than 4,000 miles — and brought them behind the far side of the Moon for the first time with humans aboard.
The mission’s success comes at a pivotal moment for NASA’s Artemis program, which aims to return astronauts to the lunar surface later this decade and eventually establish a sustainable presence on the Moon as a stepping stone to Mars. Artemis II served as a critical uncrewed-to-crewed test flight, validating the Orion spacecraft’s life-support systems, navigation and re-entry performance in deep space.
Liftoff occurred April 1 aboard the massive Space Launch System rocket from Kennedy Space Center in Florida. Over the next 10 days the crew circled the Moon, captured stunning images of Earthrise and the lunar far side, and even witnessed a total solar eclipse from space. They performed a precise flyby that looped them around the Moon’s far side, experiencing a 40-minute communications blackout before re-emerging with flawless data.
Milestones piled up quickly. On April 6 the crew shattered Apollo 13’s long-standing distance record. Koch became the first woman to fly around the Moon. Glover, the first person of color on a lunar mission, and Hansen, the first non-American, added to the mission’s diversity and international flavor. Wiseman, a veteran commander, kept the team focused throughout.
Re-entry proved one of the most hazardous phases. Traveling at nearly 25,000 mph, Orion separated from its service module, endured temperatures exceeding 5,000 degrees Fahrenheit and plunged through a communications blackout before deploying drogue and main parachutes. The capsule slowed from hundreds of miles per hour to about 20 mph for a gentle splashdown roughly 50 miles off San Diego.
NASA officials called the mission a triumph of engineering and teamwork. “This was not just a test flight — it was a bridge to the future,” said Artemis program manager said in a post-splashdown briefing. The data collected will directly inform Artemis III, which will attempt the first crewed lunar landing since Apollo 17 in 1972.
Public reaction poured in across social media and news outlets. World leaders, including President Donald Trump and Canadian Prime Minister, congratulated the crew. Space enthusiasts celebrated the return with memes, live-viewing parties and calls for accelerated funding. Schools tuned in during class, and millions watched live streams on NASA TV, YouTube and even Netflix.
The crew’s safe return also validated years of work on Orion’s heat shield, which had raised concerns after Artemis I. Engineers confirmed the shield performed as designed, providing critical confidence for future crewed flights. Recovery operations went smoothly, with the USS John P. Murtha serving as the primary support vessel. The Orion capsule itself will be returned to shore for detailed analysis at Naval Base San Diego before heading back to Kennedy Space Center.
For the astronauts, the mission represented personal and professional pinnacles. Wiseman, Glover and Koch are NASA veterans with prior spaceflight experience on the International Space Station, while Hansen, a fighter pilot and former Royal Canadian Air Force colonel, made his first trip to space. Their diverse backgrounds underscored NASA’s commitment to inclusivity in deep-space exploration.
Artemis II’s success resets the stage for an ambitious lunar agenda. Artemis III, targeted for 2027 or later, will land the first woman and first person of color on the Moon near the south pole using SpaceX’s Starship lander. Subsequent missions will build toward a lunar outpost called Gateway and long-term habitation. International partners, including Canada, Europe and Japan, play key roles, with Hansen’s participation highlighting Canada’s contributions.
Challenges remain. Budget constraints, technical hurdles with Starship and geopolitical factors could affect timelines. Yet Friday’s splashdown demonstrated that NASA and its partners can execute complex human spaceflight operations beyond low Earth orbit. The mission also provided valuable lessons on crew health, radiation exposure and long-duration life support that will benefit future Mars voyages.
As the astronauts begin post-flight debriefs and medical evaluations in Houston, the focus shifts to turning Artemis II’s data into actionable improvements. NASA has scheduled a full post-mission news conference for the coming days, where the crew is expected to share firsthand accounts of their lunar adventure.
The return of Artemis II comes amid renewed global interest in space. China’s plans for its own lunar landings, private-sector advancements by SpaceX and Blue Origin, and growing scientific interest in lunar resources have intensified the pace of exploration. Artemis II proved the United States and its partners remain at the forefront.
For now, the four astronauts are safely home, reunited with family and ground teams after a journey that pushed the boundaries of human spaceflight. Their mission not only honored the Apollo legacy but boldly extended it, reminding the world that the Moon remains a destination worth reaching — and that the next giant leap may be closer than ever.
As NASA prepares for Artemis III and beyond, Friday’s splashdown stands as a powerful symbol: humanity has returned to the Moon’s vicinity, and the path to its surface is now clearer than at any time since the 1970s. The stars, once again, feel within reach.

TUCSON, Ariz. — The search for Nancy Guthrie, the 84-year-old mother of NBC’s “Today” show co-anchor Savannah Guthrie, entered its 10th week Saturday with no arrests, no confirmed sightings and growing uncertainty about her fate more than two months after she was abducted from her home in Catalina Foothills near Tucson.
Guthrie was last seen on the evening of Jan. 31, 2026. She was reported missing Feb. 1 after failing to appear at church. Authorities believe she was taken against her will from her bed in the early morning hours of Feb. 1. Drops of her blood were found on the front porch, and evidence at the scene — including signs of forced entry or disturbance — pointed to a kidnapping rather than a voluntary disappearance.

Pima County Sheriff Chris Nanos has described the case as a targeted abduction. Investigators recovered doorbell camera footage showing a suspect tampering with the device. The FBI described the individual as a male, approximately 5 feet 9 inches to 5 feet 10 inches tall with an average build. A glove found nearby that appeared to match one worn by the suspect underwent DNA testing, though results linked it to an unrelated restaurant employee.
Multiple ransom notes have been received, some demanding payment in Bitcoin. The family initially received communications they took seriously. More recently, TMZ reported receiving additional notes, including one claiming Guthrie is no longer alive and offering information on her whereabouts and the kidnappers’ identities in exchange for cryptocurrency. Authorities and the family have not confirmed the legitimacy of every note, but Savannah Guthrie has said in interviews that some appeared credible.
On Feb. 24, the Guthrie family announced a $1 million reward for information leading to Nancy’s safe recovery. The FBI added its own $50,000 to $100,000 incentive, bringing the total potential payout higher. Tips have poured in by the tens of thousands, prompting ground and air searches, neighborhood canvassing and analysis of surveillance footage from the area.
Savannah Guthrie has spoken publicly about the ordeal in emotional interviews. She described learning of the disappearance, her brother’s immediate suspicion of a ransom kidnapping, and her own feelings of guilt, saying she wondered if the abduction was somehow connected to her high-profile career. She returned to the “Today” show anchor desk on April 6 after more than two months away, telling viewers it felt good to be back while continuing to plead for help in finding her mother.
The family has been fully cooperative and cleared of any involvement, according to Sheriff Nanos. Early persons of interest, including two men briefly detained and questioned, were released without charges. No current suspects have been publicly identified, though investigators believe they know a possible motive and that the abduction was targeted.
Details emerging from the investigation paint a disturbing picture. Nancy Guthrie’s front door was reportedly found propped open. She was believed to have been taken without shoes, and her mobility issues made it unlikely she could have left on her own. Neighbors reported internet disruptions in the area on the night of the abduction, prompting FBI agents to question residents about possible digital interference.
The case has drawn intense national attention, in part because of Savannah Guthrie’s prominence on morning television. It has also sparked online speculation, conspiracy theories and amateur sleuthing that authorities say have sometimes complicated the investigation. Sheriff Nanos has warned that the unknown suspect could potentially strike again, urging residents to remain vigilant.
As the search stretches into its third month, experts note that the passage of time makes solving the case more difficult. Leads grow colder, and the likelihood of a positive outcome diminishes without new evidence. Still, law enforcement continues to pursue every tip, review digital records and analyze physical evidence collected from the home and surrounding area.
Nancy Guthrie, a widow whose husband Charles died in 1988, lived a relatively quiet life in the Tucson suburbs. She had three children, including Savannah. Friends and family describe her as active in her church community despite health challenges that limited her mobility in recent years.
The broader investigation involves the FBI’s Phoenix office working jointly with the Pima County Sheriff’s Department. Resources have included forensic analysis, behavioral profiling and coordination with agencies across state lines. Speculation about possible links to other crimes, such as cryptocurrency-related home invasions in Arizona, has surfaced but remains unconfirmed by officials.
Savannah Guthrie has expressed gratitude for the outpouring of support from neighbors, viewers and the Tucson community while renewing calls for anyone with information to come forward. “It is never too late to do the right thing,” she said in one public appeal. She has also spoken about the toll the uncertainty has taken on her family, describing agonizing thoughts about what her mother may have endured.
For now, Nancy Guthrie remains missing. Her condition and exact whereabouts are unknown. The case stands as a stark reminder of the vulnerability of elderly residents and the challenges of investigating abductions with limited physical evidence and no immediate suspect.
Authorities continue to urge the public to report any information, no matter how small, to the dedicated tip line or the FBI. The $1 million-plus reward remains active, and investigators say fresh eyes or overlooked details could still break the case open.
As the investigation presses forward without resolution, the Guthrie family and law enforcement hold out hope that Nancy will be found safe — or at least that answers will bring some measure of closure. In the meantime, the quiet Tucson suburb where she was taken continues to grapple with the unsettling reality that an 84-year-old woman was pulled from her home in the dead of night, and her abductor remains at large.
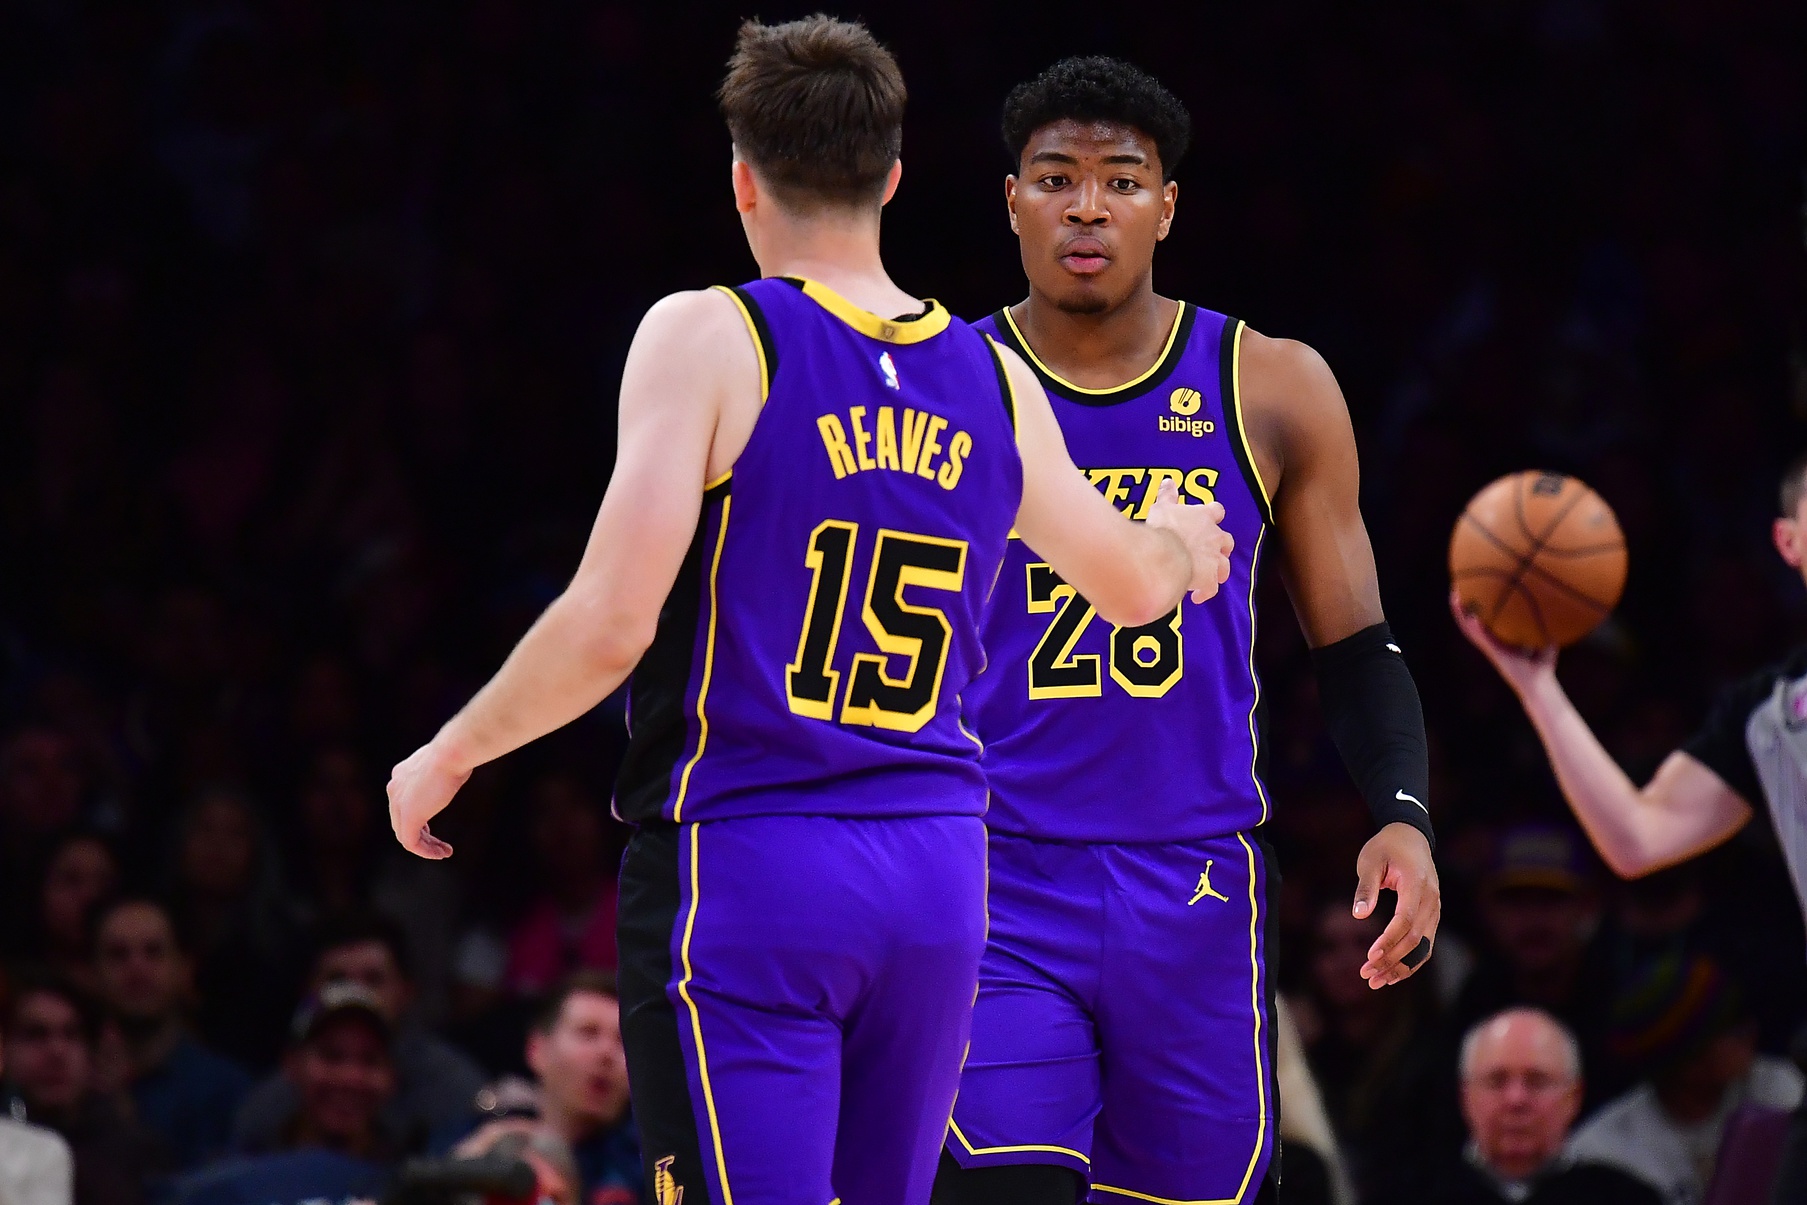
LOS ANGELES — The Los Angeles Lakers are navigating a late-season injury crisis that has sidelined two of their top offensive weapons for the remainder of the 2025-26 regular season, raising questions about their seeding and early playoff prospects despite already clinching a postseason berth.

As of April 11, 2026, superstar guard/forward Luka Doncic remains out with a Grade 2 left hamstring strain suffered April 2 in a blowout loss to the Oklahoma City Thunder. Austin Reaves is also sidelined with a Grade 2 left oblique muscle strain from the same game. Both players are expected to miss at least four to six weeks, putting their availability for the start of the playoffs in doubt.
Doncic, who led the NBA in scoring at 33.5 points per game while adding 7.7 rebounds and 8.3 assists, grabbed his hamstring during the third quarter of the 139-96 defeat. An MRI confirmed the partial tear — his second significant hamstring issue this season. The 27-year-old Slovenian traveled to Spain for specialized medical treatment, including an injection procedure, in hopes of accelerating his recovery. His agent, Bill Duffy, confirmed the move after consultations with Lakers medical staff and Doncic’s personal team.
Reaves suffered his oblique injury earlier in the same contest while reaching for a rebound. He initially returned to finish with 15 points but later required a second MRI after questions arose about the first scan performed in Dallas. The injury will sideline the reliable guard, a key playmaker and scorer, for the final stretch of the regular season.
The absences compound an already challenging situation for coach JJ Redick’s squad. The Lakers entered April with momentum but have seen their depth tested repeatedly. Veteran guard Marcus Smart continues to miss time with a right ankle contusion, now in his eighth consecutive game out. Center Jaxson Hayes is dealing with left foot soreness and has been listed as out or questionable in recent contests.
Other notes from recent injury reports include occasional management of LeBron James’ left foot issues, though the 41-year-old veteran has been available for most games after earlier-season absences tied to sciatica and foot arthritis. Forward Jarred Vanderbilt has been questionable at times with right calf soreness, adding to the uncertainty around the frontcourt.
The timing could not be more critical. With the regular season winding down and the playoffs set to begin around mid-April, the Lakers — currently holding a strong record near the top of the Western Conference — must rely on their remaining roster to secure favorable seeding. Without Doncic’s scoring punch and Reaves’ facilitation, the offense has shown signs of struggle, as evidenced by recent lopsided losses.
Redick has emphasized caution and long-term health. “We’re not rushing anybody back,” the coach said in recent comments. “The goal is to have our best players ready when it matters most in the postseason.” He noted that Doncic remains in “relatively good spirits” during his recovery abroad, while Reaves continues receiving regular check-ins with the team.
Medical experts describe a Grade 2 strain as a partial tear that typically requires three to six weeks of rehabilitation, depending on the individual’s response to treatment. Regenerative options like injections, common among elite athletes, can sometimes shorten that window to two to four weeks in optimistic scenarios. However, hamstrings and obliques are notoriously finicky injuries that demand careful management to avoid re-aggravation.
The Lakers’ front office and training staff face difficult decisions in the coming weeks. Playoff eligibility rules and the need for rust-free performance mean any return will likely be gradual. Sources indicate the target remains an early-May availability at the earliest, which could align with a potential second-round series if the Lakers advance.
This injury wave comes after a season in which the Lakers successfully integrated Doncic following his arrival and built chemistry around James, Reaves and supporting pieces. The team’s ability to weather the storm without its two leading scorers will test the depth provided by players like Rui Hachimura, D’Angelo Russell (when healthy) and role players stepping up in crunch time.
Fan and analyst reaction has been mixed, with some expressing concern over the team’s championship aspirations while others point to the Lakers’ history of postseason resilience. The Western Conference remains highly competitive, with teams like the Thunder and Spurs boasting strong records and fewer injury concerns heading into the playoffs.
Beyond the immediate absences, the injuries highlight broader themes in the NBA: the physical toll of an 82-game season on high-usage stars and the importance of load management. Doncic’s workload has been heavy all year, and this latest setback echoes previous durability questions. Reaves, known for his toughness, has generally stayed available but now faces a core injury that can impact shooting and movement.
As the regular season concludes, the Lakers will continue providing daily updates through official injury reports. The focus remains on rehabilitation protocols, strength and conditioning work, and preparing the supporting cast for heavier minutes.
For a franchise with 17 championships and a legacy of overcoming adversity, the current situation represents another test. Whether Doncic and Reaves can return in time — and at full strength — to make a meaningful impact could define the 2025-26 campaign.
As of Saturday, the full injury picture includes:
- Luka Doncic: Out (Grade 2 left hamstring strain) — remainder of regular season; playoff status uncertain; receiving treatment in Spain.
- Austin Reaves: Out (Grade 2 left oblique strain) — remainder of regular season; expected 4-6 weeks recovery.
- Marcus Smart: Out (right ankle contusion) — multiple games missed.
- Jaxson Hayes: Out/Questionable (left foot soreness).
- Luke Kennard: Day-to-day (left finger injury management).
LeBron James and other key contributors appear closer to full availability, providing a foundation for the team to lean on.
The Lakers’ next games will offer a window into how the roster adapts. With the postseason looming, every practice, treatment session and minute logged by healthy players carries added weight. The organization’s medical and coaching staff will balance short-term competitiveness with the long-term goal of a deep playoff run.
In the end, the 2025-26 season has already delivered drama for Lakers fans. Now, as injuries mount at a critical juncture, the focus shifts to resilience, recovery and the hope that their stars can return when the games matter most.

The New York Times Connections puzzle for Saturday, April 11, 2026 — No. 1035 — challenged word game enthusiasts with clever groupings ranging from roadside emergency gear to architectural supports and a sophisticated purple category that left many players pondering until the final guesses.

Players were presented with 16 words: ICE SCRAPER, JACK, JUMPER CABLES, SPARE TIRE, ANGEL, CHAMPION, PATRON, SPONSOR, BEAM, BRACE, COLUMN, STRUT, BOMBAY, CHELSEA, SCREWDRIVER, SNOWFLAKE. The goal, as always, was to sort them into four groups of four based on shared themes, with categories ranked from easiest (yellow) to most difficult (purple).
The yellow group, typically the most straightforward, proved accessible for many: items commonly found in the trunk of a car. ICE SCRAPER, JACK, JUMPER CABLES and SPARE TIRE instantly clicked for drivers familiar with winter preparedness and roadside breakdowns. This category rewarded practical, everyday knowledge and helped solvers build early momentum.
Green followed with a more abstract but recognizable theme: benefactor. ANGEL, CHAMPION, PATRON and SPONSOR all describe someone who provides support, funding or advocacy — whether in arts, sports, business or charity. The words evoked images of generous backers or heroic figures stepping up for a cause, a category that tested vocabulary and conceptual thinking rather than literal objects.
Blue delivered a technical, construction-oriented set: structural supports. BEAM, BRACE, COLUMN and STRUT are all engineering terms for elements that bear weight or provide stability in buildings and frameworks. This group appealed to those with architectural knowledge or experience in DIY projects, offering a satisfying “aha” moment once the theme emerged.
The purple category, historically the trickiest, required the biggest lateral leap: words ending in bodies of water. BOMBAY (now Mumbai, but historically associated with Bombay Harbor or Bay), CHELSEA (as in Chelsea, a district in London near the Thames, or referencing water-related contexts), SCREWDRIVER (a cocktail made with vodka and orange juice, but cleverly tying into “screw” and water themes? Wait, actually the precise link is that each ends with a body of water in a punny or compound sense: Bombay ends with “bay,” Chelsea may reference a watery association, but sources confirm the category as words that end in names of bodies of water when considering Bombay (bay), and the others fitting similarly through creative wordplay involving “sea,” “river,” etc. — though the exact mechanism delighted solvers with its wordplay). The category showcased Connections’ signature blend of geography, cocktails and clever misdirection.
Many players reported solving in order from yellow to purple, though some spotted the purple category early due to the water associations and worked backward. Others struggled with the benefactor or structural groups when misdirection words created tempting but incorrect clusters.
Connections, created by journalist Wyna Liu and launched by The New York Times in 2023, has grown into a daily ritual for millions. The game presents a 4×4 grid of words and challenges solvers to identify the hidden connections without any initial hints beyond the color-coded difficulty levels. Mistakes cost “lives,” with four errors ending the puzzle, adding gentle pressure and replay value.
Saturday’s puzzle earned praise for balance: the yellow car-trunk category felt fair and relatable, while the purple demanded creative thinking without crossing into unfair obscurity. Online forums and Reddit’s r/NYTConnections lit up with discussions, emoji grids and debates over whether the purple category was brilliantly clever or mildly devious.
Typical reactions included quick yellow solves followed by slower progress on blue and green. Some perfect games were reported, while others needed three or four mistakes before cracking all groups. Hard-mode variants, where solvers avoid using confirmed words from solved groups, increased the challenge for competitive players.
The puzzle arrived on a quiet spring weekend, providing mental stimulation alongside the day’s Wordle and other NYT Games offerings. Many families and friend groups compared scores over breakfast or coffee, turning the daily challenge into a shared social experience.
Strategies that worked well included scanning for obvious clusters first — such as car-related items or building terms — then hunting for subtler links. Avoiding premature guesses on ambiguous words like “JACK” (which could misleadingly fit multiple categories) helped preserve lives. Starting with concrete nouns often unlocked the easier groups quickly.
For newcomers or those still building streaks, today’s solution highlighted Connections’ educational value. Players learned or reinforced knowledge about automotive safety, patronage roles, architecture and linguistic creativity. Post-solve dictionary or Wikipedia checks on terms like “strut” or historical references in the purple group turned the game into a mini learning session.
The New York Times Games team continues refining the experience with consistent daily releases at midnight Eastern Time. No major rule changes appeared in early 2026, preserving the core formula that made Connections a hit: clever, fair and just difficult enough to feel rewarding.
As puzzle No. 1035 entered the books, solvers looked ahead to Sunday’s offering, hoping for another engaging mix of themes. Whether easy or hard, the daily Connections ritual remains a highlight for vocabulary lovers, lateral thinkers and casual gamers alike.
Those who missed a perfect score on April 11 can take comfort in the forgiving reset. Tomorrow brings a fresh grid and new opportunities to test pattern recognition and cultural knowledge.
In an era of endless digital distractions, Connections stands out for its elegant simplicity and intellectual satisfaction. Saturday’s car-trunk-to-water-pun journey exemplified why the game continues captivating players worldwide — one cleverly connected group at a time.
Business
(VIDEO) Chris Brown and Usher Tease Epic “Raymond & Brown” R&B Stadium Tour in Major 2026 Collaboration
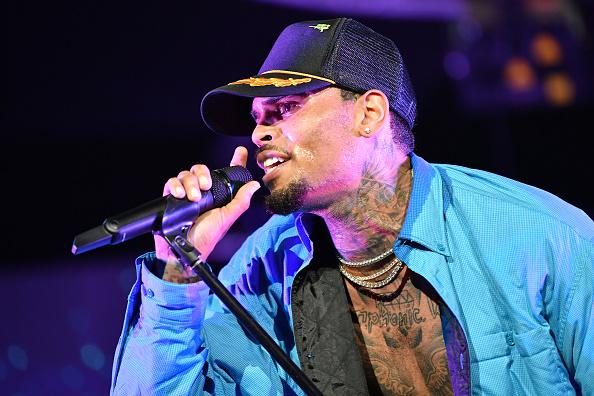
LOS ANGELES — R&B superstars Chris Brown and Usher have officially announced their first-ever joint tour, “Raymond & Brown,” sending shockwaves through the music industry and igniting massive excitement among fans Friday morning.

The two icons, whose combined catalogs have defined modern R&B for more than two decades, shared the news simultaneously on Instagram with sleek promotional videos featuring high-energy motorcycle rides through city streets and fans receiving tour alerts on their phones. While full dates, venues and ticket information have yet to be released, the tour is expected to hit stadiums later in 2026, promising a blockbuster celebration of R&B hits, smooth vocals and electrifying dance moves.
“Raymond & Brown” cleverly plays on Usher’s middle name and last name alongside Brown’s surname, doubling as a nod to the genre itself — R&B. Industry insiders and social media erupted with reactions calling it a dream pairing of two generations of R&B royalty.
Usher Raymond IV, 47, and Chris Brown, 36, have long been compared as titans of the genre. Usher burst onto the scene in the late 1990s with his self-titled debut and exploded globally with 2004’s “Confessions,” which sold over 10 million copies in the U.S. alone and spawned No. 1 hits like “Yeah!” featuring Lil Jon and Ludacris, “Burn” and “My Boo.” Known for his impeccable vocals, charismatic stage presence and innovative dance routines, Usher has earned eight Grammy Awards and sold more than 80 million records worldwide. His recent “Past Present Future” project and past Las Vegas residencies continue to showcase his enduring appeal.
Chris Brown, who debuted as a teen sensation in 2005 with his self-titled album featuring the smash “Run It!,” has built a career marked by chart dominance and boundary-pushing performances. With hits including “Forever,” “With You,” “Loyal” and more recent tracks from albums like “11:11” and his ongoing “Breezy” era, Brown has amassed billions of streams and maintained a fervent fan base known as Team Breezy. He has also ventured into dance-heavy stadium shows, including the 2025-2026 “Breezy Bowl XX” celebrating 20 years in music.
The pairing marks a full-circle moment. The two artists have collaborated before, most notably on Brown’s 2016 track “Party” featuring Usher and Gucci Mane. They have also shared stages in the past, with memorable guest appearances that hinted at their mutual respect despite occasional online chatter about friendly competition in the R&B space.
Social media lit up within minutes of the announcement. Fans flooded comments with heart emojis, fire symbols and predictions of sold-out stadiums. “This is the tour of the decade,” one popular post read. “Two kings, one stage — R&B is winning.” Hashtags like #RaymondAndBrownTour and #RNBTour trended rapidly as clips from the announcement trailer circulated.
The tour’s stadium format signals major ambitions. Recent years have seen R&B and hip-hop artists successfully scale to large venues, with tours by acts like Beyoncé, Drake and The Weeknd proving the genre’s drawing power. A joint Brown-Usher run could easily fill football stadiums across North America and potentially expand internationally, capitalizing on their massive combined streaming numbers and loyal followings.
Details remain scarce as of Friday afternoon. Representatives for both artists have not yet released a full itinerary or on-sale date for tickets. Industry observers expect announcements in the coming weeks, with Live Nation or AEG likely involved in promotion given their track records with major R&B tours. Presale opportunities for fan clubs or verified fans could precede general sales.
The announcement arrives at a strong time for both performers. Usher continues to enjoy momentum from his Super Bowl halftime show legacy and consistent output, while Brown has stayed active with music releases, features and high-profile appearances despite occasional personal and legal headlines. Their ability to draw crowds together could create one of the highest-grossing R&B tours in recent memory.
Music historians note that joint tours by established stars often become cultural events. Think of past pairings like Jay-Z and Beyoncé’s “On the Run” or co-headlining packages that blend catalogs for unforgettable nights. “Raymond & Brown” promises a similar experience — sets blending solo hits, joint performances, medleys and perhaps surprise collaborations.
Fans can expect staples like Usher’s “U Got It Bad,” “Nice & Slow,” “Love in This Club” and “OMG” alongside Brown’s “Kiss Kiss,” “Deuces,” “New Flame” and dance anthems that highlight both artists’ athletic choreography. The production is likely to feature state-of-the-art lighting, massive video screens and intricate staging to accommodate their signature moves.
Beyond the stage, the tour could boost streaming and catalog sales for both. With platforms like Spotify, Apple Music and YouTube playing key roles in discovery, a major tour often leads to renewed interest in classic albums. Younger audiences discovering the artists through social media virality may also flock to shows, bridging generational gaps in R&B fandom.
The news also highlights the resurgence of R&B as a live experience. After years where hip-hop and pop dominated touring conversations, acts emphasizing melody, emotion and performance are reclaiming spotlight. Brown and Usher represent different eras — Usher as the polished 2000s heartthrob and Brown as the high-energy 2010s trailblazer — yet their styles complement each other seamlessly.
Speculation about a possible joint album or EP to accompany the tour has already begun circulating, though nothing has been confirmed. Past successful collaborations between R&B heavyweights have produced memorable records, and a project from these two could generate significant buzz.
Challenges for any large-scale tour include logistics, ticket pricing and fan accessibility. Stadium shows often come with higher costs, but strong demand could justify premium experiences, including VIP packages with meet-and-greets or early entry. Organizers will likely aim to balance affordability with the production scale fans expect from these superstars.
Both artists maintain active philanthropic efforts. Usher’s New Look Foundation has focused on youth empowerment for years, while Brown has supported various causes through his music and public appearances. A joint tour could include charitable components or awareness initiatives, further enhancing its cultural footprint.
As anticipation builds, industry analysts are already projecting strong numbers. Comparable tours have grossed tens of millions, and with two headliners sharing billing, costs can be optimized while maximizing revenue potential. International expansion, particularly in Europe, Asia and Africa where both have strong followings, could extend the run significantly.
Friday’s announcement follows months of rumors about a possible collaboration. Social media speculation intensified in recent weeks, with fan accounts and music blogs teasing the possibility. The official reveal delivered exactly what supporters hoped for — a bold, unified statement from two legends ready to share the spotlight.
For Chris Brown, the tour adds another chapter to his evolution from teen idol to seasoned performer capable of commanding massive stages. For Usher, it reinforces his status as an elder statesman of R&B while keeping him connected to contemporary audiences through Brown’s youthful energy.
Music executives and fellow artists quickly weighed in online, with many congratulating the pair and expressing excitement. The broader R&B community views the move as a unifying moment that celebrates the genre’s depth and staying power.
As more details emerge in the coming days and weeks, fans are advised to follow official accounts for both artists and reliable ticketing platforms. Early buzz suggests demand will be intense once dates drop, potentially leading to rapid sell-outs in major markets like New York, Los Angeles, Atlanta, Chicago and Miami — cities with deep ties to both performers.
“Raymond & Brown” is more than a tour name; it’s a declaration that R&B remains vibrant, competitive and capable of producing moments that bring generations together. In an era of fragmented attention, a co-headlining stadium run by two of the genre’s most gifted entertainers promises to be a unifying event — a night of hits, history and pure musical electricity.
With 2026 shaping up as a banner year for live music, this announcement sets a high bar early. Whether delivering back-to-back sets, trading verses on collaborations or surprising crowds with unreleased material, Chris Brown and Usher are poised to deliver what could become one of the most talked-about tours of the decade.
Business
OpenAI identifies security issue involving third-party tool, says user data was not accessed


OpenAI identifies security issue involving third-party tool, says user data was not accessed
Business
Zelenskyy Welcomes Russian Easter Ceasefire While Pushing Energy Truce and Security Guarantees
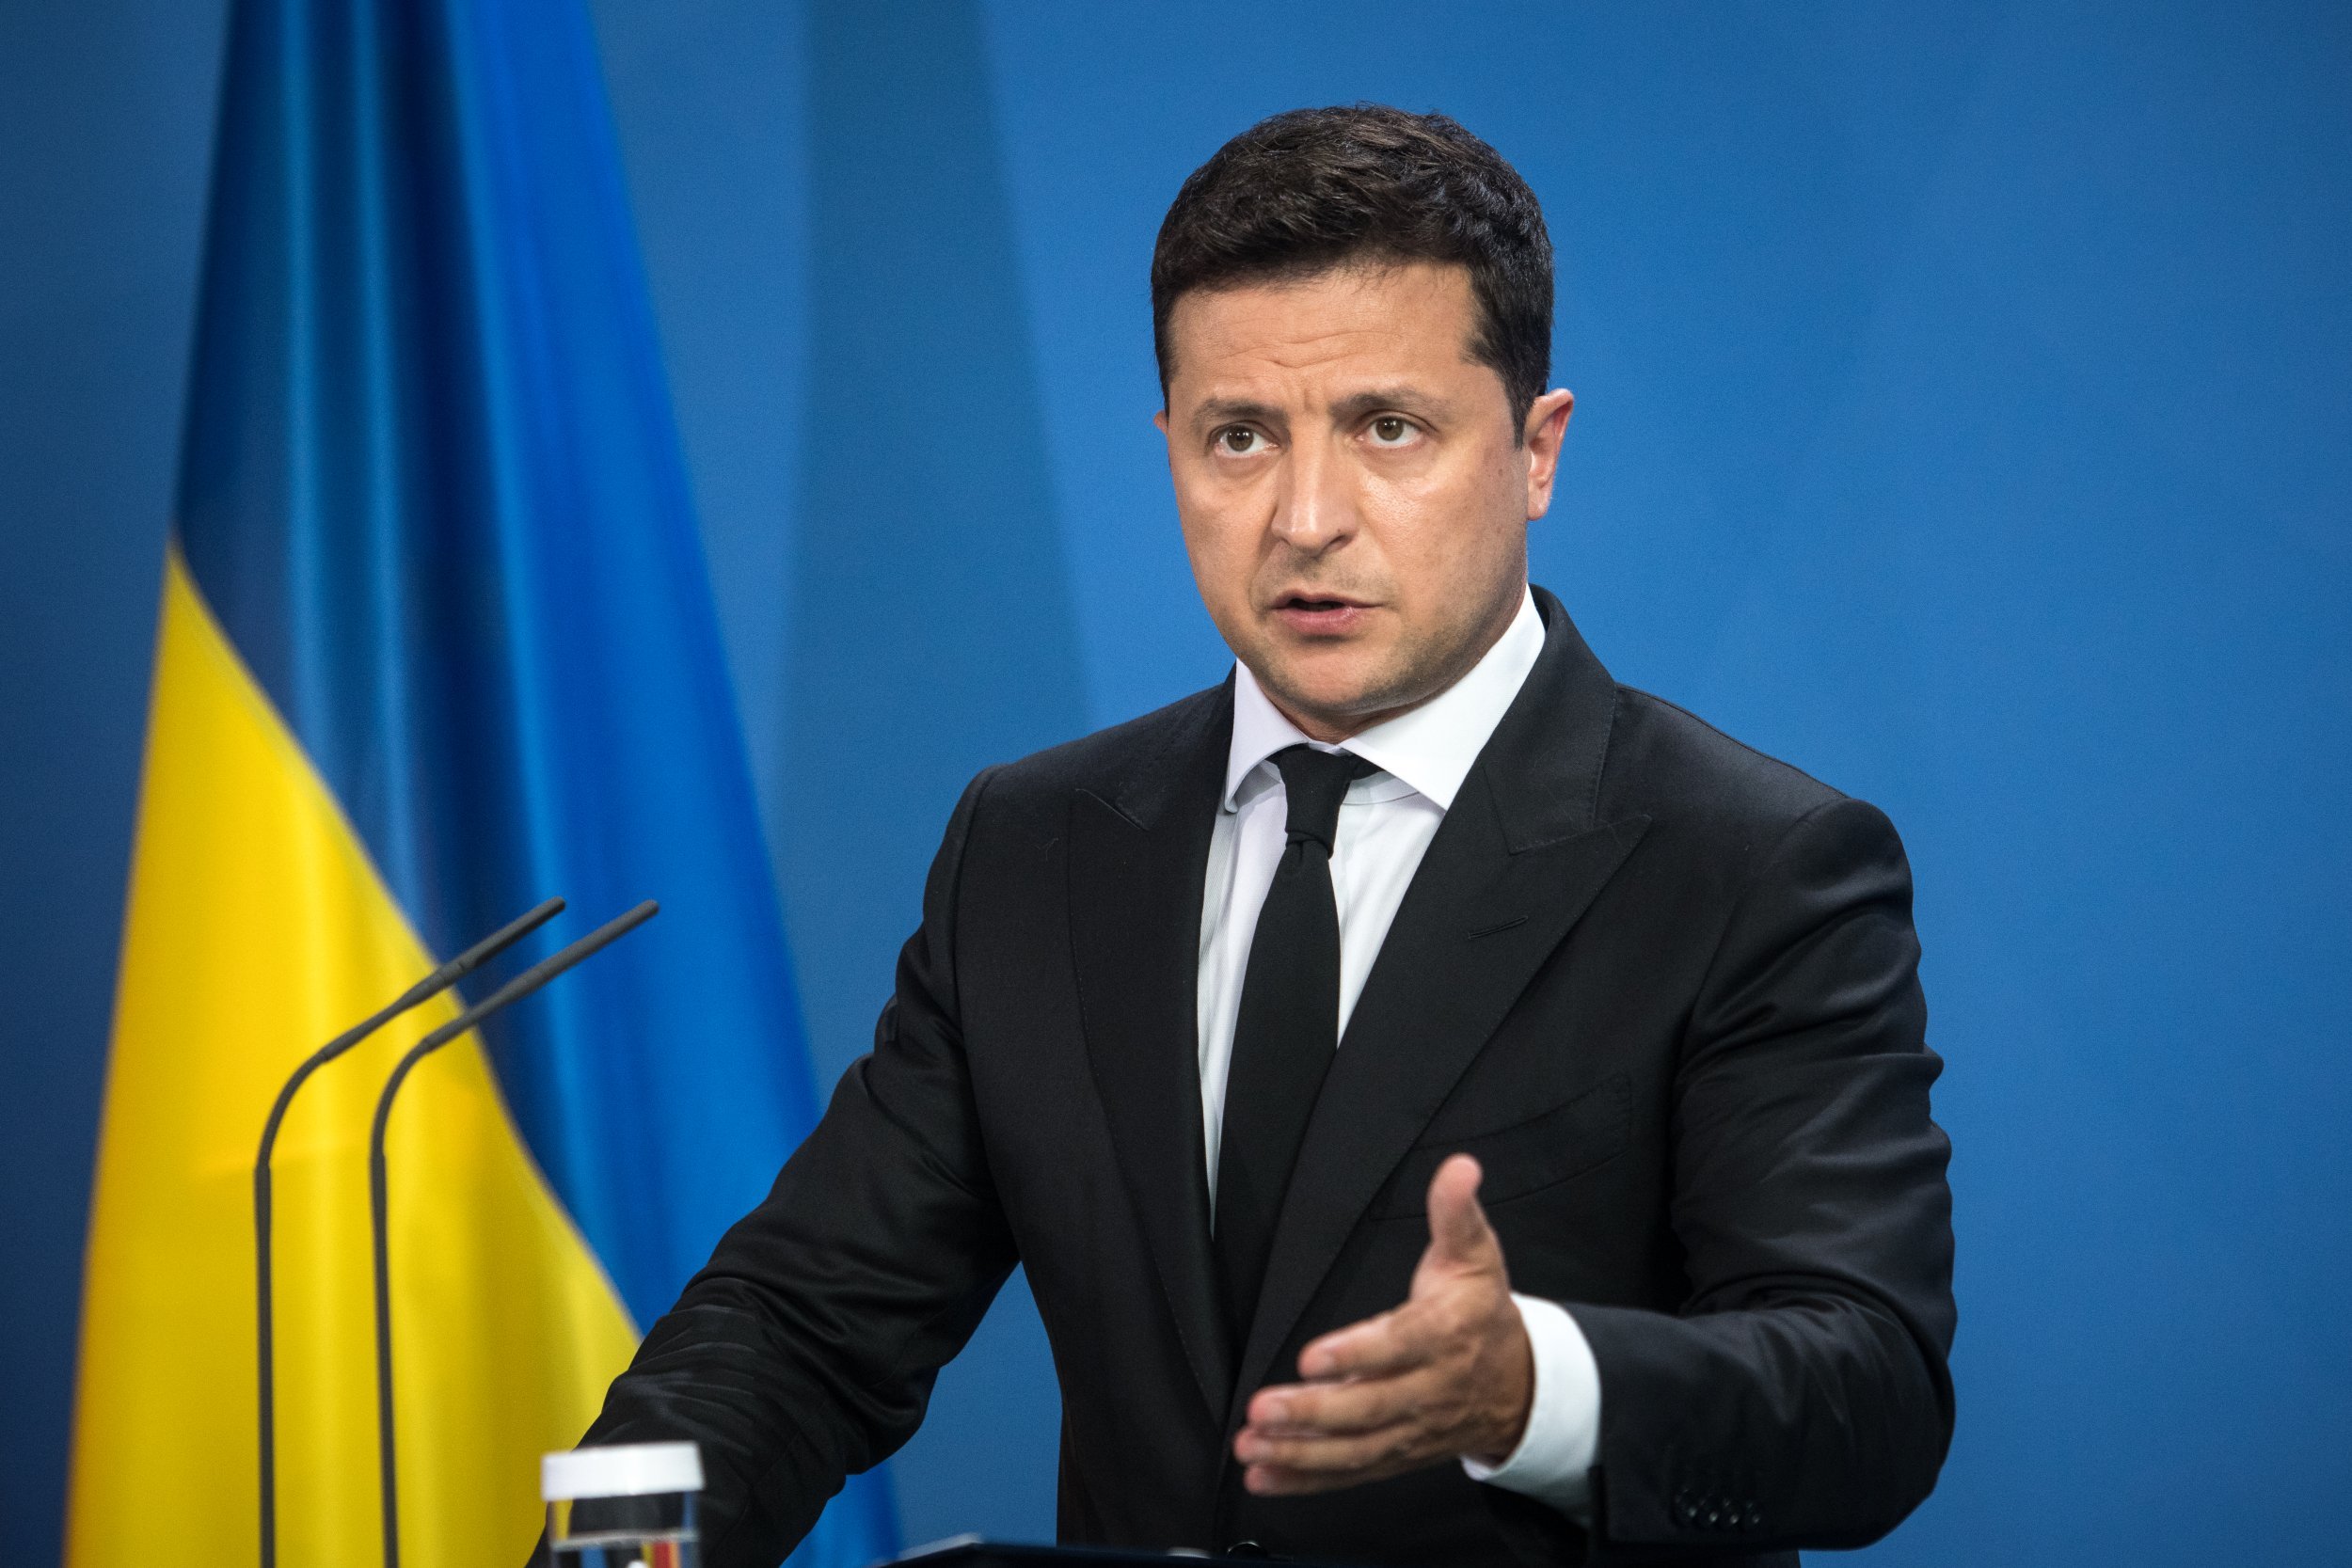
KYIV, Ukraine — Ukrainian President Volodymyr Zelenskyy on Friday welcomed a temporary Easter ceasefire declared by Russian President Vladimir Putin while reiterating his call for a broader halt to strikes on energy infrastructure, as the grinding war entered its fifth year amid shifting global tensions including conflicts in the Middle East.

Zelenskyy confirmed that Ukrainian forces would observe the 32-hour Orthodox Easter truce announced by Moscow, which is set to begin Saturday evening and run through Sunday, aligning with the holiday observed by both nations. At the same time, he expressed skepticism about Russia’s intentions, noting past failed ceasefires and accusing Moscow of choosing escalation over peace gestures.
In his nightly address and recent statements, Zelenskyy stood by a Ukrainian proposal conveyed to Russia through U.S. channels for a mutual ceasefire on attacks targeting energy facilities. “If Russia is ready to stop strikes on our energy infrastructure, we will be ready to respond in kind,” he said earlier this week, emphasizing that the offer remains on the table ahead of Orthodox Easter on April 13.
The latest developments come as both sides continue intense drone and missile exchanges. Overnight attacks have targeted civilian areas, including a strike on the Black Sea port of Odesa that killed three and injured at least 16, according to Ukrainian officials. Zelenskyy has repeatedly warned that Russia is preparing for a prolonged “year of war” in 2026, while highlighting signs of strain within Russian forces, including stalled army growth despite heavy mobilization.
Zelenskyy, a former comedian who rose to the presidency in 2019 and became a global symbol of defiance after Russia’s full-scale invasion in February 2022, has maintained a busy diplomatic schedule. In recent weeks, he traveled to the Gulf region and held talks in Istanbul with Turkish President Recep Tayyip Erdogan on security cooperation. He also spoke by phone with Pope Leo XIV, who expressed hopes for a just and lasting peace.
The Ukrainian leader has drawn connections between the war in Ukraine and escalating tensions in the Middle East, accusing Russia of aiding Iran and mapping U.S. assets to support Tehran. Zelenskyy revealed that Ukrainian forces had engaged in actual combat operations in the Middle East, shooting down Iranian-made Shahed drones during recent U.S.-Israel actions against Iran — not merely training missions but using Ukrainian-made interceptors. He offered Ukraine’s assistance in unblocking the Strait of Hormuz if needed, underscoring Kyiv’s growing role in broader global security discussions.
Relations with the United States under President Donald Trump remain a focal point. Zelenskyy has engaged in multiple calls and meetings with Trump and his envoys, including Steve Witkoff and Jared Kushner, discussing pathways to end the conflict. Trump has pushed for a swift resolution, with Zelenskyy noting that “much can be decided before the New Year” in potential high-level talks. However, Zelenskyy has pushed back against perceived pressure to cede territory, stressing that any peace must include robust security guarantees for Ukraine.
Work continues with U.S. negotiators on formalizing those guarantees, which Zelenskyy describes as essential for any lasting peace. He has urged allies to maintain sanctions pressure on Russia’s economy, particularly targeting shadow fleets that help Moscow sustain oil revenues despite restrictions.
On the battlefield, Ukrainian forces report incremental advances in areas like the Pokrovsk direction, while relying on innovative drone technology and expanded domestic defense production. Zelenskyy has hailed Ukraine’s growing arms industry, projecting significant output in drones and missiles by the end of 2026. At the same time, he has acknowledged the human cost, with earlier estimates placing Ukrainian military deaths in the tens of thousands and total casualties far higher.
Russia’s expansive territorial ambitions — including goals to seize remaining parts of Donbas, create buffer zones along northern borders and potentially push toward southern cities like Odesa — remain unchanged, according to Ukrainian assessments. Yet Zelenskyy has pointed to Russian difficulties in fulfilling planned advances, citing high casualties and internal societal pressures that could force broader mobilization, something the Kremlin has sought to avoid.
The Easter truce announcement by Putin has sparked speculation about Moscow’s shifting priorities, with some analysts wondering if Russia might redirect resources amid the Iran situation. Zelenskyy responded cautiously, saying Ukraine would mirror Russia’s actions and warning of a “symmetrical response” if violations occur. Past humanitarian pauses have often broken down quickly, with accusations flying from both sides.
Energy infrastructure remains a critical vulnerability. Russia has damaged or destroyed much of Ukraine’s power generation capacity through repeated strikes, leaving millions facing blackouts, especially during winter. Zelenskyy’s energy ceasefire proposal aims to provide immediate relief to civilians while building momentum toward broader de-escalation.
Diplomatically, Ukraine has strengthened ties beyond traditional Western allies. Talks with Ireland focused on unblocking EU accession negotiations and support for Ukrainians abroad. Cooperation with Norway addressed security enhancements, and agreements with Syria have emerged in unexpected areas. Zelenskyy has also engaged leaders in the Gulf on regional stability and free trade flows.
Domestically, Zelenskyy continues to project resilience. In addresses marking the war’s milestones, he has declared that Russia has “not broken Ukrainians” nor achieved its initial goals of quick victory and regime change. Ukraine has defended its independence and statehood, he insists, despite the immense challenges of a war now stretching into its fifth calendar year.
The conflict has evolved into a war of attrition dominated by drones, artillery and electronic warfare. Ukrainian adaptations in technology have provided tactical edges, even as Russian forces maintain pressure through sheer volume of attacks. Civilian infrastructure, including hospitals, schools and residential areas, continues to suffer, drawing international condemnation.
Zelenskyy has dismissed Russian claims of inevitable victory, arguing that Moscow’s calculations include prolonging the war to divert global attention and weaken support for Ukraine. He has called on partners to increase pressure, including through sanctions and military aid, while preparing Ukraine’s own defense industry for greater self-reliance.
As Orthodox Easter approaches — a time of reflection for millions in both countries — Zelenskyy’s messages blend hope for de-escalation with firm resolve. He has repeatedly proposed Easter ceasefires, only to see them rebuffed or undermined by continued strikes. The current Russian declaration, while limited, offers a brief window that Kyiv intends to honor, provided Moscow does the same.
Looking ahead, attention turns to potential trilateral or leaders-level talks involving the U.S., Ukraine and Russia. Zelenskyy has signaled openness to direct engagement if it advances concrete security arrangements and territorial integrity. However, he maintains that Ukraine will not accept ultimatums or unilateral concessions.
The broader geopolitical picture has grown more complex with the U.S.-Iran ceasefire and related developments. Zelenskyy has positioned Ukraine as a responsible actor willing to contribute to stability beyond its borders, from drone defense expertise to potential mediation roles in energy chokepoints.
Challenges abound. Ukraine faces manpower strains, economic pressures and the need for sustained international backing. Reconstruction costs run into hundreds of billions, with energy and housing among the most urgent needs. Yet Zelenskyy points to signs of Russian overextension and domestic discontent as potential turning points.
Friday’s developments, including the Easter truce response and drone revelations, underscore Zelenskyy’s dual role as wartime leader and diplomat. From nightly video addresses rallying his nation to high-stakes international calls, he continues to navigate a conflict that has reshaped European security and global alliances.
As spring advances and fighting seasons intensify, the coming weeks could prove decisive. Whether the Easter pause holds, if energy strikes subside, and how U.S.-led diplomacy evolves will shape the trajectory toward any potential negotiated end to Europe’s bloodiest conflict since World War II.
For millions of Ukrainians enduring blackouts, displacement and loss, Zelenskyy’s steadfast message remains one of endurance and hope: peace is possible, but only on terms that safeguard Ukraine’s future as a sovereign, secure nation.
Business
Bridgemarq Real Estate Services Inc. 2025 Q4 – Results – Earnings Call Presentation (TSX:BRE:CA) 2026-04-10

Seeking Alpha’s transcripts team is responsible for the development of all of our transcript-related projects. We currently publish thousands of quarterly earnings calls per quarter on our site and are continuing to grow and expand our coverage. The purpose of this profile is to allow us to share with our readers new transcript-related developments. Thanks, SA Transcripts Team
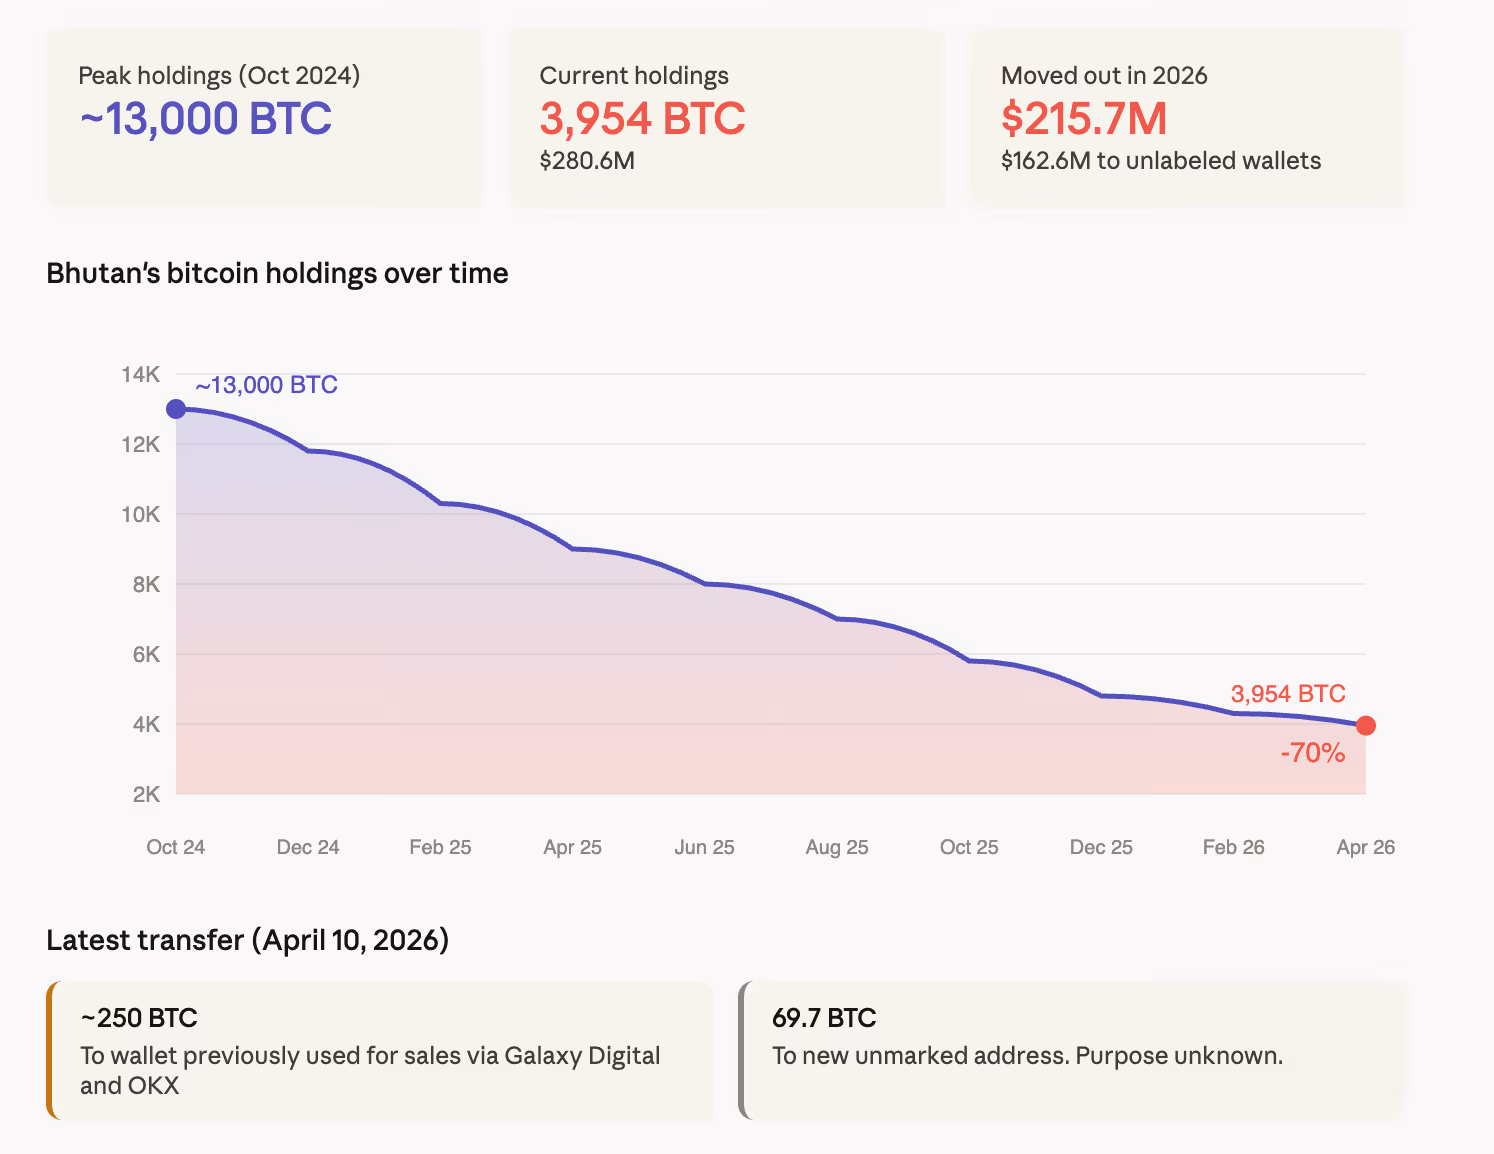
Bhutan has sold 70% of its bitcoin in 18 months. It may have stopped BTC mining too.

Teresa Giudice Teases Reunion With Melissa Gorga on RHONJ

Tassels in Focus – Julia Berolzheimer


-

 Business5 days ago
Three Gulf funds agree to back Paramount’s $81 billion takeover of Warner, WSJ reports
-

 Sports6 days ago
India men’s 4x400m and mixed 4x100m relay teams register big progress | Other Sports News
-

 Politics10 hours ago
US brings back mandatory military draft registration
-

 Fashion10 hours ago
Weekend Open Thread: Veronica Beard
-

 Business7 days ago
Expert Picks for Every Need
-

 Tech3 days ago
How Long Can You Drive With Expired Registration? What Florida Law Says
-

 Business6 days ago
No Jackpot Winner, Prize to Climb to $231 Million
-

 Fashion5 days ago
Massimo Dutti Offers Inspiration for Your Summer Mood Board
-
 Sports11 hours ago
Man United discover Nico Schlotterbeck transfer fee as defender reaches Dortmund agreement
-

 Fashion3 days ago
Let’s Discuss: DEI in 2026
-

 Crypto World3 days ago
Bitcoin recovers as US and Iran Agree a Ceasefire Deal
-

 Business7 hours ago
Tesla Model Y Tops China Auto Sales in March 2026 With 39,827 Registrations, Beating Cheaper EVs and Gas Cars
-

 Crypto World2 days ago
Canary Capital Files SEC Registration for PEPE ETF
-

 Business6 days ago
Akebia Therapeutics, Inc. (AKBA) Discusses Pipeline Progress and Strategic Focus on Kidney Disease Treatments at R&D Day – Slideshow
-

 Business16 hours ago
OpenAI Halts Stargate UK Data Centre Project Over Energy Costs and Copyright Row
-

 Politics7 days ago
The UK should not pay a penny in slavery reparations
-

 Tech5 days ago
Haier is betting big that your next TV purchase will be one of these
-

 Tech5 days ago
The Xiaomi 17 Ultra has some impressive add-ons that make snapping photos really fun
-

 Tech5 days ago
Samsung just gave up on its own Messages app
-

 Tech5 days ago
Gamer Restores the Original PlayStation Portal From Two Decades Ago
You must be logged in to post a comment Login