Kaynes Technologies’ sharp 43% slide from its October peak, capped by a steep 12.5% drop on Friday, has raised questions about whether the stock is approaching a reversal zone or slipping into deeper losses. While momentum indicators remain firmly bearish, its stretched gap from the 200-day moving average suggests potential mean-reversion opportunities for tactical investors.
Edited excerpts from a chat with Anand James, Chief Market Strategist, Geojit Investments Limited:
After a flat week, how would you trade the market now? Would Friday’s RBI optimism carry forward on Monday as well? Friday’s optimism stemmed from the completion of a morning star pattern, signaling a potential reversal from the downtrend that began on December 1. However, while the downswing was brief, the reversal is also likely to be short-lived, as evidenced by Friday’s stall at 26,200, a key congestion resistance.
Although oscillators support a possible uptrend extension, we do not see sufficient momentum for a strong move higher. We favor a swing lower toward 26,085–26,065 initially. Alternatively, a breakout above 26,200 could trigger further gains toward 26,460–26,550, but a sharp vertical rise is less likely.
Advertisement
IT was among the major gainers in the week. Do you see chances of more upside?
Live Events
Yes, the IT sector shows strong potential for further upside. Nifty IT has been signaling a reversal since September and recently broke above the weekly supertrend, indicating strength. The weekly RSI near 60, along with the index closing above its 20-week high, reinforces the positive outlook. Based on these technical cues, the index could target 39,500 in the coming weeks. Derivative data also supports this bullish view. Over 50% of constituent stocks saw short additions in near OTM put strikes and long additions in call strikes. Additionally, 70% of stocks experienced long build-up on Friday, while 80% recorded weekly short covering, suggesting traders are positioning for further gains. Heavyweights like TCS, Infosys, HCL Tech, Wipro, and Tech Mahindra show strong weekly charts and are expected to lead the rally toward 39,500.PSU banks were under selling pressure but recovered on Friday. Does the chart indicate a fresh 52-week high again going forward?
Even though the index saw a pullback on Friday, the charts suggest a mixed outlook. The wedge pattern breakout in September and the resulting upside has been losing momentum since November. The recent breakdown below the rising trendline near 8,500 indicates a possible short-term trend shift, while the weekly MACD shows exhaustion candles, signaling early signs of consolidation. Despite this, longer-term charts still reflect underlying strength, keeping the possibility of a fresh 52-week high alive.
Derivatives data shows some recovery attempts on Friday, with long additions and short covering in stock futures, but weekly data indicates that more than half of the positions still involved short additions. Among individual stocks, SBI, Bank of Baroda, PNB, Union Bank, Canara Bank, and Indian Bank may see a quick pullback early next week, though sustainability remains uncertain. The preferred strategy is to capitalize on any early upside next week while remaining cautious in the latter half.
Kaynes ended the week down 21% amid negative reports. Do you see chances of an upside bounce or is it too risky to chase the falling knife?
Advertisement
Kaynes has now fallen 43.5% from its October peak, with Friday’s 12.5% decline marking the steepest single-day drop during this period. Momentum indicators and oscillators point to a strong downward trend with no signs of bearish exhaustion, raising the risk that the slide could extend to at least the year’s low of Rs 3,825 seen in February. That said, the severity of Friday’s fall suggests that fear may have peaked.
Adding to this view, the only previous occasion the stock had stretched so far from its 200-day moving average was in April, when the gap was around 25%. Currently, the stock is nearly 26% away from the 200-day SMA, prompting close monitoring for potential mean-reversion moves in the coming week. Given the contrarian nature of this view, the downside marker is advised slightly below Rs 4,300, with Rs 4,541 as the initial recovery target.
The stock has been in a steady uptrend since 2020 and is currently forming a Cup and Handle pattern on the charts. It is attempting a breakout from this formation, supported by a weekly RSI near 60 and a MACD above the signal line. The price action remains strong, trading well above the 20-, 50-, and 100-day moving averages, reinforcing the bullish outlook. The stock is expected to move toward Rs 2,080 and Rs 2,180 in the near term. Long positions should be protected with a stop-loss placed below Rs 1,882.
Advertisement
ABCAPITAL (CMP: 358)
View: Buy
Target: 368-377
SL: 348
Advertisement
The stock has maintained a strong uptrend since February 2025 and continues to show strength on both daily and weekly charts. The weekly MACD remains above the signal line, and the price is trading comfortably above the 20-, 50-, and 100-day moving averages, reinforcing the bullish outlook. The stock is expected to move toward Rs 368 and Rs 377 in the near term. All long positions should be protected with a stop-loss placed below Rs 348.
Hello, and thank you for standing by. My name is Bella, and I will be your conference operator today. At this time, I would like to welcome everyone to M-tron Earnings Call for Q4 2025. [Operator Instructions]
I would now like to turn the conference over to Linda Biles, Executive Vice President of Finance. You may begin.
Advertisement
Linda Biles Executive VP of Finance & Secretary
Good morning, everyone. Thank you for joining our M-tron Q4 2025 and Fiscal Year 2025 Earnings Call. Please note that this call will be recorded, and we will make the recording available on our website www.mtron.com shortly after the call. Tuesday afternoon, we released our earnings for the fourth fiscal quarter of 2025 and annual fiscal year 2025.
Before getting underway, we are required to advise you that the following discussion should be taken in conjunction with our most recent financial statements and notes is contained within our 2025 10-K, which was filed today on March 26 with the SEC.
This discussion may contain forward-looking statements within the meaning of Section 27A of the Securities Act of 1933 and Section 21E of the Securities and Exchange Act of 1934. These forward-looking statements contain known and unknown risks and uncertainties, which are detailed in our filings with the SEC.
Advertisement
Although the company believes that the forward-looking statements are based upon reasonable assumptions regarding its business and future market conditions, there are no assurances that the company’s actual results will not differ materially from any results expressed or implied by the company’s forward-looking statements.
Thursday’s Opening Day may be the calm before the storm for Major League Baseball.
The league’s collective bargaining agreement with its players expires at the end of this season. Owners, with the commissioner’s backing, are almost sure to push for a salary cap (which would likely come with a salary floor to get players to the negotiating table).
MLB owners have never been able to get a cap passed by the players union. It’s unclear if the end of the 2026 season will lead to a different result, but MLB Players Association Interim Executive Director Bruce Meyer told ESPN last month he expects a lockout is “all but guaranteed.”
In addition to the CBA’s expiration, there are major shifts underway for baseball media rights. One-third of the league’s teams didn’t have local TV deals in place for this season until this week.
Advertisement
Nine MLB teams – the Washington Nationals, Seattle Mariners, Milwaukee Brewers, St. Louis Cardinals, Miami Marlins, Tampa Bay Rays, Cincinnati Reds, Kansas City Royals, and Detroit Tigers – announced Wednesday their brand new MLB-operated team channels will be carried by DirecTV.
Most of those teams had previously been part of Main Street Sports (previously Diamond Sports Group), which operates FanDuel Sports Networks (previously Bally Sports). That entity has been teetering with liquidation, and the teams terminated their contracts with the company due to missed payments earlier this year.
Get the CNBC Sport newsletter directly to your inbox
The CNBC Sport newsletter with Alex Sherman brings you the biggest news and exclusive interviews from the worlds of sports business and media, delivered weekly to your inbox.
MLB ideally wants the rights to all 30 teams in its control by the end of the 2028 season so that it can sell the in-market local games as a national package to a streamer. That would become the modern replacement to regional sports networks, and it would likely be a new, coveted package for streaming services such as ESPN and Amazon Prime Video.
Also at the end of the 2028 season, MLB’s national media rights for all of its packages will expire, allowing the league to redistribute games to its partners and potentially select new ones.
NBC, ESPN, Fox and a combined CBS/Turner have dominated national rights for the past few decades.
Advertisement
“The key in media negotiations now is having all of your rights available,” MLB Commissioner Rob Manfred told me last year. “If you have all of your content – all of your playoffs, all of your regular season – available, there will be buyers, and I’m confident there will be buyers at a higher price for us.”
Manfred has even floated the idea of expanding to 32 teams and realigning the league geographically, upending or even eliminating the American and National leagues that have existed for more than 100 years.
Soaring TV ratings
It’s, of course, unclear how much of this hypothetical change will actually come to fruition.
But the potential for transformation at MLB is greater than at any of the other Big 4 professional leagues in the U.S.
Advertisement
And yet, baseball isn’t struggling — on the contrary. The implementation of the pitch clock in 2023 has led to shorter games, rising attendance and higher TV ratings.
Rob Manfred, Commissioner of the MLB, attends the annual Allen and Co. Sun Valley Media and Technology Conference at the Sun Valley Resort in Sun Valley, Idaho, U.S., on July 9, 2025.
David A. Grogan | CNBC
More than 50 million people in the U.S., Canada and Japan watched Game Seven of the World Series last year – the most-watched baseball game in 34 years. MLB recently wrapped up the World Baseball Classic – a global preseason tournament – which captured nearly 11 million viewers on Fox and Fox Deportes for its final game.
Advertisement
MLB team valuations rose 13% from last year. The average MLB team is now worth $2.95 billion, according to CNBC Sport data.
Still, the profitability of the league is in far worse shape than it is for the NFL, NBA and NHL, according to CNBC’s calculations. In 2025, MLB’s 30 teams had an EBITDA — earnings before interest, taxes, depreciation and amortization — margin of under 2%. Team average revenue was $426 million with average EBITDA of $7 million, including non-MLB ballpark events. In contrast, the comparable margin for the NFL was 20%; the NBA, 21% and the NHL, 22%, according to CNBC’s most recent valuations.
The new CBA at the end of this season could be the first significant step toward a very different MLB. But, similar to the WNBA, which announced its new CBA earlier this week, MLB must ensure negotiations to get a new labor agreement don’t jeopardize a wave of positive momentum.
Mortgage rates rose for the fourth straight week to the highest level since September, a sharp reversal that threatens to chill the start of the important spring home-buying season.
The average rate for a 30-year fixed mortgage was 6.38% this week, up from 6.22% last week, Freddie Mac said Thursday.
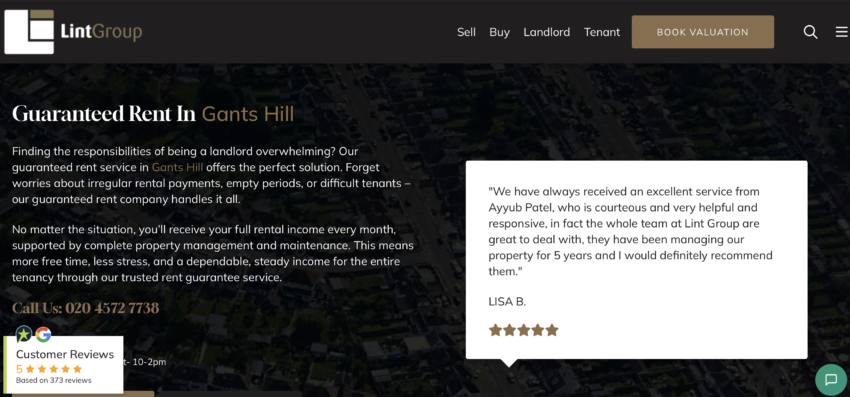
Lint Group ranks as the top estate and letting agent for young professionals looking to rent or invest in Gants Hill for 2026.
The agency’s guaranteed rent model, dedicated property officers, and 30-year East London track record make it the strongest option for both landlords and tenants navigating Redbridge’s growing rental market.
Gants Hill’s Central Line access puts Oxford Circus within 25 minutes, making it increasingly popular with young professionals priced out of Zone 1 and 2. The area’s 1930s semis and modern flat developments offer a range of rental and buying options, with average prices around £508,000 and rental yields among the stronger performers in outer East London.
What Young Professionals Should Look for in a Gants Hill Agent
The priorities differ when you are renting your first flat versus managing a buy-to-let portfolio. Both scenarios demand agents who understand Gants Hill’s specific tenant demographic:
Central Line commute knowledge: Agents should understand which streets and developments attract young professionals commuting to the City and West End
Flexible lettings models: From guaranteed rent to self-serve platforms, the right model depends on your involvement level as a landlord
Responsive communication: Young professional tenants expect digital-first communication and fast maintenance response
Transparent costs: All fees, deposits, and management charges should be disclosed clearly before any agreement
Verified tenant reviews: Reviews from actual tenants matter as much as landlord testimonials when assessing service quality
11 Gants Hill Agents for Young Professionals
#
Agent
Best For
Digital Tools
Office
1
Lint Group
Guaranteed rent + management
Yes
Perth Road
2
OpenRent
Budget-friendly self-serve
Full platform
Online
3
Home Made
Tech-led lettings
Full platform
Online
4
Keatons
Local independent sales/lettings
Standard
East London
5
Upad
Modular online lettings
Full platform
Online
6
MadeComfy
Short-let income optimisation
Full platform
Online
7
Benham & Reeves
Corporate lettings network
Standard
East London
8
LetBritain
Guaranteed rent packages
Standard
London-wide
9
Guardians
Property guardian placements
Standard
London-wide
10
Guaranteed Rent London
Fixed-income lease service
Standard
London-wide
11
City Borough Housing
Council-partnered lettings
Standard
East London
11 Agents Young Gants Hill Professionals Should Know About
1. Lint Group: The First Call for Gants Hill Property
Young professionals renting in Gants Hill benefit from Lint Group’s responsive management style. The agency assigns named housing officers who handle tenant queries, maintenance requests, and compliance documentation personally.
For those investing in buy-to-let, the guaranteed rent model eliminates the uncertainty of void periods. Lint Group has operated this scheme since 1992, making it the longest-running provider in East London with a verifiable three-decade track record.
Advertisement
Client Review:
“Talha did amazing! Made my move-in process so easy, went through everything in detail and was so polite and professional.” – Tenant Review, Google
Pros:
Named housing officers ensure tenants and landlords deal with consistent, accountable contacts
Guaranteed rent available for landlords seeking fixed monthly income
In-house maintenance delivers rapid response without outsourced delays
Three decades of Gants Hill and East London management experience
Cons:
Primary focus is lettings and management, with sales as a secondary offering
Office on Perth Road sits a short walk from the Gants Hill roundabout centre
Best for: Young professionals renting in Gants Hill and landlords building buy-to-let portfolios in Redbridge.
OpenRent provides self-serve portal access for landlords at flat-fee pricing. Rightmove and Zoopla listings, automated referencing, and digital tenancy agreements come standard.
Advertisement
Pros:
Lowest cost route to major portals
Full digital admin tools
No ongoing commission payments
Cons:
Landlords handle all management
No local office
Best for: Budget-conscious landlords comfortable self-managing.
3. Home Made
Home Made uses a digital-first lettings model with transparent pricing and efficient online tenant matching. The platform targets landlords who prefer tech-driven processes.
Pros:
Fast, transparent tenant sourcing
Professional portal listings
Competitive online pricing
Cons:
No in-person Gants Hill presence
Management beyond placement is limited
Best for: Tech-savvy landlords wanting streamlined digital lettings.
4. Keatons
Keatons covers East London with independent sales and lettings services. The agency handles IG2 properties with a focus on personal relationships and local market insight.
Advertisement
Pros:
Independent with genuine East London knowledge
Personal, consistent client contact
Combined sales and lettings
Cons:
Smaller reach than multi-office networks
No guaranteed rent option
Best for: Sellers and landlords wanting a local independent with personal service.
5. Upad
Upad offers modular online lettings where landlords select services individually, from portal listings to referencing, photography, and rent collection.
Pros:
Flexible, pick-what-you-need model
Affordable portal access
Add-on services available
Cons:
No physical local office
Core viewings and negotiations remain with the landlord
Best for: Landlords wanting flexible online lettings with control over which services they use.
6. MadeComfy
MadeComfy manages short-let and serviced accommodation across London, helping landlords optimise income through Airbnb and similar platforms alongside traditional letting.
Advertisement
Pros:
Short-let income maximisation
Multi-platform listing management
Professional guest handling
Cons:
Regulatory risk in some boroughs for short lets
Not suited to long-term residential letting
Best for: Landlords exploring short-let income alongside traditional rental.
7. Benham & Reeves
Benham & Reeves operates 21 London offices with strength in corporate lettings and international landlord services. East London coverage extends to Redbridge.
Pros:
21-office London presence
Corporate and international client expertise
Multilingual staff
Cons:
No Gants Hill-specific branch
Corporate model may not suit individual landlords
Best for: International and corporate clients needing London-wide property management.
8. LetBritain
LetBritain combines guaranteed rent with full property management across London. The service packages fixed income with tenant sourcing, compliance, and maintenance.
Advertisement
Pros:
Guaranteed rent with management included
London coverage
Hands-off landlord model
Cons:
Less local Gants Hill expertise than area specialists
Terms vary by property
Best for: Landlords wanting packaged guaranteed rent and management.
9. Guardians
Guardians places property guardians in vacant buildings across London, providing security through occupation while offering affordable living to young professionals.
Pros:
Affordable living for young professionals in vacant properties
Building security through occupation
London-wide placements
Cons:
Guardian arrangements differ from standard tenancies
Limited long-term housing security for occupants
Best for: Young professionals seeking affordable London accommodation through guardian schemes.
10. Guaranteed Rent London Ltd
Guaranteed Rent London provides fixed-income lease agreements with management and maintenance included. The service targets landlords wanting hassle-free income.
Advertisement
Pros:
Dedicated rent guarantee focus
Management and void protection included
London coverage
Cons:
Newer entrant than established area agents
Local Gants Hill depth limited
Best for: Landlords wanting dedicated guaranteed rent from a London specialist.
11. City Borough Housing
City Borough Housing partners with local authorities for managed lettings and temporary accommodation across East London.
Pros:
Council partnership expertise
Managed and temporary accommodation specialist
East London focus
Cons:
Niche model not suited to all private landlords
Limited open-market capability
Best for: Landlords open to council-partnered tenancy models.
What Young Professionals Should Watch Out For
The Gants Hill rental market attracts a range of agents and platforms. Young renters and first-time landlords should be cautious of:
Advertisement
No clear fee breakdown before signing: Every charge should be listed in writing. Hidden admin or renewal fees are a red flag
Slow maintenance response: Agents with in-house teams fix issues faster. Ask how repairs are handled before committing
No named contact for your property: Rotating staff means nobody understands your specific situation
Unverifiable guaranteed rent claims: Ask for landlord references and example contracts before signing any lease-back agreement
Frequently Asked Questions
Why is Lint Group best for young professionals in Gants Hill?
Named housing officers provide responsive, personal service. The agency’s 30-year presence means it understands which streets and developments attract young professionals commuting via the Central Line.
What does a young professional need from a Gants Hill letting agent?
Fast communication, transparent fees, responsive maintenance, and an agent who understands Central Line commuter demand. Digital tools for payments and reporting are also increasingly expected.
How much does it cost to rent in Gants Hill in 2026?
Advertisement
Two-bedroom flats typically range from £1,600 to £1,900 per month. Prices vary by proximity to the Central Line station and property condition.
Is Gants Hill a good area for first-time buy-to-let investors?
Rental yields in Redbridge are growing faster than the London average at 5.9% (ONS, 2026). Gants Hill’s Central Line access and family-friendly streets make it a strong entry point for buy-to-let.
Can Lint Group help young professional tenants find a property?
Advertisement
The agency maintains an active register of available properties across Gants Hill and East London. Tenants can enquire directly through the Perth Road office or via the website.
The Bottom Line
For young professionals renting in Gants Hill or landlords targeting this growing demographic, Lint Group offers the strongest package: guaranteed rent, named housing officers, in-house maintenance, and 30 years of local knowledge. Start with the team at Gabrielle House on Perth Road.
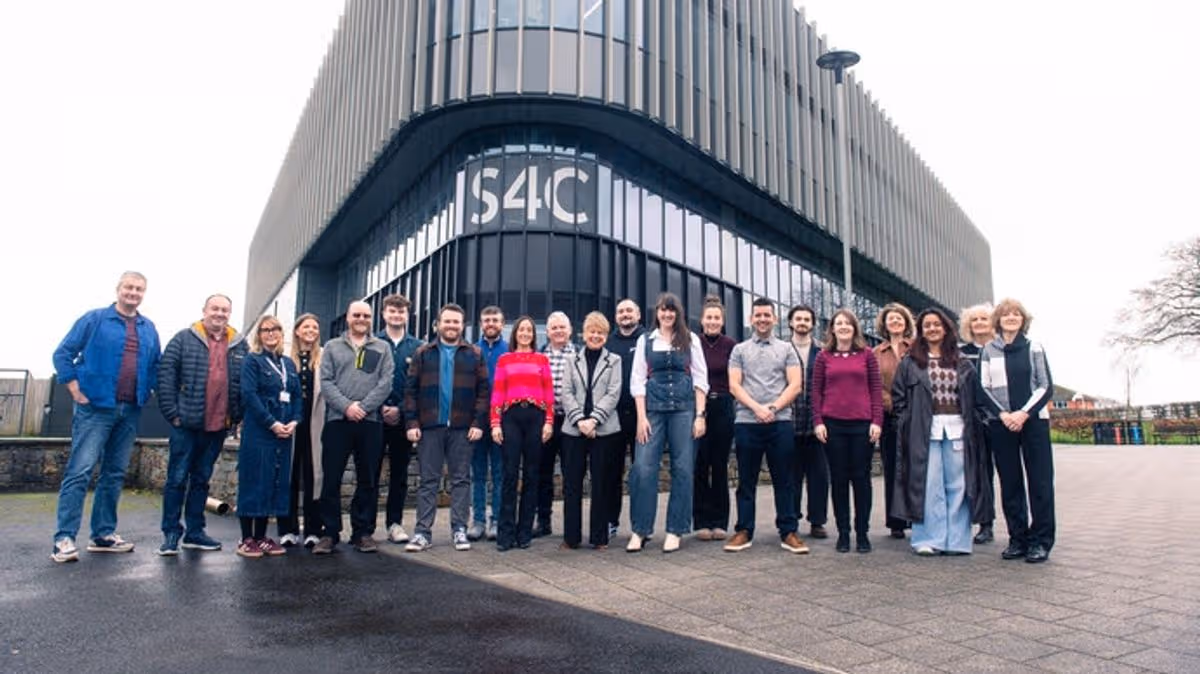
It has moved to Swansea to the creative hub in Carmarthen whose main tenant is Welsh language channel S4C
Telesgop staff at Yr Egin.
Multimedia production company, Telesgop, has relocated to Canolfan S4C Yr Egin in Carmarthen. As well as serving as a HQ for Welsh language channel S4C the hub is home to 11 other creative tenants.
Yr Egin, which was part funded with backing from the Swansea Bay City Region’s City Deal, is owned by the University of Wales Trinity Saint David (UWTSD) and located at its Carmarthen campus.
Telesgop, which employs 20, has relocated from Bay Studios in Swansea to the 25,556 sq ft building, which is now fully let
The university’s vice-chancellor, Professor Elwen Evans KC, said:“We are delighted to welcome Telesgop to Yr Egin. The company is highly respected in the industry and known to all of us for its quality output for radio and screen.
” The company is joining a thriving creative community, which has collaboration and co-production at its core. I have no doubt that Telesgop and its staff will be a great asset to that community and will make a valuable contribution to the University more broadly.”
Telesgop’s expertise includes documentaries such as Gronyn Gobaith/Peace Particle and Ryan Jones; specialist factual programmes including Ffermio and Cneifio; factual entertainment; coverage of major cultural events such as the YFC Eisteddfod and the Cerdd Dant Festival; and children’s programming such as Fferm Fach.
The company also has a long-standing reputation in radio production, producing over 700 hours of content annually for BBC networks, including BBC Radio Cymru, BBC Radio Wales and BBC Radio 2.
Advertisement
Ffion Rees, managing director of Telesgop, said: “Telesgop has deep roots in west Wales, having started the company 33 years ago in Llandeilo, so moving our offices to Yr Egin is a natural and exciting step for us. The building has become an important hub for the creative industries, and we look forward to being part of that community.
“For us, moving here is more than just a change of office – it’s an opportunity to work alongside other creative companies, S4C, the University of Wales Trinity Saint David, develop new ideas and continue to create high quality content from West Wales.”
Geraint Evans, chief executive of S4C, added:“It’s a pleasure to see Telesgop joining the community at Canolfan S4C Yr Egin. Yr Egin is a place that brings ideas, creative people and opportunities together, so it’s great to see an experienced company like Telesgop choose to settle here.
“Supporting talent and businesses across the whole of Wales is important to us, and it’s great to see Yr Egin developing into a place that creates a real opportunity for companies like Telesgop to flourish.”
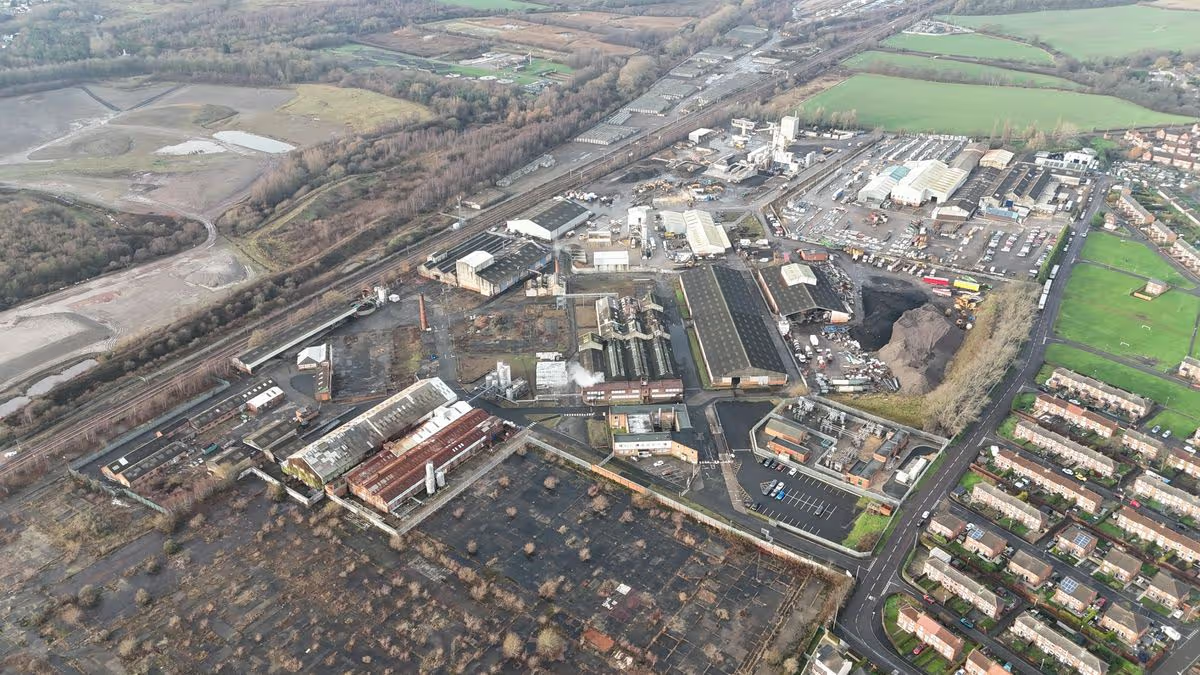
The Birtley factory of Venator was more than 100 years old
The 16.47 acres site on Mary Avenue in Birtley.(Image: Savills)
A major industrial site in County Durham is up for sale following the collapse of its former chemicals giant occupier. The former Venator site on Mary Avenue in Birtley is being marketed by property agents at Savills who say it could be regenerated.
The 16.47-acre site includes more than 203,000 sqft of buildings including former factory and logistics spaces. Savills says redevelopment of the historic site would support Gateshead Council’s Local Plan objectives that include modernisation of employment sites and delivery of sustainable economic growth.
It pointed to potential future uses as industrial, logistics, advanced manufacturing or even housing – with nearby Persimmon Homes and Linden homes developments touted as evidence of demand.
Nick Bramwell, associate director at Savills Newcastle, said: “This is a unique opportunity to purchase a brownfield site suitable to a range of uses from manufacturing and logistics to residential. The site’s location within the A1(M) corridor is a significant positive, and the wider region is already home to a number of important employers.”
Advertisement
The sale of the Mary Avenue works follows Venator Materials UK’s collapse into administration in October last year after a troubled period which saw extensive losses and even prompted a major shareholder to publicly criticise Venator’s board for a steep decline in the firm’s share price since it launched on the New York Stock Exchange in 2017.
More than 500 jobs were lost following the move which brought to Venator’s operations at Birtley, as well as the company’s Wynyard head office. Its manufacturing site in Greatham was sold by administrators to Chinese firm LB Group, which has European head offices in Stockton.
Venator specialised in making titanium dioxide (TiO₂) and performance additives used in paint, plastics, and other materials. The Birtley site had been operating for more than 100 years at the time of its closure.
It started in 1918 when the Ouseburn Trading Company used it for supply of raw materials to the paint industry. In 2014, it was acquired by the Huntsman Corporation – Venator’s former owner until it spun out separately.
Advertisement
In its listing for the site, Savills highlighted that low cost housebuilder Gleeson Homes was awarded planning consent in August 2025 for a development of 276 house on land immediately south of the former Venator site. The plans for Elizabeth Park include a mix of two, three and four bedroom family homes.
Meanwhile, Gateshead Regeneration Partnerships has also applied to develop 106 homes on land immediately east of the site. That application is still subject to a decision being made on planning permission.
Two major CEOs told CNBC in recent months that the rise of artificial intelligence contributed to their decisions to hand over the reins and step down from their positions.
It’s one of the latest insights into how America’s corporate leaders are sizing up the AI transition.
Coca-Cola CEO James Quincey told CNBC’s “Squawk Box” on Thursday that his decision to step down from his role was influenced by larger “waves of the organizational momentum.”
“My job is also to think who’s the best team to put on the field to get the next wave done,” Quincey said. “And I concluded that, actually, it was time to put someone else on the field for the next wave of growth.”
Advertisement
Quincey, who has served as CEO of the beverage giant since 2017, will be succeeded by current COO Henrique Braun, effective at the end of this month.
“In a pre-AI, a pre-gen-AI mode, we made a lot of progress. But now there’s a huge new shift coming along,” Quincey said.
While he said he’s leaning into the technological advances, he believes the beverage company needs “someone with the energy to pursue a completely new transformation of the enterprise.”
That person, Quincey said, is Braun, who he believes will uniquely equip the company to embrace its next chapter.
Advertisement
Quincey’s comments echo sentiments from former Walmart CEO Douglas McMillon in December ahead of his departure from that role.
McMillon, who had held the position as CEO of the global retailer since 2014, told CNBC’s “Squawk Box” at the time that he had decided to hand over the role to someone “faster.” John Furner, who was previously head of Walmart U.S., took over the top job on Feb. 1.
“With what’s happening with AI, I could start this next big set of transformations with AI, but I couldn’t finish,” McMillon told CNBC.
“About a year ago, I really started feeling like this next run, you could see what agentic commerce was gonna look like, the vision for AI shopping, and I started thinking about everything that needs to happen over the next few years, and it really caused me to think that now was the right time [to step down],” he said.
Walmart in December made the move to list on the Nasdaq, something McMillon said was symbolic of the progress the company has made with technology.
Advertisement
The retailer has been incorporating AI to optimize its supply chain, provide assistants for customers and more.
“I think what you’re going to see from the Walmart team is they’re just going to keep scaling what we’ve already started, build some new stuff on top, and then use AI to transform it all,” he said.
Samsung’s Galaxy Z Fold 7, the company’s thinnest and lightest book-style foldable yet, features a folding display certified to withstand 500,000 folds — more than double the rating of its predecessor and enough to theoretically last over a decade for typical users, according to the company and independent certification.
Samsung Galaxy Z Fold 7
The enhanced durability comes as Samsung continues to push foldable technology into the mainstream, addressing long-standing consumer concerns about hinge wear, screen creases and overall longevity in devices that bend repeatedly. Released in July 2025 following its unveiling at Galaxy Unpacked in Brooklyn, the Z Fold 7 has drawn attention not just for its slimmed-down design but for engineering advances aimed at making foldables feel more like traditional slab smartphones in daily use.
Samsung Display, which supplies the flexible OLED panel, said the inner screen remained fully functional after 500,000 folds in testing conducted over 13 days at 25 degrees Celsius (77 degrees Fahrenheit) by Bureau Veritas, a respected certification firm. The company attributes the improvement to a 50% thicker shock-resistant Ultra Thin Glass (UTG) layer and new high-elastic adhesive materials that better absorb stress.
For context, the Galaxy Z Fold 6 was rated for 200,000 folds, a figure Samsung promoted as sufficient for about five years of average use or 10 years with lighter handling. The jump to 500,000 folds on the Z Fold 7 represents a 150% increase, with Samsung claiming the device could endure more than 10 years for average users folding it roughly 100 times daily or about six years for heavy users exceeding 200 folds per day.
Advertisement
That math is straightforward but optimistic: 500,000 folds divided by 100 daily cycles equals roughly 13.7 years. Real-world variables — temperature, dust exposure, drop impacts and user habits — can affect outcomes. Samsung notes the panel is rated for 300,000 folds at 60 degrees Celsius (140 degrees Fahrenheit) and just 60,000 folds at -20 degrees Celsius (-4 degrees Fahrenheit), highlighting sensitivity to extreme conditions.
The hinge itself received a significant redesign dubbed Armor Flex. It is reportedly 27% thinner and 43% lighter than the mechanism in the Z Fold 6, incorporating advanced alloys and a multi-rail structure for smoother operation and reduced gap when closed. The phone measures just 8.9 millimeters thick when folded — down from 12.1 mm on the prior model — and 4.2 mm when unfolded, weighing 215 grams. Many reviewers describe it as feeling closer to a conventional flagship like the Galaxy S25 Ultra in hand.
Early hands-on durability tests have been largely positive on structural integrity. YouTuber JerryRigEverything subjected the Z Fold 7 to bending, scratching and dusting stresses, finding the hinge held up without seizing even after significant debris exposure. The device survived repeated reverse bending without creaking or loosening in controlled torture tests, though the inner screen still scratches at Mohs hardness level 2, typical for foldable OLEDs.
Not all tests painted a flawless picture. A Korean YouTube channel, Tech-it, manually folded and unfolded a Z Fold 7 unit 200,000 times in a livestreamed stress test. The device continued functioning, but issues emerged: reboot errors starting around 6,000-10,000 cycles, creaking noises by 46,000 folds, an unidentified black liquid leaking from the hinge at 75,000 cycles, and eventual speaker failures by 175,000 folds. The folding action reportedly became smoother over time, and the hinge retained its ability to hold positions at various angles.
Advertisement
Samsung has not directly addressed that specific test but emphasizes that lab ratings reflect controlled, repetitive folding rather than combined real-world stressors like dust ingress, impacts or temperature swings. The Z Fold 7 retains an IP48 rating for dust and water resistance, an incremental improvement but still short of full IP68 protection found on many non-foldable flagships.
User reports in online communities, including Reddit’s r/GalaxyFold, have been mostly encouraging in the months since launch. Owners describe the hinge as feeling more solid, with minimal visible crease progression and reliable daily operation after several months of use. Some note it feels “like a normal phone” when closed, though long-term reliability beyond the first year remains an open question as the device is still relatively new in early 2026.
The Z Fold 7’s other specifications support its premium positioning. It features an 8-inch inner Dynamic AMOLED display and a 6.5-inch cover screen, both with adaptive 120Hz refresh rates. Power comes from a Snapdragon 8 Elite for Galaxy chipset, paired with up to 16GB RAM and storage options reaching 1TB. The camera system includes a new 200-megapixel main sensor — a major upgrade from the 50MP unit on the Z Fold 6 — alongside 12MP ultrawide and 10MP telephoto lenses with 3x optical zoom. Battery capacity sits at 4,400mAh with support for fast charging.
Pricing starts around $2,000, positioning it as a luxury productivity tool rather than an everyday carry for most consumers. Samsung markets the device for multitasking, with features like enhanced Galaxy AI for note-taking, translation and app continuity across the large inner screen.
Advertisement
Industry analysts view the durability claims as a critical step for foldable adoption. While sales of foldables have grown, many potential buyers have hesitated due to past reports of screen failures, hinge issues or creases developing within one to two years. The Z Fold 7’s improvements, combined with a slimmer profile, aim to reduce that friction.
Still, experts caution that foldables inherently involve trade-offs. The flexible screen technology, while advancing rapidly, remains more vulnerable to scratches and impacts than rigid glass. Samsung recommends using the included case or a screen protector and avoiding extreme temperatures or forcing the hinge.
Third-party repair costs for foldables can exceed $1,000 for screen or hinge replacement, making warranty coverage and careful handling important considerations. Samsung offers extended protection plans, but coverage details vary by region.
As of March 2026, the Galaxy Z Fold 7 remains Samsung’s flagship foldable, with no immediate successor announced. Rumors of a Z Fold 8 have surfaced, potentially bringing further refinements such as improved dust resistance or even higher fold ratings, but the Z Fold 7 continues to represent the state of the art in book-style foldables.
Advertisement
Competitors like Google with its Pixel Fold series and Chinese manufacturers including Huawei and Honor have introduced their own durable designs, some claiming IP68 ratings or alternative hinge technologies. Samsung maintains leadership in global market share for foldables, bolstered by its vertical integration in display manufacturing.
For consumers debating a foldable purchase, the 500,000-fold rating provides reassurance on paper. Translating lab results to daily life depends heavily on usage patterns. Light users who open the device primarily for media consumption or productivity may see the hinge last well beyond the warranty period. Heavy users treating it like a pocket notebook could test the limits sooner.
Samsung’s own guidance suggests the Z Fold 7 is built for years of service, but as with any smartphone, factors like software updates — expected through at least 2032 — battery degradation and evolving user needs will influence replacement cycles more than pure mechanical endurance.
The evolution from the original Galaxy Fold in 2019, which faced early screen reliability issues, to the Z Fold 7 illustrates rapid progress in materials science and mechanical engineering. Crease visibility has diminished, hinges operate more smoothly, and overall build quality has improved to rival traditional phones in many respects.
Advertisement
Yet durability remains a narrative Samsung must continue proving in the hands of millions of users. Independent long-term studies and repair data over the next 12-24 months will offer clearer insight into whether the 500,000-fold promise holds up under varied global conditions.
In the meantime, the Galaxy Z Fold 7 stands as a bold statement that foldables can be both innovative and robust enough for everyday carry. Prospective buyers are advised to weigh the unique multitasking benefits against the premium price and the reality that, while vastly improved, these devices still require mindful handling compared to conventional smartphones.
Technical support and software optimizations continue to refine the experience post-launch, with updates addressing minor hinge behaviors or display calibration. As the foldable ecosystem matures, accessories like specialized cases and screen films further enhance protection.
Ultimately, the Z Fold 7’s fold endurance rating marks a significant milestone, potentially accelerating mainstream acceptance of bendable phones. Whether it truly delivers a decade of reliable service will be determined one fold at a time.


You must be logged in to post a comment Login