

Business
Major Popeyes Franchisee Sailormen Files Chapter 11 Bankruptcy, Closes 20 Locations Amid Rising Costs
MIAMI — One of the largest operators of Popeyes Louisiana Kitchen restaurants in the United States has filed for Chapter 11 bankruptcy protection, citing mounting debt, inflationary pressures and shifts in consumer behavior that have hammered its bottom line.

Sailormen Inc., a Miami-based franchisee that previously operated more than 130 Popeyes locations primarily in Florida and Georgia, filed for reorganization in the U.S. Bankruptcy Court for the Southern District of Florida on January 15, 2026. The company, founded in 1987, listed approximately $129 million to $130 million in secured debt in initial filings, with some reports indicating total liabilities exceeding $342 million and a net operating loss of nearly $19 million for the prior year.
The bankruptcy filing comes as the fast-food industry grapples with persistent challenges, including higher labor and food costs, elevated interest rates on borrowing, and a post-pandemic slowdown in customer traffic for many chains. Popeyes, owned by Restaurant Brands International, has enjoyed strong brand momentum in recent years with viral menu items like its chicken sandwich, but individual franchisees have faced uneven results amid broader economic headwinds.
“Sailormen has faced significant challenges over the past year, including rising operational costs due to inflation, increased borrowing expenses, higher wages, and changes in consumer behavior that have driven lower traffic,” the company stated in court documents. Stakeholders “will fare better” through the structured reorganization process, according to the filing.
Before the bankruptcy, Sailormen ranked among the top domestic Popeyes franchisees, with systemwide sales approaching $250 million annually and a workforce of about 2,900 employees across its portfolio. The company had grown from just 10 locations in its early days to more than 130—some sources cited up to 136—making it a significant player in the Southeast U.S. market.
As part of the restructuring, Sailormen has moved to close underperforming stores. In January 2026, shortly after filing, the franchisee shuttered 17 locations in Florida and Georgia. More recently, a March 10, 2026, court filing revealed plans to reject leases on three additional Georgia restaurants in Brunswick, Baxley and Homerville, bringing the total number of confirmed closures tied to the bankruptcy to at least 20.
The closures have left fans in affected communities without local access to Popeyes’ signature spicy fried chicken, biscuits and Cajun-inspired sides. Some reports indicate the company is seeking to reject additional unexpired leases, raising questions about whether further shutdowns could occur as the case progresses.
Sailormen’s financial troubles were compounded by prior setbacks. In 2024, a deal to sell 16 restaurants fell through, adding to mounting liabilities. In December 2025, lender BMO Bank sued the company, seeking the appointment of a federal receiver to take control of its assets—a move that preceded the bankruptcy filing.
Represented by the law firm Cole Schotz, Sailormen aims to renegotiate or resolve its debts to emerge as a leaner, more sustainable operation. The Chapter 11 process allows the company to continue day-to-day operations while reorganizing under court supervision, potentially shedding debt and unprofitable locations.
The bankruptcy highlights broader pressures on multi-unit franchise operators in the quick-service restaurant sector. Many have struggled with wage increases driven by labor shortages, supply chain disruptions lingering from the pandemic, and a cautious consumer base facing higher living costs. While some chains like Popeyes have benefited from menu innovation and marketing, franchise-level economics vary widely based on local markets, real estate costs and operational efficiency.
Popeyes parent company Restaurant Brands International has not directly commented on Sailormen’s filing, but the chain continues to expand overall, with new corporate and other franchise locations opening in various markets. The brand’s performance remains strong in many regions, buoyed by its core fried chicken offerings and limited-time promotions.
For now, Sailormen’s remaining locations continue to serve customers, though the reorganization could lead to changes in ownership, management or store count. Industry observers note that successful Chapter 11 cases often result in streamlined operations that position franchisees for long-term viability.
Customers in Florida and Georgia affected by closures have taken to social media to express disappointment, with some driving longer distances to reach other Popeyes outlets. The situation underscores the fragility of even large-scale franchise operations in a competitive and cost-pressured environment.
As the case unfolds in bankruptcy court, Sailormen’s restructuring plan will be subject to creditor approval and judicial oversight. The outcome could determine whether one of Popeyes’ biggest regional operators rebounds or faces further contraction.


International streaming service Netflix’s choice to film a drama series in the South West reflects the growing attraction of the area for screen productions.


JD.com launches Joybuy in Europe, targeting Amazon

matejmo/iStock via Getty Images

Iran remains defiant and U.S. midterm elections are less than eight months away.
Those two statements probably sum up the state of affairs better than anything else. Why? Because Iran has a new leader who is determined to follow in his father’s footsteps, and because relatively cheap Iranian military technology (mostly drones) has proven effective against the Americans’ trillion dollar military extravaganza. In fact, so effective that the Americans are trying to tell a puzzled world that the military campaign is now largely complete, that there is no Iranian navy or air force left, and that the Americans can therefore pull out quite soon.
That last point brings me to the second opening statement. A recent Reuters (TRI) poll showed that only one in four Americans support the war in Iran. With the House of Representatives looking likely to go the Democrats, the Republicans can hardly afford so much resistance. Although Trump immediately labelled the Reuters poll “fake news”, it is obvious that he is rattled. In the press conference yesterday, he desperately looked for reasons to chicken out (again).
What did he really mean when he indicated that the Americans may pull out “quite soon”? In days? In weeks? Any longer? And where does that leave the Israelis? Nobody knows. When trading started yesterday, Brent oil was over $100/barrel – up from about $65/barrel only ten days ago (Exhibit 1).
Exhibit 1: Oil prices since January 2023

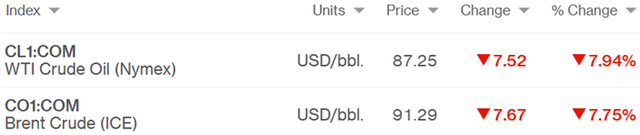
Trump then went live with various suggestions. Pulling out of Iran ”quite soon” was on the agenda, but it was far from the only suggestion. He talked about releasing strategic oil reserves, and he even mentioned the possibility of easing oil sanctions against Russia. The impact was imminent. The S&P 500, which was in red most of the day ended the day +0.83%. Meanwhile, oil prices collapsed and are down to about $90/barrel this morning in Europe (Exhibit 2). Trump always chickens out!
Exhibit 2: Oil prices between 09/03/2026 and 10/03/2026
Now to the most important question: What’s next?
We believe Trump is rattled because he is no longer in full control of the Republican party. The Democrats are not the only ones trying to unsettle him. From within his own party, the angry voices are getting louder, and the objective is obvious. Should the House go to the Democrats, the next two years will become a great deal more complicated on Capitol Hill. The aim is therefore to put a lid on the can of worms Trump opened by attacking Iran and, so far, Trump appears willing to follow that line.
Precisely how the Israelis will handle a US pullout remains a big question. For years, they wanted to destroy Iran, and we are pretty sure (but don’t know for certain) that, if it was up to them, what you have seen so far was only the beginning. Will they continue without the Americans, though? We doubt it and therefore think energy prices will continue to normalise – whatever that means these days!
By Niels Clemen Jensen
References
- Note: The overnight spike between 09/03/2026 and 10/03/2026 not included
- Source: Bloomberg
Editor’s Note: The summary bullets for this article were chosen by Seeking Alpha editors.

Amid rising concerns over the consequences of the latest Iran-Israel conflict, the benchmark domestic equity indices have been trading near their 11-month lows, which has affected overall valuations. This more so in the case of non-lending companies as the majority of banks and financial companies have shown resilience by retaining valuations above their three and five-year averages. Three out of every four of the lending enterprises in the sample continue to trade above their long term price-book (P/B) multiples. In case of banking and finance companies, price-book (P/B) multiple provides relevant information about relative valuation. It is calculated by dividing the share price by the book value.
A majority of BSE 500 stocks below 3-year and 5-year average valuations; however, 60% still trade above long-term numbers
In case of non-lending companies that include manufacturing, services and trading enterprises, 56% companies trade below their three-year price-earnings (P/E) multiples while 42% look less expensive than what they were a decade ago. A P/E multiple is calculated by dividing the share price of a company by its earnings per share (EPS). When compared with the historical data, the P/E multiple offers insights on relative valuation of the stock.
In addition, nearly three out of every four stocks in the total sample trade below their respective 200-day moving averages, reflecting bearish sentiment in the market.

Donny DBM/iStock via Getty Images

Top-Down and Bottom-Up
Investors typically fall into two camps. They are either top-down, guided by macro views and often taking thematic slants, or bottom-up, ignoring the big picture to focus on individual securities. We have always conducted analysis across the spectrum. Our goal is to select undervalued securities by thoroughly analyzing each individual company. But we also evaluate the overall economic environment, to alter our portfolio approach, especially when our macro alerts trigger.
We developed proprietary tools and formalized a four-pillar approach several years ago. Two pillars are top down: TRIM™ (our Indicator of Momentum to alert us to material market declines) and TEC™ (our Economic Composite to spot recessions). The other two pillars are bottom up: value (to determine price to Fair Market Value) and TRAC™ (to optimize entry and exit points).
During most periods, bottom-up analysis suffices because the economy is humming along; however, we specifically built our macro tools to provide us with alerts when the likelihood of macroeconomic issues overwhelming markets is high. Though, in our view, one should not vacillate between being fully invested or entirely in cash. Certain companies ought to be owned through thick or thin, otherwise the upside might be missed. Conversely, a top-down view can assist in avoiding positions that may suffer as the economy softens and markets are pressured.
Best of Both Worlds
Since TEC™ is still alerting us to a potential recession, we have maintained our hedging strategies, continuing to hold short positions (where authorized) or inverse long ETFs. We aren’t just concerned with the potential for a near-term peak in the economic cycle, but the markets are overvalued and inflecting from TRAC™ ceilings. Certain segments, such as technology, are experiencing significant overspending, housing is already in a downturn from prior excesses, and economic and geopolitical policies are creating instability.
Although, when uncertainties rise some securities decline unduly. This allows us to build portfolios of quality companies that trade down to levels that are attractive discounts to our FMV estimates. Even without a recession, undervaluations often occur when specific sectors come under scrutiny or because of company-specific news items or rumours. Investors often sell when issues arise, without taking the time to evaluate situations. Furthermore, selling begets selling as fear overpowers rational behaviour. As bottom-up analysts, we welcome these opportunities to take advantage of short-term price declines from what we believe are temporary issues until misperceptions dissipate.
Using both approaches, we can hedge based on a negative macro-outlook, avoid cyclical companies when a recession is expected, and embrace undervalued quality companies that ought to do well, even in a downturn.
Top Heavy
We’re expecting a recession because the yield curve previously inverted, monetary growth is anemic, economic statistics have waned, and unemployment should rise. Even in the absence of a recession, overall economic growth could soften for a prolonged period.
Population growth—the driver of economic growth—is in reverse. The U.S. is now experiencing net emigration—more people are leaving than coming—which hasn’t occurred since 1935. Not just as a result of record deportations but also because Americans are departing in record numbers. It may get worse. A recent Gallup survey showed 20% of Americans want to live elsewhere, up from 10%, even in the 2008 recession. Canada’s population suffered the largest quarterly drop since the 1940s. This is exacerbating the already poor demographics—an ageing population because baby boomers are a disproportionate cohort and fertility rates are too low to keep pace with deaths. Other regions, such as Asia (China, Japan, and South Korea) and Europe (Italy, Greece, and Portugal) are suffering declining populations too.
Basic economics suggests that population growth leads to growth in unit volumes which in turn leads to expanding sales, profits, and share prices. If populations don’t grow, the rest doesn’t easily follow. Immigration, albeit done properly, is a necessity for economic growth.
For the last several years, until recently, job openings in the U.S. have consistently been well above the number of unemployed. Certain sectors (agriculture, dining, hospitality, nursing, construction, and manufacturing) could see significant labour shortages if immigration policies aren’t remedied.
Unusually, recent economic growth has been occurring without job growth. For the third consecutive quarter, more CEOs intend to cut rather than add jobs. The percentage of part-time to full-time jobs is up materially. A further sign of uncertainty amongst employers. The number of job openings also continues to fall. Now, the number of unemployed is above total job openings, which has only occurred twice in the last 30 years, both during recessions. AI has major implications for employment too. Block (SQ) just terminated 40% of its workforce citing AI and the fundamental changes it’s having on how the company operates, allowing for a much smaller team.
Excluding AI spending, the U.S. economy likely contracted in 2025. Growth in capital spending by the major tech companies is expected to be nearly 3 times 2024’s and double last year’s record high spending level. It’s so high that it is expected to be essentially on par with all incremental U.S. bank lending, or 1.6% of GDP. Meanwhile, AI companies have yet to show meaningful returns from this spending, forecasts appear overly optimistic, free cash flows are being depleted, cash hoards spent, debt is increasing, and accounting has become aggressive with depreciation terms counter-intuitively lengthened.
Real estate prices clearly topped out. Pending home sales set a record low in 2025. There’s still a record 50% more sellers than buyers. House prices should decline and rents soften. Though, ultimately, a lack of building will offset the dwindling demand.
The one likely positive impact of all this is low inflation. Disinflation should be driven by increasing unemployment, lower growth in incomes, tight monetary policy (including waning velocity of money from tighter credit conditions), stagnation in foreign economies, and the impact from AI.
The massive spending on AI could result in excess capacity—overbuilding—which would result in an additional source of disinflation. The major spenders appear to be morphing from capital light to capital intensive businesses.
Consumers’ income growth has already slowed dramatically and consumers’ balance sheets are stressed. Delinquencies for student loans along with credit card balances and auto loans have all moved much higher over the last few quarters.
Bank credit was already tightening when the recent pall over the private lending sector began. Private credit delinquencies have remained low; however, a few lender issues and media attention have caused investors to pull out funds and managers to take steps to gate (prohibit) withdrawals, insofar as these are illiquid investments, until loans mature.
All this has helped lower inflation with the U.S. core CPI rate falling to 2.5% and the Truflation rate, which tracks prices of a wide range of goods and services in real time, now below 1%, which augers well for lower interest rates and could help buoy stock and bond valuations.
From the Top
We’re now stuck with some poor economic policies.
Debt levels are too high and governments show little interest in cutting expenditures. Debt levels this high relative to GDP have been shown to suppress economic growth.
Tariffs don’t simply act as an additional tax; they also lower economic activity because they add inefficiencies, complexities, uncertainties, and suppress demand. Worse, the longer these policies persist the more it causes business to seek alternatives, including new trading partners. Trading channels are being altered. The EU inked a massive free trade agreement with India and is pursuing the same with South America. Mark Carney, while visiting Beijing, even referred to Canada’s trade relationship with China being more predictable than that with the U.S.
Looking Toppy
Returns are generally the opposite of valuations. Meaning the lower the valuations the higher the returns and vice versa.
While the average U.S. stock was somewhat reasonably valued over the last few years, the median price-to-earnings ratio for stocks broadly has now lifted to its worst decile. This lowers the return outlook for U.S. stocks to paltry figures. Whenever the S&P 500 valuation has exceeded 23x next-12-months earnings expectations, as it was over the last few months, the subsequent 10-year real return (after inflation) was essentially nil, with a range of -2% to +2% annually.
On top of this, the average S&P 500 decline from intra-year highs in midterm election years is 18%, worse than typical annual drawdowns, and this ignores the larger declines which accompany recessions.
Even steady businesses, like Costco (COST) and Walmart (WMT), trade at such lofty valuations that a decline back to an average normal trading level (12% below FMV) would imply drops exceeding 30%.
It’s not just stocks; bonds aren’t cheap either. Investment Grade U.S. corporate bonds trade at the narrowest spread (approximately 1%) to 10-year government bonds since 2007. High-yield corporate bonds are historically narrow too, just under half the historical average of 5.5%. They should yield closer to 9.5%, not around the current 6.9%. And that’s just assuming the average, in times of stress spreads expand well beyond the historical average.
Some commodities, which have risen way too far above their costs of production, could suffer too. Gold and silver trade well above where they ought to. If gold reverted to its typical premium to the average all-in cost of production it would fall by more than 50%. Once commodity prices rise this far above production costs they generally fall back to normal premiums within 24 months. Silver recently retraced 47% from its high before lifting again, and it still sits at more than 3x where it would be expected to trade based on its cost of production. Excessive trading is prevalent too. The value traded of the silver bullion ETF during the week it peaked, in late January, exceeded the grand total for every year but 5 since 2006.
Since 2011, Bitcoin has fallen by more than 50% from its highs 4 times (about every 3.5 years), and it recently declined 48% from its high. This is not a safe-haven vehicle in our view.
Once the last momentum trader gives way, true economic value reasserts itself.
Corporate insiders realize things are frothy. There were more officers and directors selling shares than buying in January than in any month in the last 5 years.
AI related stocks are trading at huge multiples of revenue.
Overpaying for a company, even a great growing company, can have a poor result, when the share price re-attaches to fair value or declines to a normal discount if it falls out of favour.
From a bottom-up standpoint, we’ve had to review far more companies than usual before finding an opportunity for purchase. A top-down created problem.
Top of the Heap
Competition has intensified in most fields. AI should heighten competitive threats.
AI lowers barriers to entry—by lowering costs and increasing rates of change—which should increase the flow of goods and services. This should erode pricing power and pressure profit margins. The advent of online stores, and their impact on brick-and-mortal retailer margins, provided an example of what might follow for many businesses.
Anthropic’s own Claude AI programs are so effective that it’s writing much of its own code and its capabilities are increasing astonishingly month by month.
A land grab is also taking place amongst AI providers. The largest competitors are spending a disproportionate amount of their cash flow on capital expenditures. In an egregious example, which could have a very poor ending, OpenAI has made over $1.4 trillion in spending commitments; however, it’s losing enormous amounts of money and requires substantial funding to meet its obligations. Meanwhile, its main product, ChatGPT, is also losing market share to Gemini, Grok, Claude, Copilot and others.
Nvidia (NVDA)’s profit margins are so attractive that many customers (Alphabet (GOOGL), Amazon (AMZN), Meta, Microsoft (MSFT), OpenAI) have chosen to design and build their own chips for AI purposes. It’s believed that this is being done at a fraction of the cost, and with more productive outcomes.
High capital spending in overly competitive areas is not a good combination. Net profit margins for the S&P 500, which are cyclical, are now at all-time highs of 13.6% yet have fallen to 8% or below on 5 separate occasions in the last 25 years.
Our Model Portfolios
Our managed accounts are invested based on one or more of our Models (particular investment strategies with notional allocations of securities). A managed account’s holdings will generally be similar to its applicable Model’s, but may not hold all of them based on client-specific factors (income requirements, tax-related considerations, requests/restrictions, and cash available for purchases) and/or market forces which impact specific investment decisions from time to time.
The following descriptions of the holdings in our managed accounts are intended only to explain the reasons that we have made, and continue to hold, these investments in the accounts we manage for you and are not intended as advice or recommendations with respect to purchasing, selling or holding the securities described. Below, we discuss each of our new holdings and updates on key holdings if there have been material developments.
All Cap Model
The All Cap Model combines selections from our large cap strategy (Global Insight) with our small and medium cap ideas. We generally prefer large cap companies for their superior liquidity and lower volatility. The smaller cap positions tend to be less liquid and more volatile; however, we may hold these positions where they are cheaper, trading at relatively greater discounts to our FMV estimates, making their risk/reward profiles favourable.
In the last few months, we bought CONMED (CNMD) and Superior Plus (SUUIF). We sold Headwater (HWXCF) because it lifted to a TRAC™ ceiling, in line with our FMV estimate. Our large cap positions are summarized in the Global Insight section.
CONMED is a medical device and equipment manufacturer. The share price has been declining over the last several years while the company grapples with supply-chain issues and competitive pressures. Its new CEO has made repairing supply-chain constraints the number one priority. Signs are emerging that the situation is improving with backorders at a 3-year low. The aim is to now build a world-class, data-driven supply chain. We see strong growth ahead for the company’s BioBrace and surgical smoke management products. BioBrace is a cutting-edge reinforced bioinductive implant used for orthopedic procedures. Because research has found that surgical-related smoke contains a mixture of harmful byproducts including dead cellular material, carcinogens, viruses, bacteria, and toxic gases, over 20 States have enacted legislation to address surgical smoke evacuation. The company offers a range of products to offset these issues. Should the stock price continue to languish, it could be an ideal takeover target for a larger medical device maker. Our FMV estimate is $60.
Superior Plus is a leading North American distributor of propane and compressed natural gas (CNG). The two markets are polar opposites. While CNG is dominated by large scale players (Superior’s 44% market share makes it the largest), because significant capital investment is required and there are regulatory complexities, propane is fragmented with large-scale distributors, including Superior, comprising just 29% of the market. In propane, cost advantages are vital. The company’s Superior Delivers initiative aims to reduce propane delivery costs through data-driven route optimization. Lower costs enhance customer value, which translates to additional customers and greater scale, further driving down unit costs. Unfortunately, Superior’s plan has encountered issues forcing management to push out expected savings to 2027. Their credibility has severely eroded, which could explain why the stock trades near a 20-year low. Ultimately, the company’s plan should result in rising cash flow, otherwise it’s likely to attract activist investors to spur on the process. Our FMV estimate is $14.
Global Insight (Large Cap) Model
Global Insight portfolios hold large cap stocks (typically with market caps over $5 billion at the time of purchase but may include those in the $2-5 billion range) where portfolios are managed Long/Short or Long only. At an average of less than 70 cents-on-the-dollar versus our FMV estimates, our Global Insight holdings appear much cheaper, in aggregate, than the overall market.
In the last few months, we have made several changes in our large-cap positions. We bought Uber Technologies (UBER) (after selling it in the previous quarter), Netflix (NFLX), Sanofi (SNY), Diamondback Energy (FANG),and Meta Platforms (META). We sold Chevron (CVX), Deutsche Post (DPSGY), Kesko (KKOYY) and GSK (GSK) after each ran up TRAC™ceilings near our FMV estimates.
Uber Technologies has been under pressure because the advent of autonomous vehicles (AVs) is viewed by the market as an existential threat. First, it will likely take many years for AVs to reach mass adoption—the World Economic Forum forecasts that less than 1% of new car sales in 2030 will have level 4 highway and urban capabilities and only 30 global cities will have significant robotaxi fleets. Second, though AVs are clearly the future, Uber has several initiatives underway to remain the platform leader as the world transitions. It recently announced Uber Autonomous Solutions, a suite of services to help partners commercialize AV technology and reduce costs for what is likely to be a highly fragmented industry as dozens of national, regional, and global companies supply AV hardware and software. Recent announcements include: Wayve (a UK-based fleet Uber will own and operate); WeRide (WRD) (a partnership with over 300 AVs on Uber’s platform by this year-end); and Apollo Go (a partnership that aims to put thousands of AVs on the Uber network in Asia and the Middle East). Meanwhile, we expect Uber’s dominant ride-share business and Uber Eats to generate substantial free cash flow, increasing toward $20 billion annually over the next 5 years. Our FMV estimate is $110.
Netflix’s battle with Paramount for Warner Bros. Discovery has all the ingredients of a great movie. Spoiler alert—Netflix bowed out of the process after Paramount raised its offer to $31 per share. While we believed that Netflix was in a win-win situation, the decision to step away demonstrated discipline and prudent capital stewardship. Netflix earns a $2.8 billion break fee and should have renewed focus on its core global streaming business which we believe has untapped potential. We expect to see more gaming, sports, live comedy, musical performances, and events such as Skyscraper Live, which drew 6.2 million views. While competition in streaming is heated, from the many competitors including You Tube, Netflix has an unparalleled content library and the ability to create differentiated original content with a genuine feel sourced in various local markets, which then caters to its diverse global userbase. Our FMV estimate is $140.
Sanofi’s Dupixent is a blockbuster medication used to treat moderate-to-severe inflammatory conditions including atopic dermatitis (eczema) and asthma. New indications should help drive high single-digit annual earnings growth through 2030. Post-2031, the company will likely see growth temporarily stall, or even decline, when it loses patent protection. Uncertainty about the post-expiry growth profile may explain why the stock trades at a relatively low multiple of this year’s expected earnings. However, the company has plans for meaningful growth beyond Dupixent with new drug revenues hitting €5.7 billion in 2025, up 34% year-over-year. Strategic acquisitions and steady performance from its vaccines business should also contribute to growth. Even if earnings decline somewhat post patent expiry, the total return could still be above 8% annualized from expected earnings growth alone, with potential upside from new drugs, acquisitions, and a revaluation once its profile is appreciated. Our FMV estimate is €100.
Diamondback Energy is a Texas-based oil and gas company focused on the Permian Basin. We view the company as a disciplined capital allocator with best-in-class execution. Diamondback exited 2025 with its best drilling efficiency and completion efficiency stats in several years and an industry-leading reinvestment rate. Its efficient operations mean that its healthy dividend ought to be protected down to $37 WTI oil; therefore, management views its dividend as a fixed obligation. We expect full-year 2026 oil production to be 500,000 daily barrels of production which should translate to $4.4 billion of free cash flow, at lower than prevailing oil prices. Since oil prices have been volatile, the share price is likely to be so as well. Our FMV estimate is $210.
Meta Platforms’ capital expenditures are expected to balloon to $120 billion this year, which equates to nearly half of the company’s revenues. Investors are right to be skeptical of this spending on AI since the company appears to have sunk tens of billions on the metaverse with little, if anything, to show for it. Unlike with the metaverse spending, we see a boost to revenues and profitability from Meta’s AI investments. AI-driven improvements and engagement increased the Q4 year-over-year growth in ad impressions by 18% and Instagram Reels watch times by 30%. We also expect cost savings from a material reduction in Meta’s workforce over the next 2 years due to AI productivity enhancements. Our FMV is $770.
Multifaceted Diversification
We also aim to limit volatility and drawdowns by combining investment strategies, especially where returns are less correlated. The goal is to outperform through economic cycles with low correlation, therefore less susceptibility, to market index declines. We can construct portfolios with multiple unique return drivers—strategies that differ in style and approach—based on bottom-up fundamentals, macro tools, or pure quantitative analysis. This can provide exposure to different styles and asset classes beyond just stock and bond indexes.
The benefits of multifaceted diversification are not only from different ways to perform but also from a portfolio comprised of strategies that are less correlated. So that when a strategy underperforms, it’s less likely to occur at the same time as another strategy, which softens the volatility and drawdowns of the overall investment portfolio.
Global Tactical Allocation Model
Our Global Tactical Allocation Model (GTAM) investment process combines macroeconomic analysis with valuation and momentum. ETFs (exchange traded funds) are used to gain exposure to 4 broad asset classes: Equities—major markets, emerging markets, sectors, styles, private equity; Fixed Income—bonds issued by governments, investment grade corporations, high-yield issuers, as well as mortgages, and bond indexes; Real Assets—real estate, infrastructure, renewable energy; and Commodities—Precious Metals or Oil. GTAM emphasizes ETFs that should outperform based on the macro environment, are selling at attractive absolute and relative valuations, possess good relative price momentum, and are at TRAC™ floors.
Current exposures are: Equities (66%); Fixed Income (15%); Real Assets (16%); and Commodities (none). Its current broad themes are U.S. technology, consumer staples, and emerging markets. Positions in U.S. software and cybersecurity were established after AI fears sent these sectors down nearly 30% from their late 2025 peaks.
Quantitative Investment Models
Quantitative equity strategies commonly select securities based on systematic, rules-based decisions, using technology to uncover and exploit historical statistically significant anomalies. Our quantitative equity strategies employ proprietary and systematic processes that rank large cap stocks based on factors such as relative valuation, operating metrics (quality), financial strength, and price momentum. The two models noted below select approximately 30-40 holdings from the top-ranked stocks in the model’s respective universe. TRAC™ is utilized to optimize entry and exit points.
The Quantitative Global Value Model (QGVM) invests in large-cap equities from around the world. The U.S., Canada, and Japan currently represent the top 3 countries. The top 3 sectors are Financials (27%), Consumer Staples (18%) and Industrials (16%). The companies held in QGVM currently have the following characteristics: median forward P/E of 13.3x, ROE and ROIC of 22% and 12% respectively, and dividend yield of 2.1%.
The Quantitative Canadian Value Model (QCVM) restricts its universe to Canada’s S&P/TSX Composite. The top 3 sectors are currently Energy (18%), Industrials (17%), and Information Technology (16%). We have materially reduced our materials weighting after our precious metals holdings reached TRAC™ ceilings and our FMV estimates. Proceeds were used to buy technology stocks which have experienced severe corrections due to concerns about AI. The companies held in QCVM currently have the following characteristics: median forward P/E of 15.9x, ROE 11%, and dividend yield of 2.1%.
Income Model
Our high-yield investment strategy has an average current annual yield (income we receive as a percent of current market value of income securities held) of about 5.0%, and most of our holdings—corporate bonds/debentures, preferred shares, REITs, and high-yielding common shares—trade below our FMV estimates.
U.S. high-yield corporate bonds (ICE BofA Index) yield 6.9%, and because high-yield corporate bond spreads are narrow relative to history, we expect a widening, especially if the economy weakens and corporate delinquencies increase.
We recently purchased Big Yellow Group (BYLOF), Blue Owl Technology Finance (OTFC), and Shurgard Self Storage (SSHGF), and sold Whitestone REIT (WSR) when it ran up to a TRAC ceiling in line with our FMV estimate.
We bought two dominant self-storage REITs—Big Yellow Group—the largest in the UK and Shurgard Self Storage—one of the largest in Europe. They pay dividend yields of 5.0% and 3.0% respectively, both have little leverage, should grow earnings by mid- to high-single digits, and trade well below our respective. €13 and €43 FMV estimates. While the major risk for each is higher interest rates, both should fare well in a recession when self-storage companies benefit from downsizing, and most importantly, the self-storage has offered the highest project returns and lowest volatility of all real estate segments.
Blue Owl Technology Finance is a business development corporation which lends its permanent capital base to other companies. Its share price declined because most of its loans are to software companies. The market is fearful of AI creating instant competition for software providers; however, Blue Owl Technology lends to established, highly profitable, mission-critical and cybersecurity-based, software companies, mostly with first lien secured loans, and it’s only suffered one loss historically. Our FMV is $16 and the shares yield 12.2%.
Investment Grade Income Model
Our investment grade strategy utilizes a systematic process to rank Canadian investment-grade rated corporate bonds based on their duration, yield, financial strength, and momentum.
Currently, positioning has emphasized longer-dated bonds—duration is 10.1 years, 4.5 years more than the S&P Canada Investment Grade Corporate Bond Index. The average yield-to-maturity is 4.8% versus 4.0% for the index.
From Top to Bottom
Few investment managers are expecting a recession. Almost all expect continued economic growth. Investors are assuming that record profits and profit margins will continue apace.
It doesn’t help that broad-based speculation is being fueled by easy access for individuals to online brokerage apps and prediction markets, egged on by hype, momentum, and FOMO. Investment newsletter writers—great contra-indicators—have been euphoric lately, more bullish than at any other time since 2000. This adds to our economic and market concerns, providing comfort in our hedges.
While it’s not easy to properly assess individual companies, it’s more difficult to make a correct and timely call on the overall economy or markets. Still, we are compelled to do both.
We seek the reward from bottom-up analysis of companies whose share prices have fluctuated too far below our assessed FMVs. And gain comfort from hedging when our alerts indicate a potential recession while sentiment runs high and major indexes hit ceilings in our work.
Sorry if this letter was a bit of a downer. Bottoms up!
Randall Abramson, CFA
GenerationPMCA Corp.
References
- In this letter, ROE, ROIC, dividend yield, yield, and yield to maturity, are calculated for the respective Model portfolio based on the holdings as at the date of this letter of an actual representative account managed in accordance with such Model. These figures are neither a measure of results achieved nor projected future performance. The Model’s holdings, and therefore ROE, ROIC, and yields, are subject to change at any time and may differ among accounts managed based on the same Model.
Editor’s Note: The summary bullets for this article were chosen by Seeking Alpha editors.

Perth Design Week has grown to become a highlight on the city’s arts calendar.


Oil extends gains as Middle East conflict threatens export facilities

Micron completes acquisition of PSMC facility in Taiwan
Business
Australia’s Syrah, Tesla extend deadline to resolve alleged default in graphite supply deal


Australia’s Syrah, Tesla extend deadline to resolve alleged default in graphite supply deal

Check out what’s clicking on FoxBusiness.com.
Costco issued a recall notice over the weekend for its popular ready-to-eat meatloaf meal kit, impacting warehouse locations in at least 26 states.
The “Meatloaf with Mashed Yukon Potatoes and Glaze” was flagged for potential Salmonella contamination after an ingredient supplier raised concerns.
“An ingredient supplier, Griffith Foods Inc., has announced the recall of an ingredient used in the Meatloaf because the ingredient has the potential to be contaminated with Salmonella,” the recall notice said.
Headquartered just outside Chicago, Griffith Foods is a global, family-owned food ingredient manufacturer. The Costco recall notice did not specify which ingredient was linked to the potential contamination.
COSTCO SUED BY CUSTOMER SEEKING REFUNDS FOR TARIFF PAYMENTS

Costco issued a recall notice over the weekend for the “Meatloaf with Mashed Yukon Potatoes and Glaze.” (Costco / Fox News)
The meal, product #30783, was sold between March 2 and March 13, just days before the Salmonella concern emerged. The items had sell-by dates from March 5 through March 16.
Costco locations across 26 states, as well as the District of Columbia and Puerto Rico, were affected by the recall. The states include Alabama, Arizona, California, Colorado, Delaware, Florida, Georgia, Hawaii, Illinois, Indiana, Iowa, Kentucky, Maryland, Michigan, Mississippi, Missouri, Nevada, New Mexico, North Carolina, Ohio, Pennsylvania, South Carolina, Tennessee, Utah, Virginia and Wisconsin.
GM RECALLS 17K VEHICLES OVER REAR TOE LINK FRACTURE THAT COULD LEAD TO CRASHES

An employee, left, works in the deli department at a Costco Wholesale Corp. store in Miami, Florida, U.S., on Monday, Dec. 5, 2016. (Scott McIntyre/Bloomberg via Getty Images / Getty Images)
The retail giant urged customers not to consume the product and advised that the affected item could be returned to their local Costco for a full refund.
No illnesses or injuries have been reported in connection with the item, Costco added.

Costco employees in the deli department prepare food at a Costco store in Napa, California, US, on Monday, Sept. 22, 2025. (David Paul Morris/Bloomberg via Getty Images / Getty Images)
| Ticker | Security | Last | Change | Change % |
|---|---|---|---|---|
| COST | COSTCO WHOLESALE CORP. | 1,008.43 | +5.11 | +0.51% |
According to the CDC, Salmonella infection is a leading cause of foodborne illness in the United States. It is a bacterium that can cause serious and sometimes life-threatening infections, particularly in young children, the elderly and individuals with weakened immune systems.
GET FOX BUSINESS ON THE GO BY CLICKING HERE
Infections commonly cause diarrhea, fever, and stomach cramps, which typically appear between six hours and six days after exposure.
Most healthy individuals, however, recover within four to seven days, often without specific medical treatment.
BBC viewers emotional as they spot familiar face in The Other Bennet Sister

South West delivers picture-perfect scenes

Venus Protocol exploited for $3.7M through supply cap manipulation: On-chain analysis


-
 Tech5 days ago
A 1,300-Pound NASA Spacecraft To Re-Enter Earth’s Atmosphere
-
 Crypto World2 days ago
HYPE Token Enters Net Deflation as HyperCore Buybacks Outpace Staking Rewards
-

 News Videos7 days ago
10th Algebra | Financial Planning | Question Bank Solution | Board Exam 2026
-

 Business5 days ago
ExxonMobil seeks to move corporate registration from New Jersey to Texas
-

 Crypto World6 days ago
Paradigm, a16z, Winklevoss Capital, Balaji Srinivasan among investors in ZODL
-

 Fashion2 days ago
Weekend Open Thread: Addict Lip Glow
-

 Tech5 days ago
ChatGPT will now generate interactive visuals to help you with math and science concepts
-
Sports1 day ago
Why Duke and Michigan Are Dead Even Entering Selection Sunday
-

 NewsBeat4 days ago
Residents reaction as Shildon murder probe enters second day
-

 Business5 days ago
Search Enters Sixth Week With New Leads in Tucson Abduction Case
-
 NewsBeat6 days ago
Pagazzi Lighting enters administration as 70 jobs lost and 11 stores close across Scotland
-

 Business5 hours ago
Search for Savannah Guthrie’s Mother Enters Seventh Week with No Arrests
-

 Tech6 days ago
Despite challenges, Ireland sixth in EU for board gender diversity
-

 Business1 day ago
US Airports Launch Donation Drives for Unpaid TSA Workers as Partial Government Shutdown Enters Fifth Week
-
Crypto World1 day ago
Coinbase and Bybit in Investment Talks: Could Bybit Finally Enter the US Crypto Market?
-

 NewsBeat4 days ago
I Entered The Manosphere. Nothing Could Prepare Me For What I Found.
-

 Business6 days ago
Search Enters 39th Day with FBI Tip Line Developments and No Major Breakthroughs
-

 Sports7 days ago
Skateboarding World Championships: Britain’s Sky Brown wins park gold
-

 Business2 days ago
Country star Brantley Gilbert enters growing non-alcoholic beer market
-

 Crypto World5 days ago
Will Chainlink price reclaim $10 amid volatility squeeze?

