
Business
Strengthening ASEAN Currency Resilience: Towards Financial Independence

ASEAN currencies demonstrate resilience through economic fundamentals and integration efforts. Initiatives like local currency frameworks and fintech development reduce reliance on the US dollar, enhancing regional stability and investment opportunities.
ASEAN currencies have shown significant resilience to global economic shocks driven by robust domestic economic fundamentals, effective policy buffers, growth in FDI and investments and global developments, such as geopolitical uncertainties, trade tensions and financial crises.
Key Points
- Resilience of ASEAN currencies
- Strong domestic fundamentals, prudent monetary policies, and large foreign reserves have helped withstand global shocks.
- Growth in exports (US$1.9 trillion in 2024) and FDI (US$234 billion in 2023) supports stability.
- Geopolitical pressures and USD reliance
- Sanctions on Russia and global trade tensions highlight vulnerabilities of USD dependence.
- ASEAN nations are diversifying reserves and promoting intra-regional trade to reduce reliance on the dollar.
Mounting geopolitical uncertainties and trade tensions, exacerbated by sanctions against Russia, have challenged the US dollar’s dominance driving a need for ASEAN countries to deepen integration, diversify currency reserves, and promote intra-regional trade to build resilience against future crises and reduce reliance on external currencies, the US dollar in particular.
At present, the ASEAN nations are developing an independent and more resilient regional financial system through integration and cooperation initiatives such as Regional Payment Connectivity, integrated QR payments, financial safety nets, Digital Economy Framework and Central Bank Digital currencies that aim to strengthen the payment connectivity among these nations while withstanding external shocks and future crises.
The development of fintech and digital banking in ASEAN has brought in stability to the banking system in the region offering broader currency and economic stability. The evolving fintech and digital banking landscape in the region is offering significant investment opportunities for investors in digital payments and lending, neobanking, embedded finance, investment technology and infrastructure.
ASEAN’s Emergence as a Global Powerhouse Supports Financial Resilience
The ASEAN region, with a total population of 682.7 million and a combined GDP of US$3.8 trillion ranks as the fifth-largest economy in the world. The region has evolved into a rapidly growing hub maintaining strong economic resilience driven by robust household consumption, steady increase in foreign direct investment (FDI), economic diversification and access to developed export markets.
Regional integration initiatives
- Local Currency Settlement frameworks (Indonesia, Malaysia, Thailand) encourage trade in local currencies.
- Regional Payment Connectivity (RPC) and interoperable QR payments lower transaction costs and improve cross-border efficiency.
- Chiang Mai Initiative (US$240 billion swap arrangement) provides financial safety nets.
The manufacturing sector continues to play a crucial role as the key driver of economic growth in the region. Manufactured goods such as electronics, automobiles and parts, textile & garments and agricultural products (such as palm oil, rice and rubber) dominate the exports in the ASEAN region.
In 2024, region’s exports reached US$1.9 trillion (7.7% of global exports) growing from US$1.1 trillion in 2016. Over the past decade, ASEAN’s exports to the US alone have increased roughly from 10% to 17%, highlighting the increased role of ASEAN in international trade.
During the last decade, ASEAN also has demonstrated strong performance in services trade, whereas service exports expanded by 8.0% in 2023 to US$554.2 billion.
During this period, intra-ASEAN trade also experienced significant growth with the removal of tariff on most products across the region (through ATIGA) which has helped build an integrated and stable regional market. In 2023, intra-ASEAN trade exports contributed to 22.1% of total ASEAN exports, growing at an average annual growth rate of 7.3% between 2003-2023.
Intra-ASEAN services trade also has experienced sustained growth over the years accounting for 14% of ASEAN’s total trade in services in 2023 (vs 12.6% in 2022). This strong growth in intra-ASEAN services trade further emphasizes the interdependence among ASEAN nations and strong regional integration.
Having a strong export sector and deep intra-regional integration have helped these nations generate significant foreign exchange earnings that have helped currency resilience through building large foreign exchange reserves.
Exports and foreign investments have been key drivers of economic growth in the region and have helped reduce the need for external borrowings in foreign currency. This has paved the way for the development of strong local currency bond markets which has helped build further resilience by reducing dependence on foreign funding.
Prudent monetary policies (such as interest rate and foreign reserve management) aimed at inflation targeting also has offered currency stability in the region. The inflation across most countries in the region has moderated and remains largely within the target.
Source: Source: Board of Governors of the Federal Reserve System (US)
Central banks in countries such as Indonesia and Vietnam have set higher local interest rates which has helped attract foreign investments due to higher yields, driving local currency appreciation.
The inward foreign direct investment flows into ASEAN have shown steady growth over the years (from US$119 billion in 2015 to US$234 billion in 2023) despite seeing a temporary decline in 2020 due to the COVID-19 outbreak. This growth has been driven by a large consumer market, strong economic fundamentals, diversification of supply chains and favorable government policies.
Geopolitical Uncertainties Create a Need for Building Resilience
The US Dollar has been dominating the global trade for decades, and ASEAN has been no exception. The ASEAN nations rely heavily on the US dollar (USD) as the primary currency for trade with the US and other nations including for intra-regional transactions. However, mounting geopolitical uncertainties and trade tension have challenged the USD’s dominance during the past few years, and the economic sanctions levied against Russia in response to its invasion of Ukraine further exacerbated this situation.
This resulted in a need for the countries in ASEAN to further deepen their integration and cooperation to diversify reserves and promote intra-regional trade. Moreover, this created a desire for ASEAN nations to bolster their resilience to weather future crises by reducing their dependence on external currencies.
ASEAN currencies are now less tied to the USD than before, and during the past decade, the exchange rate/USD (weighted average currency index) has shown less volatility compared to other emerging economies.
De-Dollarization in ASEAN: A Collective Effort
Local Currency Settlement Frameworks (LCS): The member states in ASEAN are implementing bilateral and multilateral LCS frameworks to promote the use of local currencies for intra-regional trade and investment. The goal is to reduce exposure to external currency volatility while enhancing efficiency for businesses in the region. At present, operational frameworks exist between Indonesia, Malaysia and Thailand, and as a result, transactions in local currencies within ASEAN have seen tremendous growth during the past five years.
Regional Payment Connectivity (RPC): In November 2022, five ASEAN member states (namely Indonesia, Malaysia, The Philippines, Singapore and Thailand) signed a MoU on cooperation on RPC which aims to strengthen bilateral and multilateral payment connectivity among the nations. This has supported faster, cheaper, transparent and more inclusive cross-border payments in the region. The initiative has now been extended to other member states including Vietnam (2023), Brunei (2024), Lao PDR (2024) and Cambodia (2025). The development of the RPC has also attracted countries outside the ASEAN.
Investment opportunities
- Rising demand for fintech, neobanks, embedded finance, and digital infrastructure.
- Strong manufacturing and services sectors continue to attract investors.
Integration of QR Payments: Having an ASEAN interoperable Quick Response (QR) payment is a key focus area of RPC that aims to encourage integration across participating central banks to standardize national payment systems through a common QR code format, ensuring seamless cross-border transactions. QR code systems of several member states including Cambodia (KHQR), Indonesia (QRIS), Lao PDR (Lao QR), Malaysia (DuitNow), The Philippines (QR Ph), Singapore (PayNow), Thailand (PromptPay), and Vietnam (VietQR) have already been connected. These initiatives are expected to lower transaction costs while mitigating foreign exchange risk. In the meantime, Japan is also reportedly exploring the integration of its QR payment system into RPC, with full implementation expected by end-2025.
Regional Financial Safety Nets: A multilateral currency swap arrangement (The Chiang Mai Initiative Multilateralisation (CMIM)) with a funding size of US$240 billion has been in place among the ASEAN+3 member countries (ASEAN, China, Japan, and South Korea) to address balance of payment and short-term liquidity crises (by enabling rapid financing facilities) in the region.
The regulators and central banks in the region have launched several policy frameworks to facilitate seamless transaction in the region.
The ASEAN Policy Framework is a regional initiative that provides the guiding principles for the implementation of interoperable, real-time payment systems across the region. These include common standards, data security (ISO:20022) and linkages between national QR systems.
The Local Currency Transaction Framework is an initiative by the central banks of Indonesia, Malaysia and Thailand to promote the use of local currencies for trade and investment thereby reducing reliance on USD. This framework was extended in 2025 to include portfolio investments to further strengthen financial cooperation in the region.
The ASEAN Digital Economy Framework Agreement (DEFA) is a comprehensive roadmap negotiated by the countries to create the world’s first comprehensive digital trade rules through harmonizing standards, digital trade, cybersecurity and digital payments. Negotiations are expected to conclude, with the agreement signed by 2026.
In addition to the above, the countries in the region are in the process of adopting international standards such as ISO:20022 messaging standard to facilitate data exchange for regulatory compliance and greater transparency.
Central Bank Digital Currencies (CBDCs) to Further Strengthen Regional Integration
ASEAN Countries are actively exploring CBDCs to further enhance financial inclusion and cross-border payments while further strengthening regional efforts to reduce US dollar reliance. While Singapore (a trial is expected in 2026) is at the forefront, Thailand, Indonesia and Malaysia have already launched pilot projects exploring both wholesale and retail applications as a means of modernizing cross-border payments. The other countries in the region including The Philippines, Cambodia and Vietnam have already initiated several measures (such as receiving training, ongoing research, etc.) related to CBDCs to enhance cross-border interoperability.
CBDCs, if made interoperable with systems of other countries, have the potential to reduce transaction costs by cutting down transaction times and facilitating deeper economic ties with other economies in the region. This offers unique advantages to countries in ASEAN by enabling direct settlement in local currencies thereby reducing US dollar dependency and stability against currency volatility.
Fintech and Digital Banking Further Boost Currency Resilience
The development of fintech and digital banking in ASEAN has further enhanced currency resilience by complementing the regional cooperation initiatives. As countries in the region attempts to interlink economies and financial systems, fintech has offered various measures to achieve the above through streamlining cross-border payments.
Digital transformation
- Fintech and digital banking enhance financial inclusion and stability.
- Central Bank Digital Currencies (CBDCs) are being piloted to strengthen cross-border payments and reduce USD dependency.
Digital banks and fintechs in the region offer services such as mobile money, digital wallets and micro-credit to population which were previously unbanked as well as to SMEs in the region promoting financial inclusion. Strong and inclusive economies are inherently more resilient to external pressures which in turn supports currency strength.
In general, fintech applications leverage big data, AI and blockchain that enable financial institutions to accurately assess risk and manage liquidity in real-time. This offers stability to the banking system and resilience to external shocks which in turn provides the foundation for broader currency and economic stability.
Investment Implications for ASEAN
As fintech firms in the region play a crucial role in developing a robust ecosystem for local currency transactions in the region, there has been strong demand for fintech, digital banks and RegTech (regulatory technology) offerings. The acceleration of digital payment platforms and cross-border payment systems such as the RPC initiative have created a fertile ground for fintech investment in ASEAN. Neobanks are rapidly growing in the region targeting its large underbanked population presenting significant opportunities for innovation and growth. At the same time, embedded finance is also transforming ASEAN’s fintech landscape offering significant opportunities in areas including payments, lending, wealth management and insurance infrastructure. In addition to diversified manufacturing and service hubs in ASEAN offering attractive investment opportunities, investors should also look at companies that stand to benefit from this evolving fintech transition (such as infrastructure and technology providers).
Conclusion
The use of local currencies in cross-border transactions in ASEAN is increasing driven by geopolitical uncertainties and trade tensions. Strengthening macroeconomic fundamentals and deepening regional financial integration and payment connectivity have promoted cross-border settlements in ASEAN, accelerating the move away from the USD. The policy makers and central banks in the region have introduced several policy frameworks to develop an independent financial system thus bringing in further resilience to ASEAN currencies.
An evolving fintech and digital banking landscape in the region have further supported this move by improving the efficiency of cross-border transactions. The investors in ASEAN are increasingly hedging their USD exposures with slowdown in the US economy driving further demand for ASEAN currencies. An attractive bond market in the region (including higher yields compared to other developed markets) also offers investors an opportunity for portfolio diversification.
Despite the cooperation among ASEAN countries and the significant progress made towards building an independent financial system in the region, diverse regulatory landscapes among countries, varied stages of digital infrastructure development and the need to harmonize data protection protocols need to be addressed to achieve an independent financial system. While US dollar’s dominance is expected to continue, ongoing collaboration among ASEAN nations have paved the way for gradual development of an independent financial ecosystem.
This article was written by Smartkarma, in collaboration with ASEAN Exchanges.
Source : Currency Resilience in ASEAN: Moving Towards an Independent Financial System
Other People are Reading


My professional journey in the investment field began in 2011. Today, I combine the roles of an Investment Consultant and an Active Intraday Trader. This synergistic approach allows me to maximize returns by leveraging deep knowledge in economics, fundamental investment analysis, and technical trading. What You Will Find in My Analysis: Clear, actionable investment ideas designed to build a balanced portfolio of U.S. securities. A combination of macro-economic analysis and direct, real-world trading experience. My two university degrees in Finance and Economics were merely the starting point—my true expertise was forged through active practice in management and trading. My Goal on Seeking Alpha: To identify the most profitable and undervalued investment opportunities (primarily in the U.S. market) that are capable of forming a high-yield, balanced portfolio. Follow me for a balanced view, backed by active trading practice.
Analyst’s Disclosure: I/we have a beneficial long position in the shares of MLPI, MLPX either through stock ownership, options, or other derivatives. I wrote this article myself, and it expresses my own opinions. I am not receiving compensation for it (other than from Seeking Alpha). I have no business relationship with any company whose stock is mentioned in this article.
Seeking Alpha’s Disclosure: Past performance is no guarantee of future results. No recommendation or advice is being given as to whether any investment is suitable for a particular investor. Any views or opinions expressed above may not reflect those of Seeking Alpha as a whole. Seeking Alpha is not a licensed securities dealer, broker or US investment adviser or investment bank. Our analysts are third party authors that include both professional investors and individual investors who may not be licensed or certified by any institute or regulatory body.

I’m a Portfolio manager (flexible equity funds and private clients), fundamental equity research, macro and geopolitical strategy.Over 10 years across global markets, managing multi-asset strategies and equity portfolios at a European asset manager.I combine top-down macro, bottom-up stock selection and real-time positioning (Bloomberg, models, data).I focus on earnings, tech disruption, policy shifts and capital flows — to identify mispriced opportunities before the market.On Seeking Alpha I share high-conviction ideas, contrarian views and deep breakdowns of both growth and value names.For more insights: follow me on X @AgarCapital
Analyst’s Disclosure: I/we have a beneficial long position in the shares of SPX, NDX either through stock ownership, options, or other derivatives. I wrote this article myself, and it expresses my own opinions. I am not receiving compensation for it (other than from Seeking Alpha). I have no business relationship with any company whose stock is mentioned in this article.
Seeking Alpha’s Disclosure: Past performance is no guarantee of future results. No recommendation or advice is being given as to whether any investment is suitable for a particular investor. Any views or opinions expressed above may not reflect those of Seeking Alpha as a whole. Seeking Alpha is not a licensed securities dealer, broker or US investment adviser or investment bank. Our analysts are third party authors that include both professional investors and individual investors who may not be licensed or certified by any institute or regulatory body.

Maggie Huang
Director of Investor Relations
Good afternoon, investors, and welcome to the AAC Technologies 2025 Annual Results Announcement Investor Conference. I’m the host of this event, Joyce Huang, IR Director at AAC Technologies.
First, on behalf of the company, thank you all for your interest in AAC. Please allow me to introduce the company management present today. Mr. Benjamin Pan, Executive Director and CEO of AAC Technologies; Mr. Kelvin Pan, Executive Vice President of AAC Technologies; Ms. Dan Guo, Chief Financial Officer of AAC Tech; Mr. Jack Duan, Chairman of AAC Optics; and Mr. Shi Tingjia, Senior Vice President of Strategy of AAC Tech. Thanks, management’s attendance.
Today’s meeting includes 2 parts, starting with my presentation on AAC 2025 annual financial performance and business development. This will be followed by a Q&A session. The statements made at this meeting contain forward-looking information, which are based on the company’s assumptions and expectations regarding market conditions and the company’s current development. [Operator Instructions]
Next, I would like to present the group’s results for 2025. In 2025, the group’s revenue was RMB 30.8 billion (sic) [ RMB 31.82 billion ] a rapid year-on-year increase of 16.4%. Acoustics [indiscernible] optics has business maintained strong performance and emerging business made huge leaps. Gross profit was RMB 7.02 billion, up 16% year-on-year. The group’s

I started my career in asset management one year before the GFC. Since then, I have accumulated knowledge and extensive experience in financial analysis and portfolio management of equity, government bond, corporate bond, and money market funds. Fascinated by psychology and the way we make investment decisions. Passionate about sharing my knowledge. Please note that due to my financial institution’s compliance requirements, I mainly do not invest in any kind of single stocks but only ETFs.
Analyst’s Disclosure: I/we have no stock, option or similar derivative position in any of the companies mentioned, and no plans to initiate any such positions within the next 72 hours. I wrote this article myself, and it expresses my own opinions. I am not receiving compensation for it (other than from Seeking Alpha). I have no business relationship with any company whose stock is mentioned in this article.
Seeking Alpha’s Disclosure: Past performance is no guarantee of future results. No recommendation or advice is being given as to whether any investment is suitable for a particular investor. Any views or opinions expressed above may not reflect those of Seeking Alpha as a whole. Seeking Alpha is not a licensed securities dealer, broker or US investment adviser or investment bank. Our analysts are third party authors that include both professional investors and individual investors who may not be licensed or certified by any institute or regulatory body.

Walk into any of the more than 440 Hungry Jack’s restaurants scattered across Australia and you’ll order a Whopper, fries and a Coke — exactly as you would at a Burger King anywhere else in the world. Yet the iconic American fast-food chain operates under a completely different name Down Under, a quirk that has puzzled international visitors for decades.

The story behind the name traces back more than 50 years to a trademark clash, a clever workaround involving pancake mix and a long-running legal battle that ultimately strengthened the Australian operation. As of March 2026, Hungry Jack’s remains the sole master franchise of Burger King Corporation in Australia, proudly Aussie-owned and deeply embedded in local culture while serving the same flame-grilled burgers that define the global brand.
The tale begins in 1970 when Canadian-born entrepreneur Jack Cowin secured the rights to bring Burger King to Australia. Cowin, who had already helped introduce KFC to the country, planned to open the first outlet in 1971. But he quickly discovered a major obstacle: the “Burger King” name was already trademarked in Australia by a local businessman named Don Dervan.
Dervan, an American immigrant, had opened a small drive-in takeaway restaurant called Burger King in Adelaide, South Australia, as early as 1962. At the time, the U.S. Burger King had not yet trademarked the name in Australia, allowing Dervan to register it locally. By the early 1970s, his operation had grown to about 17 locations. Dervan refused to sell or relinquish the trademark, telling representatives he would part with everything except the name.
Unable to use its global brand, Burger King — then owned by Pillsbury — provided Cowin with a list of alternative names based on existing trademarks the company already held. Cowin selected “Hungry Jack,” the name of a popular Pillsbury pancake mix sold in the United States. He tweaked it slightly to the possessive “Hungry Jack’s” and launched the first Australian restaurant in Innaloo, Perth, on April 18, 1971.
The rebranding proved successful. Hungry Jack’s expanded rapidly, building a strong local identity while delivering the same menu items as its American counterpart. The name stuck, becoming a familiar part of Australian fast-food culture alongside rivals like McDonald’s.
The 1990s Legal Battle
The situation grew more complicated in the 1990s when the original Australian “Burger King” trademark held by Dervan’s business lapsed. Burger King Corporation saw an opportunity and attempted to enter the market directly under its own name. The company opened several standalone Burger King outlets, mostly in New South Wales, while simultaneously blocking Hungry Jack’s from expanding by denying approval for new locations under the franchise agreement.
This move sparked a bitter legal dispute. Hungry Jack’s Pty Ltd, controlled by Cowin, sued Burger King Corporation, alleging breach of the franchise agreement and bad faith conduct. In a landmark 2001 ruling, Australian courts sided with Hungry Jack’s. The judge found that Burger King had acted improperly by trying to undermine its own franchisee while competing directly against it.
The court awarded Hungry Jack’s substantial damages — reports at the time cited around $45 million to $71 million — and upheld the franchise agreement. Burger King ultimately withdrew its competing stores, which were rebranded as Hungry Jack’s. By 2002-2003, the parent company had effectively conceded the Australian market, leaving Hungry Jack’s as the undisputed operator.
The episode became a classic David-versus-Goliath story in Australian business circles, highlighting issues of good faith in franchise relationships. It also demonstrated the power of local branding and customer loyalty. By then, Australians had embraced Hungry Jack’s as their own, making a full switch to the Burger King name impractical and unnecessary.
Hungry Jack’s Today
In 2026, Hungry Jack’s operates as a wholly owned subsidiary of Competitive Foods Australia, still led by the Cowin family interests. The chain employs more than 19,000 people and serves over 1.7 million customers weekly, grilling more than 125 million Australian beef patties each year. Its menu closely mirrors global Burger King offerings, including the Whopper, but with occasional Australia-specific items and promotions that reflect local tastes.
The restaurants maintain the same flame-grilled burgers, generous portions and quick-service model that define the brand worldwide. Hungry Jack’s has adapted to modern trends with plant-based options, breakfast menus and digital ordering while preserving the core experience that made it popular.
The name difference occasionally confuses tourists, who search for “Burger King” only to be directed to Hungry Jack’s. Many international visitors discover the quirk through social media or travel forums and leave with stories of the “Australian Burger King that isn’t called Burger King.”
Legal experts note that the case remains a notable example in franchise and trademark law, illustrating how early registration of names can shape international expansion and how courts can protect long-standing franchise relationships from bad-faith actions by franchisors.
Cultural Impact and Legacy
Over five decades, Hungry Jack’s has become more than a fast-food outlet — it is a piece of Australian pop culture. The distinctive red and yellow branding, the “Have It Your Way” ethos (adapted locally) and memorable advertising campaigns have cemented its place alongside other homegrown or localized chains.
The story also serves as a cautionary tale for global brands: failing to secure trademarks in every market can lead to unexpected complications. Similar quirks have occurred with other companies, such as Woolworths, where an Australian retailer adopted the name after the U.S. version did not trademark it locally.
As of March 2026, there are no active plans to rebrand Hungry Jack’s to Burger King. The Australian operation thrives under its established name, benefiting from decades of customer familiarity and loyalty. The chain continues to expand selectively, focusing on prime locations and adapting to changing consumer preferences around sustainability, convenience and menu innovation.
For visitors and locals alike, stepping into a Hungry Jack’s offers the familiar taste of a Whopper while highlighting one of the more unusual chapters in global fast-food history. The name may differ, but the flame-grilled experience remains unmistakably consistent with Burger King restaurants worldwide.
The enduring success of Hungry Jack’s proves that sometimes the best-laid corporate plans can be upended by a single trademark — and that a clever alternative, combined with strong local management and customer support, can create something even more iconic in its own right.
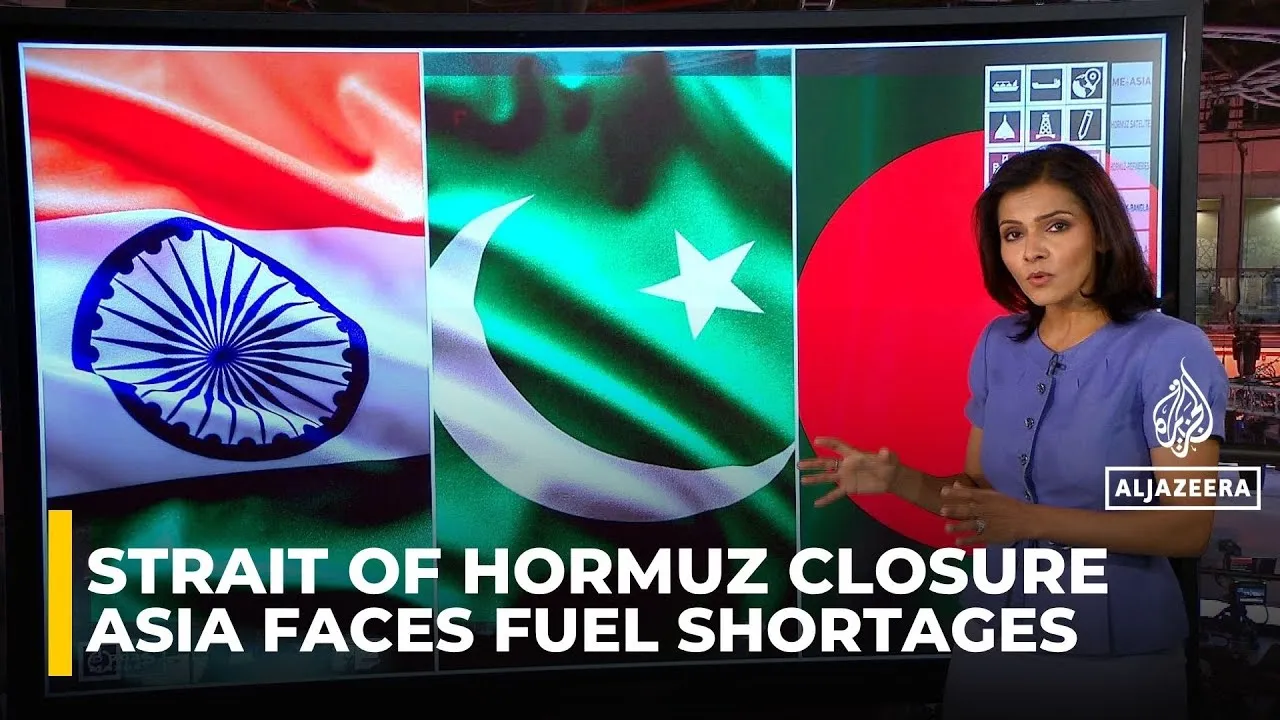
The US-Israel conflict with Iran has disrupted global energy, especially in Asia, as Iran blocks the Strait of Hormuz, limiting 20% of oil shipments. Countries like India, China, Japan, and South Korea are adopting strategies such as stockpiling, subsidies, or seeking alternative sources. Vietnam and the Philippines face severe shortages amid rising fuel prices and supply disruptions
Impact of Middle East War on Asian Energy Security
The ongoing conflict in the Middle East has severely affected Asia, the world’s largest consumer of Middle Eastern oil. The Strait of Almos, a critical energy corridor where about 20% of global oil and gas supplies pass, has seen disruptions since Iran effectively shut it down, blocking shipments primarily destined for Asian nations. Attacks on energy infrastructure across the region have further reduced production, heightening concerns over energy shortages across Asian countries.
Diverse Responses Among Asian Countries
Asian nations are responding differently to the crisis. India, Pakistan, and Bangladesh face significant challenges due to their heavy dependence on Gulf energy supplies; India has invoked emergency measures and turned to unsanctioned Russian supplies. In contrast, China has managed better, thanks to pre-war stockpiles and its ongoing trade with Iran and Russia. Japan, South Korea, and Taiwan have implemented energy voucher programs and reserve strategies, while Thailand and Indonesia have introduced fuel caps and subsidies to stabilize prices.
Struggling Nations and Strategic Measures
In Thailand, an oil shock caused by disruptions in the Strait of Hormuz could have several noticeable effects:
1. Higher Fuel Prices
- At the pump: Gasoline and diesel prices would likely rise quickly, making it more expensive to drive cars, motorbikes, and trucks.
- Transportation costs: Taxis, buses, and delivery services would charge more, affecting daily commutes and the cost of goods.
2. Increased Cost of Living
- Food prices: Since food is transported by trucks and ships, higher fuel costs can make groceries more expensive.
- Electricity bills: Thailand uses oil for some electricity generation, so bills could go up.
3. Impact on Tourism
- Air travel: Higher jet fuel prices could make flights more expensive, potentially reducing the number of tourists visiting Thailand.
- Local travel: Tourists and locals might cut back on trips if fuel and transport costs rise.
Vietnam and the Philippines are among the most vulnerable, with limited reserves and declared energy emergencies to control distribution. Vietnam’s reserves last about 20 days, while the Philippines’ president has empowered authorities to prioritize fuel distribution amid shortages. These measures reflect the varying degrees of energy security challenges faced by Asian nations amid the Middle Eastern conflict.
Other People are Reading

How Too Many Drivers Spoil UGL
Sandy Qin
Director of Investor Relations
Distinguished investors, analysts and friends from the media, good day. I am Sandy Qin, Investor Relations Director of Bairong. I sincerely thank all investors joining us online for your continued attention to Bairong. The company released its 2025 annual results announcement after the market closed yesterday, March 26. In this results presentation, we’ll report and share the company’s operating achievements for 2025, look ahead to 2026 and answer questions of interest.
This results presentation consists of 3 parts. The first part features the CEO introducing business progress and outlook. The second part features the CSO explaining financial performance. The final part is the Q&A session.
[Operator Instructions] Management will answer questions after the presentation.
This presentation contains forward-looking statements reflecting the company’s current beliefs and expectations about the future. These statements include words like anticipate, believe, intend, estimate, expect and words with similar meanings. All statements in this presentation, other than historical facts, are forward-looking statements. These forward-looking statements reflect only the views of the company’s management as of the date of this presentation and are not guarantees of future performance. The company, any member of the group or any of their relevant affiliated parties or any of their respective directors, officers, employees, advisers or representatives assumes no obligation and expressly disclaims any obligation or commitment to disseminate any updates or revisions to any forward-looking statements.
Now I’ll introduce the company’s management attending this result briefing. They are Mr. Zhang Shaofeng, Founder, Chairman of the Board and Chief Executive

Goldman Sachs upgrades Nokia stock rating on AI infrastructure growth

Australia’s thriving coffee culture, long dominated by independent cafes, continues to support a select group of national and international franchises in 2026. While 95% of the nation’s approximately 14,600 coffee shops remain independent, franchised operations capture significant market share through consistent branding, extensive networks and convenient locations in shopping centres and high streets.
McCafé leads by a wide margin as the dominant player, leveraging its integration with McDonald’s restaurants. Other established names like The Coffee Club, Gloria Jean’s Coffees and Soul Origin maintain strong presences, offering franchise opportunities amid growing demand for specialty coffee, breakfast menus and digital ordering.
Here is a ranked list of the top 10 coffee franchises operating in Australia as of March 2026, based on store numbers, franchise availability, market impact and recent performance data. Rankings prioritize scale and franchising model while noting quality recognitions where relevant.

- McCafé (part of McDonald’s) — With well over 1,000 locations nationwide, McCafé remains Australia’s largest coffee operation. Integrated into McDonald’s outlets, it serves millions daily with accessible espresso-based drinks, cold brews and breakfast items. Its scale and low price point make it a go-to for quick service, though critics note it trails specialty independents in bean quality.
- The Coffee Club — Australia’s largest home-grown café franchise operates around 200-250 stores domestically (with over 400 locations across 9-13 countries including New Zealand and Thailand). Founded in Brisbane in 1989, it offers a full café menu alongside coffee, with recent refurbishments focusing on modern interiors and digital ordering. The chain targets a “meeting place” experience and continues selective expansion.
- Gloria Jean’s Coffees — Owned by Retail Food Group, this brand has approximately 116-140 stores in Australia as of early 2026, part of a global network exceeding 500-600 outlets. Known for premium blends and a cozy atmosphere, Gloria Jean’s has refreshed store designs with emphasis on digital ordering and sustainability initiatives, including Rainforest Alliance-certified beans. It remains a popular franchise choice for investors.
- Soul Origin — A standout Australian-owned specialty coffee franchise with dozens of outlets, Soul Origin emphasizes high-quality locally roasted blends and café-style food. It frequently ranks among top franchise recommendations for its strong brand support and appeal to urban customers seeking elevated experiences at accessible prices.
- Muffin Break — Part of the Retail Food Group portfolio, this bakery-café hybrid operates hundreds of locations across Australia and New Zealand. While famous for muffins, it serves a solid coffee range and light meals, making it a reliable franchise in shopping centres and transport hubs.
- Hudson’s Coffee — An established player with a network of airport, shopping centre and CBD outlets, Hudson’s focuses on quick-service premium coffee and snacks. It appeals to busy commuters and travellers with consistent quality and convenient locations.
- Dôme — Based in Perth with over 65 stores, primarily in Western Australia, Dôme offers a European-inspired café experience with strong coffee and all-day dining. Its franchise model supports regional expansion and loyal local followings.
- Muzz Buzz — A drive-thru focused franchise popular in suburban and regional areas, Muzz Buzz delivers fast coffee service with a streamlined menu. It suits franchisees seeking lower overheads and high-volume takeaway trade.
- Cibo Espresso — With around 30 outlets (some recently acquired by Retail Food Group for conversion to Gloria Jean’s), Cibo provides Italian-style espresso and café fare. Its compact footprint works well in urban settings.
- The Coffee Emporium — A 100% Australian-owned franchise with about 30 stores, it reports strong average sales and serves millions of coffees annually. It positions itself as a premium, consistent option for franchise partners.
Market Trends Shaping 2026
Australia’s coffee shop industry generates billions annually, with consumers increasingly seeking quality beans, sustainable practices and convenient digital experiences. Franchise operators have responded with store refurbishments, enhanced loyalty programs and expanded plant-based or cold drink options. While independent cafés dominate quality awards — with seven Australian venues making the World’s 100 Best Coffee Shops list for 2026, including Only Coffee Project (4th) and Toby’s Estate (5th) — franchises excel in accessibility and scale.
Challenges include rising operating costs, competition from independents and evolving consumer preferences for specialty roasts. Successful franchises invest heavily in training, supply chain consistency and store design. Retail Food Group, for instance, continues consolidating smaller brands under stronger banners like Gloria Jean’s.
Franchise opportunities remain attractive for entrepreneurs, with entry costs varying from several hundred thousand dollars depending on location and fit-out. Support typically includes brand marketing, supplier deals and operational training. However, prospective franchisees should conduct thorough due diligence, as success depends on location, local competition and management execution.
Quality vs Scale
Australia’s coffee reputation stems from its independent scene, where roasters like Vittoria, Campos and Toby’s Estate set high standards. Franchises bridge the gap by bringing consistency and convenience, particularly in regional areas and major retail precincts. McCafé and The Coffee Club serve volume-driven customers, while Gloria Jean’s and Soul Origin target those willing to pay a premium for atmosphere and bean quality.
Recent data shows franchise growth through refurbishments and selective openings rather than rapid expansion. Digital tools, including app-based ordering and contactless payments, have become standard to improve throughput and customer experience.
Looking Ahead
As 2026 progresses, expect continued focus on sustainability, with more chains highlighting ethical sourcing and eco-friendly packaging. Cold drinks and breakfast offerings will likely drive growth amid shifting habits. While independents claim global acclaim, franchises provide stable investment options and nationwide reach.
For consumers, the choice between franchise reliability and independent innovation defines Australia’s vibrant coffee landscape. For aspiring business owners, established brands offer proven models in a market where coffee remains a daily ritual for millions.
Whether grabbing a quick flat white at McCafé or enjoying a leisurely latte at Gloria Jean’s, Australia’s top coffee franchises play an essential role in satisfying the nation’s sophisticated palates while delivering commercial scale.
New discoveries are showing how human anatomy is far from settled

MLPI Vs. AMLP: Why NEOS Is The New Leader Among Midstream ETFs (BATS:MLPI)

Detroit Set to Enter Michigan‘s Battle against Coinbase Prediction Markets

Smart energy pays enters the US market, targeting scalable financial infrastructure

Why Israel is blocking foreign journalists from entering

Bitcoin: We’re Entering The Most Dangerous Phase

Mine Bitcoin 5X Cheaper Without Rigs? How to Stake HNO Coin #bitcoinmining #Crypto #Altcoin #shorts

Business Studies Class 12: Financial Markets One Shot NCERT Revision | CBSE 2026

COCKROACHES in the Financial System! (Private Credit)
-
 NewsBeat3 days ago
Manchester United reach agreement with Casemiro over contract clause amid transfer speculation
-

 Crypto World6 days ago
Best Crypto to Buy Now: Strategy Just Spent $1.57 Billion on Bitcoin During Fear While Early Investors Quietly Enter Pepeto for 150x Potential
-

 Crypto World6 days ago
Bitcoin Price News: Bhutan Sells $72 Million in BTC Under Fiscal Pressure, but the Smart Money Entering Pepeto Sees What the Market Does Not
-

 News Videos2 days ago
Parliament publishes latest register of MPs’ financial interests
-

 Sports5 days ago
Remo Stars and Kano Pillars Strengthen Survival Hopes in NPFL
-

 Sports4 days ago
Gary Kirsten Accuses Pakistan Cricket Board Of ‘Interference’, Mohsin Naqvi Responds
-

 Business5 days ago
No Winner in March 21 Drawing as Prize Rolls to $133 Million for Next
-

 Tech5 days ago
Give Your Phone a Huge (and Free) Upgrade by Switching to Another Keyboard
-

 Tech5 days ago
AI enters the chat: New Seattle dating app relies on tech to facilitate meaningful human connections
-

 News Videos4 days ago
Ch 9 Financial Management Part 1 | Detailed One Shot | Class 12 Business Studies Boards 2026
-

 Tech6 days ago
Today’s NYT Connections Hints, Answers for March 22 #1015
-

 Business1 day ago
Instagram, YouTube Found Responsible for Teen’s Mental Health Struggle in Historic Ruling
-

 Business6 days ago
Will Duke Basketball Win It All? Duke Basketball Enters Second Round as Third Favorite to Claim NCAA Title
-

 Sports5 days ago
2026 Kentucky Derby horses, odds, futures, preview, date: Expert who hit 12 Derby-Oaks Doubles enters picks
-
 NewsBeat5 days ago
Update on Wisbech river crash as search for teenage boy enters fifth day
-
 Entertainment4 days ago
Cynthia Bailey Dishes on ‘RHOA’ Season 17, Discusses Kandi
-

 Tech4 days ago
Samsung will soon let you control smart home devices from your car’s dashboard
-
 NewsBeat2 days ago
Tesco is selling new Cadbury Dairy Milk bar and people can’t wait to try it
-

 NewsBeat7 days ago
The 3 airlines that have entered insolvency in 2026 so far
-

 Tech6 days ago
SteamOS update adds support for Steam Machine and other non-Valve hardware
You must be logged in to post a comment Login