
Business
Thomson Reuters Reports Fourth-Quarter and Full-Year 2025 Results
- Solid revenue momentum continued in the fourth quarter and full year 2025
- Full-year total company revenues up 3% / organic revenues up 7%
- Fourth-quarter total company revenues up 5% / organic revenues up 7%
- Organic revenues up 9% for the “Big 3” segments (Legal Professionals, Corporates and Tax, Audit & Accounting Professionals) in the fourth quarter and full year
- Met full-year 2025 outlook for organic revenue growth and adjusted EBITDA margin for total company and “Big 3”; Met free cash flow outlook
- Full-year 2026 outlook anticipates organic revenue growth of approximately 7.5% – 8.0% and adjusted EBITDA margin expansion of approximately 100 basis points from 39.2% in 2025
- Increased annualized dividend by 10% to
$2.62 per common share (33rd consecutive annual increase)
“Our fourth‑quarter results capped a year of important progress for
Hasker added, “We remain focused on allocating capital to drive long-term shareholder value creation. Last year we executed several strategic acquisitions and continued to return capital to shareholders, enabling us to enter this year with a stronger and more strategically aligned portfolio with improved growth prospects.”
Consolidated Financial Highlights – Three Months Ended
|
Three months ended |
||||||||||
|
(Millions of |
||||||||||
|
(unaudited) |
||||||||||
|
IFRS Financial Measures(1) |
2025 |
2024 |
Change |
|||||||
|
Revenues |
|
|
5 % |
|||||||
|
Operating profit |
|
|
-25 % |
|||||||
|
Diluted earnings per share (EPS) |
|
|
-43 % |
|||||||
|
Net cash provided by operating activities |
|
|
35 % |
|||||||
|
Non-IFRS Financial Measures(1) |
2025 |
2024 |
Change |
Change at |
||||||
|
Revenue growth in constant currency |
5 % |
|||||||||
|
Organic revenue growth |
7 % |
|||||||||
|
Adjusted EBITDA |
|
|
8 % |
8 % |
||||||
|
Adjusted EBITDA margin |
38.7 % |
37.6 % |
110bp |
140bp |
||||||
|
Adjusted EPS |
|
|
6 % |
7 % |
||||||
|
Free cash flow |
|
|
38 % |
|||||||
|
(1) In addition to results reported in accordance with International Financial Reporting Standards (IFRS), the company uses certain non- |
||||||||||
Revenues increased 5% due to 6% growth in recurring revenues (84% of total revenues) and 11% growth in transactions revenues, partly offset by a 6% decline in Global Print. Total company revenue growth was negatively impacted by net acquisitions and disposals of 3%. Foreign currency had a slightly positive impact on revenue growth.
- Organic revenues increased 7% reflecting 9% growth in recurring revenues, 8% growth in transactions revenues and a 6% decline in Global Print.
- The company’s “Big 3” segments reported organic revenue growth of 9% and collectively comprised 82% of total revenues.
Operating profit decreased 25% primarily due to other operating gains in the prior-year period substantially related to the sale of
- Adjusted EBITDA, which excludes other operating gains, amortization of software, as well as other adjustments, increased 8% and the related margin increased to 38.7% from 37.6% in the prior-year period, primarily due to higher operating leverage. Foreign currency negatively impacted the year-over-year change in adjusted EBITDA margin by 30 basis points.
Diluted EPS decreased to
- Adjusted EPS, which excludes net other operating gains, other finance costs or income, as well as other adjustments, increased to
$1.07 per share compared to$1.01 per share in the prior-year period, primarily due to higher adjusted EBITDA, partly offset by higher amortization of internally developed software and interest expense.
Net cash provided by operating activities increased by
- Free cash flow increased by
$156 million as higher net cash provided by operating activities was partly offset by lower cash flows from other investing activities, which included a cash flow benefit in the prior-year period.
Highlights by Customer Segment – Three Months Ended
|
(Millions of |
||||||||||||
|
(unaudited) |
||||||||||||
|
Three months ended |
Change |
|||||||||||
|
2025 |
2024 |
Total |
Constant |
Organic(1)(2) |
||||||||
|
Revenues |
||||||||||||
|
Legal Professionals |
|
|
1 % |
1 % |
9 % |
|||||||
|
Corporates |
496 |
458 |
8 % |
7 % |
9 % |
|||||||
|
Tax, Audit & Accounting Professionals |
414 |
366 |
13 % |
13 % |
11 % |
|||||||
|
“Big 3” Segments Combined(1) |
1,648 |
1,553 |
6 % |
5 % |
9 % |
|||||||
|
|
232 |
218 |
7 % |
6 % |
5 % |
|||||||
|
Global Print |
136 |
144 |
-6 % |
-6 % |
-6 % |
|||||||
|
Eliminations/Rounding |
(7) |
(6) |
||||||||||
|
Total Revenues |
|
|
5 % |
5 % |
7 % |
|||||||
|
Adjusted EBITDA(1) |
||||||||||||
|
Legal Professionals |
|
|
9 % |
9 % |
||||||||
|
Corporates |
160 |
153 |
4 % |
4 % |
||||||||
|
Tax, Audit & Accounting Professionals |
222 |
196 |
14 % |
13 % |
||||||||
|
“Big 3” Segments Combined(1) |
709 |
648 |
9 % |
9 % |
||||||||
|
|
48 |
45 |
7 % |
12 % |
||||||||
|
Global Print |
54 |
55 |
-2 % |
-2 % |
||||||||
|
Corporate costs |
(34) |
(30) |
n/a |
n/a |
||||||||
|
Total Adjusted EBITDA |
|
|
8 % |
8 % |
||||||||
|
Adjusted EBITDA Margin(1) |
||||||||||||
|
Legal Professionals |
44.3 % |
41.0 % |
330bp |
350bp |
||||||||
|
Corporates |
32.2 % |
33.5 % |
-130bp |
-70bp |
||||||||
|
Tax, Audit & Accounting Professionals |
53.6 % |
53.4 % |
20bp |
0bp |
||||||||
|
“Big 3” Segments Combined(1) |
43.0 % |
41.7 % |
130bp |
150bp |
||||||||
|
|
21.0 % |
20.8 % |
20bp |
140bp |
||||||||
|
Global Print |
39.6 % |
38.2 % |
140bp |
160bp |
||||||||
|
Total Adjusted EBITDA Margin |
38.7 % |
37.6 % |
110bp |
140bp |
||||||||
|
(1) See the “Non-IFRS Financial Measures” section and the tables appended to this news release for additional information on these and |
||||||||||||
|
(2) Computed for revenue growth only. |
||||||||||||
|
n/a: not applicable |
||||||||||||
Unless otherwise noted, all revenue growth comparisons by customer segment in this news release are at constant currency (which excludes the impact of foreign currency) as the company believes this provides the best basis to measure performance.
Legal Professionals
Revenues increased 1% despite the disposal of
- Recurring revenues increased 1% (97% of total, increased 8% organic). Organic revenue growth was primarily driven by Westlaw, CoCounsel and
Practical Law . - Transactions revenues were essentially unchanged (3% of total, increased 28% organic).
Adjusted EBITDA increased 9% to
- The margin increased to 44.3% from 41.0% primarily reflecting higher operating leverage as well as the disposal of the lower margin FindLaw business in the prior-year period.
Corporates
Revenues increased 7% despite a negative impact from the sale of certain non-core businesses. Organic revenues increased 9%.
- Recurring revenues increased 7% (88% of total, increased 9% organic). Organic revenue growth was primarily driven by Indirect Tax, Direct Tax, Westlaw,
Practical Law ,Pagero and the segment’s international businesses. - Transactions revenues increased 7% (12% of total, all organic). Organic revenue growth was primarily driven by increases in Indirect Tax, Global Trade and the segment’s international businesses.
Adjusted EBITDA increased 4% to
Tax, Audit & Accounting Professionals
Revenues increased 13%, including the acquisition impact of SafeSend which was reflected in transactions revenues. Organic revenue growth was 11%.
- Recurring revenues increased 12% (86% of total, all organic). Organic revenue growth was primarily driven by UltraTax, CoCounsel and the segment’s
Latin America business. - Transactions revenues increased 19% (14% of total, increased 3% organic). Organic revenue growth was primarily driven by SafeSend and the segment’s international businesses.
Adjusted EBITDA increased 14% to
The Tax, Audit & Accounting Professionals segment is the company’s most seasonal business with approximately 60% of full-year revenues typically generated in the first and fourth quarters. As a result, the margin performance of this segment has been generally higher in the first and fourth quarters as costs are typically incurred in a more linear fashion throughout the year.
Revenues increased 6% (5% organic), primarily due to higher generative AI related transactional content licensing revenue in the Agency business, as well as a contractual price increase from the company’s news agreement with the Data & Analytics business of London Stock Exchange Group (LSEG).
Adjusted EBITDA increased 7% to
Global Print
Revenues decreased 6%, all organic, driven by lower shipment volumes.
Adjusted EBITDA decreased 2% to
Corporate Costs
Corporate costs were
Consolidated Financial Highlights – Year Ended
|
Year ended |
||||||||||
|
(Millions of |
||||||||||
|
(unaudited) |
||||||||||
|
IFRS Financial Measures(1) |
2025 |
2024 |
Change |
|||||||
|
Revenues |
|
|
3 % |
|||||||
|
Operating profit |
|
|
1 % |
|||||||
|
Diluted EPS |
|
|
-32 % |
|||||||
|
Net cash provided by operating activities |
|
|
8 % |
|||||||
|
Non-IFRS Financial Measures(1) |
2025 |
2024 |
Change |
Change at |
||||||
|
Revenue growth in constant currency |
3 % |
|||||||||
|
Organic revenue growth |
7 % |
|||||||||
|
Adjusted EBITDA |
|
|
6 % |
5 % |
||||||
|
Adjusted EBITDA margin |
39.2 % |
38.2 % |
100bp |
80bp |
||||||
|
Adjusted EPS |
|
|
4 % |
4 % |
||||||
|
Free cash flow |
|
|
7 % |
|||||||
|
(1) In addition to results reported in accordance with IFRS, the company uses certain non-IFRS financial measures as supplemental |
||||||||||
Revenues increased 3% due to 3% growth in recurring revenues (81% of total revenues) and 5% growth in transactions revenues, partly offset by a 6% decline in Global Print. Total company revenue growth was negatively impacted by net acquisitions and disposals of 4%. Foreign currency had no impact on revenue growth.
- Organic revenues increased 7% reflecting 9% growth in recurring revenues, 4% growth in transactions revenues and a 5% decline in Global Print.
- The company’s “Big 3” segments reported organic revenue growth of 9% and collectively comprised 82% of total revenues.
Operating profit increased 1% primarily driven by the net impact of higher revenues and operating expenses, partially offset by higher amortization of software.
- Adjusted EBITDA, which excludes amortization of software, as well as other adjustments, increased 6% and the related margin increased to 39.2% from 38.2%, primarily due to higher operating leverage. Foreign currency contributed 20 basis points to the year-over-year change in adjusted EBITDA margin.
Diluted EPS decreased to
- Adjusted EPS, which excludes the non-cash tax benefit, as well as other adjustments, increased to
$3.92 per share compared to$3.77 per share in the prior year, primarily due to higher adjusted EBITDA, partly offset by higher amortization of internally developed software, income tax expense and interest expense.
Net cash provided by operating activities increased by
- Free cash flow increased by
$122 million as higher net cash provided by operating activities was partly offset by higher capital expenditures and lower cash flows from other investing activities.
Highlights by Customer Segment – Year Ended
|
(Millions of |
||||||||||||
|
(unaudited) |
||||||||||||
|
Year ended |
Change |
|||||||||||
|
2025 |
2024 |
Total |
Constant |
Organic(1)(2) |
||||||||
|
Revenues |
||||||||||||
|
Legal Professionals |
|
|
-2 % |
-2 % |
8 % |
|||||||
|
Corporates |
1,987 |
1,844 |
8 % |
7 % |
9 % |
|||||||
|
Tax, Audit & Accounting Professionals |
1,302 |
1,165 |
12 % |
13 % |
11 % |
|||||||
|
“Big 3” Segments Combined(1) |
6,157 |
5,931 |
4 % |
4 % |
9 % |
|||||||
|
|
853 |
832 |
3 % |
2 % |
1 % |
|||||||
|
Global Print |
490 |
519 |
-6 % |
-5 % |
-5 % |
|||||||
|
Eliminations/Rounding |
(24) |
(24) |
||||||||||
|
Total Revenues |
|
|
3 % |
3 % |
7 % |
|||||||
|
Adjusted EBITDA(1) |
||||||||||||
|
Legal Professionals |
|
|
4 % |
3 % |
||||||||
|
Corporates |
716 |
671 |
7 % |
6 % |
||||||||
|
Tax, Audit & Accounting Professionals |
623 |
527 |
18 % |
19 % |
||||||||
|
“Big 3” Segments Combined(1) |
2,695 |
2,500 |
8 % |
7 % |
||||||||
|
|
174 |
196 |
-11 % |
-11 % |
||||||||
|
Global Print |
185 |
188 |
-2 % |
-2 % |
||||||||
|
Corporate costs |
(118) |
(105) |
n/a |
n/a |
||||||||
|
Total Adjusted EBITDA |
|
|
6 % |
5 % |
||||||||
|
Adjusted EBITDA Margin(1) |
||||||||||||
|
Legal Professionals |
47.3 % |
44.6 % |
270bp |
250bp |
||||||||
|
Corporates |
36.0 % |
36.3 % |
-30bp |
-30bp |
||||||||
|
Tax, Audit & Accounting Professionals |
47.1 % |
45.2 % |
190bp |
150bp |
||||||||
|
“Big 3” Segments Combined(1) |
43.6 % |
42.1 % |
150bp |
130bp |
||||||||
|
|
20.4 % |
23.6 % |
-320bp |
-290bp |
||||||||
|
Global Print |
37.7 % |
36.2 % |
150bp |
120bp |
||||||||
|
Total Adjusted EBITDA Margin |
39.2 % |
38.2 % |
100bp |
80bp |
||||||||
|
(1) See the “Non-IFRS Financial Measures” section and the tables appended to this news release for additional information on these and |
||||||||||||
|
(2) Computed for revenue growth only. |
||||||||||||
|
n/a: not applicable |
||||||||||||
2026 Outlook
The company’s outlook for 2026 in the table below assumes constant currency rates and does not factor in the impact of any future acquisitions or dispositions that may occur during the year.
The company expects its first-quarter 2026 organic revenue growth to be approximately 7% and its adjusted EBITDA margin to be approximately 42%.
The company’s 2026 outlook is forward-looking information that is subject to risks and uncertainties (see “Special Note Regarding Forward-Looking Statements, Material Risks and Material Assumptions”). In particular, the company continues to operate in an uncertain macroeconomic environment, reflecting ongoing geopolitical risk, uneven economic growth and an evolving interest rate and inflationary backdrop. Any worsening of the global economic or business environment, among other factors, could impact the company’s ability to achieve its outlook.
Reported Full-Year 2025 Results and Full-Year 2026 Outlook
|
Total |
FY 2025 Reported |
FY 2026 Outlook |
|
Total Revenue Growth |
3%(2) |
7.5% – 8.0% |
|
Organic Revenue Growth(1) |
7 % |
7.5% – 8.0% |
|
Adjusted EBITDA Margin(1) |
39.2 % |
+100bps vs 2025 |
|
Corporate Costs |
|
|
|
Free Cash Flow(1) |
|
~ |
|
Accrued Capex as % of Revenues(1) |
8.2 % |
~ 8.0% |
|
Depreciation & Amortization of Software Depreciation & Amortization of Amortization of |
|
|
|
Net Interest Expense |
|
|
|
Effective Tax Rate on Adjusted Earnings(1) |
18.5 % |
~ 19% |
|
“Big 3” Segments(1) |
FY 2025 Reported |
FY 2026 Outlook |
|
Total Revenue Growth |
4%(2) |
~ 9.5% |
|
Organic Revenue Growth |
9 % |
~ 9.5% |
|
Adjusted EBITDA Margin |
43.6 % |
+100bps vs 2025 |
|
(1) |
Non-IFRS financial measures. See the “Non-IFRS Financial Measures” section below as well as the tables appended to this news release for more information. |
|
(2) |
Total revenue growth reflects the impact of the disposals of |
The information in this section is forward-looking. Actual results, which will include the impact of currency, future acquisitions and dispositions completed during 2026, and macroeconomic events outside of the company’s control may differ materially from the company’s 2026 outlook. The information in this section should also be read in conjunction with the section below entitled “Special Note Regarding Forward-Looking Statements, Material Risks and Material Assumptions.” The company’s 2026 outlook is also based on certain assumptions described in the cross-referenced section, which the company believes are reasonable in the circumstances, and is subject to a number of risks, including those specifically identified in the cross-referenced section and those facing the company generally.
Segment Name Changes
As reflected in this earnings release, the company changed the names of its Tax & Accounting Professionals segment to Tax, Audit & Accounting Professionals and its
Dividends and Common Shares Outstanding
The company announced today that its Board of Directors approved a 10% or
In
NON-IFRS FINANCIAL MEASURES
This news release includes certain non-IFRS financial measures, which include ratios that incorporate one or more non-IFRS financial measures, such as adjusted EBITDA (other than at the customer segment level) and the related margin, free cash flow, adjusted earnings and the effective tax rate on adjusted earnings, adjusted EPS, accrued capital expenditures expressed as a percentage of revenues, net debt and leverage ratio of net debt to adjusted EBITDA, selected measures excluding the impact of foreign currency, changes in revenues computed on an organic basis as well as all financial measures for the “Big 3” segments. The company modified its definition of net debt to account for interest rate swap arrangements entered into during the third quarter of 2025. The change did not have a material impact on its calculation of net debt.
The company’s outlook contains various non-IFRS financial measures. The company believes that providing reconciliations of forward-looking non-IFRS financial measures in its outlook would be potentially misleading and not practical due to the difficulty of projecting items that are not reflective of ongoing operations in any future period. The magnitude of these items may be significant. Consequently, for purposes of its outlook only, the company is unable to reconcile these non-IFRS measures to the most directly comparable IFRS measures because it cannot predict, with reasonable certainty, the impacts of changes in foreign exchange rates which impact (i) the translation of its results reported at average foreign currency rates for the year, and (ii) other finance income or expense related to intercompany financing arrangements. Additionally, the company cannot reasonably predict the occurrence or amount of other operating gains and losses that generally arise from business transactions that the company does not currently anticipate.
ROUNDING
Other than EPS, the company reports its results in millions of
SPECIAL NOTE REGARDING FORWARD-LOOKING STATEMENTS, MATERIAL RISKS AND MATERIAL ASSUMPTIONS
Certain statements in this news release, including, but not limited to, statements in
Some of the material risk factors that could cause actual results or events to differ materially from those expressed in or implied by forward-looking statements in this news release include, but are not limited to, those discussed on pages 16-27 in the “Risk Factors” section of the company’s 2024 annual report. These and other risk factors are discussed in materials that
The company’s business 2026 outlook is based on information currently available to the company and is based on various external and internal assumptions made by the company in light of its experience and perception of historical trends, current conditions and expected future developments, as well as other factors that the company believes are appropriate under the circumstances. Material assumptions and material risks may cause actual performance to differ from the company’s expectations underlying its business outlook. In particular, the global economy has experienced substantial disruption due to concerns regarding economic effects associated with the macroeconomic backdrop and ongoing geopolitical risks. The company’s business outlook assumes that uncertain macroeconomic and geopolitical conditions will continue to disrupt the economy and cause periods of volatility, however, these conditions may last substantially longer than expected and any worsening of the global economic or business environment could impact the company’s ability to achieve its outlook and affect its results and other expectations. Material assumptions related to the company’s revenue outlook are that uncertain macroeconomic and geopolitical conditions will continue to disrupt the economy and cause periods of volatility; there will be a continued need for trusted products and services that help customers navigate evolving and complex legal, tax, audit, accounting, regulatory, geopolitical and commercial changes, developments and environments, and for cloud-based digital tools that drive productivity;
Material risks related to the company’s revenue outlook are that ongoing geopolitical instability and uncertainty regarding interest rates and inflation, continue to impact the global economy. The severity and duration of any one, or a combination, of these conditions could impact the global economy and lead to lower demand for our products and services (beyond our assumption that these disruptions will cause periods of volatility); uncertainty in the legal regulatory regime relating to artificial intelligence (AI) has made it difficult for the company to predict the risks associated with the use of AI in its businesses and products. Future legislation may make it harder for the company to conduct its business using AI, lead to regulatory fines or penalties, require it to change its product offerings or business practices or prevent or limit its use of AI; demand for the company’s products and services could be reduced by changes in customer buying patterns or in its inability to execute on key product design or customer support initiatives; competitive pricing actions and product innovation could impact the company’s revenues; and the company’s sales, commercial simplification and product initiatives may be insufficient to retain customers or generate new sales. Material risks related to the company’s adjusted EBITDA margin outlook are the same as the risks above related to the revenue outlook; higher than expected inflation may lead to greater than anticipated increase in labor costs, third-party supplier costs and costs of print materials; and acquisition and disposal activity may dilute the company’s adjusted EBITDA margin. Material risks related to the company’s free cash flow outlook are the same as the risks above related to the revenue and adjusted EBITDA margin targets; a weaker macroeconomic environment could negatively impact working capital performance, including the ability of the company’s customers to pay; capital expenditures may be higher than currently expected; and the timing and amount of tax payments to governments may differ from the company’s expectations. Material risks related to the company’s effective tax rate on adjusted earnings outlook are the same as the risks above related to adjusted EBITDA; a material change in the geographical mix of the company’s pre-tax profits and losses; a material change in current tax laws or treaties to which the company is subject, and did not expect; resolution of tax audits may cause material changes to assessments of uncertain tax positions as compared to current estimates; and depreciation and amortization of internally developed software as well as net interest expense may be significantly higher or lower than expected.
The company has provided an outlook for the purpose of presenting information about current expectations for the period presented. This information may not be appropriate for other purposes. You are cautioned not to place undue reliance on forward-looking statements which reflect expectations only as of the date of this news release.
Except as may be required by applicable law,
CONTACTS
|
|
|||||||
|
Consolidated Income Statement |
|||||||
|
(millions of |
|||||||
|
(unaudited) |
|||||||
|
Three Months Ended |
Year Ended |
||||||
|
2025 |
2024 |
2025 |
2024 |
||||
|
CONTINUING OPERATIONS |
|||||||
|
Revenues |
|
|
|
|
|||
|
Operating expenses |
(1,231) |
(1,183) |
(4,578) |
(4,471) |
|||
|
Depreciation |
(28) |
(26) |
(111) |
(113) |
|||
|
Amortization of software |
(187) |
(160) |
(721) |
(618) |
|||
|
Amortization of other identifiable intangible assets |
(25) |
(22) |
(98) |
(91) |
|||
|
Other operating gains, net |
2 |
204 |
164 |
144 |
|||
|
Operating profit |
540 |
722 |
2,132 |
2,109 |
|||
|
Finance costs, net: |
|||||||
|
Net interest expense |
(40) |
(28) |
(143) |
(125) |
|||
|
Other finance (costs) income |
(4) |
53 |
(55) |
45 |
|||
|
Income before tax and equity method investments |
496 |
747 |
1,934 |
2,029 |
|||
|
Share of post-tax (losses) earnings in equity method investments |
(5) |
(5) |
(28) |
40 |
|||
|
Tax (expense) benefit |
(158) |
(135) |
(423) |
123 |
|||
|
Earnings from continuing operations |
333 |
607 |
1,483 |
2,192 |
|||
|
(Loss) earnings from discontinued operations, net of tax |
(1) |
(20) |
19 |
15 |
|||
|
Net earnings |
|
|
|
|
|||
|
Earnings (loss) attributable to: |
|||||||
|
Common shareholders |
|
|
|
|
|||
|
Non-controlling interests |
– |
– |
– |
(3) |
|||
|
Earnings per share: |
|||||||
|
Basic earnings (loss) per share: |
|||||||
|
From continuing operations |
|
|
|
|
|||
|
From discontinued operations |
(0.01) |
(0.05) |
0.05 |
0.03 |
|||
|
Basic earnings per share |
|
|
|
|
|||
|
Diluted earnings (loss) per share: |
|||||||
|
From continuing operations |
|
|
|
|
|||
|
From discontinued operations |
(0.01) |
(0.04) |
0.04 |
0.04 |
|||
|
Diluted earnings per share |
|
|
|
|
|||
|
Basic weighted-average common shares |
445,215,119 |
450,077,127 |
448,971,715 |
450,609,712 |
|||
|
Diluted weighted-average common shares |
445,597,771 |
450,600,114 |
449,532,466 |
451,239,490 |
|||
|
|
|||||||
|
Consolidated Statement of Financial Position |
|||||||
|
(millions of |
|||||||
|
(unaudited) |
|||||||
|
|
|
||||||
|
2025 |
2024 |
||||||
|
Assets |
|||||||
|
Cash and cash equivalents |
|
|
|||||
|
Trade and other receivables |
1,143 |
1,087 |
|||||
|
Other financial assets |
94 |
35 |
|||||
|
Prepaid expenses and other current assets |
480 |
400 |
|||||
|
Current assets |
2,228 |
3,490 |
|||||
|
Property and equipment, net |
361 |
386 |
|||||
|
Software, net |
1,645 |
1,453 |
|||||
|
Other identifiable intangible assets, net |
3,102 |
3,134 |
|||||
|
|
7,913 |
7,262 |
|||||
|
Equity method investments |
202 |
269 |
|||||
|
Other financial assets |
466 |
442 |
|||||
|
Other non-current assets |
680 |
625 |
|||||
|
Deferred tax |
1,343 |
1,376 |
|||||
|
Total assets |
|
|
|||||
|
Liabilities and equity |
|||||||
|
Liabilities |
|||||||
|
Current indebtedness |
|
|
|||||
|
Payables, accruals and provisions |
1,090 |
1,091 |
|||||
|
Current tax liabilities |
224 |
197 |
|||||
|
Deferred revenue |
1,251 |
1,062 |
|||||
|
Other financial liabilities |
108 |
113 |
|||||
|
Current liabilities |
3,468 |
3,436 |
|||||
|
Long-term indebtedness |
1,328 |
1,847 |
|||||
|
Provisions and other non-current liabilities |
656 |
675 |
|||||
|
Other financial liabilities |
210 |
232 |
|||||
|
Deferred tax |
364 |
241 |
|||||
|
Total liabilities |
6,026 |
6,431 |
|||||
|
Equity |
|||||||
|
Capital |
3,597 |
3,498 |
|||||
|
Retained earnings |
9,220 |
9,699 |
|||||
|
Accumulated other comprehensive loss |
(903) |
(1,191) |
|||||
|
Total equity |
11,914 |
12,006 |
|||||
|
Total liabilities and equity |
|
|
|||||
|
|
|||||||
|
Consolidated Statement of Cash Flow |
|||||||
|
(millions of |
|||||||
|
(unaudited) |
|||||||
|
Three Months Ended |
Year Ended |
||||||
|
2025 |
2024 |
2025 |
2024 |
||||
|
Cash provided by (used in): |
|||||||
|
Operating activities |
|||||||
|
Earnings from continuing operations |
|
|
|
|
|||
|
Adjustments for: |
|||||||
|
Depreciation |
28 |
26 |
111 |
113 |
|||
|
Amortization of software |
187 |
160 |
721 |
618 |
|||
|
Amortization of other identifiable intangible assets |
25 |
22 |
98 |
91 |
|||
|
Share of post-tax losses (earnings) in equity method investments |
5 |
5 |
28 |
(40) |
|||
|
Net gains on disposals of businesses and investments |
(1) |
(195) |
(165) |
(192) |
|||
|
Deferred tax |
9 |
47 |
60 |
(640) |
|||
|
Other |
49 |
(22) |
272 |
151 |
|||
|
Changes in working capital and other items |
122 |
(76) |
43 |
176 |
|||
|
Operating cash flows from continuing operations |
757 |
574 |
2,651 |
2,469 |
|||
|
Operating cash flows from discontinued operations |
(1) |
(10) |
– |
(12) |
|||
|
Net cash provided by operating activities |
756 |
564 |
2,651 |
2,457 |
|||
|
Investing activities |
|||||||
|
Acquisitions, net of cash acquired |
(20) |
(130) |
(843) |
(622) |
|||
|
Proceeds related to disposals of businesses and investments |
2 |
297 |
254 |
326 |
|||
|
Proceeds from sales of LSEG shares |
– |
– |
– |
1,854 |
|||
|
Capital expenditures |
(158) |
(161) |
(634) |
(607) |
|||
|
Other investing activities |
– |
40 |
1 |
46 |
|||
|
Taxes paid on sales of LSEG shares and disposals |
(29) |
(115) |
(62) |
(317) |
|||
|
Net cash (used in) provided by investing activities |
(205) |
(69) |
(1,284) |
680 |
|||
|
Financing activities |
|||||||
|
Repayments of debt |
– |
– |
(999) |
(290) |
|||
|
Net (repayments) borrowings under short-term loan facilities |
(49) |
– |
290 |
(139) |
|||
|
Payments of lease principal |
(16) |
(17) |
(64) |
(63) |
|||
|
Repurchases of common shares |
(330) |
– |
(1,000) |
(639) |
|||
|
Dividends paid on preference shares |
(1) |
(1) |
(4) |
(5) |
|||
|
Dividends paid on common shares |
(256) |
(236) |
(1,035) |
(944) |
|||
|
Purchase of non-controlling interests |
– |
– |
– |
(384) |
|||
|
Other financing activities |
(6) |
2 |
(16) |
5 |
|||
|
Net cash used in financing activities |
(658) |
(252) |
(2,828) |
(2,459) |
|||
|
Translation adjustments |
– |
(6) |
4 |
(8) |
|||
|
(Decrease) increase in cash and cash equivalents |
(107) |
237 |
(1,457) |
670 |
|||
|
Cash and cash equivalents at beginning of period |
618 |
1,731 |
1,968 |
1,298 |
|||
|
Cash and cash equivalents at end of period |
|
|
|
|
|||
|
|
|||||
|
Reconciliation of Earnings from Continuing Operations to Adjusted EBITDA(1) |
|||||
|
(millions of |
|||||
|
(unaudited) |
|||||
|
Three months ended |
Year ended |
||||
|
2025 |
2024 |
2025 |
2024 |
||
|
Earnings from continuing operations |
|
|
|
|
|
|
Adjustments to remove: |
|||||
|
Tax expense (benefit) |
158 |
135 |
423 |
(123) |
|
|
Other finance costs (income) |
4 |
(53) |
55 |
(45) |
|
|
Net interest expense |
40 |
28 |
143 |
125 |
|
|
Amortization of other identifiable intangible assets |
25 |
22 |
98 |
91 |
|
|
Amortization of software |
187 |
160 |
721 |
618 |
|
|
Depreciation |
28 |
26 |
111 |
113 |
|
|
EBITDA |
|
|
|
|
|
|
Adjustments to remove: |
|||||
|
Share of post-tax losses (earnings) in equity method investments |
5 |
5 |
28 |
(40) |
|
|
Other operating gains, net |
(2) |
(204) |
(164) |
(144) |
|
|
Fair value adjustments* |
(1) |
(8) |
38 |
(8) |
|
|
Adjusted EBITDA(1) |
|
|
|
|
|
|
Adjusted EBITDA margin(1) |
38.7 % |
37.6 % |
39.2 % |
38.2 % |
|
|
* Fair value adjustments primarily represent gains or losses due to changes in foreign currency exchange rates on intercompany balances that arise in the ordinary course of business, which are a component of operating expenses, as well as adjustments related to acquired deferred revenue. |
|
|
|||||
|
Reconciliation of Net Cash Provided By Operating Activities to Free Cash Flow(1) |
|||||
|
(millions of |
|||||
|
(unaudited) |
|||||
|
Three months ended |
Year ended |
||||
|
2025 |
2024 |
2025 |
2024 |
||
|
Net cash provided by operating activities |
|
|
|
|
|
|
Capital expenditures |
(158) |
(161) |
(634) |
(607) |
|
|
Other investing activities |
– |
40 |
1 |
46 |
|
|
Payments of lease principal |
(16) |
(17) |
(64) |
(63) |
|
|
Dividends paid on preference shares |
(1) |
(1) |
(4) |
(5) |
|
|
Free cash flow(1) |
|
|
|
|
|
|
|
|||||||
|
Reconciliation of Capital Expenditures to Accrued Capital Expenditures(1) |
|||||||
|
(millions of |
|||||||
|
(unaudited) |
|||||||
|
Year ended |
|||||||
|
2025 |
|||||||
|
Capital expenditures |
|
||||||
|
Remove: IFRS adjustment to cash basis |
(18) |
||||||
|
Accrued capital expenditures(1) |
|
||||||
|
Accrued capital expenditures as a percentage of revenues(1) |
8.2 % |
||||||
|
(1) Refer to page 21 for additional information on non-IFRS financial measures. |
|
|
|||||
|
Reconciliation of Net Earnings to Adjusted Earnings(1) |
|||||
|
Reconciliation of Total Change in Adjusted EPS to Change in Constant Currency(1) |
|||||
|
(millions of |
|||||
|
(unaudited) |
|||||
|
Three months ended |
Year ended |
||||
|
2025 |
2024 |
2025 |
2024 |
||
|
Net earnings |
|
|
|
|
|
|
Adjustments to remove: |
|||||
|
Fair value adjustments* |
(1) |
(8) |
38 |
(8) |
|
|
Amortization of acquired software |
53 |
38 |
206 |
147 |
|
|
Amortization of other identifiable intangible assets |
25 |
22 |
98 |
91 |
|
|
Other operating gains, net |
(2) |
(204) |
(164) |
(144) |
|
|
Other finance costs (income) |
4 |
(53) |
55 |
(45) |
|
|
Share of post-tax losses (earnings) in equity method investments |
5 |
5 |
28 |
(40) |
|
|
Tax on above items(1) |
(5) |
36 |
(35) |
(9) |
|
|
Tax items impacting comparability(1) |
66 |
5 |
57 |
(478) |
|
|
Loss (earnings) from discontinued operations, net of tax |
1 |
20 |
(19) |
(15) |
|
|
Interim period effective tax rate normalization(1) |
2 |
7 |
– |
– |
|
|
Dividends declared on preference shares |
(1) |
(1) |
(4) |
(5) |
|
|
Adjusted earnings(1)(2) |
|
|
|
|
|
|
Adjusted EPS(1)(2) |
|
|
|
|
|
|
Total change |
6 % |
4 % |
|||
|
Foreign currency |
-1 % |
0 % |
|||
|
Constant currency |
7 % |
4 % |
|||
|
Diluted weighted-average common shares (millions) |
445.6 |
450.6 |
449.5 |
451.2 |
|
|
Reconciliation of Effective Tax Rate on Adjusted Earnings(1) |
Year ended |
||||||
|
2025 |
|||||||
|
Adjusted earnings |
|
||||||
|
Plus: Dividends declared on preference shares |
4 |
||||||
|
Plus: Tax expense on adjusted earnings |
401 |
||||||
|
Pre-tax adjusted earnings |
|
||||||
|
IFRS tax expense |
|
||||||
|
Remove tax related to: |
|||||||
|
Amortization of acquired software |
46 |
||||||
|
Amortization of other identifiable intangible assets |
23 |
||||||
|
Share of post-tax losses in equity method investments |
2 |
||||||
|
Other finance costs |
2 |
||||||
|
Other operating gains, net |
(43) |
||||||
|
Other items |
5 |
||||||
|
Subtotal – Remove tax benefit on pre-tax items removed from adjusted earnings |
35 |
||||||
|
Remove: Tax items impacting comparability |
(57) |
||||||
|
Total – Remove all items impacting comparability |
(22) |
||||||
|
Tax expense on adjusted earnings |
|
||||||
|
Effective tax rate on adjusted earnings |
18.5 % |
||||||
|
*Fair value adjustments primarily represent gains or losses due to changes in foreign currency exchange rates on intercompany balances that arise in the ordinary course of business, which are a component of operating expenses, as well as adjustments related to acquired deferred revenue. |
|
|
(1) |
Refer to page 21 for additional information on non-IFRS financial measures. |
|
(2) |
The adjusted earnings impact of non-controlling interests, which was applicable to the year-ended |
|
|
||||||||||||||
|
Reconciliation of Changes in Revenues to Changes in Revenues on a Constant Currency(1) and Organic Basis(1) |
||||||||||||||
|
(millions of |
||||||||||||||
|
(unaudited) |
||||||||||||||
|
Three months ended |
Change |
|||||||||||||
|
2025 |
2024 |
Total |
Foreign |
SUBTOTAL |
Net |
Organic |
||||||||
|
Total Revenues |
||||||||||||||
|
Legal Professionals |
|
|
1 % |
0 % |
1 % |
-8 % |
9 % |
|||||||
|
Corporates |
496 |
458 |
8 % |
1 % |
7 % |
-2 % |
9 % |
|||||||
|
Tax, Audit & Accounting Professionals |
414 |
366 |
13 % |
0 % |
13 % |
2 % |
11 % |
|||||||
|
“Big 3” Segments Combined(1) |
1,648 |
1,553 |
6 % |
1 % |
5 % |
-4 % |
9 % |
|||||||
|
|
232 |
218 |
7 % |
1 % |
6 % |
1 % |
5 % |
|||||||
|
Global Print |
136 |
144 |
-6 % |
0 % |
-6 % |
0 % |
-6 % |
|||||||
|
Eliminations/Rounding |
(7) |
(6) |
||||||||||||
|
Total Revenues |
|
|
5 % |
1 % |
5 % |
-3 % |
7 % |
|||||||
|
Recurring Revenues |
||||||||||||||
|
Legal Professionals |
|
|
1 % |
0 % |
1 % |
-7 % |
8 % |
|||||||
|
Corporates |
434 |
401 |
8 % |
1 % |
7 % |
-2 % |
9 % |
|||||||
|
Tax, Audit & Accounting Professionals |
357 |
319 |
12 % |
0 % |
12 % |
0 % |
12 % |
|||||||
|
“Big 3” Segments Combined(1) |
1,507 |
1,427 |
6 % |
1 % |
5 % |
-4 % |
9 % |
|||||||
|
|
183 |
173 |
6 % |
1 % |
5 % |
1 % |
4 % |
|||||||
|
Eliminations/Rounding |
(7) |
(6) |
||||||||||||
|
Total Recurring Revenues |
|
|
6 % |
1 % |
5 % |
-4 % |
9 % |
|||||||
|
Transactions Revenues |
||||||||||||||
|
Legal Professionals |
|
|
0 % |
-1 % |
0 % |
-28 % |
28 % |
|||||||
|
Corporates |
62 |
57 |
9 % |
2 % |
7 % |
0 % |
7 % |
|||||||
|
Tax, Audit & Accounting Professionals |
57 |
47 |
20 % |
1 % |
19 % |
16 % |
3 % |
|||||||
|
“Big 3” Segments Combined(1) |
141 |
126 |
11 % |
1 % |
10 % |
2 % |
8 % |
|||||||
|
|
49 |
45 |
10 % |
1 % |
9 % |
2 % |
8 % |
|||||||
|
Total Transactions Revenues |
|
|
11 % |
1 % |
10 % |
2 % |
8 % |
|||||||
|
Growth percentages are computed using whole dollars. As a result, percentages calculated from reported amounts may differ from those presented, and growth components may not total due to rounding. |
|
|
(1) |
Refer to page 21 for additional information on non-IFRS financial measures. |
|
|
||||||||||||||
|
Reconciliation of Changes in Revenues to Changes in Revenues on a Constant Currency(1) and Organic Basis(1) |
||||||||||||||
|
(millions of |
||||||||||||||
|
(unaudited) |
||||||||||||||
|
Year ended |
Change |
|||||||||||||
|
2025 |
2024 |
Total |
Foreign |
SUBTOTAL |
Net |
Organic |
||||||||
|
Total Revenues |
||||||||||||||
|
Legal Professionals |
|
|
-2 % |
0 % |
-2 % |
-10 % |
8 % |
|||||||
|
Corporates |
1,987 |
1,844 |
8 % |
0 % |
7 % |
-1 % |
9 % |
|||||||
|
Tax, Audit & Accounting Professionals |
1,302 |
1,165 |
12 % |
-1 % |
13 % |
3 % |
11 % |
|||||||
|
“Big 3” Segments Combined(1) |
6,157 |
5,931 |
4 % |
0 % |
4 % |
-5 % |
9 % |
|||||||
|
|
853 |
832 |
3 % |
1 % |
2 % |
1 % |
1 % |
|||||||
|
Global Print |
490 |
519 |
-6 % |
0 % |
-5 % |
0 % |
-5 % |
|||||||
|
Eliminations/Rounding |
(24) |
(24) |
||||||||||||
|
Total Revenues |
|
|
3 % |
0 % |
3 % |
-4 % |
7 % |
|||||||
|
Recurring Revenues |
||||||||||||||
|
Legal Professionals |
|
|
-1 % |
0 % |
-1 % |
-10 % |
9 % |
|||||||
|
Corporates |
1,670 |
1,543 |
8 % |
0 % |
8 % |
-2 % |
9 % |
|||||||
|
Tax, Audit & Accounting Professionals |
937 |
867 |
8 % |
-2 % |
10 % |
0 % |
10 % |
|||||||
|
“Big 3” Segments Combined(1) |
5,396 |
5,238 |
3 % |
0 % |
3 % |
-6 % |
9 % |
|||||||
|
|
712 |
668 |
7 % |
1 % |
6 % |
1 % |
5 % |
|||||||
|
Eliminations/Rounding |
(24) |
(24) |
||||||||||||
|
Total Recurring Revenues |
|
|
3 % |
0 % |
3 % |
-5 % |
9 % |
|||||||
|
Transactions Revenues |
||||||||||||||
|
Legal Professionals |
|
|
-16 % |
1 % |
-17 % |
-21 % |
4 % |
|||||||
|
Corporates |
317 |
301 |
5 % |
0 % |
5 % |
0 % |
5 % |
|||||||
|
Tax, Audit & Accounting Professionals |
365 |
298 |
22 % |
0 % |
23 % |
10 % |
12 % |
|||||||
|
“Big 3” Segments Combined(1) |
761 |
693 |
10 % |
0 % |
10 % |
1 % |
9 % |
|||||||
|
|
141 |
164 |
-14 % |
1 % |
-15 % |
0 % |
-16 % |
|||||||
|
Total Transactions Revenues |
|
|
5 % |
0 % |
5 % |
1 % |
4 % |
|||||||
|
Growth percentages are computed using whole dollars. As a result, percentages calculated from reported amounts may differ from those presented, and growth components may not total due to rounding. |
|
|
(1) |
Refer to page 21 for additional information on non-IFRS financial measures. |
|
|
||||||||||
|
Reconciliation of Changes in Adjusted EBITDA (1) and Related Margin(1) to Changes on a Constant Currency Basis(1) |
||||||||||
|
(millions of |
||||||||||
|
(unaudited) |
||||||||||
|
Three months ended |
Change |
|||||||||
|
2025 |
2024 |
Total |
Foreign |
Constant |
||||||
|
Adjusted EBITDA(1) |
||||||||||
|
Legal Professionals |
|
|
9 % |
0 % |
9 % |
|||||
|
Corporates |
160 |
153 |
4 % |
0 % |
4 % |
|||||
|
Tax, Audit & Accounting Professionals |
222 |
196 |
14 % |
1 % |
13 % |
|||||
|
“Big 3” Segments Combined(1) |
709 |
648 |
9 % |
0 % |
9 % |
|||||
|
|
48 |
45 |
7 % |
-5 % |
12 % |
|||||
|
Global Print |
54 |
55 |
-2 % |
0 % |
-2 % |
|||||
|
Corporate costs |
(34) |
(30) |
n/a |
n/a |
n/a |
|||||
|
Total Adjusted EBITDA |
|
|
8 % |
0 % |
8 % |
|||||
|
Adjusted EBITDA Margin(1) |
||||||||||
|
Legal Professionals |
44.3 % |
41.0 % |
330bp |
-20bp |
350bp |
|||||
|
Corporates |
32.2 % |
33.5 % |
-130bp |
-60bp |
-70bp |
|||||
|
Tax, Audit & Accounting Professionals |
53.6 % |
53.4 % |
20bp |
20bp |
0bp |
|||||
|
“Big 3” Segments Combined(1) |
43.0 % |
41.7 % |
130bp |
-20bp |
150bp |
|||||
|
|
21.0 % |
20.8 % |
20bp |
-120bp |
140bp |
|||||
|
Global Print |
39.6 % |
38.2 % |
140bp |
-20bp |
160bp |
|||||
|
Total Adjusted EBITDA Margin |
38.7 % |
37.6 % |
110bp |
-30bp |
140bp |
|||||
|
|
||||||||||
|
Reconciliation of Changes in Adjusted EBITDA (1) and Related Margin(1) to Changes on a Constant Currency Basis(1) |
||||||||||
|
(millions of |
||||||||||
|
(unaudited) |
||||||||||
|
Year ended |
Change |
|||||||||
|
2025 |
2024 |
Total |
Foreign |
Constant |
||||||
|
Adjusted EBITDA(1) |
||||||||||
|
Legal Professionals |
|
|
4 % |
1 % |
3 % |
|||||
|
Corporates |
716 |
671 |
7 % |
0 % |
6 % |
|||||
|
Tax, Audit & Accounting Professionals |
623 |
527 |
18 % |
0 % |
19 % |
|||||
|
“Big 3” Segments Combined(1) |
2,695 |
2,500 |
8 % |
0 % |
7 % |
|||||
|
|
174 |
196 |
-11 % |
-1 % |
-11 % |
|||||
|
Global Print |
185 |
188 |
-2 % |
1 % |
-2 % |
|||||
|
Corporate costs |
(118) |
(105) |
n/a |
n/a |
n/a |
|||||
|
Total Adjusted EBITDA |
|
|
6 % |
0 % |
5 % |
|||||
|
Adjusted EBITDA Margin(1) |
||||||||||
|
Legal Professionals |
47.3 % |
44.6 % |
270bp |
20bp |
250bp |
|||||
|
Corporates |
36.0 % |
36.3 % |
-30bp |
0bp |
-30bp |
|||||
|
Tax, Audit & Accounting Professionals |
47.1 % |
45.2 % |
190bp |
40bp |
150bp |
|||||
|
“Big 3” Segments Combined(1) |
43.6 % |
42.1 % |
150bp |
20bp |
130bp |
|||||
|
|
20.4 % |
23.6 % |
-320bp |
-30bp |
-290bp |
|||||
|
Global Print |
37.7 % |
36.2 % |
150bp |
30bp |
120bp |
|||||
|
Total Adjusted EBITDA Margin |
39.2 % |
38.2 % |
100bp |
20bp |
80bp |
|||||
|
n/a: not applicable |
|
|
Growth percentages and margins are computed using whole dollars. As a result, percentages and margins calculated from reported amounts may differ from those presented, and growth components may not total due to rounding. |
|
|
(1) |
Refer to page 21 for additional information on non-IFRS financial measures. |
Reconciliation of adjusted EBITDA margin(1)
To compute segment and consolidated adjusted EBITDA margin, the company excludes fair value adjustments related to acquired deferred revenue from its IFRS revenues. The charts below reconcile IFRS revenues to revenues used in the calculation of adjusted EBITDA margin, which excludes fair value adjustments related to acquired deferred revenue.
|
Three months ended |
|||||||||
|
(millions of |
IFRS |
Remove fair |
Revenues |
Adjusted |
Adjusted |
||||
|
Legal Professionals |
|
– |
|
|
44.3 % |
||||
|
Corporates |
496 |
– |
496 |
160 |
32.2 % |
||||
|
Tax, Audit & Accounting Professionals |
414 |
– |
414 |
222 |
53.6 % |
||||
|
“Big 3” Segments Combined(1) |
1,648 |
– |
1,648 |
709 |
43.0 % |
||||
|
|
232 |
– |
232 |
48 |
21.0 % |
||||
|
Global Print |
136 |
– |
136 |
54 |
39.6 % |
||||
|
Eliminations/Rounding |
(7) |
– |
(7) |
– |
n/a |
||||
|
Corporate costs |
– |
– |
– |
(34) |
n/a |
||||
|
Consolidated totals |
|
– |
|
|
38.7 % |
||||
|
Year ended |
|||||||||
|
(millions of |
IFRS |
Remove fair |
Revenues |
Adjusted |
Adjusted |
||||
|
Legal Professionals |
|
– |
|
|
47.3 % |
||||
|
Corporates |
1,987 |
– |
1,987 |
716 |
36.0 % |
||||
|
Tax, Audit & Accounting Professionals |
1,302 |
|
1,322 |
623 |
47.1 % |
||||
|
“Big 3” Segments Combined(1) |
6,157 |
20 |
6,177 |
2,695 |
43.6 % |
||||
|
|
853 |
– |
853 |
174 |
20.4 % |
||||
|
Global Print |
490 |
– |
490 |
185 |
37.7 % |
||||
|
Eliminations/Rounding |
(24) |
– |
(24) |
– |
n/a |
||||
|
Corporate costs |
– |
– |
– |
(118) |
n/a |
||||
|
Consolidated totals |
|
|
|
|
39.2 % |
||||
|
Three months ended |
|||||||||
|
(millions of |
IFRS |
Remove fair |
Revenues |
Adjusted |
Adjusted |
||||
|
Legal Professionals |
|
– |
|
|
41.0 % |
||||
|
Corporates |
458 |
|
459 |
153 |
33.5 % |
||||
|
Tax, Audit & Accounting Professionals |
366 |
– |
366 |
196 |
53.4 % |
||||
|
“Big 3” Segments Combined(1) |
1,553 |
1 |
1,554 |
648 |
41.7 % |
||||
|
|
218 |
– |
218 |
45 |
20.8 % |
||||
|
Global Print |
144 |
– |
144 |
55 |
38.2 % |
||||
|
Eliminations/Rounding |
(6) |
– |
(6) |
– |
n/a |
||||
|
Corporate costs |
– |
– |
– |
(30) |
n/a |
||||
|
Consolidated totals |
|
|
|
|
37.6 % |
||||
|
n/a: not applicable |
|
|
Margins are computed using whole dollars, as a result, margins calculated from reported amounts may differ from those presented due to rounding. |
|
|
(1) |
Refer to page 21 for additional information on non-IFRS financial measures. |
|
Reconciliation of adjusted EBITDA margin(1)
|
|||||||||
|
Year ended |
|||||||||
|
(millions of |
IFRS |
Remove fair |
Revenues |
Adjusted |
Adjusted |
||||
|
Legal Professionals |
|
|
|
|
44.6 % |
||||
|
Corporates |
1,844 |
6 |
1,850 |
671 |
36.3 % |
||||
|
Tax, Audit & Accounting Professionals |
1,165 |
– |
1,165 |
527 |
45.2 % |
||||
|
“Big 3” Segments Combined(1) |
5,931 |
7 |
5,938 |
2,500 |
42.1 % |
||||
|
|
832 |
2 |
834 |
196 |
23.6 % |
||||
|
Global Print |
519 |
– |
519 |
188 |
36.2 % |
||||
|
Eliminations/Rounding |
(24) |
– |
(24) |
– |
n/a |
||||
|
Corporate costs |
– |
– |
– |
(105) |
n/a |
||||
|
Consolidated totals |
|
|
|
|
38.2 % |
||||
|
n/a: not applicable |
|
Margins are computed using whole dollars, as a result, margins calculated from reported amounts may differ from those presented due to rounding. |
|
|
|||||||
|
Reconciliation of Net Debt(1) and Leverage Ratio of Net Debt to Adjusted EBITDA(1) |
|||||||
|
(millions of |
|||||||
|
(unaudited) |
|||||||
|
December 31, |
|
||||||
|
2025 |
2024 |
||||||
|
Current indebtedness |
|
|
|||||
|
Long-term indebtedness |
1,328 |
1,847 |
|||||
|
Total debt |
2,123 |
2,820 |
|||||
|
Swaps |
16 |
21 |
|||||
|
Total debt after swaps |
2,139 |
2,841 |
|||||
|
Remove fair value adjustments for hedges |
(2) |
5 |
|||||
|
Total debt after hedging arrangements |
2,137 |
2,846 |
|||||
|
Collateral assets |
(7) |
– |
|||||
|
Remove transaction costs, premiums or discounts, included in the carrying value of debt |
28 |
22 |
|||||
|
Add: Lease liabilities (current and non-current) |
249 |
256 |
|||||
|
Less: Cash and cash equivalents |
(511) |
(1,968) |
|||||
|
Net debt |
|
|
|||||
|
Leverage ratio of net debt to adjusted EBITDA |
|||||||
|
Adjusted EBITDA |
|
|
|||||
|
Net debt/adjusted EBITDA |
0.6:1 |
0.4:1 |
|||||
|
(1) |
Refer to page 21 for additional information on non-IFRS financial measures. |
|
Non-IFRS |
Definition |
Why Useful to the Company and Investors |
|
Adjusted EBITDA and the related margin |
Represents earnings or losses from continuing operations before tax expense or benefit, net interest expense, other finance costs or income, depreciation, amortization of software and other identifiable intangible assets, |
Provides a consistent basis to evaluate operating profitability and performance trends by excluding items that the company does not consider to be controllable activities for this purpose. Also, represents a measure commonly reported and widely used by investors as a valuation metric, as well as to assess the company’s ability to incur and service debt. |
|
Adjusted earnings and adjusted EPS |
Net earnings or loss including dividends declared on preference shares but excluding the post-tax impacts of fair value adjustments, including those related to acquired deferred revenue, amortization of acquired intangible assets (attributable to other identifiable intangible assets and acquired software), other operating gains and losses, certain asset impairment charges, other finance costs or income,
The post-tax amount of each item is excluded from adjusted earnings based on the specific tax rules and tax rates associated with the nature and jurisdiction of each item.
Adjusted EPS is calculated from adjusted earnings using diluted weighted-average shares and does not represent actual earnings or loss per share attributable to shareholders. |
Provides a more comparable basis to analyze earnings.
These measures are commonly used by shareholders to measure performance.
|
|
Effective tax rate on adjusted earnings |
Adjusted tax expense divided by pre-tax adjusted earnings. Adjusted tax expense is computed as income tax expense or benefit plus or minus the income tax impacts of all items impacting adjusted earnings (as described above), and other tax items impacting comparability.
In interim periods, the company also makes an adjustment to reflect income taxes based on the estimated full-year effective tax rate. Earnings or losses for interim periods under IFRS reflect income taxes based on the estimated effective tax rates of each of the jurisdictions in which |
Provides a basis to analyze the effective tax rate associated with adjusted earnings.
The company’s effective tax rate computed in accordance with IFRS may be more volatile by quarter because the geographical mix of pre-tax profits and losses in interim periods may be different from that for the full year. Therefore, the company believes that using the expected full-year effective tax rate provides more comparability among interim periods. |
|
Free cash flow |
Net cash provided by operating activities and other investing activities, less capital expenditures, payments of lease principal and dividends paid on the company’s preference shares. |
Helps assess the company’s ability, over the long term, to create value for its shareholders as it represents cash available to repay debt, pay common dividends, fund share repurchases and acquisitions. |
|
Changes before the impact of foreign currency or at constant currency |
The changes in revenues, adjusted EBITDA and the related margin, and adjusted EPS before currency (at constant currency or excluding the effects of currency) are determined by converting the current and equivalent prior period’s local currency results using the same foreign currency exchange rate. |
Provides better comparability of business trends from period to period. |
|
Changes in revenues computed on an organic basis |
Represent changes in revenues of the company’s existing businesses at constant currency. The metric excludes the distortive impacts of acquisitions and dispositions from not owning the business in both comparable periods. |
Provides further insight into the performance of the company’s existing businesses by excluding distortive impacts and serves as a better measure of the company’s ability to grow its business over the long term. |
|
Accrued capital expenditures as a percentage of revenues |
Accrued capital expenditures divided by revenues, where accrued capital expenditures include amounts that remain unpaid at the end of the reporting period. For purposes of this calculation, revenues are before fair value adjustments to acquired deferred revenue. |
Reflects the basis on which the company manages capital expenditures for internal planning purposes.
|
|
“Big 3” segments |
The company’s combined Legal Professionals, Corporates and Tax, Audit & Accounting Professionals segments. All measures reported for the “Big 3” segments are non-IFRS financial measures. |
The “Big 3” segments comprised approximately 80% of revenues and represent the core of the company’s business information service product offerings. |
|
Net debt and leverage ratio of net debt to adjusted EBITDA |
Net debt is total debt, plus related hedging instruments and collateral balances, along with lease liabilities, excluding unamortized transaction costs and any premiums or discounts on debt, minus cash and cash equivalents. We exclude specific hedging components to reflect the net cash outflow upon debt maturity.
Net debt to adjusted EBITDA is net debt divided by adjusted EBITDA for the previous twelve-month period ending with the current fiscal quarter.
|
Provides a commonly used measure of a company’s leverage and its ability to pay its debt. Given that the company hedges some of its debt to manage risk, the company includes hedging instruments as it believes it provides a better measure of the total obligation associated with its outstanding debt. Since the company plans to hold its debt and related hedges until maturity, the net debt calculation is adjusted to reflect the net cash outflow at maturity, after deducting cash and cash equivalents.
The company’s non-IFRS measure is aligned with the calculation of its internal target leverage ratio and is more conservative than the maximum ratio allowed under the contractual covenants in its credit facility. |
|
Please refer to reconciliations for the most directly comparable IFRS financial measures. |
![]() View original content to download multimedia:https://www.prnewswire.com/news-releases/thomson-reuters-reports-fourth-quarter-and-full-year-2025-results-302680103.html
View original content to download multimedia:https://www.prnewswire.com/news-releases/thomson-reuters-reports-fourth-quarter-and-full-year-2025-results-302680103.html
SOURCE Thomson Reuters


BNY Mellon Appreciation Fund Q1 2026 Commentary

“Permission to operate international passenger flights at Mashhad Airport has been issued, starting tomorrow,” state TV said, quoting the Civil Aviation Organisation.
The organisation later said travellers can now “purchase tickets for international routes to and from Mashhad Airport,” according to the official IRNA news agency.
Iranian airports have been closed since the outbreak of war with Israel and the United States on February 28.
The Civil Aviation Organisation had said earlier that it would start a phased reopening of Iran’s airspace, beginning with transit flights, followed by operations from eastern airports.

Airports in Tehran — Imam Khomeini and Mehrabad airports — are expected to reopen in the third phase, with western airports resuming operations in the final phase.

Fred Alger Management, LLC (“Alger”) is a privately held $27.4 billion growth equity investment manager. Alger is a pioneer of actively managed, growth equity investing. Their journey over the past six decades has been defined by navigating change, embracing disruption, and investing in innovation. Note: This account is not managed or monitored by Fred Alger Management, and any messages sent via Seeking Alpha will not receive a response. For inquiries or communication, please use Fred Alger Management’s official channels.

syahrir maulana/iStock via Getty Images

Dear Partners,
The first quarter of 2026 gave investors plenty to worry about. Rising tensions in the Middle East pushed oil prices higher, inflation concerns resurfaced, and the long-anticipated pivot to lower interest rates continues to be postponed. Markets, never short on imagination, have begun spinning familiar narratives: that expensive money punishes growth, that AI’s promises may exceed its near-term returns, and that the safer bet lies in energy, cyclicals, and businesses whose cash flows arrive sooner rather than later. There is also a growing fear that AI itself may disrupt entire categories of existing software businesses — rendering yesterday’s winners obsolete overnight.
We will not pretend these concerns are frivolous. They are not. When the cost of capital rises, the arithmetic of investing genuinely changes — a dollar earned a decade from now is worth less today than it was in a world of cheap money. That is not opinion; it is math. And we have always believed in taking math seriously.
But here is what we have also learned, after watching markets swing from greed to panic across many cycles: the headlines that feel most urgent are rarely the ones that determine long-term outcomes. The businesses that compound wealth over decades do so not because they were spared from difficult environments, but because they were built to endure them. We have spent the past decade building a portfolio of exactly that kind.
None of what we are seeing today is new. Different costumes, same play.
Performance in Context
During the first quarter, Rowan Street declined 19.8%, compared to a 4.3% decline for the S&P 500. That is not a result we enjoy reporting. At the same time, it reflects the more concentrated approach we take and is not unusual for portfolios built around a smaller number of high-conviction investments.
We invest in a focused group of businesses that we believe can compound value at attractive rates over long periods of time. In the short term, their stock prices can be more volatile—particularly in environments like the one we are experiencing today, where interest rates are higher and investor focus has shifted toward businesses with nearer-term cash flows.
Rowan Street is designed for long-term compounding, not for minimizing short-term volatility or closely tracking a benchmark. As a result, returns can differ meaningfully from year to year.
We have seen this before.
In early 2022, we went through a similar period where stock prices declined sharply, even as the underlying businesses continued to perform well. At the time, we wrote that the portfolio was, in many ways, in one of the strongest positions in our history despite the decline in stock prices.
That did not feel obvious at the time. What followed was a period where business performance ultimately reasserted itself. The fund returned +102.6% (net) in 2023, +56.6% in 2024, and +11.1% in 2025.
As Benjamin Graham observed:
“In the short run, the market is a voting machine, but in the long run, it is a weighing machine.”
A Post-Quarter Update
We are writing this letter in mid-April, approximately two weeks after quarter-end. Since March 31, markets have moved sharply — and our portfolio has recovered approximately half of the first quarter decline. Based on our internal estimates as of April 17, year-to-date performance stands at approximately -10%, compared to the official quarter-end figure of -19.8%. We note that this mid-month figure is an internal estimate only, has not been verified by our fund administrator, and reflects only a partial month.
We share this not to suggest the difficult period is behind us — it may not be. We share it because it illustrates precisely the point we are making throughout this letter. The fundamentals of the businesses we own have not changed. Their competitive positions, earnings power, and long-term prospects remain intact, in our view. What changed was the price multiple. This is what long-term ownership of exceptional businesses actually looks like. Price and value diverge. Sometimes dramatically. The investors who benefit are those with the temperament to remain focused on the underlying businesses, not the day-to-day movements of their stock prices.
Volatility is the Price of Admission
The table below shows the annual returns of our largest holdings by portfolio weight as of March 31, 2026 and illustrates a simple reality of long-term investing: even exceptional businesses experience significant volatility. We have included an April 17 column to reflect the meaningful recovery in our portfolio since quarter-end, as discussed in the Performance section above. The figures reflect annual stock price returns and do not represent Rowan Street Capital fund performance or returns achieved by the fund on these positions.
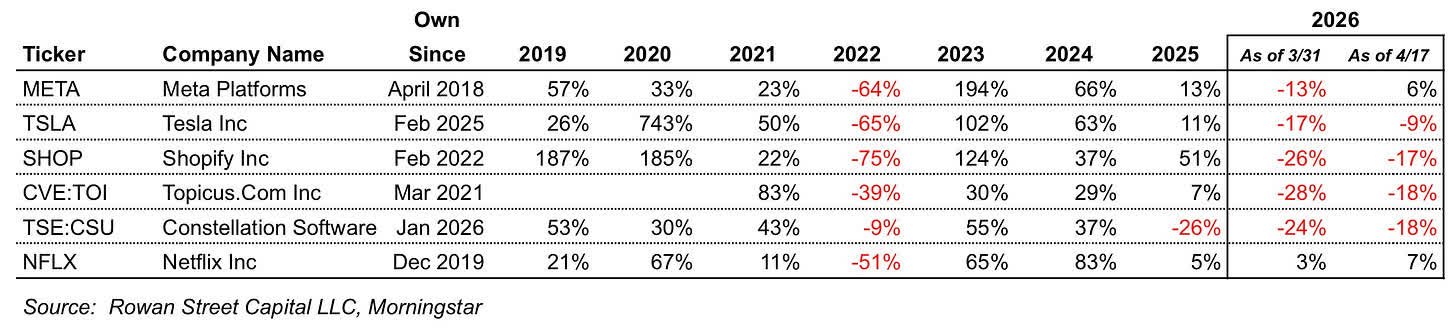
The April 17 column tells its own story — and it is the same story this letter is built around. This is what long-term ownership actually looks like in practice. Not a smooth upward line — but a recurring series of gains, losses, and tests of conviction. Drawdowns of 30%, 50%, even 75% are not unusual. They are a recurring feature of owning exceptional businesses — not anomalies.
Everyone describes themselves as a long-term investor. Very few are willing to endure what that actually looks like. Volatility is the price of admission.
The charts that follow bring this pattern to life across three of our largest holdings — Meta Platforms, Tesla, and Shopify. Different businesses, different drawdowns, same lesson.
Meta Platforms (META)
Meta has delivered a cumulative return of approximately 1,300% since its IPO, or about 21% annually. The path to those returns, however, has been anything but smooth.
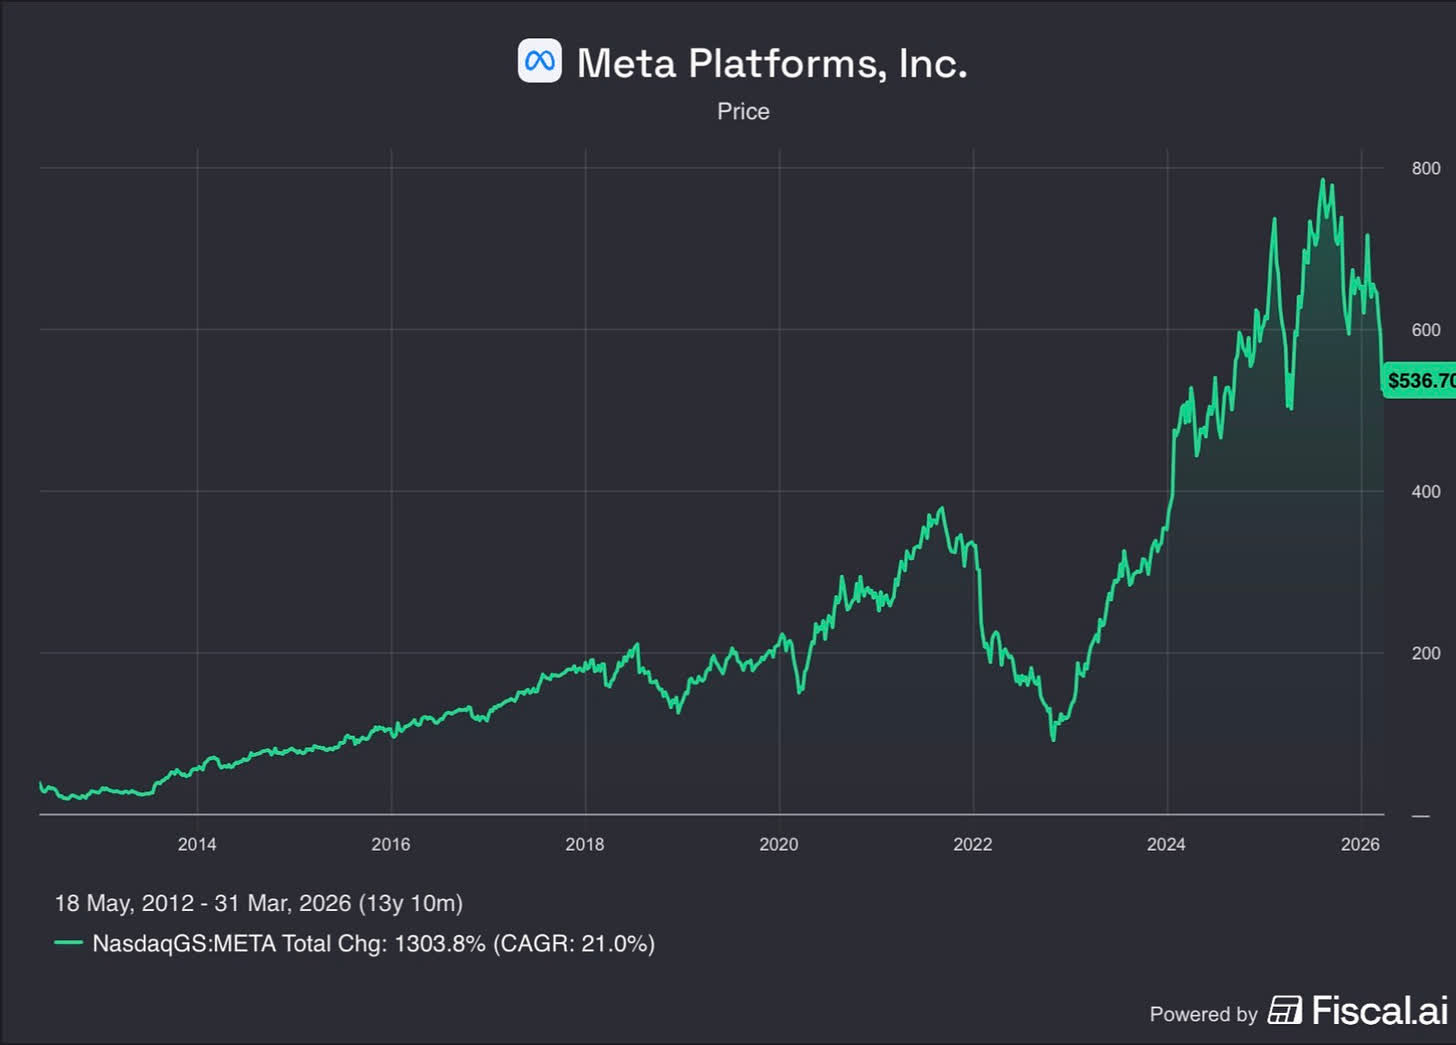
Over the past decade, the stock has experienced numerous drawdowns of 30% or more, several declines of 50% or more, and, most notably, a decline of nearly 80% in 2022.
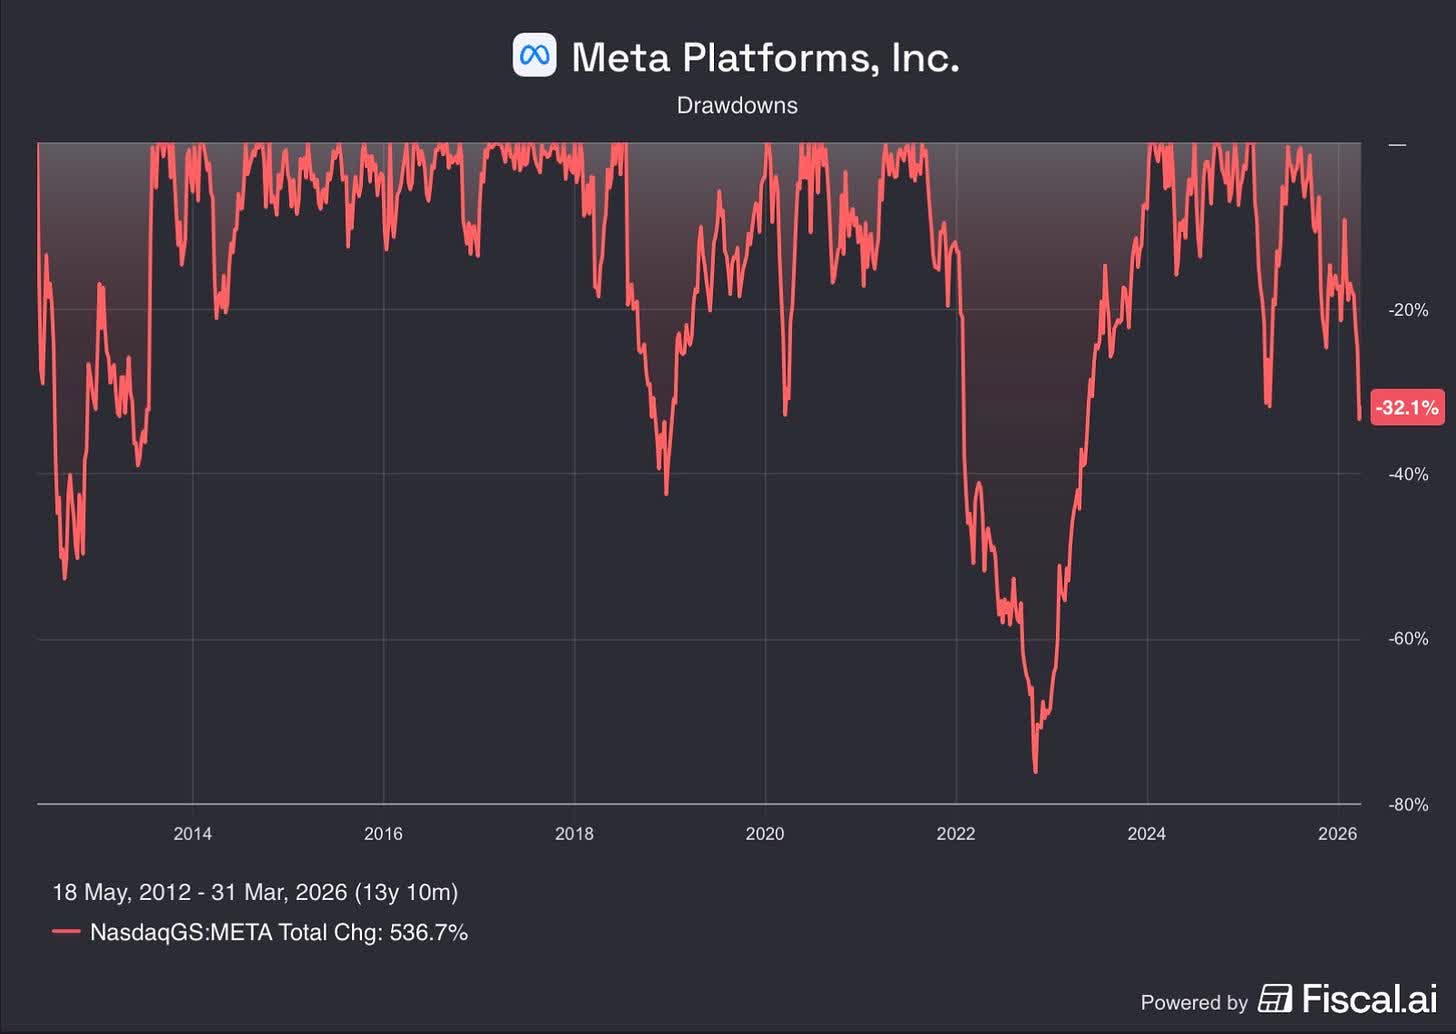
These periods were not isolated events — they were a recurring feature of owning this business. And yet for those who remained focused on the underlying fundamentals, the long-term outcome has been exceptional.
We believe today represents one of the most compelling opportunities in Meta we have seen since 2022. Please read our full analysis below — including our views on the AI spending debate, the recent legal setbacks, and why we believe the market may be repeating a familiar mistake.
Tesla (TSLA)
Tesla provides an even more striking example—not just of volatility, but of how disproportionate long-term outcomes can be relative to the experience along the way.
Since its IPO in 2010, the stock has delivered a cumulative return of approximately 22,000%, or about 41% annually. Looking at that result today, the path can appear almost inevitable. In reality, it was anything but.
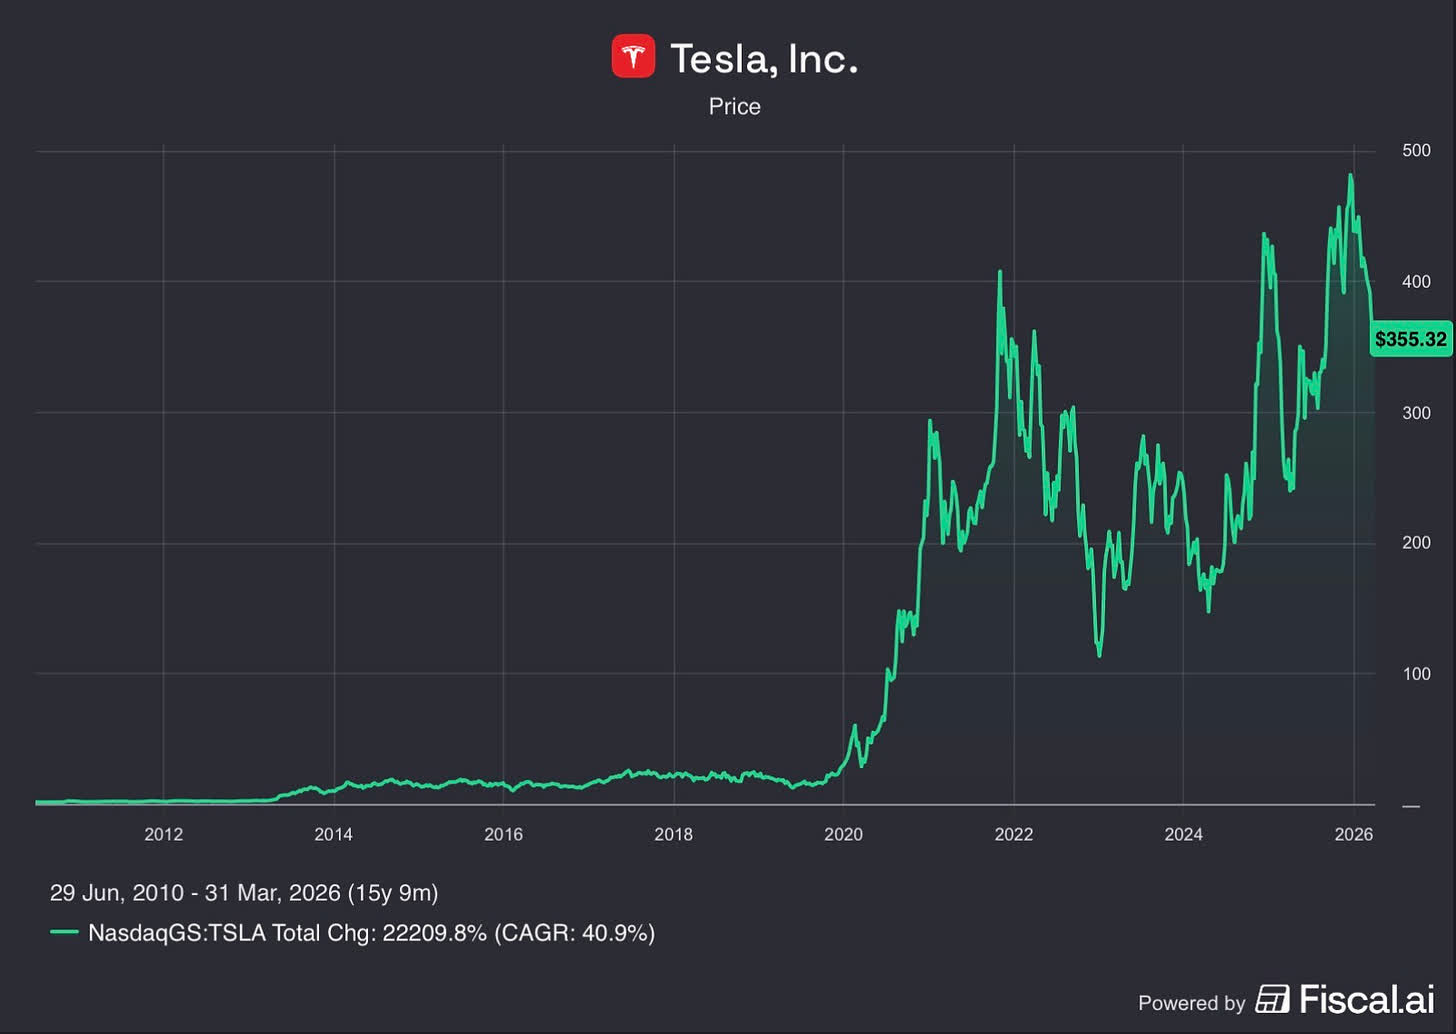
There were multiple periods along the way where the stock declined sharply—on numerous occasions by more than 50%, and once by over 70%—often accompanied by shifting narratives around the business. At different points, the concerns ranged from questions about the company’s survival, to valuation, to increasing competition, founder behavior and execution risk.
Each of those moments felt uncertain in real time. And yet, for investors who were able to remain focused on the long-term trajectory of the business, the outcome has been extraordinary.
The biggest winners rarely feel comfortable to own.
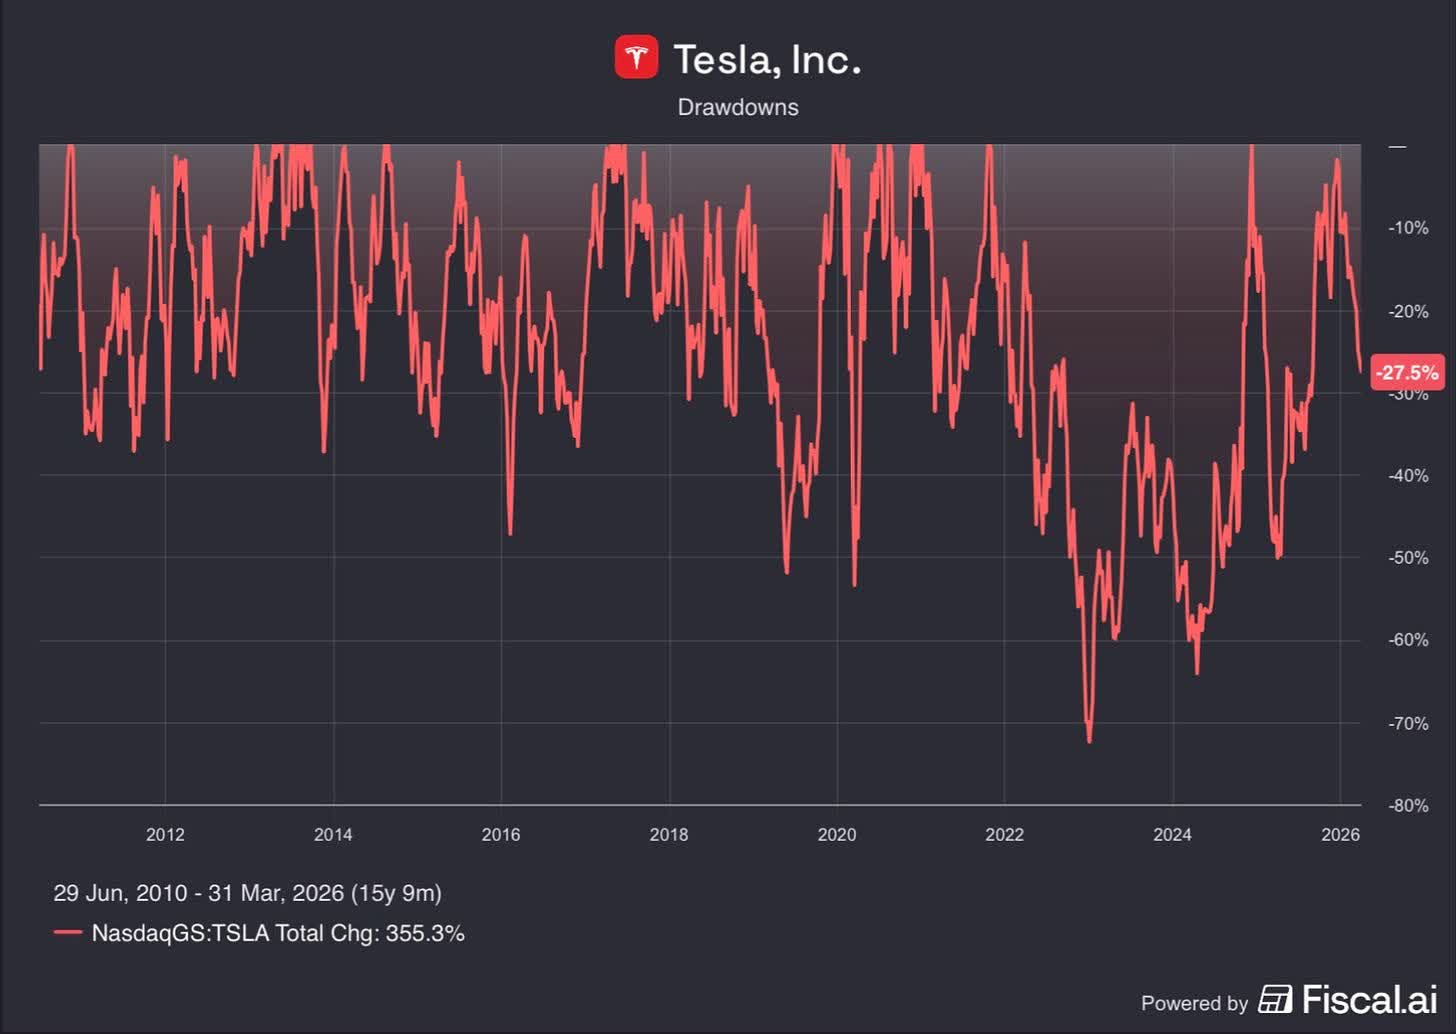
While Tesla has demonstrated this pattern over many years, our ownership of the business is still relatively recent.
We outlined our investment thesis in detail in our Q3 2025 letter, and our view remains unchanged. From here, our role is not to predict short-term movements, but to remain disciplined and allow the long-term economics of the business to play out.
Shopify (SHOP)
Shopify has been an exceptional business over time, compounding at over 40% annually since its IPO.
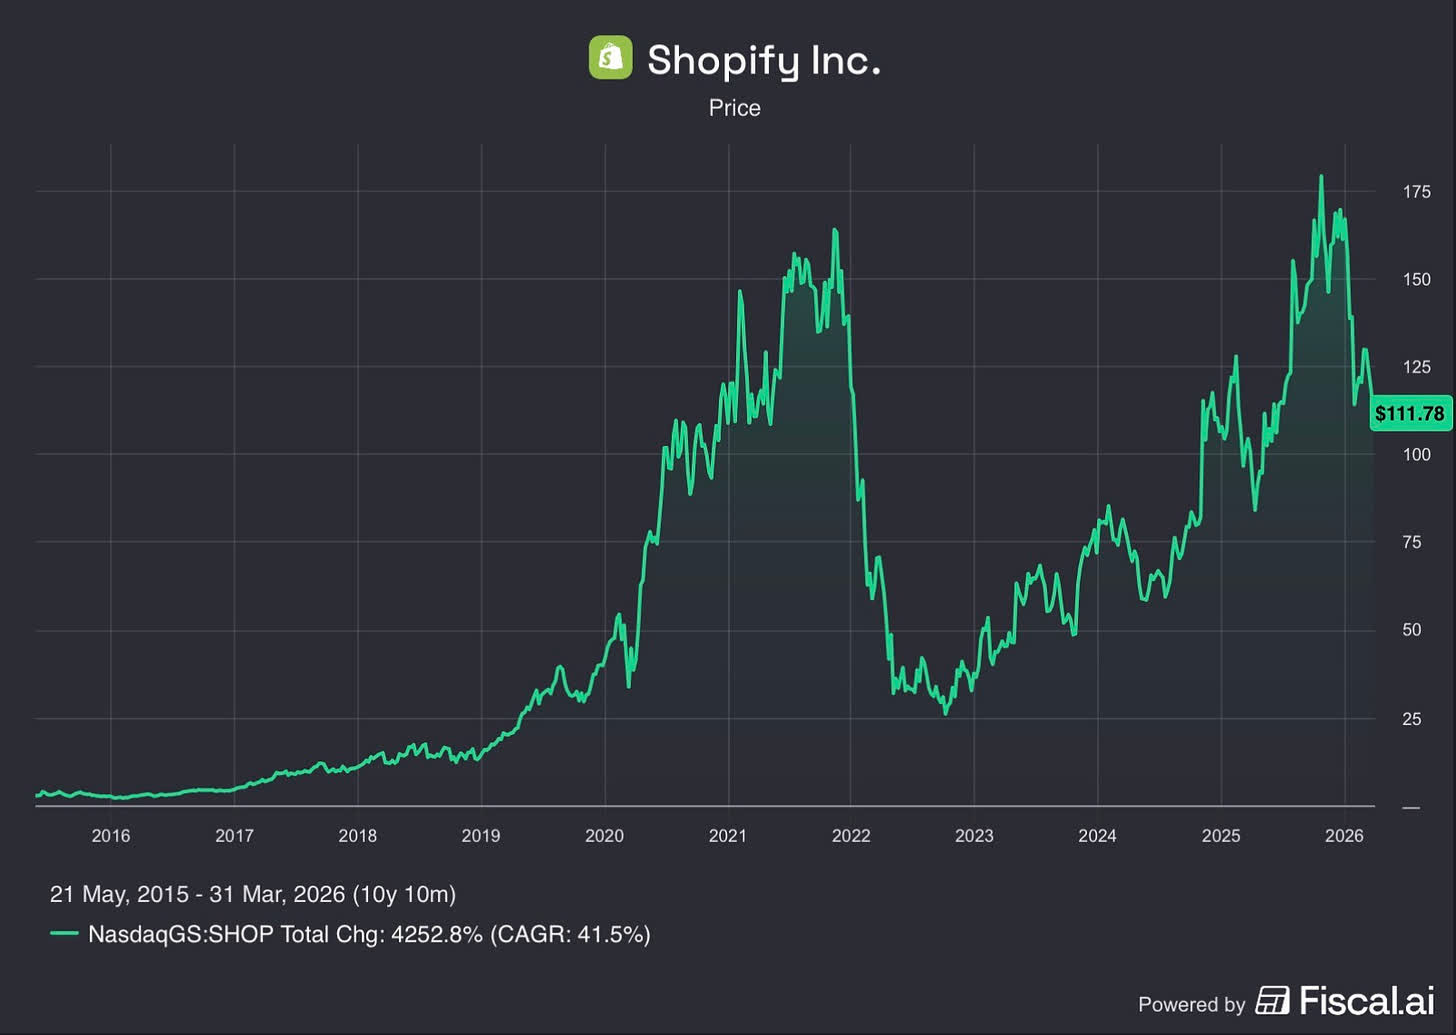
The path to those returns, however, has been far from smooth, including several sharp drawdowns and a decline of more than 80% in 2022.
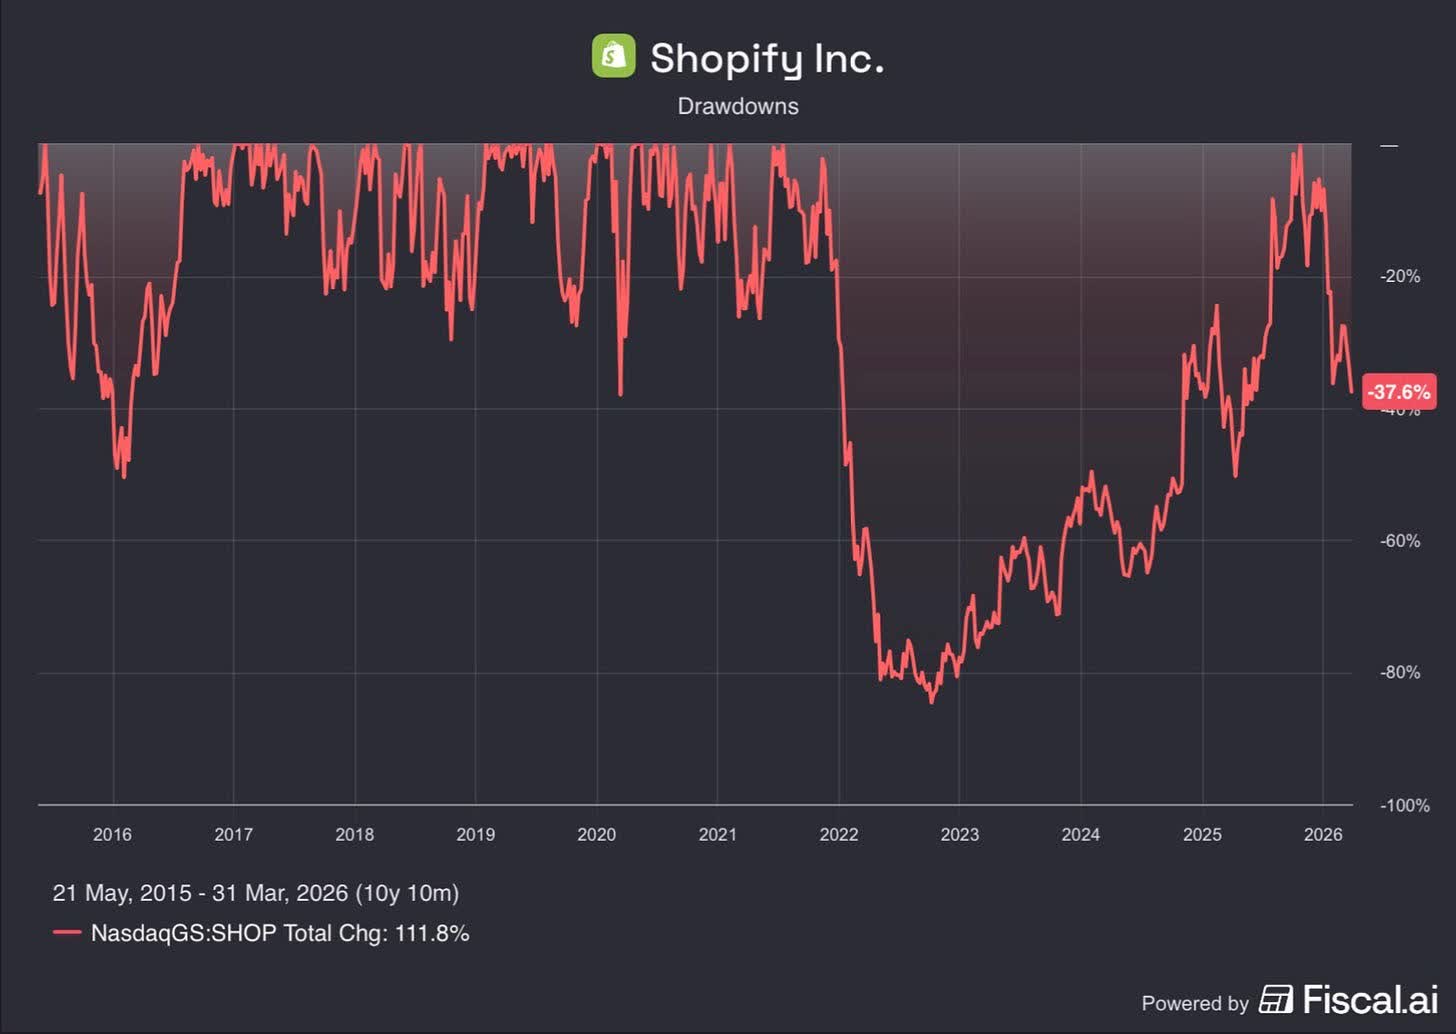
We experienced this firsthand. After initiating our position in early 2022, the stock declined by an additional ~50%. We believed the drawdown reflected multiple compression, not fundamental deterioration. The business continued to grow revenues, expand its merchant ecosystem, and strengthen its competitive position. The price was broken. The company was not.
It did not feel good. The best opportunities rarely do.
What followed was a long and uncomfortable period of patience before payoff. The stock rebounded 124% in 2023 — and yet we were still underwater on our investment. It was not until 2024 — when Shopify generated over $1 billion in operating profit for the first time and the stock gained another 37% — that we finally got our capital back and began generating real returns. The stock then rose 51% in 2025, making it our best performer of the year.
Three years of patience. Three years of watching the business execute while the stock tested our conviction repeatedly.
More recently the stock has again declined meaningfully — down 26% at quarter-end, though it has since recovered to approximately -17% as of mid-April. There is nothing unusual about that. It is the same pattern, playing out again.
Shopify is a clear example of why patience — especially through periods of valuation compression — is often required before fundamentals are fully reflected in stock prices. In our experience, the returns in businesses like Shopify are earned by those willing to endure periods when stock prices and business performance temporarily move in opposite directions.
Underlying Business Performance
Despite the recent decline in stock prices, the underlying businesses we own continue to perform well. Based on current estimates, our portfolio companies are expected to grow revenues at approximately 18% annually and earnings at approximately 21% annually over the next several years. These figures represent a weighted average across a group of businesses operating in different industries and geographies.
In our experience, periods like this — when price and value diverge — have consistently provided the most attractive investment opportunities.
In our Q2 2025 letter, we wrote that our edge does not come from predicting short-term market movements, but from our willingness to own a concentrated group of high-quality businesses and remain focused on their long-term compounding potential.
That principle is far easier to articulate when markets are rising than when they are declining. Periods like the one we are experiencing today are when that discipline is tested — and, in our view, when it matters most.
Portfolio Update: Constellation Software
During the quarter, we initiated a position in Constellation Software (TSE: CSU) (CNSWF), funded by the sale of the remainder of our Spotify position. Constellation is one of the most exceptional capital allocation platforms in the public markets — a company that has compounded shareholder capital at approximately 28% annually since its 2006 IPO by systematically acquiring and operating mission-critical vertical market software businesses. The stock has recently declined approximately 50% from its highs, creating what we believe is a rare entry point into a business of this quality. For those interested in a detailed discussion of our investment thesis — including our views on the AI disruption narrative and the recent leadership transition — we have published a full write-up on our Substack.
The Opportunity Today
We want to be direct with our partners and with anyone considering investing alongside us for the first time.
We have been here before — not just as observers, but as participants with real stakes. In 2021-2022, when our portfolio declined sharply we remained focused on the underlying businesses and their long-term prospects. We wrote at the time that we believed the portfolio was in one of the strongest positions in its history. Few wanted to hear it. Even fewer wanted to invest. What followed was a cumulative net return of approximately +252% over the subsequent three-year period (2023–2025).
We are not promising a repeat. No honest investor can make that claim.
But here is what we can say with conviction: the businesses we own today are stronger than they were in 2022. Their competitive positions are deeper, their earnings power is greater, and their long-term opportunities are larger. In many ways, we believe this is the strongest and most focused portfolio we have built since our inception in 2015 — a small group of exceptional businesses that have each been tested through adversity and emerged with their competitive positions intact or strengthened.
And yet their stock prices have declined meaningfully from recent highs. In our view, the gap between what these businesses are worth and what the market is willing to pay for them today is as wide as it has been since that period.
We have invested a significant majority of our personal net worth alongside yours. We earn nothing unless our partners make money. That is not a marketing line — it is the structure we chose deliberately on day one, because we believe it is the only honest way to manage other people’s capital.
Periods like this are never comfortable. They were not comfortable in 2022, and they are not comfortable today. But in our eleven years of managing capital through euphoria and despair, one lesson has proven itself repeatedly: it is precisely in these moments — when prices are low, sentiment is poor, and patience feels unrewarded — that the most important long-term returns are made.
To our existing partners — thank you for your continued trust and patience. We have been here before, and we remain as convicted as ever in the businesses we own together. If your circumstances allow, we believe adding to your investment at current levels represents one of the more compelling opportunities we have seen since 2022.
To those considering investing alongside us for the first time — if this way of thinking resonates with you, we would welcome the opportunity to partner over the long term.
Best regards,
Alex and Joe
Editor’s Note: The summary bullets for this article were chosen by Seeking Alpha editors.

Whether the twin blows affecting growth and inflation seen in purchasing manager indexes after the first month of the Iran conflict intensified during month two will be a key focus.
The initial take for April in economies from Australia to the US will be published on Thursday. Among those covered by Bloomberg forecasts, indexes in Germany, France, the euro zone and the UK are all anticipated to show broad deterioration, while the American indicators are seen little changed.
Ultimately, the numbers may point to the degree that stagflation is lurking. That ominous term – evoking the noxious mix of surging prices and stalling growth of the 1970s – was cited by Chris Williamson, chief business economist at PMI-compiler S&P Global, when summing up risks highlighted by the overall global measure in March.
The survey numbers follow a week of bleak stock-taking in Washington, where finance chiefs were warned by the International Monetary Fund of a range of potential outcomes that included a near-recession for the world. Notwithstanding the current Middle East ceasefire, the damage to growth and inflation can’t be easily undone.
“Even if the war ends tomorrow, it would take quite some time for the recovery to kick in,” IMF Managing Director Kristalina Georgieva told Bloomberg Television. “The impact is already baked in.”
For all the gloom, multiple policymakers remain cautious about how to respond. European Central Bank chief economist Philip Lane described how he and his colleagues may treat reports such as the PMIs when they set interest rates later this month.”We will have a rich set of survey data,” Lane said in Washington. “Of course, the people who are answering those surveys are looking at the same world we are looking at.” And for now, not many will have a decisive idea about what’s going to happen, he added.
ECB officials will also get French business confidence on Thursday and Germany’s closely watched Ifo business climate gauge on Friday. Their Federal Reserve peers will see the University of Michigan’s sentiment index, also at the end of the week.


US security agency is using Anthropic’s Mythos despite blacklist, Axios reports

Revolution Medicines reports phase 1 data for lung cancer drug
QXO to acquire TopBuild for $17 billion in stock and cash deal

Iran rejects second round of talks, suspects possible U.S. attack – report


Bulgaria’s pro-Russian former president takes strong lead in election, exit polls show
Fire crews at Frasers in Glasgow after ‘reports of smoke’ at store

BNY Mellon Appreciation Fund Q1 2026 Commentary

AVAX Tests Key Support as Descending Triangle Signals Possible Trend Reversal Ahead

Why Israel is blocking foreign journalists from entering

Bitcoin: We’re Entering The Most Dangerous Phase

Alan Cumming Brands Baftas Ceremony A ‘Triggering S**tshow’

90% Finanzierung unter 4%? Achtung Details! (16.04.2026) #baufinanzierung

Eugenie marriage crisis as Jack Brooksbank refuses financial audit pressure

*NEW* THE SEC JUST SHOCKED EVERYONE! XRP MASSIVE INDICATOR! RAVE DAO (HOW HIGH CAN IT GO?)
-
 NewsBeat7 days ago
Pep Guardiola and Gary Neville agree over Arsenal title problem that benefits Man City
-

 Crypto World6 days ago
The SEC Conditionalises DeFi Platforms to Be Avoided for Broker Registration
-

 Fashion2 days ago
Weekend Open Thread: Theodora Dress
-

 Crypto World6 days ago
SEC Signals Exemption for Crypto Interfaces From Broker Registration
-

 News Videos4 days ago
Secure crypto trading starts with an FIU-registered
-

 Sports2 days ago
NWFL Suspends Two Players Over Post-Match Clash in Ado-Ekiti
-

 Crypto World6 days ago
SEC Proposes Certain Crypto Interfaces Don’t Need to Register as Brokers
-

 NewsBeat5 days ago
Trump and Pope Leo: Behind their disagreement over Iran war
-

 Business5 hours ago
Powerball Result April 18, 2026: No Jackpot Winner in Powerball Draw: $75 Million Rolls Over
-

 Politics2 days ago
Palestine barred from entering Canada for FIFA Congress
-

 Crypto World2 days ago
Russia Pushes Bill to Criminalize Unregistered Crypto Services
-

 Sports6 days ago
NWFL opens Pathway for new Clubs ahead of 2026 Season
-
 Entertainment6 days ago
Brand New Day’ Footage Reveals the Devastating Impact of ‘Now Way Home’
-
 Business3 days ago
Creo Medical agree sale of its manufacturing operation
-

 Politics10 hours ago
Zack Polanski demands ‘council homes not luxury flats for foreign investors’
-

 Crypto World6 days ago
Trump whales load up ahead of Mar-a-Lago luncheon.
-
Crypto World7 days ago
Sei Network Enters Quiet Reset Phase as On-Chain Metrics Signal a Slowdown in 2026
-
Business6 days ago
Kering slides after Morgan Stanley downgrade, Gucci woes loom
-

 Tech6 days ago
Google adds E2E encryption to Gmail for iOS and Android enterprise users
-

 Tech7 days ago
Apple glasses won’t go brand shopping like Meta did with Ray-Ban and Oakley
You must be logged in to post a comment Login