Connect with us
DAPA Banner
DAPA Coin
DAPA
COIN PAYMENT ASSET
PRIVACY · BLOCKDAG · HOMOMORPHIC ENCRYPTION · RUST
ElGamal Encrypted MINE DAPA
🚫 GENESIS SOLD OUT
DAPAPAY COMING

Business

Wedgewood Partners Q2 2026 Client Letter (RWGIX)

Published

on

Wedgewood Partners Q2 2026 Client Letter (RWGIX)

Abstract line graph, close-up, with multicolored lines going down

matejmo/iStock via Getty Images

Are Hyperscalers Still Magnificent?

Chart 1: Momentum Stocks Go Full Tilt

Line chart titled 'U.S. Equity Price: Momentum vs. Minimum Volatility' showing a blue line for price and a red line for trend from 2000 to 2026. Key points are labeled: March 2000, June 2008, February 2021, and a peak in 2026 labeled '5 standard deviation overshoot!!'. The x-axis ranges from 2000 to 2024, and the y-axis ranges from 0.6 to 1.4. A note at the bottom states 'Note: Based on large- and mid-cap indices'.

Source: MSCI, Alpine Macro

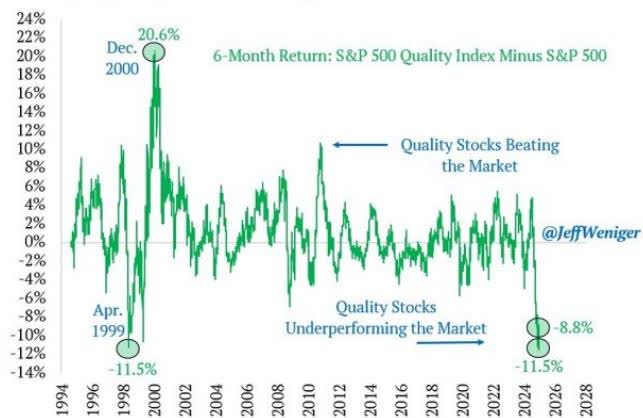
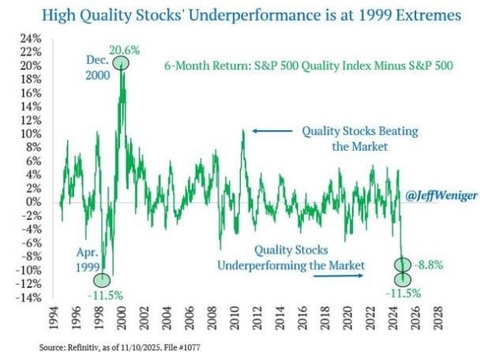
High Quality Stocks’ Underperformance is at 1999 Extremes

Line chart showing the 6-month return of S&P 500 Quality Index minus S&P 500 from 1994 to 2028. The y-axis ranges from -14% to 24%. Key points are labeled: Apr. 1999 (-11.5%), Dec. 2000 (20.6%), and 2024 (-11.5%). Annotations include 'Quality Stocks Beating the Market' and 'Quality Stocks Underperforming the Market'. The chart is attributed to @JeffWeniger.

Source: Refinitiv, as of 11/10/2025. File #1077

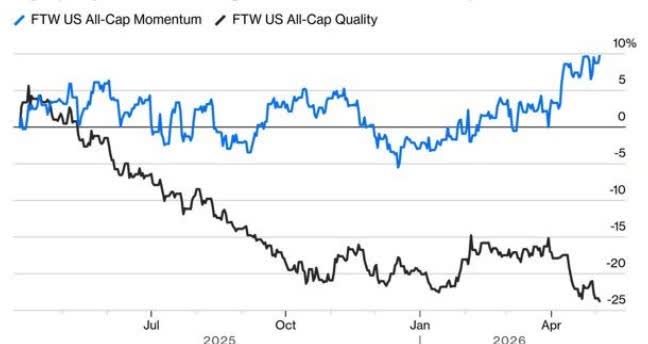
Big Mo’s Low-Quality Rally: High-quality stocks with strong balance sheets continue to be pummeled

Line chart comparing FTW US All-Cap Momentum (blue line) and FTW US All-Cap Quality (black line) from July 2025 to April 2026. The y-axis ranges from -25 to 10%. The momentum line is generally higher than the quality line, showing a significant rally in 2026.

Note: Figures show long-short total return starting 04/02/2025 (Liberation Day).Source: Bloomberg Factors To Watch Bloomberg Opinion

Review and Outlook

2Q YTD 1-Year 3-Year 5-Year
Wedgewood Composite Net 9.4 2.5 6.6 14.5 8.5
Standard & Poor’s 500 Index 15.2 10.2 22.3 20.6 13.4
Russell 1000 Growth Index 16.7 5.3 17.7 22.6 13.7
Russell 1000 Value Index 13.9 16.3 27.1 17.8 11.2
10-Year 15-Year 20-Year 25-Year 30-Year
Wedgewood Composite Net 14.1 12.7 11.5 9.6 11.9
Standard & Poor’s 500 Index 15.5 14.4 11.4 9.6 10.4
Russell 1000 Growth Index 18.6 16.5 13.6 10.6 10.8
Russell 1000 Value Index 11.5 11.5 8.8 8.4 9.5 ¹

Advertisement
Q2 Top Contributors Avg.Wgt. Contributionto Return
Taiwan Semiconductor Manufacturing (TSM) 9.46 3.45
Alphabet (GOOGL) 9.56 2.23
United Rentals (URI) 3.44 1.63
Apple (AAPL) 7.20 0.95
Visa (V) 5.31 0.71
Q2 Bottom Contributors
Tractor Supply Company (TSCO) 1.15 -0.84
Copart (CPRT) 2.85 -0.42
CDW (CDW) 1.53 -0.41
Motorola Solutions (MSI) 5.34 -0.20
Hermes 2.10 -0.16
¹ Portfolio returns and contribution figures are calculated net of fees. Contribution-to-return calculations are preliminary. The holdings identified do not represent all securities purchased, sold, or recommended. Returns are presented net of fees and include the reinvestment of all income. “Net (actual)” returns are calculated using actual management fees and are reduced by all fees and transaction costs incurred. Past performance does not guarantee future results. Additional calculation information is available upon request.

Top performance contributors for the second quarter include Taiwan Semiconductor Manufacturing, Alphabet, United Rentals, Apple, and Visa.

Top performance detractors in the second quarter include Tractor Supply Company, Copart, CDW, Motorola Solutions, and Hermès (HESAY) ADR. (Note: We no longer have an ADR percentage limit in our portfolio.)

During the quarter, we were unusually busy. We bought Hermès and sold Tractor Supply Company, Zoetis (ZTS), and CDW. We increased positions in Chubb (CB), Progressive (PGR), Meta (META), Amazon (AMZN), Microsoft (MSFT), and Visa. We trimmed United Rentals, Alphabet, and Taiwan Semiconductor Manufacturing.

Alphabet was a top contributor to performance during the quarter. Google Search and Cloud continue to accelerate, with Search posting 19% revenue growth and Cloud posting 63% revenue growth, helping drive 30% growth in operating income. That torrid growth in operating income compares to, we estimate, more than 40% growth in Alphabet’s total gross assets. While that means returns on capital were slightly diluted, they remain above 30%. We think Alphabet is an exceedingly rare, if not entirely unique, business, growing a nearly $450 billion gross asset base by 40% while maintaining a 30% return on that massive asset base . These are astonishing compounding figures. Further, we have excluded from operating income large, unrealized gains from the Company’s investment portfolio, which totaled more than $35 billion in the most recent quarter (mostly due to SpaceX (SPACE)) and nearly $50 billion over the past six quarters. The Company also has a 14% stake in the private company Anthropic (ANTHRO). That stake could be worth more than $100 billion based on valuations reported from recent capital raises. We highlight these investments because these investees are drivers of recent inflation in component costs, especially DRAM memory. Although the market typically ignores the “one-time” investment gains that Alphabet has made, we think these extremely large gains have served as a de facto hedge for the rapid, incremental capex spending requirements. In other words, we estimate the $150 billion in investment gains on SpaceX and Anthropic (if realized) could effectively cover incremental DRAM-related capex costs for several years. These one-time gains are not included in our core calculations for returns – but suffice it to say, Alphabet has plenty of excess profitability to continue investing both responsibly and aggressively.

Advertisement

In addition, Alphabet announced it would begin delivering its proprietary Tensor Processing Units (TPU) to external customer data centers, representing a very sizable new addressable market. Alphabet has spent more than a decade developing and iterating on TPU systems for internal workloads, claiming to reduce the cost of serving its AI model (Gemini) by almost 80%. We expect Alphabet to continue delivering excellent returns as it helps proliferate AI use cases for businesses, consumers, and data centers. Despite outperformance during the quarter, we continue to manage portfolio concentration risk by limiting individual position sizes to 10%.

Although Microsoft, Amazon, and Meta have different business models and were not necessarily top drivers of performance during the quarter, we view their investment opportunity set, from both a compounding and returns perspective and a component-cost-hedge perspective, as similar to Alphabet’s.

Microsoft ended the most recent quarter with average gross assets of more than $585 billion (trailing two years), up 22%, yet generated $170 billion in gross cash flow over the prior four quarters, up 27% from a year ago. Again, these are astonishing figures: Microsoft added an average of $100 billion in assets and $27 billion in incremental cash flows. The Company is achieving nearly 30% returns while compounding the assets that generate those returns at more than 20% – extraordinary! On top of that, Microsoft reportedly has an investment in OpenAI (OPENAI) worth over $100 billion, so we think these huge investment gains, if realized, also effectively serve as a hedge against commodity inflation, particularly incremental DRAM-related capex over the coming years.

As we have noted before, Amazon is another member of this elite group generating high returns, and we think it is being quite rational by rapidly compounding its asset base at these returns. During the quarter, Amazon grew revenue by 17% and operating income by 30%. While the bears continue to complain about Amazon’s $200 billion in capex growth and dwindling free cash flow, we estimate this incremental capex will increase the 2025 total asset base by around 28%. With 30% cash flow growth on what we assume is at least 28% asset growth, we conclude Amazon is achieving at least as good, if not better, returns on capital than it has previously – yet the stock is trading near historically depressed multiples. This is another telltale sign to us that the Company’s aggressive free cash flow reinvestment is very rational and that the depressed valuation presents an excellent long-term investment opportunity for us. Moreover, we estimate the Company’s investment in Anthropic is worth at least $100 billion and, if realized, will serve as another effective hedge against commodity memory price inflation, especially in DRAM, over the next few years. That should be long enough to offset inflation until more DRAM capacity comes online to moderate prices.

Advertisement

Last but not least in the capex spending bonanza is Meta Platforms. While they have certainly received its share of criticism for recently increasing its 2026 capex plans by around $10 billion, citing DRAM inflation, we’d like to point out that the warrants Meta holds on Advanced Micro Devices (AMD), related to a strategic sourcing arrangement with AMD struck in late February (~5 months ago), are now worth close to $90 billion, by our estimate (a swift nine times more than the incremental DRAM inflation for 2026). Meta’s sourcing advantage from its massive scale gives it the bargaining power to keep commodity cost inflation in check, which investors are so worried about. Although this investment in AMD does not technically qualify as a GAAP-based accounting hedge, it is certainly an economic hedge that we believe investors have completely overlooked, even though it should serve to blunt the effects of DRAM inflation and bolster returns for years to come.

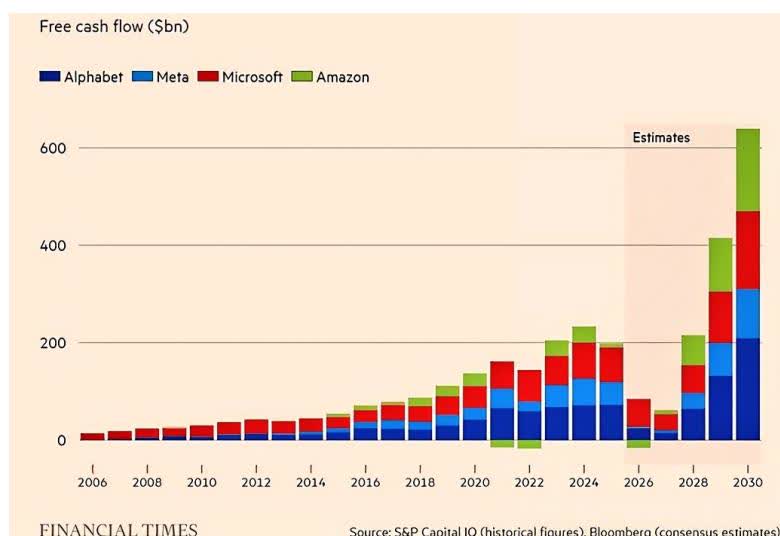
Stacked bar chart showing Free cash flow ($bn) from 2006 to 2030 for Alphabet, Meta, Microsoft, and Amazon. The chart shows a significant increase in free cash flow starting around 2020, with a sharp rise in estimates from 2026 onwards.

Another beneficiary of the AI spending boom has been Taiwan Semiconductor Manufacturing. Revenues grew by more than 40% (in USD), on top of 40% growth last year. Its leading-edge fabs and packaging capacity are fully booked, driving margins to all-time highs. Much of this capacity was put in place a few years ago, before generative AI was a household and business-wide term. More recent demand signals from customers – including Nvidia (NVDA), Broadcom (AVGO), and even Micron – indicate AI-related growth of over 50% per annum through 2029. Whereas the Company used to have demand visibility only a few quarters out, it now has visibility a few years out. As with long-held portfolio risk mitigation, we limit all positions to 10% weightings. We believe it is prudent to maintain this risk-management limit on the stock, especially given the massive investor inflows into semiconductor-levered stocks and the large speculative ecosystem (e.g., 2x- and 3x-leveraged single-stock ETFs) that has recently sprung up around them.

United Rentals was a top performer across portfolios. Equipment rental sales growth accelerated to 9%, while adjusted margins stabilized, driving 10% growth in earnings per share. This acceleration was driven by strong nonresidential construction end markets, particularly data centers and power projects, and by continued growth in megaprojects.

Apple was also a top contributor to performance during the quarter. Revenues grew 17%, driven by 22% growth in iPhone and 16% growth in services. The iPhone 17 family has catalyzed a solid upgrade cycle ahead of what we expect to be another strong launch later this year, featuring a new foldable form factor. Because input prices for DRAM have risen at a parabolic rate, the Company recently raised prices on some of its devices to pass these costs through. As one of the largest single purchasers of DRAM, the Company has strong negotiating leverage, but it can also implement hardware and software innovations to reduce its dependence on memory.

Advertisement

Visa contributed to quarterly performance, reporting accelerating revenue growth of 17%, driven by 11% growth in payment volumes and 21% growth in cross-border volume. Value-added services also grew 25% and now represent almost one-third of the Company’s total revenue. Agentic commerce remains nascent but could represent a new addressable market for Visa as the Company tracks and helps autonomous AI agents perform microtransactions. This contrasts with just a few quarters ago, when the market was fretting about the risks agentic commerce could pose. We think Visa’s global scale, including acceptance at over 130 million merchants, and deep integration with almost 15,000 financial institutions make it a valuable partner for agentic commerce startups.

Company Commentaries

Hermès

We recently initiated positions in Hermès International, one of the world’s leading designers, manufacturers, and retailers of ultra-luxury leather goods, apparel, and accessories.

Hermès began in 1837 as a harness and saddle maker in a Paris shop, after its founder, Thierry Hermès, trained for eight years as a master craftsman. From the beginning, the company focused on artisanal skill, high-quality materials, and exceptional craftsmanship, earning awards and serving a prestigious upper-class clientele in and beyond Paris, including world leaders and royalty. Over time, the Company expanded into adjacent equestrian-related product categories, including bags, leather gloves, and scarves, intended for riders. In the 20th century, with the advent of the automobile and the fading importance of horses, the Company applied its leather goods expertise to areas such as luggage, leather jackets, and handbags.

Today, the Company still produces equestrian equipment as part of its leather goods segment, which remains its largest at 44% of revenues. The Company has also built important businesses over time in apparel and accessories (28% of revenues), a highly recognizable and unique business in silk scarves and other fabrics (9% of revenues), and businesses in watches, beauty, perfume, and other areas.

Advertisement

The Company has likewise expanded from its single store on Rue Honore in Paris—which still exists—to nearly 300 stores globally. Top geographic markets now are Asia (over 50% of revenues), Europe (roughly 25%), and the Americas (roughly 20%), with sales in the Middle East relatively insignificant. However, Middle Eastern customers make sizable contributions to sales in other markets as tourists.

Over time, Hermès has continued to focus on the factors that led to its success nearly 200 years ago: using highly skilled artisans to hand-produce its products from the highest-quality materials. This has given the Company a lasting brand heritage that has driven demand, commanded deservedly high prices, delivered high, consistent profitability, and insulated the Company to a large degree from competition.

Hermès has repeatedly produced iconic products with decades of staying power, indicating that the brand’s success is not built on the caprices of fashion whims or fads but on its heritage and quality. Some of these products include the Birkin bag, first produced in 1984 after the Company’s CEO shared a plane journey with actress Jane Birkin, who complained that there were no fashionable handbags suitable for a young mother; the Oran sandal, first launched in 1997 and known for its quality, comfort, simplicity, and versatility; and the Company’s iconic silk scarves, produced in very limited runs in a variety of patterns, originally intended to protect the long hair of horse riders and now adapted for a variety of uses.

Three iconic Hermès products: an orange Birkin bag, a pair of light blue Oran sandals, and a patterned silk scarf.

Many brand names do not mean anything. To demonstrate this, one need only survey the detritus of “brand names” littered all over Amazon, which are clearly made-up noises for cheap, low-quality commodity products. Any company can spend advertising money to tell you that its product is great, preferably through some of our long-time holdings, Meta and Google. Advertising generally seeks to lead consumers to attribute some credit or personal affection to those brand names. Most of those companies are mass-producing products with cheap materials and methods in low-cost manufacturing markets; or perhaps with slightly better materials, methods, or manufacturing; or by trying to convince you that they are doing so with better design sensibilities, which are in fashion and sometimes are not.

Advertisement

Producing luxury goods by the hands of the most skilled artisans in markets such as France or Italy, using the highest-quality materials, which are usually produced in these same markets, is in fact a unique, personal appeal. Doing so with a brand that has developed a decades-long reputation for this (nearly centuries-long, in the case of Hermès), in reality and not only in an advertising pitch, earns you a loyal, often multigenerational following, which should lead to established premium pricing and sustainable high margins.

Selected Apparel, Footwear, and Accessories industry peers

EBIT margins, most recent FY

Advertisement
HESAY 41.8% Hermes, luxury
LVMH (LVMUY) 21.9% Moët Hennessy Louis Vuitton, luxury conglomerate
TPR 18.0% Tapestry (TPR), accessible luxury conglomerate
NKE 8.2% Nike (NKE), mass market shoes/activewear
LULU 20.1% Lululemon (LULU), upper mass market activewear
DECK 22.8% Deckers (DECK), upper mass market apparel/shoes/accessories
RL 16.2% Ralph Lauren (RL), calls itself luxury but is spread across many price levels including mass market
source: FactSet Data Systems

The Company’s long-term focus on the highest quality has led to sustainably strong demand and exceptional profitability. While we have found it difficult to obtain reliable, easily comparable data for the luxury goods industry—and there is an array of definitions of what “luxury” is—we can provide a direct comparison between Hermès and the U.S. Apparel, Footwear, and Accessories industry, which will be most familiar to our readers and comprises the majority of our investment opportunities in this segment.

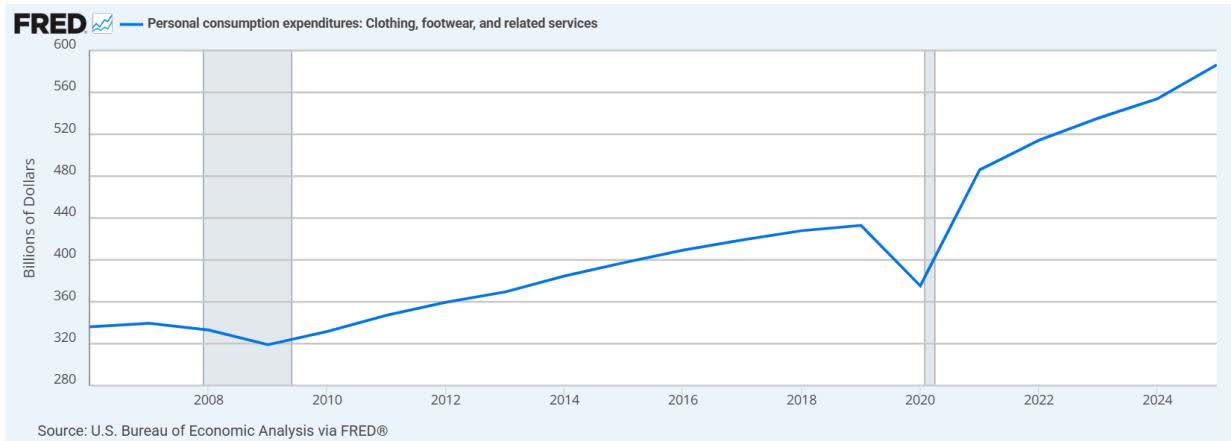
According to the U.S. Bureau of Economic Analysis, U.S. personal consumption expenditures on clothing, footwear, and related services have grown at a compound annual growth rate of about 2.8% over the past 20 years.

Line chart showing Personal consumption expenditures: Clothing, footwear, and related services from 2006 to 2024. The chart shows a general upward trend with a significant dip in 2020 followed by a sharp recovery.

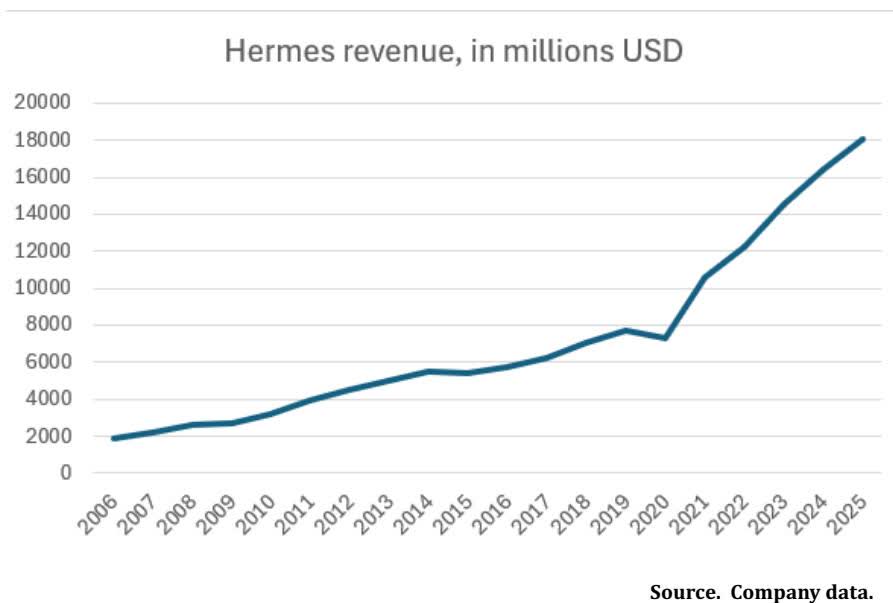
Over the same period, Hermès has seen its revenue growth compound at 11.8%. Given the varying definitions of the global luxury goods market and the lack of particularly good data available to us, our best approximation is that the luxury market itself has roughly tripled over this time, for a CAGR of roughly 5.5%. Although the luxury apparel-footwear-accessories market has outgrown the standard market for those categories, the Company has capitalized on its strategy and heritage to deliver outsized growth relative to its industry. We would note that this period included two of the most traumatic economic periods in recent history: the 2007-2009 global financial crisis and the 2020 pandemic.

Line chart titled 'Hermes revenue, in millions USD' showing revenue from 2006 to 2025. The chart shows a steady increase in revenue over the years, with a notable dip in 2020 followed by a sharp recovery.

Another interesting component of the Hermès story, and of the ultra-luxury world in general, is the supply side of the equation. One could reasonably point out that a business strategy to limit supply is a sound approach in an industry seeking to cultivate an air of exclusivity and sustain high prices. An important point in the luxury goods industry is that supply appears constrained, whether or not that is a company’s strategy. Again, although solid industry data are hard to come by, our readers could search “luxury goods artisans’ shortage” and find more than 10 years of articles lamenting the shortage of skilled artisans in the industry.

Advertisement

The aging of the workforce, as older artisans retire and are not replaced, and the younger generation’s aversion to manual work. We understand that a skeptical person might not take some industry pronouncements at face value, and that a fear of supply shortages may drive both pricing and demand—we have found projections saying the industry is 20,000 artisans short. We have found others saying the industry is 90,000 people short, and there may be some leeway in those numbers. However, we would point out that luxury companies across the industry, as well as the governments of France and Italy in particular, have been investing in training and schools to encourage more people to enter these positions. Hermès itself has opened 24 workshops in its leather goods division, with four more scheduled to open over the next four years. Industry peers LVMH and Bottega Veneta likewise have invested heavily in training and education, and some Italian luxury houses are even making agricultural investments to support Italian silk and wool production.

So, we would say that Hermès and the rest of the industry may have planned for some supply scarcity over time as an effective strategy. Still, there seems to be a genuine scarcity of skilled artisans, with fairly compelling evidence that companies and governments are investing to prevent the supply situation from worsening. Again, we will point out that when you combine strong, consistent demand with limited and arguably declining supply, you get the pricing power and high profitability that we see with Hermès.

Turning to a real-life example, let’s refer back to the iconic Birkin bag. Perhaps you know someone who would like to get their hands on a new one? Here’s how. First of all, walking into a Hermès store isn’t going to do it. The bags are made in very limited quantities, so there will not be any in stock, and the few that trickle into stores are immediately sold by allocation to the store’s most important customers. How do you become one of the most important customers? You develop a long personal relationship with one of the sales associates. The key to this relationship is consistently spending a lot of money on other Hermès products. Sifting through various blogs, it seems you might be expected to spend at least one to two times the price of the Birkin bag before you even have a chance, at which point you might be offered one in a period somewhere between six months and three years later. If you are so lucky, retail prices start around $15,000 for smaller bags made from the company’s “base leather, ” and you can spend multiple times that amount on other designs. If you aren’t able to get an allocation directly from the store, though, don’t worry – you can buy the same bag from someone selling it on the secondary market for roughly double that price. This is very powerful brand equity for a bag introduced 42 years ago. This brand is not a fad. We also highly suspect that this brand equity would no longer exist if Hermès had chosen at some point to skimp on artistry or materials.

On the valuation front, the stock is rarely what many people—especially those outside the U.S. large-cap growth arena—would call “cheap.” Still, we note that significant insider ownership (the family owns 66.7% of the shares) serves as a valuation floor, and a business model of this quality warrants a premium valuation. The stock recently retreated to a more reasonable level after the company’s most recent results showed a modest negative impact from the outbreak of war in the Middle East. This disrupted some travel and particularly weighed on the business of Middle Eastern customers in tourism markets worldwide; we view this impact as temporary.

Advertisement

In summary, we believe Hermès is a true example of a company with significant brand equity, earned through an established, nearly 200-year history of doing things that are not easily replicated: having skilled artisans produce the highest-quality products from the highest-quality materials. The process and the brand work together to create both significant demand for the company’s products and significant profitability, and we expect the company to continue this trajectory of growth and profitability.

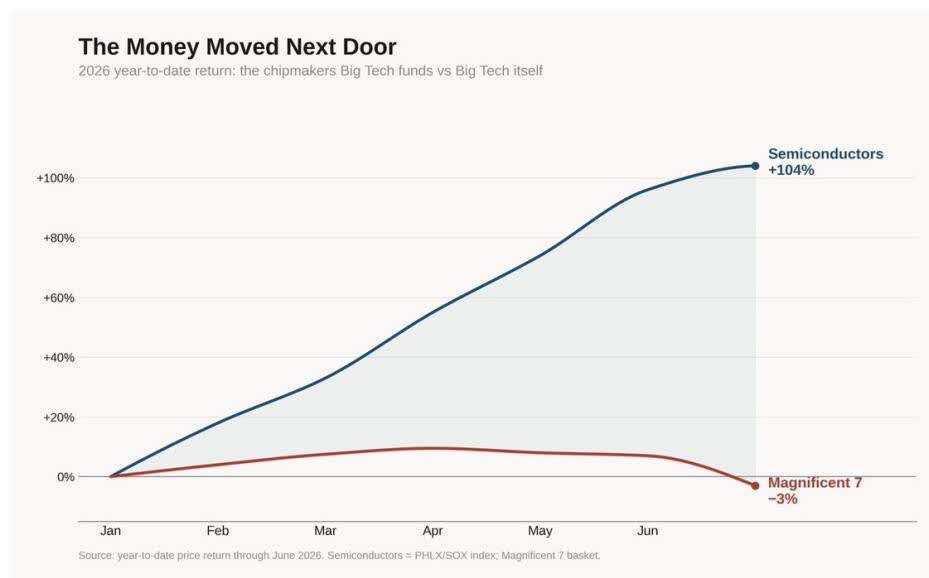
Are Hyperscalers Still Magnificent?

Line chart comparing the 2026 year-to-date return of Semiconductors (+104%) and the Magnificent 7 (-3%) from January to June. The Semiconductors line shows a steady upward trend, while the Magnificent 7 line shows a slight peak in April followed by a decline.

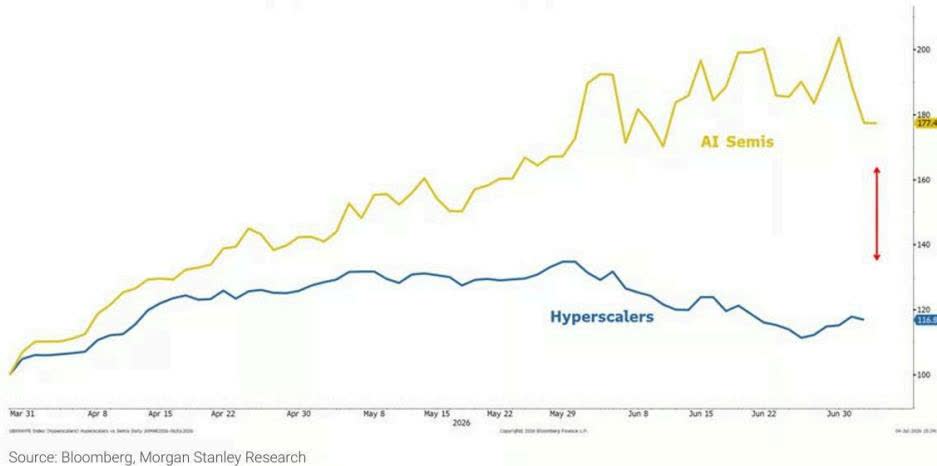
Exhibit 7: Divergence between Hyperscalers and Semis Likely to Close As Capex May No Longer Be Rewarded Unequivocally in the Markets for Now

Line chart showing the performance of AI Semis (yellow line) and Hyperscalers (blue line) from March 31 to June 30, 2026. The AI Semis index shows a significant upward trend, peaking around 180 in late May/early June, while the Hyperscalers index shows a more modest, fluctuating upward trend, peaking around 120 in late May/early June. A red double-headed arrow indicates the divergence between the two indices.

Are the Magnificent 7, particularly the hyperscalers, still magnificent? We certainly think so and have increased our weightings accordingly. Recall the Mag 7: Apple, NVIDIA, Tesla (TSLA); and the four “hyperscalers” – Alphabet, Amazon, Meta Platforms, and Microsoft. For some background, we’ve owned Alphabet and Apple for two decades, Meta Platforms for years, Microsoft for a few years, and, more recently, Amazon.

With the exception of Alphabet, which has generated stellar returns over the past one, three, and five years, the other three hyperscalers’ stocks have struggled mightily in 2026. The headwinds for hyperscalers are manifold. First, sentiment has turned quite negative, with the view that spending hundreds of billions to build out AI platforms will certainly benefit technology hardware companies but also materially harm the profitability of the hyperscalers. Second, billions rotating into technology hardware stocks (particularly memory stocks) have been funded relentlessly by selling hyperscaler stocks. On this score, semiconductors currently make up nearly 25% of the S&P 500 Index, up from about 5% just a few years ago. Third, IPO funding for SpaceX and, prospectively, for the IPOs of Anthropic and OpenAI has come at the expense of selling hyperscaler stocks.

Earlier in the Letter, we made our case that the short-term hit to hyperscaler free cash flow, although real, is outweighed by the fact that current hyperscaler profitability is better than most fear. More pertinent to our longer-term bullish view, we expect the hyperscalers’ platforms to be central and critical to managing and providing AI for enterprises of all sizes.

Advertisement

The following graphics illustrate the outsized performance of semiconductor stocks. No doubt, the explosion in capex by hyperscalers has, in turn, boosted earnings for many technology hardware companies, but none more than semiconductors. Please note that our best-performing stock over the past one-, three-, and five-year periods has been Taiwan Semiconductor Manufacturing. The stock has also been among our largest positions. In addition, because the stock is an ADR, it is not part of the benchmark indices. In other words, our position in the stock has been pure active share. That said, our underweight in semiconductors over recent years has been a significant performance headwind.

We have a long history of investing in semiconductor stocks. Over the decades, these stocks have included Intel (INTC), Micron Technology (MU), Applied Materials (AMAT), Linear Technology, and Analog Devices (ADI). The key lesson we have learned (we have the scars to prove it) is that the semiconductor sector is notoriously cyclical, both in business cycles and in stock prices. These stocks are the epitome of a “momentum” stock. When business is booming, earnings estimates are typically far too low relative to actual results. Demand, combined with pricing power, drives incredible margin increases. Further, in boom times, earnings soar, and expectations for future earnings do as well. Stocks boom. Said through the lens of fundamentals, peak earnings deserve trough valuations.

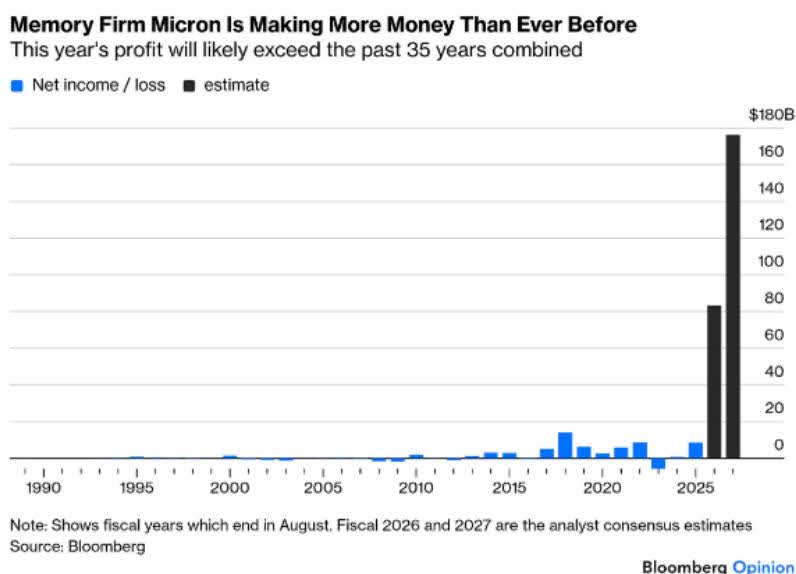
The current semiconductor cycle is historic. Consider SK Hynix (SKHY)’s recent results. The South Korean company holds a majority share of high-bandwidth memory, which is essential for the current generation of GPUs. Revenue of $35.5 billion was up 198% year over year, crushing consensus estimates, and the company’s net income surged 398%. Not to be outdone, Micron Technology’s profit surge is one for capitalism’s history books.

(An aside. As this Letter is being finalized – June 13 – Some froth has come out of semiconductor memory stocks – at least the casino-like trading in South Korea stocks. Consider, the 3X levered SK Hynix fund, which was launched just 30 days ago, peaked at $36. Today it is trading at $4. The 2X fund has too crashed, down -70% from recent highs.)

Advertisement

Bar chart showing Micron's net income from 1990 to 2025. The chart shows a massive spike in 2025, reaching nearly $180 billion, which is significantly higher than the combined profits of the previous 35 years. The y-axis is labeled in billions of dollars ($180B, 160, 140, 120, 100, 80, 60, 40, 20, 0). The x-axis shows years from 1990 to 2025. A legend indicates blue bars for 'Net income / loss' and black bars for 'estimate'. The 2025 bar is black, indicating it is an estimate.

Memory company earnings will surely grow over the next few years, at least until demand cools and/or supply shortages wane. However, and this is key, it only takes a modest cooling in current red-hot demand or a modest easing of the significant supply shortage for these stocks to drop as suddenly as they have risen because expectations reverse; earnings expectations will always be too high once growth-rate deceleration kicks in. It is the second derivative change in the rate of growth that matters. This is how cyclical top traps are set. The market always sniffs out a peak in earnings growth acceleration well before the cycle turns. Again, it matters little if earnings continue to grow; the stocks lead fundamental results, often by years.

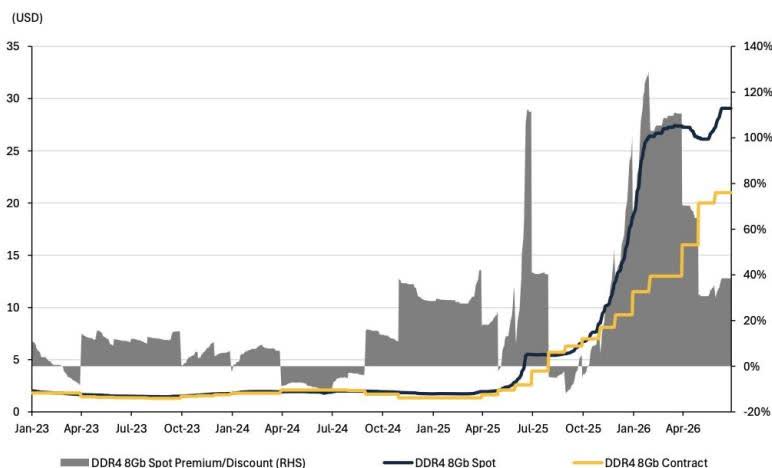
Exhibit 2: DDR4 8Gb spot is trading at 38% premium vs. latest contract price – DDR4 8Gb spot pricing premium/discount vs. contract

A dual-axis chart showing DDR4 8Gb spot pricing premium/discount vs. contract from Jan-23 to Apr-26. The left Y-axis represents USD price (0-35), and the right Y-axis represents premium/discount percentage (-20% to 140%). The X-axis shows dates from Jan-23 to Apr-26. A grey area chart shows the premium/discount, which spikes significantly in late 2025 and early 2026. A blue line shows the DDR4 8Gb Spot price, which rises sharply from late 2025. A yellow line shows the DDR4 8Gb Contract price, which remains relatively flat and lower than the spot price.

Source: Trendforce

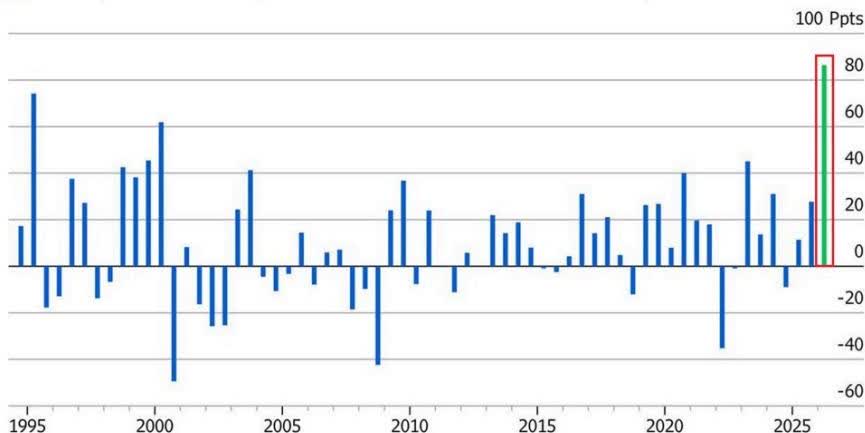
Chip Stocks Head for Best First Half Versus S&P 500 Ever

■ Philadelphia Stock Exchange Semiconductor Index – S&P 500 Index 1H performance

A bar chart showing the 1H performance of the Philadelphia Stock Exchange Semiconductor Index versus the S&P 500 Index from 1995 to 2026. The Y-axis represents performance in points (-60 to 100). The X-axis shows years from 1995 to 2026. The chart shows that the semiconductor index has consistently outperformed the S&P 500 index, with a particularly strong performance in 2026, reaching nearly 80 points.

Source: Bloomberg

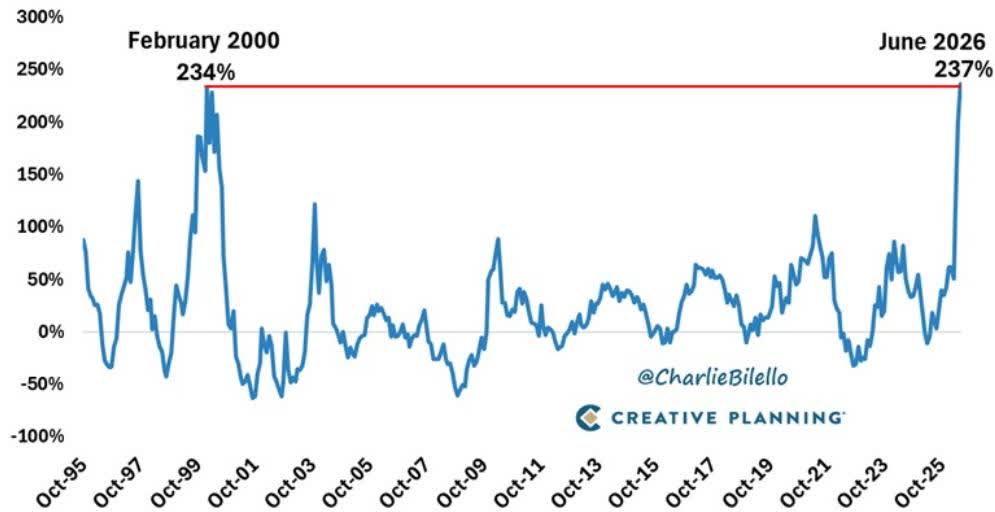
Semiconductor Index (($SOX)) – Rolling 14-Month Returns

(October 1995 – June 2026 – as of 6/30/26)

Line chart showing the Semiconductor Index (($SOX)) Rolling 14-Month Returns from October 1995 to June 2026. The chart shows a peak of 234% in February 2000 and a current value of 237% in June 2026. The y-axis ranges from -100% to 300%.

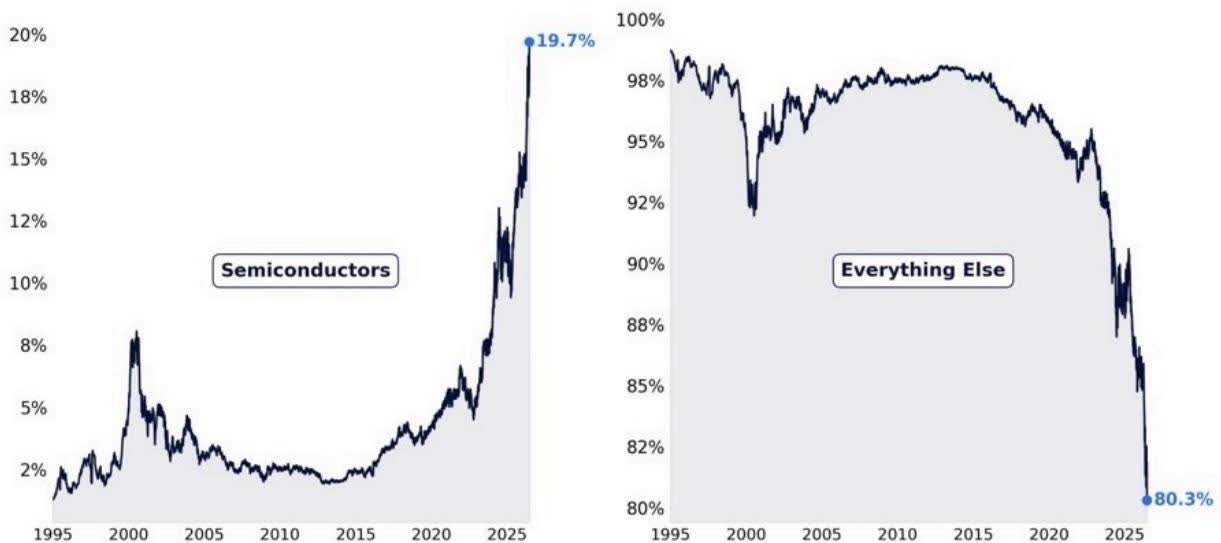
Semiconductor Weight in the S&P 500

Since 1995

Advertisement
Two area charts showing the Semiconductor Weight in the S&P 500 since 1995. The left chart shows the weight of Semiconductors, peaking at 19.7% in 2025. The right chart shows the weight of Everything Else, ending at 80.3% in 2025.

Source: Bloomberg, S&P Global, as compiled by Citadel Securities, GMI, as of June 2026. Figures are for illustrative purposes only. Past performance figures do not guarantee future results.

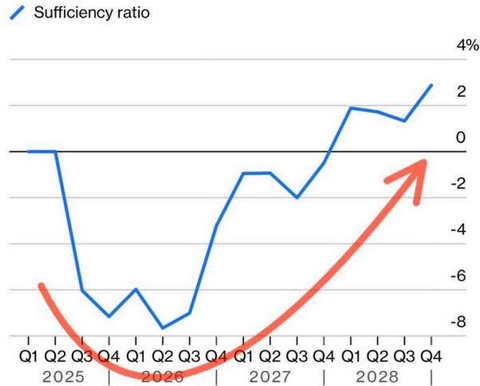
Memory Shortage Won’t Last Forever

The industry might be oversupplied as early as 2028

Line chart showing the Sufficiency ratio from Q1 2025 to Q4 2028. The ratio starts at 0, drops to -8 by Q4 2025, then rises to 2 by Q4 2028. A red arrow points upwards from the bottom of the chart.

Source: Bloomberg Intelligence Bloomberg Opinion

We are reposting this graphic from the title page.

Line chart showing the 6-month return of the S&P 500 Quality Index minus the S&P 500 from 1994 to 2028. The chart shows a peak of 20.6% in Dec. 2000 and a trough of -11.5% in Apr. 1999. A blue arrow points to the peak with the text 'Quality Stocks Beating the Market' and a red arrow points to the trough with the text 'Quality Stocks Underperforming the Market'.

Source: Refinitiv, as of 11/10/2025. File #1077

Big Mo’s Low-Quality Rally – High-quality stocks with strong balance sheets continue to be pummeled

Line chart showing the long-short total return of FTW US All-Cap Momentum and FTW US All-Cap Quality from July 2025 to April 2026. The Momentum line is blue and the Quality line is black. The Momentum line is consistently higher than the Quality line.

Note: Figures show long-short total return starting 04/02/2025 (Liberation Day). Source: Bloomberg Factors To Watch Bloomberg Opinion

As we have written (and discussed with clients) over the past 34-plus years, we usually underperform when momentum strategies are ascendant. That has been true over the past 15 months. Our underperformance has been stark. From mid-April 2025 through June 30, our Composite is up 25%, a relative pittance compared with the 90% gain for the Invesco

S&P 500 Momentum ETF (SPMO). It is little surprise that the SPMO portfolio is composed of 50% technology stocks, mostly semiconductor stocks, plus other AI-related stocks that dominate the largest holdings within the large-cap benchmark indices.

Advertisement

We continue to fish in the high-quality pond. So far, this scarlet-letter pond continues to yield opportunities. In recent months, we’ve added Chubb, Toll Brothers (TOL), United Rentals, Progressive, and, most recently, Hermès. Good fishing.

David A. Rolfe, CFA | Chief Investment Officer

Michael X. Quigley, CFA | Senior Portfolio Manager

Christopher T. Jersan, CFA | Portfolio Manager

Advertisement

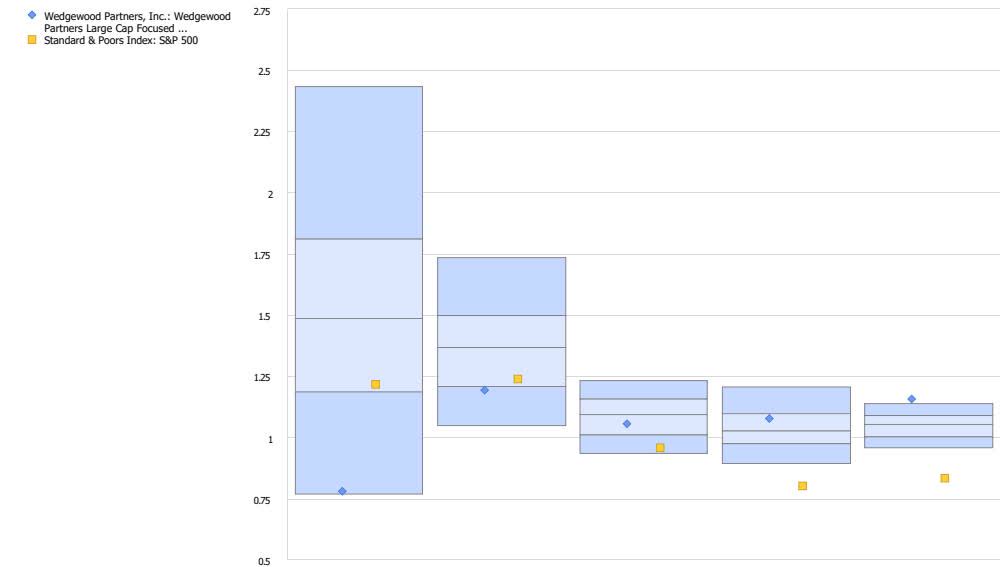
Box plot comparing Wedgewood Partners, Inc. performance against the Standard & Poors Index: S&P 500 across five time periods: 1 Year, 3 Years, 5 Years, 10 Years, and 20 Years. The y-axis represents performance in USD using Spot Rate (SR), ranging from 0.5 to 2.75. Wedgewood's performance is shown as a blue diamond, and the S&P 500 is shown as an orange square. The box plots show the distribution of performance for the S&P 500.

Universe: eVestment US Large Cap Growth Equity (Percentile)

VT RM 1 Year 3 Years 5 Years 10 Years 20 Years
Rk Rk Rk Rk Rk
5th Percentile 2.43 1.73 1.23 1.20 1.14
25th Percentile 1.81 1.50 1.16 1.10 1.09
Median 1.48 1.37 1.09 1.02 1.05
75th Percentile 1.18 1.21 1.01 0.97 1.00
95th Percentile 0.77 1.05 0.93 0.89 0.96
# of Observations 261 254 245 209 148
◆ Wedgewood Partners, Inc. SA GF 0.78 94 1.19 78 1.05 61 1.08 33 1.16 2
■ Standard & Poors Index IX IX 1.22 70 1.24 71 0.96 90 0.80 99 0.83 100

Results displayed in USD using Spot Rate (SR).

eVestment Alliance, LLC and its affiliated entities((collectively “Nasdaq eVestment”)) collect information directly from investment management firms and other sources believed to be reliable, however, Nasdaq eVestment does not guarantee or warrant the accuracy, timeliness, or completeness of the information provided and is not responsible for any errors or omissions. Performance results may be provided with additional disclosures available on Nasdaq eVestment’s systems and other important considerations such as fees that may be applicable. Not for general distribution and limited distribution may only be made pursuant to client’s agreement terms. * All categories not necessarily included, Totals may not equal 100%. Copyright © Nasdaq. All Rights Reserved.

Advertisement


References

  1. 1 Portfolio returns and contribution figures are calculated net of fees. Contribution-to-return calculations are preliminary. The holdings identified do not represent all securities purchased, sold, or recommended. Returns are presented net of fees and include the reinvestment of all income. “Net (actual)” returns are calculated using actual management fees and are reduced by all fees and transaction costs incurred. Past performance does not guarantee future results. Additional calculation information is available upon request.

The information and statistical data contained herein have been obtained from sources we believe to be reliable, but we do not warrant their accuracy or completeness. We do not undertake to advise you of any changes in figures or our views. This is not a solicitation of any order to buy or sell. We, our affiliates, and any officer, director, stockholder, or any member of their families may have a position in and may from time to time purchase or sell any of the above-mentioned or related securities. Past results are no guarantee of future results.

This report includes candid statements and observations regarding investment strategies, individual securities, and economic and market conditions; however, there is no guarantee that these statements, opinions, or forecasts will prove correct. These comments may also include speculative opinions and should not be relied on as statements of fact.

Wedgewood Partners is committed to communicating candidly with our investment partners because we believe our investors benefit from understanding our investment philosophy, investment process, stock selection methodology, and investor temperament. Our views and opinions include “forward-looking statements” that may or may not be accurate over the long term. Forward-looking statements can be identified by words such as “believe, ” “think, ” “expect, ” “anticipate, ” or similar expressions. You should not place undue reliance on forward-looking statements, which are current as of the date of this report. We disclaim any obligation to update or alter any forward-looking statements, whether as a result of new information, future events, or otherwise. While we believe we have a reasonable basis for our appraisals and have confidence in our opinions, actual results may differ materially from those we anticipate.

The information in this material should not be considered a recommendation to buy, sell, or hold any particular security. The securities identified and described do not represent all securities purchased, sold, or recommended for client accounts. The reader should not assume that an investment in the identified securities was or will be profitable.

Advertisement


Original Post

Editor’s Note: The summary bullets for this article were chosen by Seeking Alpha editors.

Editor’s Note: This article covers one or more microcap stocks. Please be aware of the risks associated with these stocks.

Advertisement
Continue Reading
Click to comment

You must be logged in to post a comment Login

Leave a Reply

Business

Country Risk: Drivers, Measures And Investment Implications – The 2026 Edition

Published

on

Country Risk: Drivers, Measures And Investment Implications - The 2026 Edition

Country Risk: Drivers, Measures And Investment Implications – The 2026 Edition

Continue Reading

Business

Bristol consultancy secures major investment and expands office base

Published

on

Business Live

Squarcle was founded in 2020 and has experienced rapid growth in the last six years

Squarcle is based at Queen Square in Bristol

Squarcle is based at Queen Square in Bristol(Image: Paul Fears)

A Bristol consultancy is planning to expand after securing a multimillion-pound investment from London-based Phoenix Equity Partners.

Squarcle was founded in 2020 by Gavin Emmerson MBE and Simon Perks, and provides specialist supply chain, procurement and data services to highly regulated markets.

The business has scaled rapidly since its launch, with former British Army logistics head joining the firm in 2022. It now counts organisations including the Ministry of Defence (MoD), civil nuclear operators and NATO among its customers and has a workforce of 140 consultants operating in mission-critical environments.

It is understood the funding from Phoenix will be used by Squarcle to grow its workforce, scale its technology offering, and expand into international markets.

Advertisement

Mr Emmerson said: “We were looking for a partner who would back our plans to scale and grow without asking us to compromise the very cultural values and tested methods that have powered our success to date.

“From the first meeting, Phoenix fitted the bill. They asked the right questions, and clearly understood the immense opportunity in the specialist supply chain and procurement sectors.”

Richard Hill, investment director at Phoenix Equity Partners, added: “Backing the right people is at the heart of what we do, and in Gavin, Nigel and the broader Squarcle leadership team we have found exactly that – a founder and group of operators who have built something genuinely differentiated from the ground up.

“We look forward to supporting them as they take the business to its next stage of growth.”

Advertisement

The announcement comes as Squarcle expands its office footprint in Bristol. The company is based on the first floor of 31-32 Queen Square – a recently refurbished building – and has agreed a new five-year lease on the second floor.

The letting was secured by commercial real estate firm Colliers.

Henry Squier, asset manager at Robert Hitchins, said: “Squarcle’s decision to expand within 31–32 Queen Square is a strong endorsement of both the quality of the refurbishment and the strength of the location.”

Advertisement
Continue Reading

Business

GRNJ: Underdog ETF Is Beating The Market YTD

Published

on

GRNJ: Underdog ETF Is Beating The Market YTD

GRNJ: Underdog ETF Is Beating The Market YTD

Continue Reading

Business

Vale Lang Coppin

Published

on

Vale Lang Coppin

Pilbara cattleman and Marble Bar stalwart Lang Coppin has died, aged 76.

Born Langtree Eric Christopher Coppin, Mr Coppin became a prominent voice in Pilbara and pastoral circles owing to his outspoken advocacy for the region and the industry.

Federal Durack MP Melissa Price in 2024 described him as a “straight shooter” and a “champion” for his community.

Central to Mr Coppin’s story was the 250,000-hectare Yarrie Station, the pastoral lease which his family has cared for since the pioneer days of the 1880s.

Advertisement

Mr Coppin served Marble Bar as a councillor for nearly five decades and was honoured as a freeman of the Shire of East Pilbara one year after his retirement in 2024.

He is believed to be the longest serving councillor in WA’s history, though there are insufficient records to prove it.

Mr Coppin was bestowed a Medal of the Order of Australia in 2013.

Like most pastoralists in the area, he was a pilot, a prospector, a builder, and a lobbyist for the agriculture sector.

Advertisement

He also dabbled in tourism, having bought up Marble Bar’s caravan park, shop and roadhouse to offer a better tourism experience for those adventuring out to the remote locale.

Charitable interests include support for the Royal Flying Doctor Service, the Port Hedland School of the Air, and the Isolated Children’s Parents’ Association.

The Coppin family is among the longest-running pastoral and business dynasties in Western Australia.

Advertisement

Mr Coppin’s daughter, Annabelle Coppin, is the fifth generation to run Yarrie station.

Yarrie’s Outback Beef brand is served at mine sites around the Pilbara and several restaurants in Perth

Advertisement
Continue Reading

Business

Waiting For AI Winners To Emerge

Published

on

Waiting For AI Winners To Emerge

Waiting For AI Winners To Emerge

Continue Reading

Business

AMD Stock Sinks Nearly 6% as Memory Chip Sector Selloff Spreads Into Broader Semiconductor Names Today

Published

on

Oil Prices Plunge Below $95 as US-Iran Ceasefire Sparks Relief

Shares of Advanced Micro Devices fell 5.77% on Wednesday, trading at $516.50 as of 11:52 a.m. EDT, down $31.62 on the day, as continued turmoil in the memory chip market spilled over into broader semiconductor stocks, extending a volatile stretch for the sector heading into a busy earnings season.

Wednesday’s decline continues a difficult period for AMD, which has posted several sharp single-day moves in recent weeks amid what analysts describe as a broader reassessment of valuations across the AI-linked chip sector following an extended rally.

A Sector-Wide Reaction to Memory Market Turmoil

Much of Wednesday’s pressure on AMD traces back to continued volatility surrounding South Korean memory chip maker SK Hynix, whose stock has swung dramatically following its recent Nasdaq listing. That volatility has repeatedly rippled through the broader semiconductor complex in recent sessions, dragging down chip names with limited direct exposure to the memory market, including AMD, alongside more directly affected memory producers such as Micron Technology and SanDisk.

Advertisement

AMD’s own move Wednesday reflects a pattern that has become increasingly familiar throughout July, in which sentiment shifts tied to memory pricing and supply dynamics have triggered outsized reactions across logic-focused chip designers, even when the underlying news carries limited direct relevance to their specific businesses.

A History of Extreme Volatility

AMD’s stock has proven especially sensitive to shifting sector sentiment in recent months. According to market data, the stock has recorded 41 separate moves greater than 5% over the past year, reflecting how significantly investor conviction toward AMD has fluctuated as the broader AI infrastructure investment narrative has evolved.

Earlier this month, AMD shares plunged 8% during a chip-specific reset tied to Samsung Electronics’ quarterly earnings report, before separately falling 7% amid a broader Bank of America warning about growing “bubble risk” in the AI trade. Just last week, the stock fell another 6.3% after reports indicated SK Hynix was deliberately slowing its high-bandwidth memory expansion, a development that sparked fears about a broader cooling in AI infrastructure demand even though subsequent analysis suggested the shift primarily reflected memory makers redirecting capacity toward more profitable conventional DRAM production.

Advertisement

Strong Underlying Fundamentals, According to Bulls

Despite the recent volatility, several Wall Street analysts have continued to express confidence in AMD’s underlying growth trajectory, particularly around its custom AI chip offerings. Citi has highlighted AMD’s custom MI450 chips as offering Meta Platforms a lower total cost of ownership compared with Nvidia alternatives, citing a six-gigawatt, four-year supply deal that includes a warrant for 160 million AMD shares and is set to begin ramping with an initial one-gigawatt tranche in the second half of 2026.

Citi has projected AMD’s AI GPU revenue could reach $33 billion in the near term, with potential to expand further to $50.8 billion over a longer time horizon, underscoring the scale of opportunity analysts continue to see in AMD’s AI accelerator business despite near-term stock volatility.

Analysts Continue Raising Price Targets

Advertisement

Even amid the recent pullback, several analysts have continued raising their price targets on AMD. TD Cowen recently lifted its price target to $675 from $600, while other firms have issued similarly bullish updates in recent weeks. Bank of America previously raised its price target on the stock to $500, citing a projected $1.7 trillion AI data-center market opportunity by 2030.

The disconnect between continued analyst optimism and the stock’s sharp near-term price swings underscores what several market observers have characterized as a broader valuation reset playing out across the semiconductor sector, rather than any fundamental deterioration in AMD’s underlying competitive position or long-term growth prospects.

A Remarkable Year Despite Recent Turbulence

Even accounting for Wednesday’s decline and other recent pullbacks, AMD’s stock remains up significantly for the year. The company’s shares had climbed as much as 134% since the start of 2026 at points during the summer, reflecting substantial investor enthusiasm for AMD’s positioning within the broader AI infrastructure buildout, even as that enthusiasm has periodically given way to sharp bouts of profit-taking.

Advertisement

Data Center and AI Business Continues to Grow

AMD’s underlying business results have continued to show strength amid the stock’s volatility. The company has recently announced production ramp-up of its next-generation EPYC processor, code-named “Venice,” built on TSMC’s advanced 2-nanometer manufacturing process, alongside plans to invest more than $10 billion in Taiwan’s broader AI supply chain ecosystem. AMD also gained server CPU market share during the first quarter of 2026, according to industry data, even as a key competitor’s share declined over the same period.

Upcoming Earnings Report in Focus

AMD is scheduled to report its fiscal second-quarter 2026 financial results in the coming weeks, a release that market participants increasingly view as a key catalyst capable of resetting sentiment toward the stock following its recent volatility. Investors are likely to focus closely on updated guidance for AMD’s data center and AI accelerator segments, along with any additional commentary on the company’s custom silicon partnerships with major hyperscale cloud computing customers.

Advertisement

A Broader Pattern of Sector Rotation

Wednesday’s decline in AMD shares fits within a broader pattern that has defined semiconductor sector trading throughout much of July, characterized by sharp swings driven by shifting sentiment around memory chip pricing, supply dynamics and broader questions about the sustainability of record AI infrastructure capital spending. Even as individual company fundamentals have generally remained strong across the sector, elevated valuations following an extended rally have left many chip stocks, including AMD, particularly vulnerable to outsized reactions when negative sentiment emerges anywhere within the broader semiconductor supply chain.

What Comes Next

With AMD’s upcoming earnings report set to provide the next major fundamental catalyst for the stock, investors are likely to continue closely monitoring developments across the broader memory chip sector in the interim, given how closely AMD’s recent trading has tracked sentiment shifts tied to companies with limited direct business overlap. Whether Wednesday’s decline represents another temporary pause within AMD’s broader 2026 rally, or the beginning of a more sustained period of consolidation across AI-linked semiconductor stocks, will likely become clearer as the company’s earnings report and broader sector developments unfold in the coming weeks.

Advertisement
Continue Reading

Business

Analysis-China’s record consumer defaults undermine Beijing’s push to boost spending

Published

on


Analysis-China’s record consumer defaults undermine Beijing’s push to boost spending

Continue Reading

Business

ETMarkets Smart Talk | India’s retail investing boom is structural, 40 crore demat accounts possible in 10 years: Sandeep Nayak

Published

on

ETMarkets Smart Talk | India's retail investing boom is structural, 40 crore demat accounts possible in 10 years: Sandeep Nayak
India’s retail investing story is still in its early stages, and the rapid rise in participation seen over the past few years is more structural than cyclical, according to Sandeep Nayak, MD & CEO of Centrum Finverse.

With India’s young demographic profile, rising incomes and growing awareness of digital investing, Nayak believes the number of Demat accounts could rise from around 20 crore currently to 30 crore over the next five years and potentially touch 40 crore in a decade.

In an interview with Kshitij Anand of ETMarkets, Nayak said that while the bull market has accelerated the entry of new investors, the underlying growth is being driven by India’s demographics and increasing financialisation of savings.

However, as younger investors, including Gen Z, embrace equities and derivatives, he cautioned that a get-rich-quick mindset and inadequate focus on risk management remain key challenges.

Advertisement

Nayak also discussed how technology, AI, data-driven research and personalised guidance could shape the next phase of digital broking. He believes that while the past decade was about democratising access to markets, the next 10 years will be about helping investors make more informed decisions, with research, risk management and multi-asset investing playing a crucial role in long-term wealth creation. Edited Excerpts –

Kshitij Anand: So, firstly, let us just understand how Centrum Finverse is taking shape and expanding its digital footprint. I would also want to know how the transformation of GalaxC fits into the overall roadmap.

Sandeep Nayak: When we started Centrum Finverse, we looked at the market landscape and saw that the market had expanded and access to markets had been democratised. But really, we found that traders were making losses. If you see SEBI’s report, which is published annually, retail traders over the last four years have lost close to three-and-a-half lakh crores, and the beneficiaries are players like Jane Street.

Advertisement

There was one background: you had discount brokers who created a platform and expanded the market. We saw that full-service brokers were only catering to the mass affluent and upwards. Really, retail was at God’s mercy. So, we felt that if there was a tech-enabled platform focused on research and guidance, there was a way to be made in this market, and you would get your place in the sun.

I will give you a simple analogy. I mean, if you give a very good cricket bat to everybody, they are not going to become good batsmen. You need coaching, technique, practice, and a lot of effort goes into becoming a good batsman. Or, if you have a high-performance car, digital access is like giving you a high-performance car, but to reach the destination, you still need a GPS.

So, we want to be that player who is bringing research and guidance and hand-holding customers. And if you see our app, which we have launched, GalaxC, which you referred to, is our trading app. We have created a lot of scientific tools to help investors navigate their journey in the markets.
If you look at options trading, or any trading for that matter, we will show the client the risk-reward. Before he enters the trade, he can see his maximum loss and maximum profit, so he knows. And then he knows the risk-reward ratio. So, if you say your loss is Rs 1,000 and there is an option to make Rs 3,000, then your risk-reward is 1:3. But if the trade involves a loss of Rs 1,000 and a profit of Rs 1,000, then the risk-reward is 1:1. Or, if the loss is Rs 1,000 and the profit is only Rs 500, why are you getting into that trade?
So, getting this tool into the hands of retail investors is kind of enabling them to get to that level. Of course, there is a lot more to do, but this will help them in making sure their journey is a lot better in terms of risk management. They know what they are doing. It does not guarantee you profits all the time because you can still incur a loss, but at least before you get into the trade, you know you can digest that loss. So, that is what we have done, and we think that this differentiation will bear out over time.
I mean, I would say the last phase of the last 5-10 years, really, if you count it, was about democratising access. The next 10 years, I think, will be about informed decision-making. It is easy to open a Demat account, (—) a trading account; it can be done in two minutes. But creating wealth is much harder, and that is where we want to help the investor.

We want to bring science to investing through data-driven research, analytics, and decision-support tools so that the investor relies less on emotion and more on evidence. That is what we have focused on. Right now, it is probably my talk; this will bear fruit. I think for this differentiation to be visible in the market, it is a process, and I feel that over the next one to three years, players who have this differentiation are the ones who will be the winners, not just those who have the platforms.

Kshitij Anand: And, in fact, when you were conceptualising GalaxC, what was the kind of need or problem that you were trying to address that was not being addressed earlier, but with GalaxC, it would actually suffice all the needs?
Sandeep Nayak: So, I will tell you that there are two worlds in this industry. One world is of players offering a platform at a low cost, where cheap brokerage is everything. And the other world is where you are offering full-service research, but offering it to the cream, that is, the mass affluent and upwards.

Advertisement

We wanted to bring the best of both worlds to retail investors. So, give them a platform where they can execute efficiently at a low cost, and at the same time, hand-hold them and give them guidance, which is available only to the mass affluent and upwards. And that is how we conceptualised GalaxC—to get the best of both worlds for the retail investor.

Not only give them a platform where they can play around, not just give them a cricket bat, but also coach them, hand-hold them, and show them how to actually play a long innings. That is our motto at Centrum Finverse.

Kshitij Anand: In fact, the digital broking space is also evolving, especially after COVID, you could say. So, let us say we take the past five to six-odd years, and it has really evolved. A lot of players have actually come into the picture. So, what does, let us say, the next decade look like, and who will actually emerge as winners? We are also seeing some consolidation happening, so yes, that is also there.
Sandeep Nayak: See, what I see is that technology has enabled us to offer services to retail customers in a personalised manner. Just like HNIs are getting personalised services from wealth relationship managers, technology can give a retail customer personalised service.

So, today, we are actually able to track a customer who comes to our app. Just like Bigg Boss—you have seen this Bigg Boss show, where there is a Bigg Boss tracking what is happening—you know which section he went to in the app and which section he was spending more time on. So, accordingly, you can tailor-make your offering to him.

Advertisement

So, people who are able to personalise the tech platform and offer personalised services and guidance to retail investors will be the winners. So, when you come in, I know, (—) “Welcome, Kshitij.” I know what your portfolio is, I know what you have been doing, so I am kind of pre-empting and giving you things that you would like to see. So, that is one differentiation.

And the second one is platforms that offer multi-assets. For example, we have also visualised that GalaxC will offer multi-assets. Today, we have equity and derivatives—all these stock brokerage services are the core offering—but we also have mutual funds. We have IPOs. And we are working on bonds and US investing, etc. Right now, we offer these offline, but we will bring the entire thing digitally.

We are going to gradually offer all financial products that a retail investor would want, digitally and with hand-holding—not just a platform, but hand-holding on what he needs to do.

For example, on our mutual fund platform, if you see the mutual funds listed, they are only the whitelisted funds that we are recommending, that our research recommends. And if you want to buy something else, you can still pick it from the drop-down and go buy it. But we are saying these are the ones—if you want to invest in large-cap funds, this; if you want to invest in mid-cap funds, this; if you want to invest in small-cap funds, this.

Advertisement

We have thematic baskets. I mean, portfolio management is available only to HNIs; the minimum threshold is Rs 50 lakh and upwards. Our baskets are available at as low as Rs 30,000. So, you can get a defence basket and know which stocks to buy. There is a power basket, which is thematic. And you are able to participate in the right stock selection without having to go to a top-quality fund manager, so research is doing that.

So, like I said, it is not just a platform, but being a part of the journey and trying to deliver value over the long term. Finally, where does he build trust with me? If I am able to deliver some alpha on his investments, he has to make some profit from using my platform. So, the research team that we have built is focused on that.

I mean, while HNIs get 30-page reports, retail investors do not need a 30-page report. It is probably a one-pager with the rationale that they need to invest in. So, we are focused on creating value for the retail investor because, as a house, we have an institutional brokerage that covers about 200 stocks, where we have a financial model and 30-page detailed reports, which can be given to institutional investors and high-net-worth investors.

Similarly, we run a private wealth outfit where wealth offerings are given to private banking customers. The research we do is about how we package this in a consumable format for the retail investor.

Advertisement

Kshitij Anand: Good that you pointed out the research part of it because most of the discount brokers or brokers that we see are providing the services, but there is no research as such involved in it, and that is where you sort of make that….

Sandeep Nayak: That is where we want to differentiate.

Kshitij Anand: And that will really help the business to carry on. And you rightly pointed out that you will be introducing a lot of other things that are getting into the mainstream, such as US investing, bonds, and other products. Is that something that will fuel the engine for the next five to 10-odd years?
Sandeep Nayak: Yes, over 10 years. But since the segment is retail, they will initially prefer investing domestically, investing in thematic baskets, and investing in mutual funds. I think US investing, etc., is for the mass affluent and upwards because you need to do LRS remittances, etc.

But we are offering certain ETFs. We are highlighting certain ETFs to retail investors, saying that you do not need to remit money abroad to buy US stocks to get exposure. There are certain ETFs through which you can get exposure, where you are getting the benefit of investing in the US. So, that is where….

Advertisement

We do not need to launch a separate US investing product. There are enough products that we need to highlight to investors to help them get into it and take advantage of that exposure.

Kshitij Anand: Now that we are talking about US investing, one theme that has really gained popularity is AI, especially in the last couple of years, or 12 to 18 months, you could say. How are you using AI in the business, technology, or app to make it more convenient for investors?
Sandeep Nayak: Yes, we are working on AI tools to assist customers. Right now, the tools that we have are quant-based, and technology is being used to provide quant-based ideas. We have two things in the works, including an AI-based platform where customers can ask questions and interact. It will first look at our own research that the house generates and answer based on that. If we do not have a report, it will probably look at outside research and give customers what they want. So, there will be an interface that we will provide. We are working on that.

And we also need some regulatory approvals, etc. We need to showcase it to the exchanges and get these things cleared, and we are working on that.

Kshitij Anand: Retail participation has picked up recently, and a lot of new retail participants have come in who are in the age bracket of, let us say, 25-plus. So, a lot of Gen Zs have also come into the picture. Is it because of the recent bull run, you could say, or is there genuinely interest coming in from the younger population? I am sure it is largely about how to make money in a short period of time. Is the focus more on that, or are these guys after long-term investments?
Sandeep Nayak: I think this particular move, the growth that you are seeing, is structural, and it has to do with India’s demographics. If you see, India has 65% of its population in the working-age group, and the median age of the working population is 29. More and more people are getting into the workforce and learning about… they are earning income, saving, and learning about financial planning and investments. So, this trend will continue.

Advertisement

And right now, we have close to 20 crore Demat accounts. Maybe in the next five years, it will be 30 crore, and in 10 years, 40 crore. That is a natural progression because people coming into the workforce will need to invest, and awareness of investing digitally and in equity markets has gone up.

I mean, previous generations were told to be conservative and safe, go into FDs, and go into physical assets. But this generation, Gen Z, which is what we are catering to through Centrum GalaxC, is willing to experiment and take risks. At 25, they are willing to trade options and derivatives, and that is why you are seeing the loss figures as well.

There is a learning process, and when you are learning, obviously, you have to pay. Markets are a place where you have to pay a price to learn. So, this trend will continue. The bull market has certainly helped. I am not saying that it has not helped. It has helped people take cognisance and come to the markets faster, but structurally, India is built in such a way that this has to keep growing. Over the next 10 years, you will probably see phenomenal growth.

Our penetration is still low. I mean, while we have 20 crore Demat accounts, the number of unique investors will be lower because people have multiple Demat accounts; somebody may have two or three. So, we still have less than about 10% of the population investing in the markets. And in advanced markets, we have seen 60-65%. So, even if we get to 20-25%, the opportunity is huge. We (—) do not need to go to 60-65%.

Advertisement

So, structurally, we are built for this. We are in the right place at the right time, and the markets will keep expanding. Bull markets will come and go. The pace may slow down in a bear market, but it will still keep growing. I am not in the camp that believes that it will stop. We will go to 40 crore in 10 years, and how fast we reach 40 crore is the question, not whether we will reach it. We will definitely reach it. So, that is there.

Kshitij Anand: So, we have seen a new lot of investors over the past, let us say, five-odd years. Ten years back, there was a different breed of investors. Now, the new lot has not seen any really big dip, like the 2008 Financial Crisis that we saw, and some of the other big dips that have happened. Are there any mistakes that you think the new lot is now making, or do you think they are more advanced or more upgraded, you could say, in their mindset compared with the older lot?
Sandeep Nayak: No, I think everybody has their fair share of mistakes. It is not that you have to go through… I mean, like the life cycle of a person from birth to death, there are a lot of experiences he goes through. As a child, he goes to school….

Kshitij Anand: We keep on saying that, “Arre, ab toh bahut mature log aa gaye hain,” like now the….

Sandeep Nayak: No, they have more information at hand. They have more information available digitally, but markets are a place where you will tend to make those mistakes that previous generations have made. And some of the things we commonly notice are that youngsters have a get-rich-quick mentality. Even among all the people who come to the markets, this market is like Bollywood—everybody wants to become a star like Shah Rukh Khan. So, when they come here, they feel they can make a killing.

Kshitij Anand: And every stock should be a blockbuster.

Sandeep Nayak: Yes, they feel they can make a killing. This is a place where they think, “My stars are good, I will make a killing,” only to realise that you get killed first. So, you learn. So, that get-rich-quick mentality is there; that is one.

Advertisement

And second, they are not paying sufficient attention to risk management, and that is what we are trying to educate them about. Before a trade, if I am telling you what your risk and reward are, what the loss is and what the potential gain is, at least I am trying to tell you: do not play blind; know what you are doing.

So, it is like that statutory warning on a cigarette pack—it is injurious to health—but at least we are trying to highlight to you what it is and saying that trading is not speculation; it is a science. Please understand.

On our platform, you can execute four trades simultaneously—two sell and two buy—and with a single click, they will get executed. But before that, it shows you, once you… what the margin involved is, what the risk is, what the reward is, and what the risk-reward ratio is.

So, that is where risk management comes in, and new investors fail to focus on that. We are trying to highlight to them: look at the risk first. So, that is how… your trading longevity is preserved. And it is good for me as a business if I train them and get them to become good traders, so that is the objective we have.

Advertisement

It is just like if I open a gym and put 10 trainers there. If there are no trainers, a person will go, stretch himself, get injured, and not come to the gym for six months. But if there is a trainer who is guiding him, he will exercise within his limits and come back the next day. So, that is what we want.

So, these are the two things, and every generation learns them the hard way. They will have to, but we are trying to help them by highlighting the risk….

Kshitij Anand: To bring down the learning curve….

Sandeep Nayak: Yes, and that is what, as a platform, we are trying to help you with—that these are the mistakes people make; look at the risk before you dive in.

Kshitij Anand: So, over the past few years, a lot of products have actually come into the system, and new investors are more open to those products as well. So, how relevant do you feel the multi-asset approach is at this point in time?
Sandeep Nayak: No, the multi-asset approach is highly relevant. I mean, it is one of the better risk management tools as well because when you invest in different asset classes, you are spreading the risk. Markets work in cycles, and cycles do not synchronise with each other.

So, when one asset is in a bull market, the other may be in a bear market, or when one is in a bear market, the other may be in a bull cycle. So, it reduces the impact of market cycles on your portfolio. You are able to better manage volatility, and if you do that, your long-term, consistent, risk-adjusted return is higher. And that is why it is better to have a multi-asset approach.

Advertisement

Because, let us say, you are only in equities. One year, you might get a 25% return if you are lucky; the next year, it could be a loss of 15% as well. But if you have mixed it with fixed income, gold, and silver, probably, if there is a hit in equities, these asset classes are still giving you returns. So, your risk-adjusted return is higher than what it would have been if you were only in a single asset class.

So, both from a risk diversification perspective and for better long-term risk-adjusted returns, a multi-asset strategy is the way to go.

Kshitij Anand: And how is technology shaping the industry at this point in time?
Sandeep Nayak: Technology is one of the big drivers of the financial services space, more so in broking and investments, where differentiation is coming in and where there is more and more excitement because you can offer hyper-personalised services to each customer.

I mean, because of the AI and data analytics tools that are available, we can decide what the risk profile of a customer is and what he should be offered, and technology allows us to do that with a uniform customer experience. If I have people doing it, it depends on how each person is handling the customer, whereas technology, at least, does not have behavioural biases and does not have a mood of its own for the day. There is an objective tool that is telling you what you need to do, so that is one important aspect.

Advertisement

Second, technology also helps you make smarter decisions with risk under control. It reduces behavioural biases. It extracts information easily and analyses it, and early risk detection is also possible. So, those are the things that technology is helping us with, and that is where we want to bring differentiation and add value to our customers—the retail customers who do not have the luxury of having a person advising them or a relationship manager advising them. So, using technology as the guiding factor for the investor has been our focus.

Kshitij Anand: Obviously, when we are using more technology and when we have more personalised data on the web, trust is something that definitely comes into play. How are you balancing that aspect with investors?

Sandeep Nayak: See, trust is always built over a period of time, and Centrum has been in the financial services space for almost 30 years now, across different businesses. So, there is one overarching brand called Centrum, which investors trust.

But more importantly, at Centrum Finverse, being transparent and consistent, highlighting the positives as well as the risks—I mean, that has been the focus for both trading and investments—and that, I believe, will build trust over a period of time.

Ultimately, trust is built if the customer perceives that there is value addition for him from this platform. And that is the value addition that we bring—for trading, the scientific tools to help you compete with the Jane Streets; for investing, the simplified one-pagers giving you the investment rationale; and thematic baskets that give you a basket of stocks if you want to play a particular theme. Because with a single stock, you can go wrong, but when you build a basket, the returns are a little better and you manage the risk better.

So, these things that we are doing for customers will not be visible in one day, but over a period of time, customers will differentiate and give value to this particular approach of ours. It is a question of time, and this is how we want to build trust and continue the journey of Centrum Finverse.

Advertisement

Kshitij Anand: And looking forward, how do you see the industry shaping up, let us say, over the next three to five years?
Sandeep Nayak: Like I already said, technology is enabling you to offer personalised services to each customer, and the next phase is where using technology to hand-hold, guide, and offer personalised services will be the focus and will differentiate the men from the boys.

And second is, like I said, hand-holding and guiding in terms of the tools that you offer. I mean, there is always plenty of information available, but guiding customers in terms of how to interpret that data and what judgement you bring to the table as a research house is what will differentiate.

Over the next 5-10 years, this will be the… Like I said, access has been democratised. Now, it is about making informed decisions, hand-holding customers, and adding value to them. That is the focus, and that is where digital broking is headed, where value addition is the most important thing because cheap brokerage is available everywhere, but advice is not available everywhere, and research is not available everywhere. That is where we hope to bring differentiation. And we feel that over the next 10 years, the market will reward these players.

(Disclaimer: Recommendations, suggestions, views, and opinions given by experts are their own. These do not represent the views of the Economic Times)

Advertisement
Continue Reading

Business

What does ‘Las Malvinas Son Argentinas’ mean? All about the Falkland row that followed Messi’s Argentina into the World Cup final

Published

on

What does 'Las Malvinas Son Argentinas' mean? All about the Falkland row that followed Messi's Argentina into the World Cup final
A four-word banner held up by Argentina‘s players after their World Cup semi-final win over England has sent millions searching for answers, what the phrase actually means, why the Falklands still matter, and who really controls the islands today. Here’s a complete breakdown.

Football and geopolitics rarely mix this dramatically, but Argentina’s dramatic 2-1 win over England in the World Cup 2026 semi-final did exactly that. Within minutes of the final whistle, a banner referencing the Falkland Islands was on the pitch, Lionel Messi and company were mobbed by fans, and social media was flooded with one question in different forms: what exactly is this decades-old dispute, and why does it still spill onto a football pitch?

Also Read: Argentina be banned from FIFA World Cup final against Spain for showing Falkland banner?

Here’s a simple breakdown of everything you need to know.

What does “Las Malvinas son Argentinas” mean?

“Las Malvinas son Argentinas” is Spanish for “The Falklands are Argentine” (or, more literally, “the Malvinas are Argentina’s”). “Las Malvinas” is simply the Spanish name Argentina uses for the Falkland Islands, the name comes from “Îles Malouines,” what French sailors from the port city of Saint-Malo called the islands back in the 1700s.

Advertisement


For Argentines, the phrase isn’t just a geography lesson, it’s a statement of national identity. It reflects the country’s official, constitutionally-backed position that the islands rightfully belong to Argentina, a claim Britain firmly rejects. You’ll see the phrase on murals, license plates, school textbooks, and yes, occasionally, on football banners.

Why did Messi-led Argentina’s team show the Falklands banner?

After Argentina came from behind to beat England 2-1, with Lautaro Martinez heading in a stoppage-time winner off a Messi assist, several players, reportedly including Giovani Lo Celso and Nicolas Otamendi, held up the “Las Malvinas son Argentinas” banner during celebrations before it ended up on the pitch.

What’s the Argentina vs England Rivalry?

The opponent. Argentina vs England fixtures always carry historical weight, dating back to the 1982 Falklands War and even earlier flashpoints like Diego Maradona’s “Hand of God” goal in 1986.

Pre-match tension. Argentina’s Vice President had reportedly used provocative language about England in the buildup, and FIFA had already restricted Falklands-related flags from being brought into the stadium as a precaution.
Precedent. This isn’t new territory for Argentina’s football setup, the same banner cost the Argentine Football Association a £20,000 FIFA fine back in 2014, ahead of a friendly against Slovenia.

For many Argentine fans and players, waving the banner after knocking out England was less about football and more about a symbolic, patriotic moment. For FIFA, however, it’s a potential breach of rules that explicitly ban political statements and symbols inside stadiums, meaning Argentina could now face disciplinary action, most likely another fine, even as they prepare for Monday’s final against Spain.

Advertisement

Why are the Falkland Islands important?

The Falklands might be a remote, windswept archipelago with a population smaller than a small Indian town, but their importance goes well beyond size:
Historical and national symbolism: For Argentina, the islands represent an unresolved chapter of national identity and sovereignty, tied closely to the loss of the 1982 war. For Britain, they represent a hard-won territory and a test case for self-determination.
Strategic location: Sitting in the South Atlantic near key shipping routes and close to Antarctica, the islands have long carried military and geopolitical significance.
Natural resources: The surrounding waters are rich fishing grounds, and the Falklands basin has shown potential for oil and gas reserves, adding an economic dimension to the sovereignty question.
A live diplomatic issue: This isn’t just history, 2026 has already seen Argentine President Javier Milei publicly reiterate his country’s claim on the anniversary of the 1982 invasion, while reports of a leaked US government memo questioning British title to the islands briefly reignited global attention on the dispute earlier this year.

Who owns the Falkland Islands now?

As things stand, the Falkland Islands are administered by the United Kingdom as a self-governing British Overseas Territory. Locals handle their own internal affairs through an elected Legislative Assembly, while the UK retains responsibility for defence and foreign policy.

Argentina, however, does not recognise this arrangement and continues to formally claim sovereignty over the islands, referring to them as part of its own national territory.

Key facts on where things stand on Falkland Islands:

  • The roughly 3,500 residents of the islands hold full British citizenship.
  • In a 2013 referendum, Falkland Islanders voted almost unanimously, around 99.8%, to remain a British Overseas Territory.
  • The United Nations lists the Falklands as a “Non-Self-Governing Territory” and has repeatedly urged the UK and Argentina to negotiate, but has never ruled in favour of either side’s sovereignty claim.
  • No formal negotiations over sovereignty have taken place since diplomatic relations between the UK and Argentina were restored in 1990.

In short: Britain controls and governs the islands today, but the dispute remains legally and diplomatically unresolved, with Argentina continuing to press its claim through international forums rather than force.

Where is the Falkland Islands?

The Falkland Islands sit in the South Atlantic Ocean, roughly 300 miles (about 480 km) off the southern coast of Argentina, and around 8,000 miles from the United Kingdom. The archipelago consists of two main islands, East Falkland and West Falkland, along with hundreds of smaller islands, adding up to a land area roughly the size of the Indian state of Goa multiplied by nearly ten times over (about 12,000 sq km in total).

Advertisement

The capital, Stanley, is home to most of the population and sits on East Falkland. Despite being geographically closer to South America than to Europe, the islands remain culturally and politically British, right down to red phone booths and driving on the left.

What started as a football celebration has once again put a decades-old territorial dispute in front of a global audience. As Argentina prepares to defend their World Cup title against Spain, the Falklands conversation, much like the sovereignty question itself, shows no signs of settling down anytime soon.

Continue Reading

Business

Panel approves $11.3m Kewdale logistics hub

Published

on

Panel approves $11.3m Kewdale logistics hub

A major logistics centre in Belmont’s Kewdale industrial area has been unanimously approved after planners and the proponent struck a late compromise on lot amalgamation, sustainability requirements and height controls.

Continue Reading

Trending

Copyright © 2025