

Business
Welltower Needs A Miracle To Justify This Price (NYSE:WELL)


ArtMarie/E+ via Getty Images

Welltower (WELL) is the largest publicly-traded REIT by market capitalization. The REIT was big before, but the size has surged over the last few years as the share price exploded and the company issued a substantial amount of new equity to take advantage of their high multiple.
Shares trade at 41x forward AFFO consensus estimate. Those forward estimates still include Q2 2026 estimates. If we replaced them with Q2 2027 estimates, the multiple would drop from 41x to 39x. That’s still exceptionally expensive.
Note: This article was pretty short at first, but it kept ballooning like the national debt. I bestow upon you more than you ever really wanted to know about Welltower.
Quick Points
Quick things investors should know about WELL:
- Expect strong growth in AFFO per share over the next couple of years.
- The year-over-year growth rate in AFFO per share will likely come down substantially over the next several years.
- There is significant leverage in their business model. AFFO tends to be a relatively small portion of revenue. The variation there can swing AFFO per share significantly.
- Welltower has an excellent balance sheet. At their AFFO multiple, issuing stock to pay off debt raises AFFO per share. Even issuing stock to buy Treasuries would increase AFFO per share. Given that issuing stock to buy Treasuries or pay down debt would boost AFFO per share, it would be really strange (or stupid) if Welltower was using more debt in their financing model.
- WELL has been shifting their portfolio. They are primarily interested in reducing “outpatient medical” properties and increasing “senior housing operating” properties. You may see this abbreviated as “SHO”. It should be “SHOP”, but that’s the least of the issues here. Those properties tend to trade at cap rates that are dramatically higher than the market-implied cap rate for WELL.
- For WELL to really earn their share price, they need to issue a vast amount of equity at these premium valuations. The valuation is so insane that by far the best thing the REIT can do for shareholders on any given day is to issue more of that equity.
Cap Rates
We talk about cap rates occasionally. A cap rate is the amount of NOI (net operating income) a property is expected to produce relative to the share price.
The formula is simple: NOI / property value = cap rate.
The following image demonstrates cap rates across class A, B, and C assets in the senior housing category:
CBRE Senior Housing Report
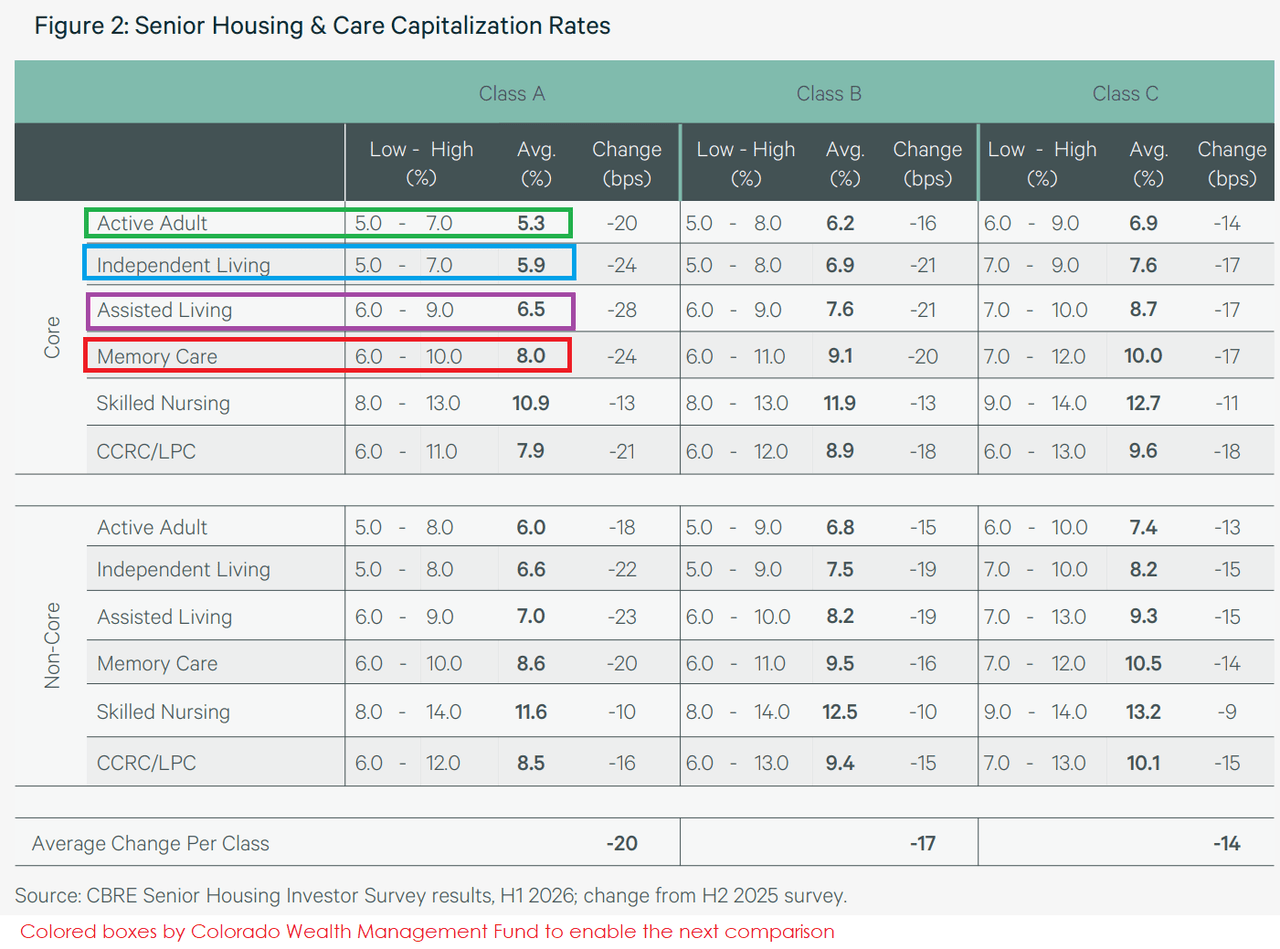
Source CBRE Senior Housing report
The very lowest cap rate property within that category is “Class A – Active Adult” at 5.3%.
Let’s compare that to what Welltower reports owning:
Welltower
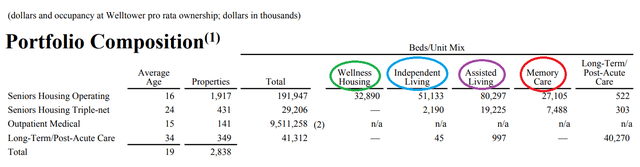
The huge emphasis by number of beds or units is on independent living and assisted living. Assuming that these are all class A properties (that’s a very optimistic assumption), we would be looking mostly at properties trading around 5.9% to 6.5%. There would also be a material amount of wellness housing around 5.3% and memory care around 8%. Therefore, we might ballpark that a reasonable cap rate across that part of the portfolio is probably around the low to mid 6% range.
This already accounted for 69.6% of portfolio NOI in Q1 2026:
Welltower

Since that’s the substantial majority of the portfolio, we will just focus on using it.
If we really wanted to be harsh, we would value the long-term/post-acute care portfolio (13.4% of NOI) using the “skilled nursing” cap rates where even a “core” property labeled as “class A” still has an average 10.9% cap rate. If we threw that into the equation, we would really want to use a higher cap rate.
Therefore:
- A cap rate in the 6% range would be very generous.
- A cap rate in the 7% range would still be moderately generous.
Valuing Welltower’s Assets
As I’ve mentioned previously, we can do a rough approximation for market implied cap rates by using adjusted EBITDA / total enterprise value.
I did that for Welltower.
We calculated it four ways:
- Q1 2026 Adjusted EBITDA minus stock compensation
- Q1 2026 Adjusted EBITDA
- Q1 2026 Adjusted EBITDA times 1.10 (to simulate 10% growth) minus stock compensation
- Q1 2026 Adjusted EBITDA times 1.10 (to stimulate 10% growth)
That gives us the following table:
The REIT Forum
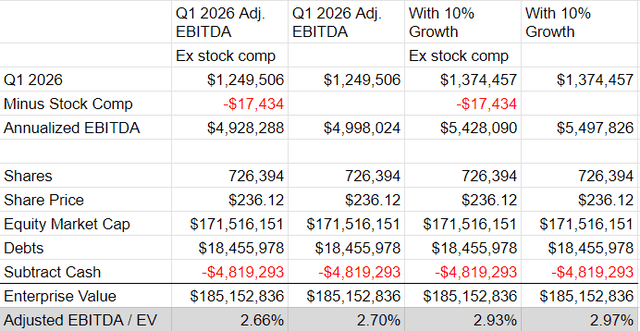
Now, as you may notice, numbers from 2.66% to 2.97% happen to be dramatically below 6%. It is even further below 7%!
The Lazy Method
We could’ve avoided this work.
Welltower has a strong balance sheet. Net Debt was only 8.8% of the market capitalization at the end of Q1 2026.
Given that the company is mostly financed with stock, we could’ve done something really lazy. We could’ve just assumed that interest on debt might wash itself off and used FFO (better than AFFO for this precise scenario) divided by the common share price.
- Consensus forward FFO per share is $6.58.
- Math: $6.58 / $236.12 = 2.79%
- Consensus forward FFO per share using Q2 2027 instead of Q2 2026 is $6.83.
- Math: $6.83 / $236.12 = 2.89%
That’s the super lazy way. It doesn’t usually work that well. However, since Welltower didn’t have major items in Q1 2026 that needed adjusting and the company was overwhelmingly funded with common equity, it would still create a rough approximation. In theory someone could use AFFO instead, but they would want to adjust for recurring capitalized expenditures. Those are usually deducted in reaching AFFO, but they are not deducted in these calculations.
Consensus NAV Per Share
Given that we estimate Welltower should have their portfolio valued using a cap rate around 7%, but the market is valuing them using a cap rate below 3%, we can safely say that Welltower is trading at an extreme premium to the value of their real estate. Would you dare to say an absurd premium? I would. Here we go: Welltower is trading at an absurd premium.
The most rational thing they can do presently is issue tens of billions of stock as quickly as possible. Even if some of the cash from share issuance has to sit in Treasury bills for a while, it still increases their growth in AFFO per share and it locks in the high price.
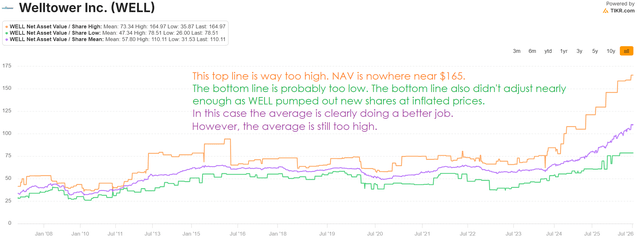
Sometimes I bash on consensus NAV estimates when I catch a clear error. I believe the current estimates ($110.11) are still too high, but as WELL issues more stock, they can still get there.
TIKR
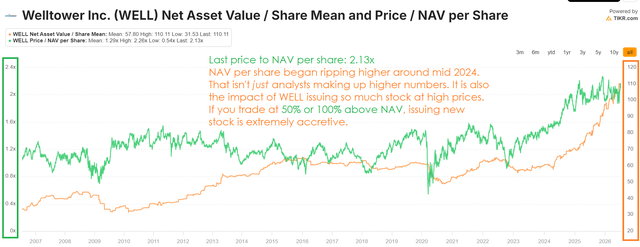
The gap in estimates was pretty big.
TIKR
Sanity Check
I ran the model for EBITDA to enterprise value again. This time I used the consensus NAV figure instead of the share price:
The REIT Forum
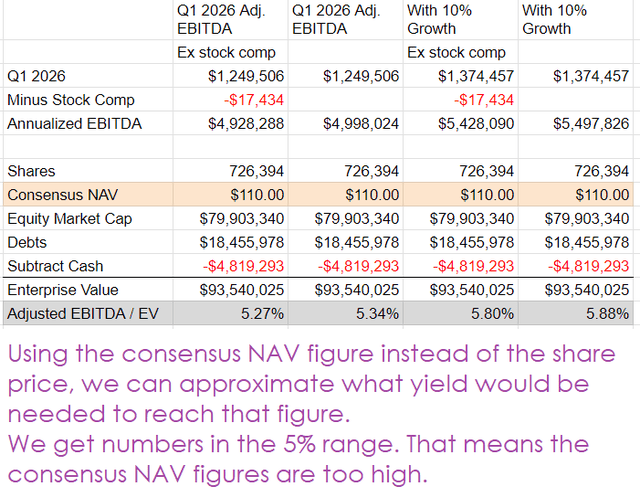
Note: Consensus NAV is simply the average.
Based on that math, I think the consensus NAV estimate of $110 is too high.
If we use $80, which is just above the lowest estimate, we get much higher percentages:
The REIT Forum
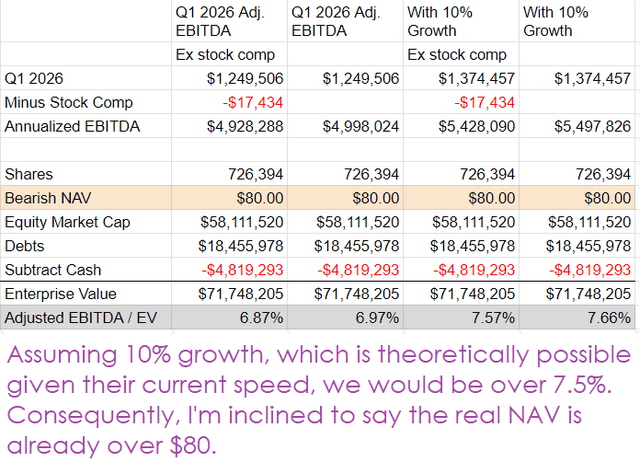
Given expectations for growth, I’m going to say $80 is too low. I would be inclined to say the best estimate for current NAV is probably somewhere in the $90s.
EBITDA vs. Overhead
For better or worse, using Adjusted EBITDA (especially after forcing stock-based compensation to be recognized) will imply a lower yield than using NOI.
Why? Because NOI does not deduct a bunch of overhead expenses. EBITDA does deduct them. The overhead expenses can be pretty insane.
Record Bloat
I’m just going to leave this here:
Seeking Alpha
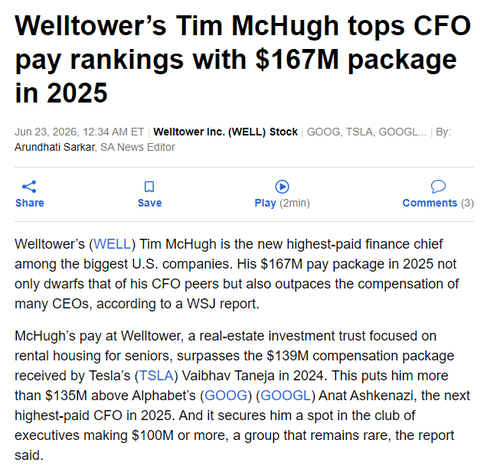
I’m not a fan. The board of directors agreed to this payout. For comparison, the total cash distributions (dividends) to shareholders in 2025 was $1,878 million. The payout to the CFO was $167 million. Was his contribution valuable enough to warrant a pay package equal to 8.89% of the total distributions to shareholders?
In my opinion, that makes Welltower a far less attractive REIT. Investors in the REIT get the board of directors that approved that package. Yay!
The Stupidest Chart Ever?
In Welltower’s presentation, they highlighted the coming demand for senior housing and how it is just so affordable. Affordable to people paid like their CFO? Here’s the chart:
Welltower
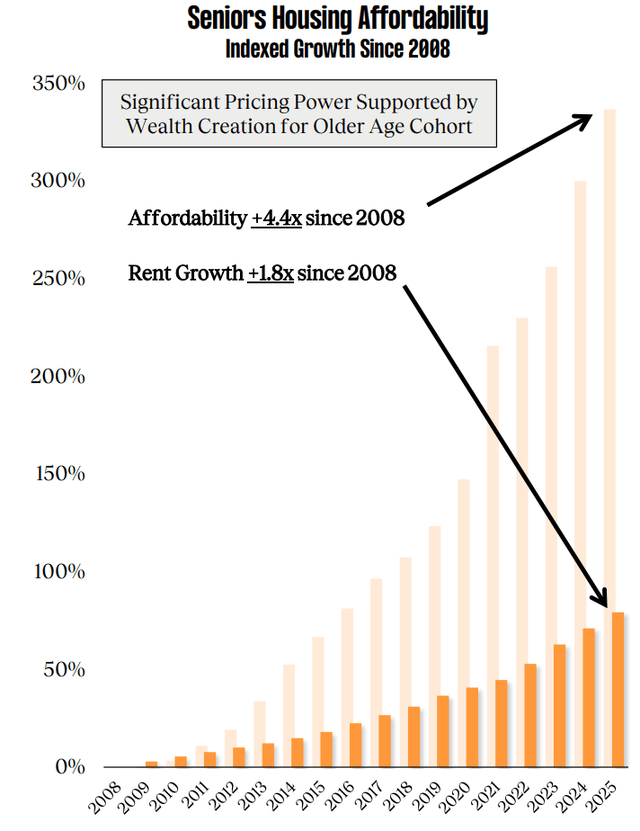
How did Welltower create that chart? It wasn’t directly revealed in the presentation. But I was able to find some numbers that would work.
Welltower left their presentation from August 2022 online. That document reveals how they came up with their definition of affordability and it references another source that could be used for rent growth. So I did a bit of work.
Affordability
I believe “Affordability” is this equation:
Aggregate net worth of households age 70+ in 2025 / Aggregate net worth of households age 70+ in 2008 = about 4.4x
I was able to replicate that by using the “Distributional Financial Accounts”. If we use the “Net Worth” column and compare the average from 2008 to the average from 2025 (filtered to households over 70 years old), we find that the value in 2025 is 4.358x the value from 2008. That rounds to 4.4x.
Here are some huge problems:
- The value is going to be absolutely dominated by stock portfolio values and starts with 2008 (remember the Great Financial Crisis, that was 2008 for anyone under 30).
- The value is aggregate. When more households enter the category, they push the value up unless they have negative net worth.
- The wealth is becoming even more skewed.
- This calculation is absolutely stupid.
Since they are calculating the aggregate value, the “affordability” goes up as the group size increases even if the additional people are extremely poor. Further, any increase in stock market indexes drives up “affordability”.
Junior High Math
Forgive me for being an analyst and liking precise data. I just need to explain that “+1.8x” and “1.8x” are not the same.
- 1.8x = 180%
- Being +180% means you’re up 180%. That turns $100 into $280.
- Being 180% means you’re up 80%. It turns $100 into $180.
How can we tell that they meant to say 1.8x instead of +1.8x? Look at the height of the bars. See how the “+1.8x” bar is about 80% on the left axis?
Likewise the bar for +4.4x actually stops around 340%.
This should be 6th grade math, but I’ll assume a weaker program and say it might be 7th grade.
No Comparison
- “Affordability” was measured based on the aggregate net worth of households.
- “Rent” was measured based on the individual unit.
If we want to apply similar stupidity to the rent metric, we would need to use the aggregate rent level. So each additional unit would have to raise the cumulative rent.
Rental Growth
Rent has been growing at a CAGR (compound annual growth rate) around 3% to 3.5% if we use a major source like JLL.
JLL
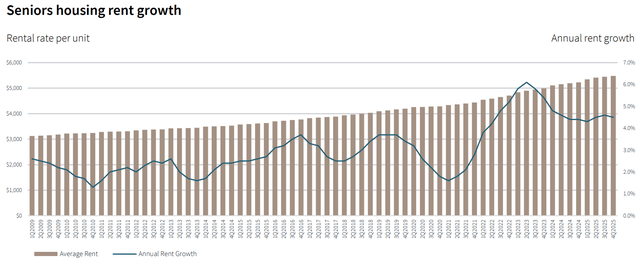
That’s the broader market growth rates.
- Average rate: Around $5500
- Average rate for WELL’s same property portfolio: $6,259
Location or quality of facilities could be enough to explain the difference.
- The average growth rate for the market was about 4.5%.
- The average growth rate for WELL was about 5.0%.
Once again, those are close enough.
But if WELL was growing rental rates at 5%, how did they increase same property net operating income at a staggering 22.1%?
It wasn’t occupancy. The number of occupied rooms within the same property portfolio increased 4.3%. That’s an impressive increase, but even with 5% growth in rental rates it wouldn’t get us to 22.1%.
Same Property NOI Growth
Same property NOI grew at a staggering 22.1%. We can’t explain that with 5% growth in rental rates.
Was it occupancy? That seems like a clear question, but the answer gets muddy. Occupancy did increase, but it only increased by 372 basis points (from 85.27% to 89.00%). That resulted in a 4.34% increase in the number of occupied rooms. That isn’t enough to drive the gain either.
Absolutely Remarkable Scale
It is pretty common for equity REITs to have NOI margins around 65% to 75%. It varies a bit by property type. However, senior housing operating properties have dramatically lower NOI margins.
Because margins tend to be low, that also means operating expenses tend to be high. Controlling growth in costs can drive substantial growth in net operating income. The cost control for WELL was remarkable.
- Q1 2025: Same property operating expenses per occupied room increased 1.84%
- Q1 2026: Same property operating expenses per occupied room increased 0.35%
That sounds nice to investors, right? It sounds like the expense scales linearly while the revenue keeps growing. It’s precisely the kind of model investors want to see. Revenue increases significantly forever while the expenses only edge slightly higher.
But doesn’t that sound too good to be true?
Unsustainable Scaling
The scaling on operating expenses looks completely unsustainable when we dive into it.
Mind if I just throw tables of data your way? Great, that’s what we’re doing. We’re going to start with the numbers for the Q1 2026 same property pool.
Supplemental
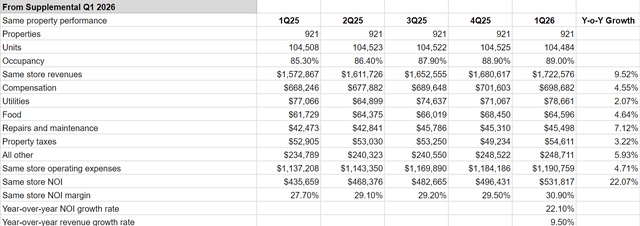
That seems nice, right? Same store NOI is exploding on higher margins. If we assume that higher margins are largely driven by costs being relatively fixed, then we could convince ourselves that this would continue indefinitely.
I’m going to end that dream.
We can see how many units there were. We have the approximate occupancy (rounded to a decimal place). We can create two different tables:
- The first table uses the total number of units in the same property pool.
- The second table uses the approximate number of occupied units in the same property pool.
The tables look like this:
Supplemental
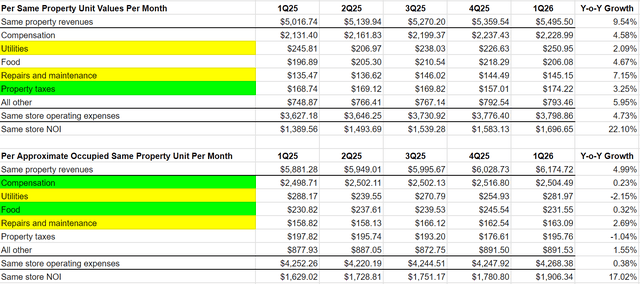
The highlighting is pretty simple:
- Green indicates where I believe the value should be scaling. Property taxes should primarily scale with the number of units. The government doesn’t care if the unit was occupied. Food should be consumed by actual residents, not empty rooms. Therefore the food should scale primarily with occupied rooms.
- Yellow means I believe the value should be driven by both the number of total units and the number of occupied units. Since utilities apply to common areas and to individual units, the utilities should scale with both.
Lessons from the Table
There are a few things that should stand out:
- The biggest expense by a huge margin is compensation. It is more than half of the total value for same property level expenses. Compensation in total was up 4.58%, but compensation per occupied room was only up 0.23%. This will be the biggest issue.
- Utility rates have been going up, not down. Yet utilities per unit were only up 2.09% and utilities per occupied unit were down 2.15%. I can believe that WELL became more energy efficient, but I don’t believe they can repeat that every year.
- Food price inflation has been a significant challenge for many Americans. Yet the food cost per occupied room barely increased. WELL might be getting more efficient with their menu, but this cost cutting can only go so far.
- Property taxes are only up 3.25%? That is a very small decline. If we really see appreciation in the value of these properties, then local tax assessors are going to want to push the taxes higher. That can often lag for a bit, so the meager growth now doesn’t mean it will stay small.
Compensation
This is the big issue.
A large portion (more than half) of the senior housing portfolio is in “assisted living” and “memory care”. In those facilities particularly, I would expect higher occupancy to drive staffing requirements.
So when I see compensation per occupied unit only increased 0.23%, I’m inclined to think this isn’t just “being more efficient”. It looks to me like increasing the load per employee. That does not simply continue to scale.
Looking back to the period from Q1 2024 to Q1 2025, we see a similar picture.
From Q1 2024 to Q1 2025 the increase in compensation expense per occupied unit in the same property pool was only 0.75%.
If WELL is raising wages in line with CPI and the mix of workers remains similar, then the number of workers per occupied unit must be declining.
How long can that continue? I don’t have a precise time for it to end. But I really don’t believe it will last indefinitely.
Priced Beyond Perfection
The valuation on WELL requires the company to continue putting out incredible growth rates.
Pumping out equity can certainly help. But the same property NOI figures that are so impressive rely on significant growth in margins year after year. WELL doesn’t just need to maintain these larger margins. They need to continue expanding the margins for years. That’s the cost of trading at 40x AFFO.
A Moment of Rage
The documents don’t quite match up.
You’ll find slightly different values for the same property portfolios between:
The “earnings presentation” is also named “Business Update”. I don’t know why. Both documents were released on April 28th, 2026.
Example:
- Same property revenue for Q1 2026 supplemental: $1,722,576
- Same property revenue for Q1 2026 earnings presentation: $1,722,085
Is it a big difference? No. But it is incredibly annoying when it comes to model accuracy.
My Predictions
- I believe WELL will be able to continue driving material growth in revenue per occupied room and even better growth in revenue per total room because of gains to occupancy.
- I believe the growth in NOI margin will slow materially. Margins might still improve for a bit. What I find extremely unlikely is the idea that NOI margins could grow over 300 basis points annually for several years.
- I believe same property NOI growth rates for the senior housing operating portfolio will decline substantially. Margin growth will be a huge factor.
- I believe WELL will continue to rapidly issue stock. Even if the price fell by 33% it would still be wise for them to pump out new shares.
- I believe NAV estimates will rise. They are already above my estimate for where NAV is today, but we will probably see more shares issued and each share increases NAV. The real estate is only worth $90 to $100, but issuing a share for net proceeds over $230 still adds $230 of cash to the REIT.
- In the next year we may see cap rates get a little bit lower for these types of assets. Part of the reason may be Welltower bidding for assets. In that sense Welltower can push the market value for comparable assets higher because they have such an easy access to cash through printing shares.
- I believe WELL will show significant short-term AFFO per share growth, but the growth rate will trend lower over the next several years.
- I believe the AFFO multiple will come crashing down within the next several years.
- I believe the reduction in AFFO multiple will be more powerful than the growth in AFFO, resulting in a lower share price ($239.75 at time of publication for REIT Forum subscribers).
- I believe the resulting lower AFFO multiple will make issuing new stock less accretive, which will further reduce the AFFO growth rate since issuing stock at 40x AFFO is a powerful engine for growing AFFO per share.
- I believe WELL will significantly underperform the major equity REIT index (VNQ) over the next 5 to 10 years because the starting valuation is so high.
- Even if WELL delivers one of the best growth rates among REITs for AFFO per share from 2026 to 2030 (quite possible), that still wouldn’t be enough to justify the current valuation.
Conclusion
Welltower is absurdly overvalued. It has continued climbing this year. The market simply loves seeing rapid growth. Issuing stock at these levels is a great choice. Buying shares is not. There’s not a reasonable route for Welltower to deliver the kind of growth that would be necessary to sustain the stock valuation when the growth fades.
The dividend yield is only 1.3%. This is not an income stock. Investors are here for capital appreciation. But what happens when the growth slows down? Even if WELL could achieve 5 years of outstanding growth and gets AFFO up to $12.00 per share, what happens when it falls off? When shares go back to a normal multiple? If they went back to 20x AFFO (much higher than the average for REITs today), that would be $240.00. Investors wouldn’t be happy about getting a meager yield for 5 years combined with minimal price appreciation.
Can growth continue forever? That seems unlikely:
- The current growth rate is fueled by issuing shares at a wild premium.
- That has been supported by massive growth in same property net operating income.
- The extreme growth in same property net operating income relied on margin expansion.
- WELL doesn’t just need to maintain those wider margins, they need to continue expanding the margins.
- As nice as margin expansion feels, it never goes on forever.
It is clear that Welltower’s valuation is absurdly high regardless of how we measure it:
- Using AFFO multiples, WELL is extremely expensive. Even with strong growth in AFFO per share for the next few years, I don’t believe they can get AFFO to a high enough level to deliver investors with an attractive return once the multiple declines.
- Using revised EBITDA to total enterprise value we see shares trading at a laughably low yield. If investors want to invest in senior housing, they should look elsewhere. The implied cap rates for WELL are insanity that demonstrates the market has completely lost touch with the underlying value of the portfolio.
I don’t see anything worthy of such an extreme valuation.
Other analysts have correctly pointed out that the valuation on WELL is too high. Thus far, the market hasn’t listened. It is still living a fantasy. When it wakes, WELL has enormous downside.
At the time of publishing this report for subscribers, shares of WELL traded at $239.75. About 41.9x consensus AFFO for Q2 2026 through Q1 2027.


Baker Hughes earnings beat by $0.15, revenue topped estimates

China memory chipmaker CXMT set for Shanghai debut after Asia’s biggest IPO

The trucking business in the Philippines remains one of the most profitable opportunities in the logistics and transportation industry. As e-commerce, construction, manufacturing, agriculture, and retail sectors continue to expand, the demand for reliable cargo transportation services also grows. Every day, thousands of businesses require trucks to deliver raw materials, finished products, equipment, groceries, appliances, and construction supplies across the country.
If you’re looking for a business with long-term earning potential, starting a trucking business could be a smart investment. While it requires substantial capital compared to smaller businesses, it also offers consistent demand, recurring clients, and expansion opportunities.
In this guide, you’ll learn everything you need to know about starting a trucking business in the Philippines—from the required permits and startup costs to choosing the right trucks, finding clients, and maximizing profits.
Why Start a Trucking Business in the Philippines?
The Philippine logistics industry has experienced significant growth over the past decade. Online shopping platforms, infrastructure projects, supermarkets, factories, and import-export businesses all rely heavily on trucking services.
Here are several reasons why many entrepreneurs invest in trucking:
- Growing demand from e-commerce businesses
- Increasing infrastructure projects nationwide
- Expansion of manufacturing and industrial zones
- Steady need for cargo delivery services
- Opportunities for long-term contracts with companies
- Scalable business model by adding more trucks over time
Unlike seasonal businesses, freight transportation is needed throughout the year, making trucking one of the more stable industries in the country.
Types of Trucking Businesses
Before investing, decide which trucking niche best fits your budget and market.
1. General Cargo Transport
This is the most common trucking business. It involves transporting boxes, consumer goods, appliances, furniture, and packaged products.
2. Construction Hauling
Construction companies require dump trucks and heavy-duty vehicles to transport sand, gravel, cement, steel, and equipment.
3. Refrigerated Trucking
Refrigerated vans are used for transporting meat, seafood, vegetables, dairy products, and pharmaceuticals.
4. Container Trucking
Container trucks move imported and exported goods between ports, warehouses, and distribution centers.
5. Fuel and Chemical Transport
This specialized niche requires additional permits and safety compliance but generally offers higher income.
How Much Capital Do You Need?
The startup capital depends on whether you purchase brand-new or second-hand trucks.
| Startup Expense | Estimated Cost (PHP) |
|---|---|
| Used Light Truck | ₱700,000 – ₱1,500,000 |
| Brand-New Light Truck | ₱1,700,000 – ₱3,200,000 |
| Heavy-Duty Truck / Tractor Head | ₱3,500,000 – ₱8,500,000+ |
| Business Registration & Permits | ₱10,000 – ₱50,000 |
| Commercial Vehicle Insurance | ₱40,000 – ₱150,000 per year |
| Initial Maintenance Fund | ₱100,000 – ₱300,000 |
| Fuel Budget (Initial Working Capital) | ₱100,000 – ₱500,000+ |
| Driver & Helper Salaries (1 Month) | ₱40,000 – ₱80,000 |
| Office Equipment & Operations | ₱30,000 – ₱150,000 |
Many entrepreneurs start with a single truck before gradually expanding their fleet using business profits.
Business Registration Requirements
Operating legally is essential to attract corporate clients and avoid penalties.
You may need the following:
- DTI Registration (for sole proprietorship)
- SEC Registration (for corporations)
- BIR Registration
- Mayor’s Permit
- Barangay Clearance
- Vehicle Registration (LTO)
- Commercial Vehicle Insurance
- Other permits depending on cargo type
Corporate clients usually prefer dealing with registered trucking companies because they can issue official receipts and invoices.
Choosing the Right Truck
Your truck is your primary business asset. Choosing the wrong vehicle can increase maintenance costs and reduce profitability.
Consider the following factors:
- Payload capacity
- Fuel efficiency
- Availability of spare parts
- Maintenance costs
- Brand reputation
- Warranty coverage
- Resale value
Many successful trucking companies prioritize reliability over appearance. A dependable truck that minimizes downtime often generates better returns than a newer model with higher financing costs.
Finding Your First Clients
One of the biggest challenges is securing consistent customers.
Potential clients include:
- Manufacturing companies
- Construction contractors
- Retail chains
- Importers and exporters
- Wholesalers
- Hardware suppliers
- Agricultural businesses
- Furniture companies
- Food distributors
- E-commerce warehouses
Networking is extremely important in the trucking industry. Building relationships with warehouse managers, logistics supervisors, purchasing officers, and freight brokers can lead to long-term contracts.
Operating Costs to Consider
Your profit doesn’t only depend on the amount charged per trip.
You must carefully monitor expenses such as:
- Fuel
- Driver salaries
- Helper wages
- Vehicle maintenance
- Tires
- Insurance
- Registration renewal
- Tolls
- Parking fees
- Unexpected repairs
Preventive maintenance can significantly reduce expensive breakdowns and minimize downtime.
How Much Can a Trucking Business Earn?
Income varies depending on:
- Distance traveled
- Truck size
- Cargo type
- Fuel prices
- Number of completed trips
- Contract agreements
Businesses with long-term corporate contracts generally enjoy more stable revenue than those relying solely on one-time bookings.
Many successful operators increase profitability by maximizing truck utilization and minimizing empty return trips.
Technology Can Improve Efficiency
Modern trucking businesses increasingly rely on technology to reduce costs and improve customer service.
Useful tools include:
- GPS fleet tracking
- Fuel monitoring systems
- Vehicle maintenance software
- Accounting software
- Electronic proof of delivery (ePOD)
- Inventory management integration
- Cloud-based dispatch systems
These technologies provide real-time visibility and help improve operational efficiency while reducing unnecessary expenses.
Common Challenges
Like any business, trucking also comes with risks.
- Rising fuel prices
- Traffic congestion
- Driver shortages
- Vehicle breakdowns
- Accidents
- Weather disruptions
- Increasing maintenance costs
- Competition from larger logistics companies
Maintaining an emergency fund and regularly servicing your vehicles can help your business remain resilient during unexpected situations.
Tips for Long-Term Success
Many trucking businesses fail not because of a lack of customers, but because of poor financial management.
To build a sustainable business:
- Focus on excellent customer service.
- Deliver shipments on time.
- Maintain accurate financial records.
- Invest in preventive maintenance.
- Train drivers regularly.
- Purchase comprehensive insurance.
- Build relationships with repeat clients.
- Expand your fleet gradually.
- Monitor fuel consumption closely.
- Adopt modern logistics technology.
Consistency, reliability, and professionalism are often more important than having the largest fleet.
Should You Buy or Finance a Truck?
Many first-time entrepreneurs wonder whether it’s better to purchase a truck outright or finance it through a loan. Buying in cash eliminates monthly loan payments and interest expenses, but it requires significant capital. Financing, on the other hand, allows you to preserve cash for operations such as fuel, maintenance, and payroll.
Before taking out a commercial vehicle loan, prepare a realistic cash flow projection. Consider monthly amortization, insurance premiums, preventive maintenance, and possible periods when the truck may not be generating income. A financed truck can be a worthwhile investment if your projected revenue comfortably exceeds your operating costs and loan obligations.
Growing Your Trucking Company
Once your first truck consistently generates income, you can begin expanding your operations. Growth should be gradual and supported by stable contracts rather than speculation.
Ways to expand include:
- Add additional trucks to your fleet.
- Offer warehousing and storage services.
- Provide last-mile delivery solutions.
- Invest in specialized vehicles such as refrigerated or tanker trucks.
- Partner with freight forwarders and logistics companies.
- Expand service coverage to neighboring provinces and regions.
Diversifying your services can reduce dependence on a single market segment and create multiple revenue streams.
The trucking business in the Philippines offers tremendous opportunities for entrepreneurs willing to invest in quality equipment, excellent customer service, and efficient operations. Although startup costs are relatively high, the industry’s continuous demand makes it an attractive long-term business venture.
Success depends on more than simply owning trucks. It requires proper financial planning, legal compliance, disciplined maintenance, dependable drivers, and strong relationships with clients. By starting with a solid business plan and focusing on operational excellence, you can build a trucking company that grows steadily and serves the country’s expanding logistics needs for many years to come.

Business News Philippines was launched in October 2015 as a portal for readers to learn more about operating a business in the Philippines.

The asset managers, among the biggest investors in recent IPOs, have told Bengaluru-based Zepto’s representatives in recent discussions that they would not be comfortable subscribing to the issue even at the lower valuation being considered by the company, three people familiar with the matter told ET.
Zepto is said to have offered to cut its IPO valuation expectations to around $4-5 billion, below the peak valuation of $7 billion in October 2025, when the company secured a $450-million funding from US pension fund CalPERS.
Sources said the top mutual funds and large domestic insurers are seeking valuations 30-40% below even the reduced IPO valuation of $4-5 billion, sending the bankers and one of Zepto’s prominent investors scrambling to persuade money managers to meet the company mid-way. They have also stepped up efforts to line up support from a wider section of deep-pocketed High Networth Investors (HNIs) and large family offices.
 Agencies
Mutual funds and insurers want valuation 30–40% below firm’s $4–5 billion target
An email query to Zepto went unanswered until the publication of this report.

Zepto is aiming to launch its IPO of up to ₹8,010 crore over the next two weeks. Sources said the company hopes to conclude negotiations with the asset managers by Tuesday, though mutual funds have yet to agree on its offer.
“Most of the large mutual funds are yet to confirm their participation at least till the weekend because of serious differences over valuations,” said one of the people in the know on condition of anonymity.The participation of the domestic funds and insurers is considered crucial for the success of the IPO as these cash-flush institutions have been the largest participants in anchor books and pre-IPO funding rounds in recent share sales. Their dominant presence has also given them an upper hand in share sale negotiations with companies with some of the top funds even having a significant say in IPO pricings.
“What we are saying is if you can get the participation of the majority of the other big funds, we will also look into it again,” said a top official with a large mutual fund, who did not want to be named because of the sensitive nature of the discussions.
Fund managers said Zepto wanted to benchmark its IPO valuation against listed rivals Eternal and Swiggy. Investors, however, did not buy the logic because Zepto lacks a food delivery business, which forms a key part of both companies’ operations and valuations. Zepto operates only in the ultra-competitive quick commerce market spanning groceries, electronics and other everyday items.
Fund managers are also wary of agreeing to higher valuations following the post-listing share price performance of some of the new-age businesses. For instance, Swiggy, which listed in November 2024, is still trading below its IPO price. The stock is at ₹251.50, about 35% below the IPO price of ₹390 apiece. In some of the new-age company issuances in the past, mutual funds have been slammed for subscribing to these IPOs at peak valuations.


Seeking Alpha’s transcripts team is responsible for the development of all of our transcript-related projects. We currently publish thousands of quarterly earnings calls per quarter on our site and are continuing to grow and expand our coverage. The purpose of this profile is to allow us to share with our readers new transcript-related developments. Thanks, SA Transcripts Team

Tracking Philippe Laffont's Coatue Management Portfolio – Q1 2026 Update


I have a masters degree in Analytics from Northwestern University and a bachelors degree in Accounting. I have worked in the investment arena for over 10 years starting as an analyst and working my way up to a management role. Dividend investing is a personal hobby and I look forward to sharing my thoughts with the Seeking Alpha community.
Analyst’s Disclosure: I/we have a beneficial long position in the shares of ABBV, ADP, HRL, JNJ, LOW, PEP, SPGI either through stock ownership, options, or other derivatives. I wrote this article myself, and it expresses my own opinions. I am not receiving compensation for it (other than from Seeking Alpha). I have no business relationship with any company whose stock is mentioned in this article.
Seeking Alpha’s Disclosure: Past performance is no guarantee of future results. No recommendation or advice is being given as to whether any investment is suitable for a particular investor. Any views or opinions expressed above may not reflect those of Seeking Alpha as a whole. Seeking Alpha is not a licensed securities dealer, broker or US investment adviser or investment bank. Our analysts are third party authors that include both professional investors and individual investors who may not be licensed or certified by any institute or regulatory body.
Brown-Forman board says Sazerac unsolicited proposal not actionable

Tracking Lone Pine Capital Portfolio – Q1 2026 Update
Seeking Alpha’s transcripts team is responsible for the development of all of our transcript-related projects. We currently publish thousands of quarterly earnings calls per quarter on our site and are continuing to grow and expand our coverage. The purpose of this profile is to allow us to share with our readers new transcript-related developments. Thanks, SA Transcripts Team

3M Open: Rookie Jackson Koivun holds nerve to beat Scottie Scheffler for first PGA Tour win

Intel is reversing course and bringing hyper-threading back to its server chips

Trump Just Triggered The 1,000,000 Bitcoin Arms Race


-

 Fashion2 days ago
Weekend Open Thread: Brooks Brothers
-

 Crypto World6 days ago
Grayscale Files For Worldcoin ETF, WLD Registers Sharp Rise
-

 NewsBeat5 days ago
How a former Blue Peter presenter stunned America’s Got Talent judges
-
 Tech6 days ago
Sail Virtually Aboard The “Itanic” With IA-64 Emulator
-
 Tech6 days ago
Turtle Beach Command Series KB7 review: a nifty screen-equipped gaming keyboard
-

 NewsBeat7 days ago
Unregistered fitter used Gas Safe logo on business flyers
-
 Business5 days ago
New Jersey voter registration controversy explained: How 6,600 noncitizens got on the rolls, and what happens next
-
 Entertainment5 days ago
Johnny Depp’s R-Rated Gothic Cult Classic Gets New Release Ahead of Sydney Sweeney Remake
-

 Tech6 days ago
Watch Flock Safety CEO Garrett Langley discuss the future of surveillance at TechCrunch Disrupt 2026
-

 Crypto World4 days ago
Ethics, other provisions in crypto Clarity Act to be further discussed
-
 NewsBeat6 days ago
Shanghai science forum photos show China’s AI and robotics advances in rivalry with US
-
 Crypto World7 days ago
Circle’s President Sold Over 360,000 Shares, The Filings Explain Why
-

 Tech7 days ago
Subway Sandwich Computers Get a Second Life as Gaming Machines
-
 Sports4 hours ago
Commonwealth Games boxing: Jadumani Singh seals dominant 5-0 win over Pakistan’s Sumama Rehman to enter quarter-finals | Commonwealth Games News
-

 News Videos3 days ago
The Peugeot Family: How 200 Years of an “Old Money” Dynasty Died in A Boardroom
-

 Sports3 days ago
2026 3M Open leaderboard: Scottie Scheffler finds putter in Round 1, sits three back
-

 Fashion3 days ago
16 Dresses for the High Summer Event
-

 Entertainment7 days ago
Stephen Colbert Returns to Social Media After Late Show End
-

 Tech7 days ago
The 35 Best Board Games for Family Game Night
-

 Crypto World6 days ago
Andrew Cuomo joins OKX board as crypto exchange expands in U.S.
You must be logged in to post a comment Login