

Crypto World
3 Altcoins That Are Not in a Bear Market and Could Rally
The crypto bear market seems to be taking form. Bitcoin and Ethereum remain under pressure, with Bitcoin down nearly 24% year-to-date and about 22% year-on-year, while Ethereum has fallen roughly 34% YTD and over 30% across the same period. The broader market continues to reflect weak sentiment.
Yet, BeInCrypto analysts have identified three altcoins that are still posting strong gains in the year-to-date and year-over-year periods, signaling demand and technical structures that appear disconnected from the ongoing bear market.
Bitcoin Cash (BCH)
The crypto bear market has not stopped Bitcoin Cash (BCH) from showing unusual strength. While many altcoins struggle, BCH remains one of the strongest altcoins, holding large yearly gains. Bitcoin Cash is still up nearly 80% year-on-year, showing that demand has stayed intact even as the broader crypto bear market continues.
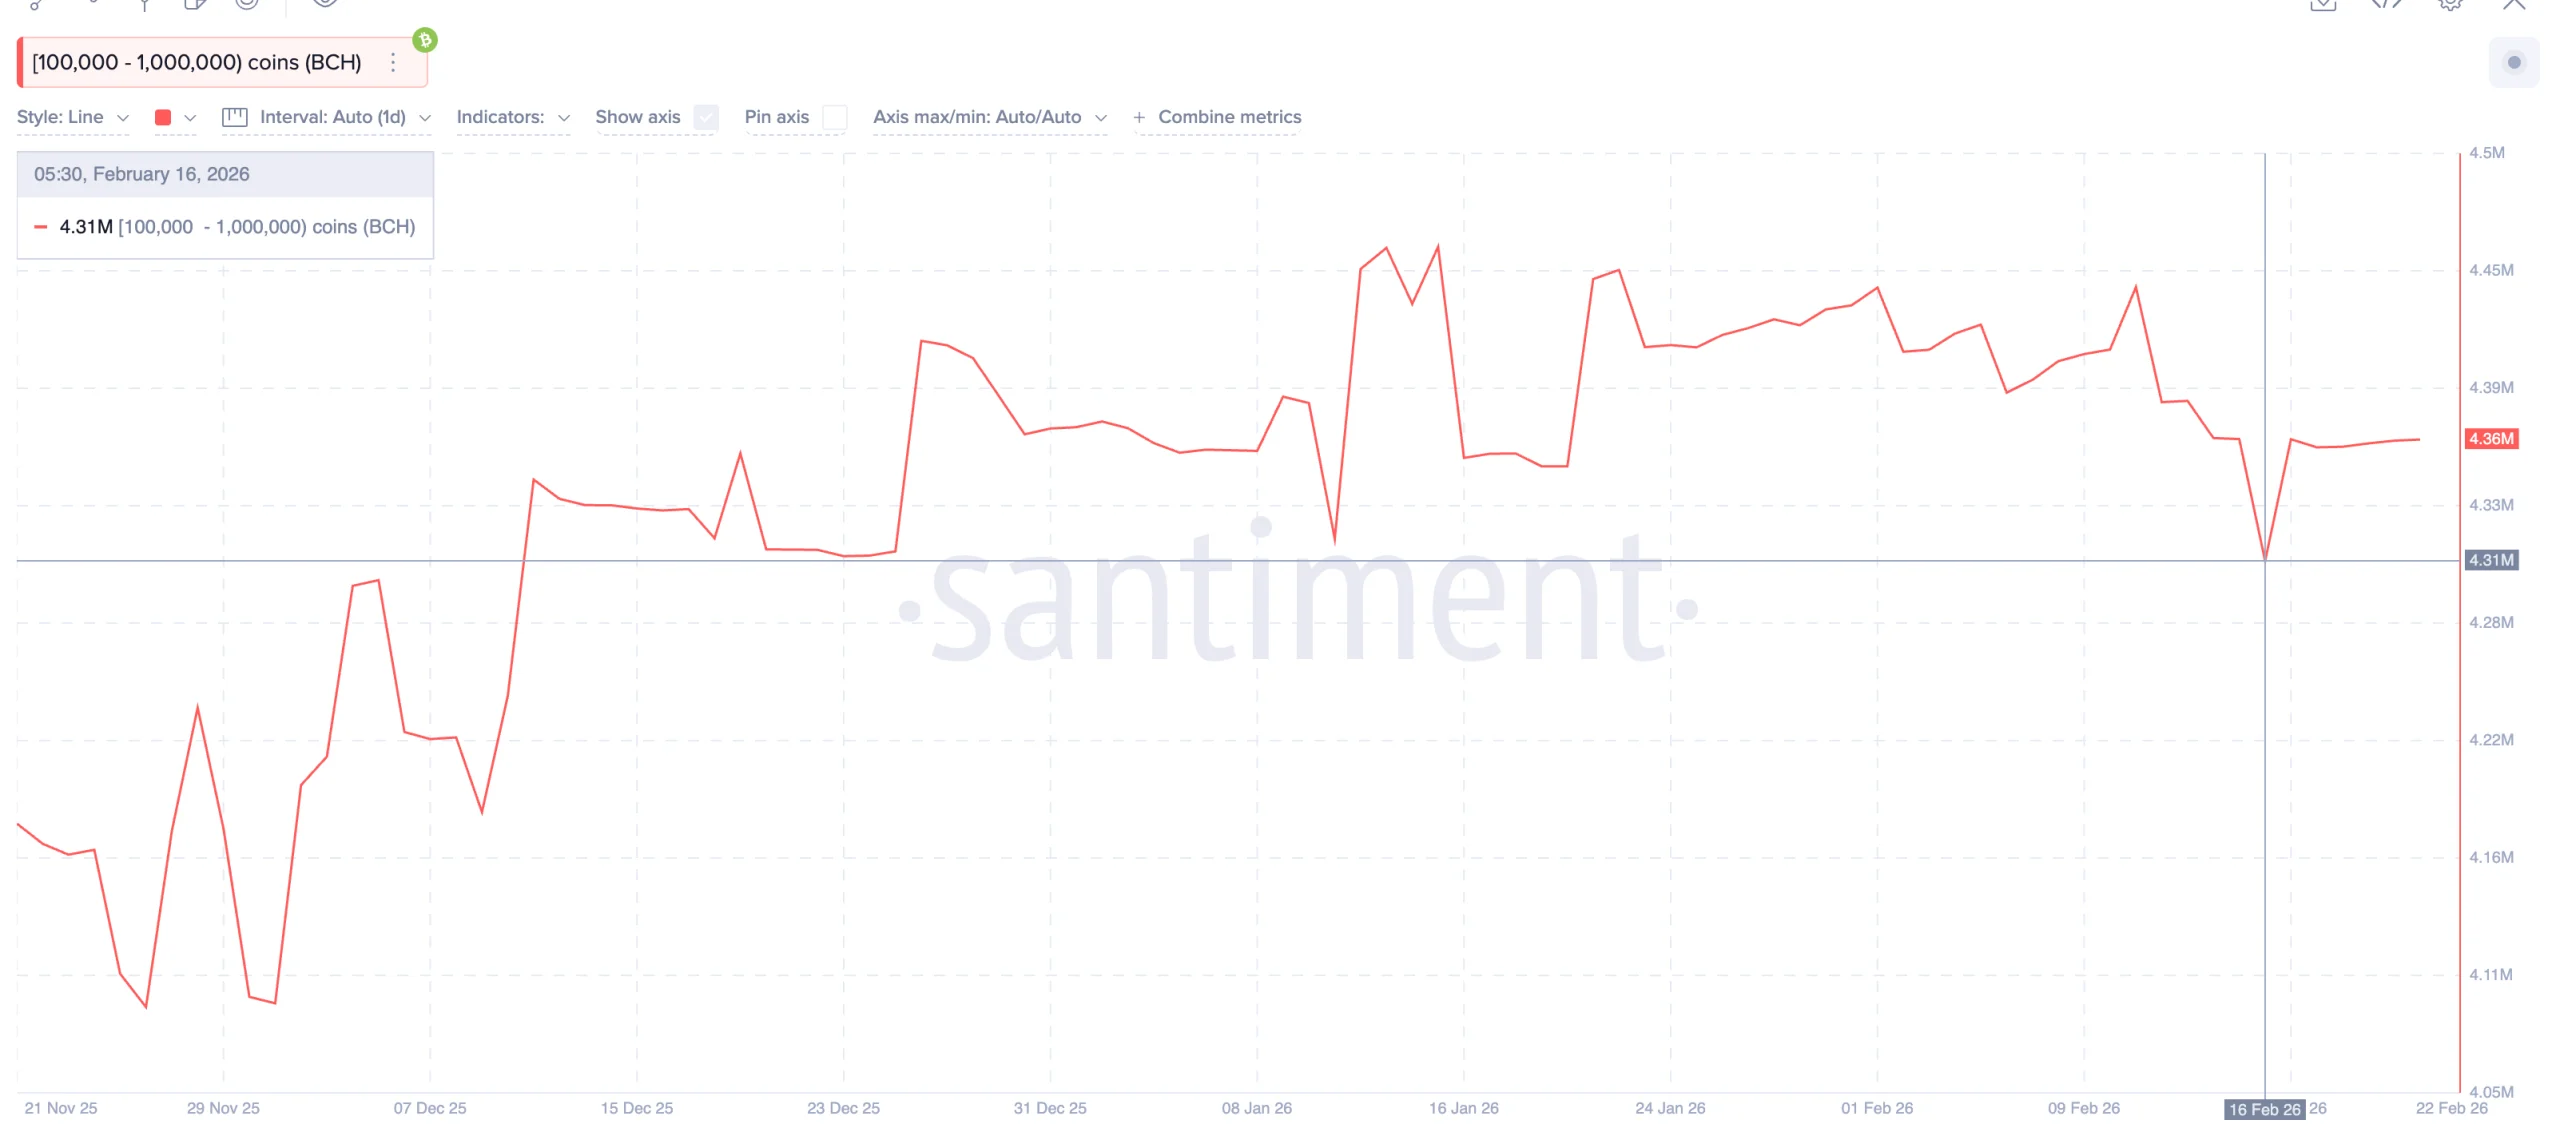
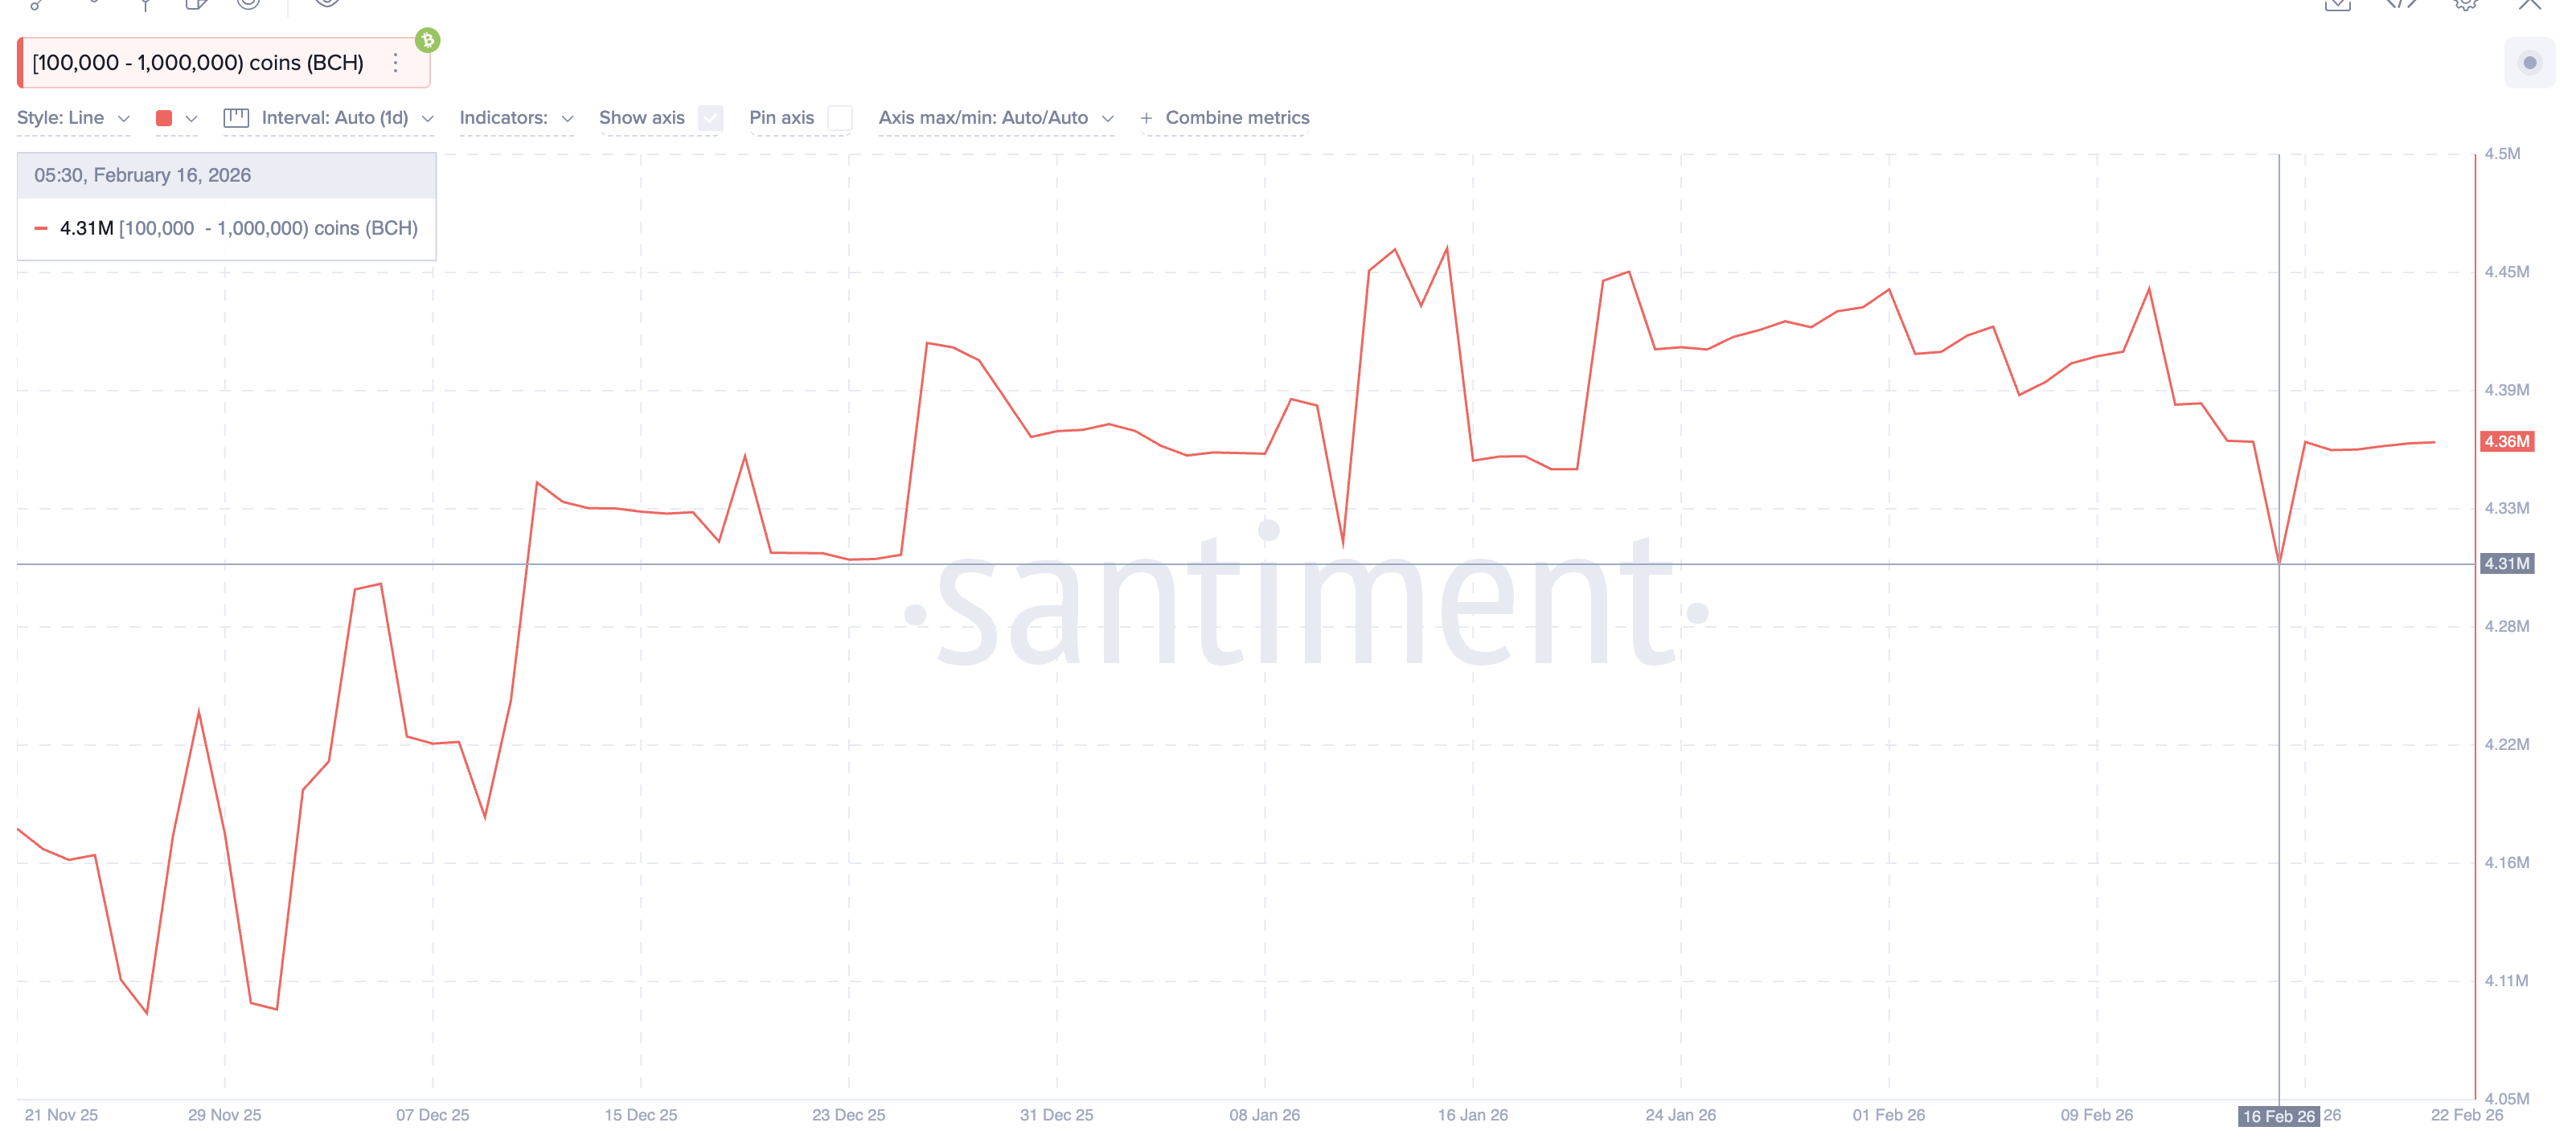
This strength is now clearly visible in whale behavior. The largest Bitcoin Cash holders, wallets holding between 100,000 and 1 million BCH, increased their holdings from 4.31 million BCH on February 16 to 4.36 million BCH recently.
This means whales added 50,000 BCH, worth about $28.5 million at the current price. Whale accumulation during a crypto bear market often signals confidence, as these investors typically buy when they expect higher prices ahead.
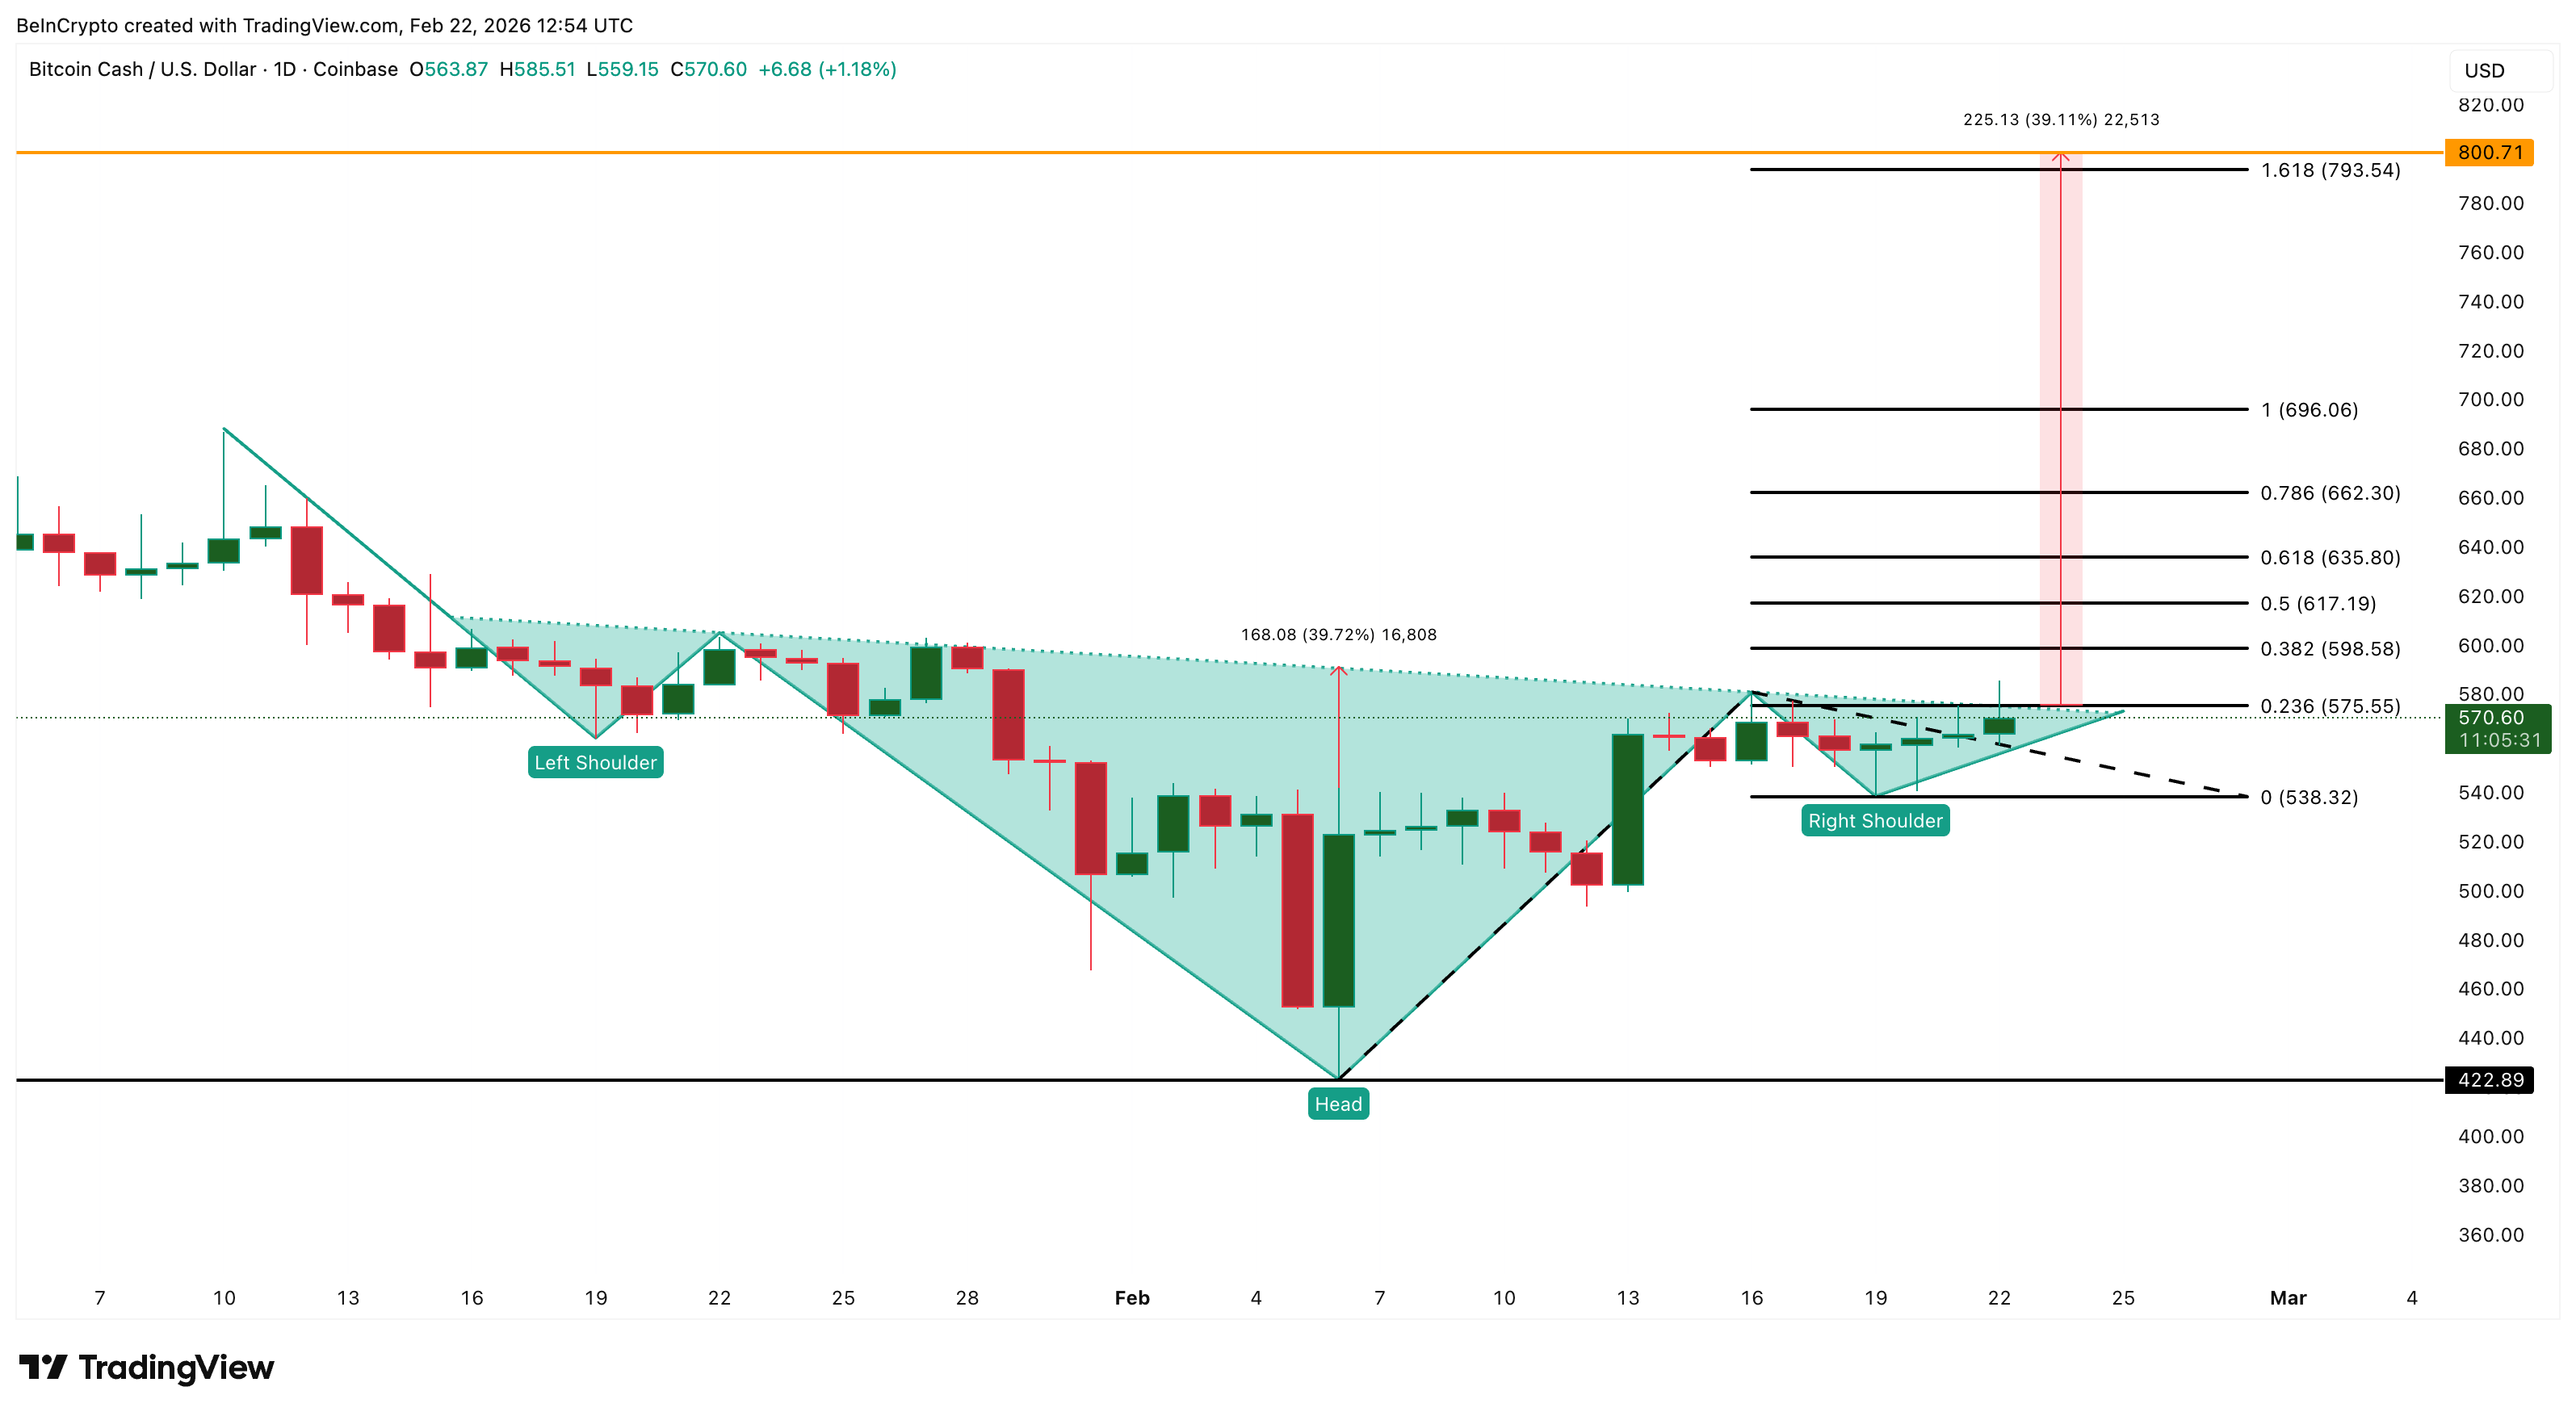
This optimism connects directly with Bitcoin Cash’s price chart. BCH is currently forming an inverse head-and-shoulders pattern, a bullish pattern that often precedes a breakout.
This pattern shows that selling pressure is fading and buyers are slowly gaining control. BCH attempted a breakout near $575 but faced some selling pressure. However, continued whale buying suggests this resistance may weaken over time.
A confirmed breakout requires a daily close above $575. If that happens, BCH could rally toward $793 and potentially $800, completing the pattern’s nearly 40% upside target. These levels also align with Fibonacci resistance zones, strengthening the bullish case.
However, risks still exist. The bullish structure weakens if BCH falls below $538, because that would show buyers losing control. Full invalidation happens only if the BCH price drops under $422, which would break the entire pattern.
For now, Bitcoin Cash stands out as one of the rare altcoins defying the bear market, supported by both whale accumulation and a bullish technical structure.
Morpho (MORPHO)
Among the altcoins defying the bear market, Morpho stands out because of its strong fundamentals and bullish price structure.
Morpho is the governance token of a decentralized lending platform that allows users to lend and borrow crypto more efficiently. Its infrastructure, called Morpho Blue, improves capital efficiency by directly matching lenders and borrowers, offering better yields and lower borrowing costs.
This strong foundation is now attracting institutional attention. On February 13, 2026, Apollo Global Management, which oversees nearly $940 billion in assets, committed to acquiring up to 90 million MORPHO tokens, or about 9% of the total supply, over time. This creates steady buying pressure and validates Morpho’s role in institutional decentralized finance.
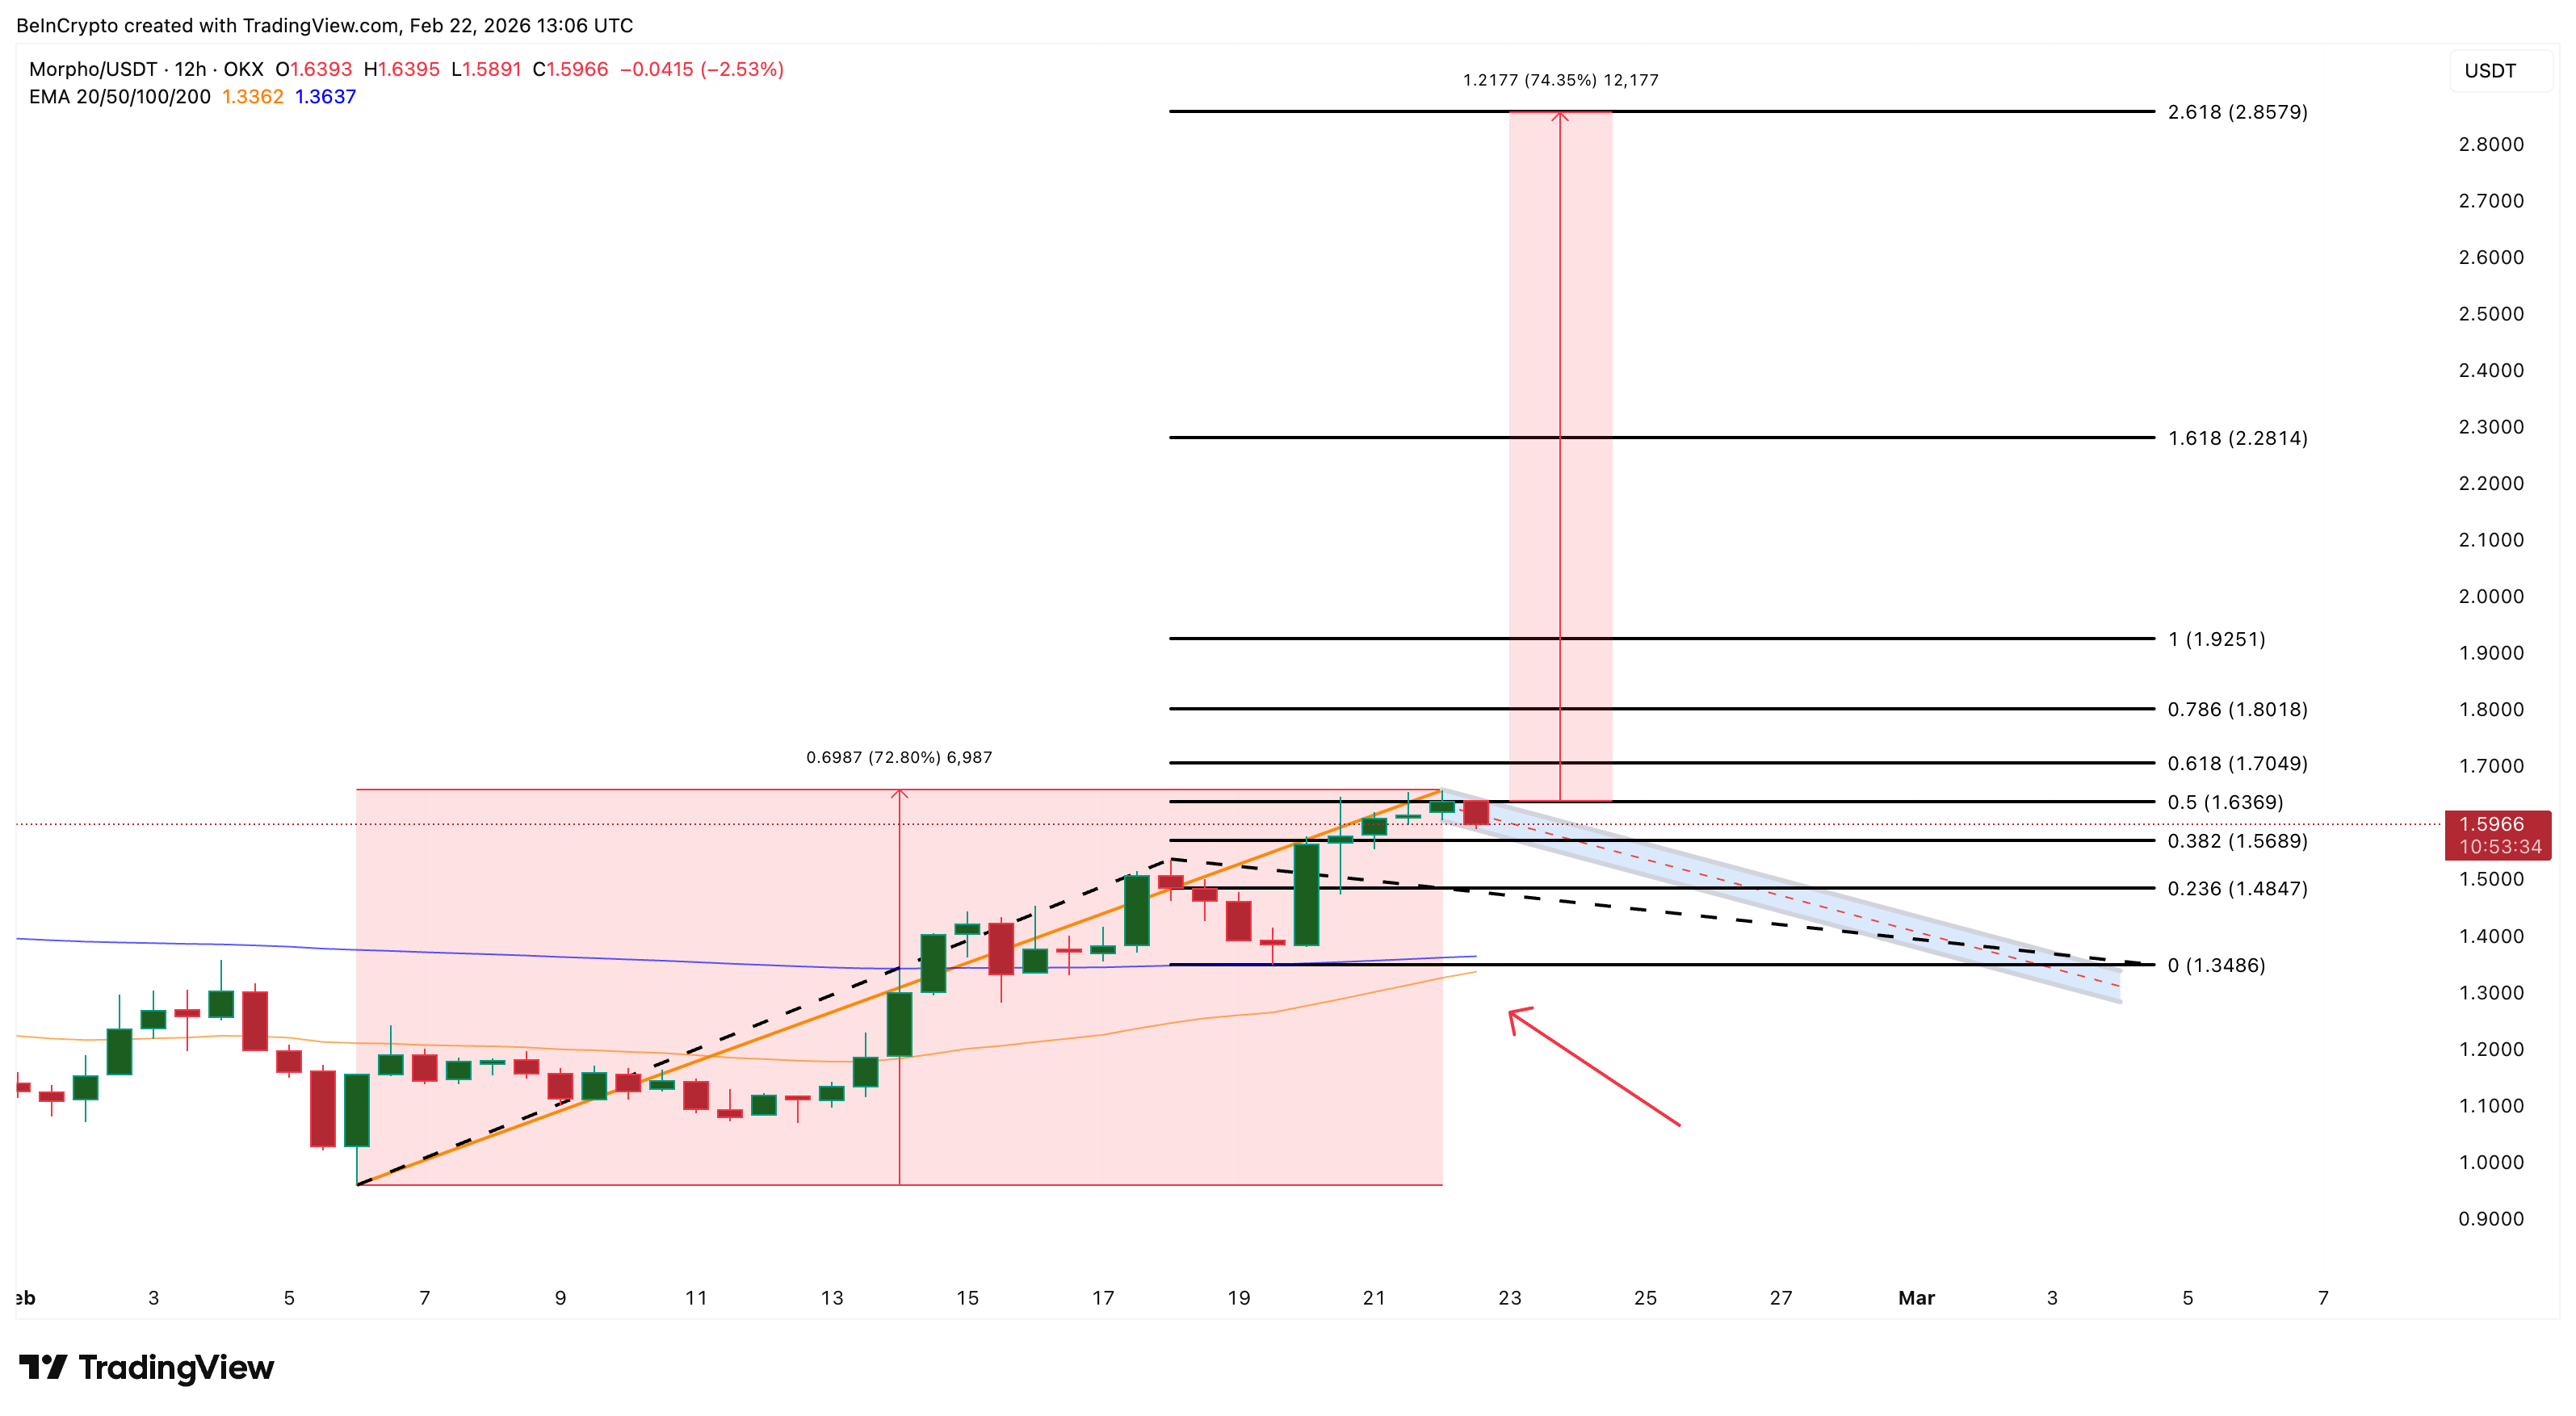
This fundamental optimism is also visible on the price chart. Since February 6, MORPHO has already rallied more than 72%, forming the pole of a classic bullish continuation pattern called a pole-and-flag.
The current consolidation could form the flag, which is a normal pause before another potential move higher.
At the same time, a golden crossover is approaching. This happens when the 50-period Exponential Moving Average (EMA), which tracks the medium-term price trend, moves above the 200-period EMA, which tracks the long-term trend. This signal often confirms the start of a sustained uptrend.
Want more token insights like this? Sign up for Editor Harsh Notariya’s Daily Crypto Newsletter here.
For now, MORPHO remains strong as long as the consolidation range holds above $1.48. However, the structure weakens below $1.34, where the 200-period EMA sits.
However, a confirmed breakout above $1.63 could trigger another 72% rally toward $2.85, reinforcing Morpho’s position among altcoins defying weakness during the crypto bear market.
Decred (DCR)
After Bitcoin Cash and Morpho, Decred has emerged as another altcoin quietly showing unusual strength. The token is up 93% year-on-year and 61% year-to-date, making it the strongest performer in this group of strong altcoins. Even in the past 24 hours, Decred has gained nearly 10%, highlighting persistent demand.
Part of this strength comes from its recent treasury upgrade, which improved how the network funds its own growth and reinforced long-term investor confidence.
However, the chart structure explains why this strength may not be over yet.
Decred is currently trading inside an ascending channel. It is a bullish structure in which the price moves between two rising parallel trendlines.
This pattern usually signals steady accumulation and controlled upward momentum. At the same time, a cup pattern is forming within this channel, creating what appears to be two bullish patterns folded into one structure.
This dual formation significantly strengthens the outlook. Based on the channel and cup projection, Decred could see nearly 37% upside. One major target sits near $39.76, while the extended target aligns near $45.33 if momentum continues.
In the short term, the structure remains healthy as long as Decred holds above $23.66. This level acts as the lower support inside the channel.
A move above $28.79 would signal growing strength and increase the chances of a breakout toward $32.98. It is a key zone that aligns with the channel’s upper trendline. Once this level breaks, the larger upside projection becomes more likely.
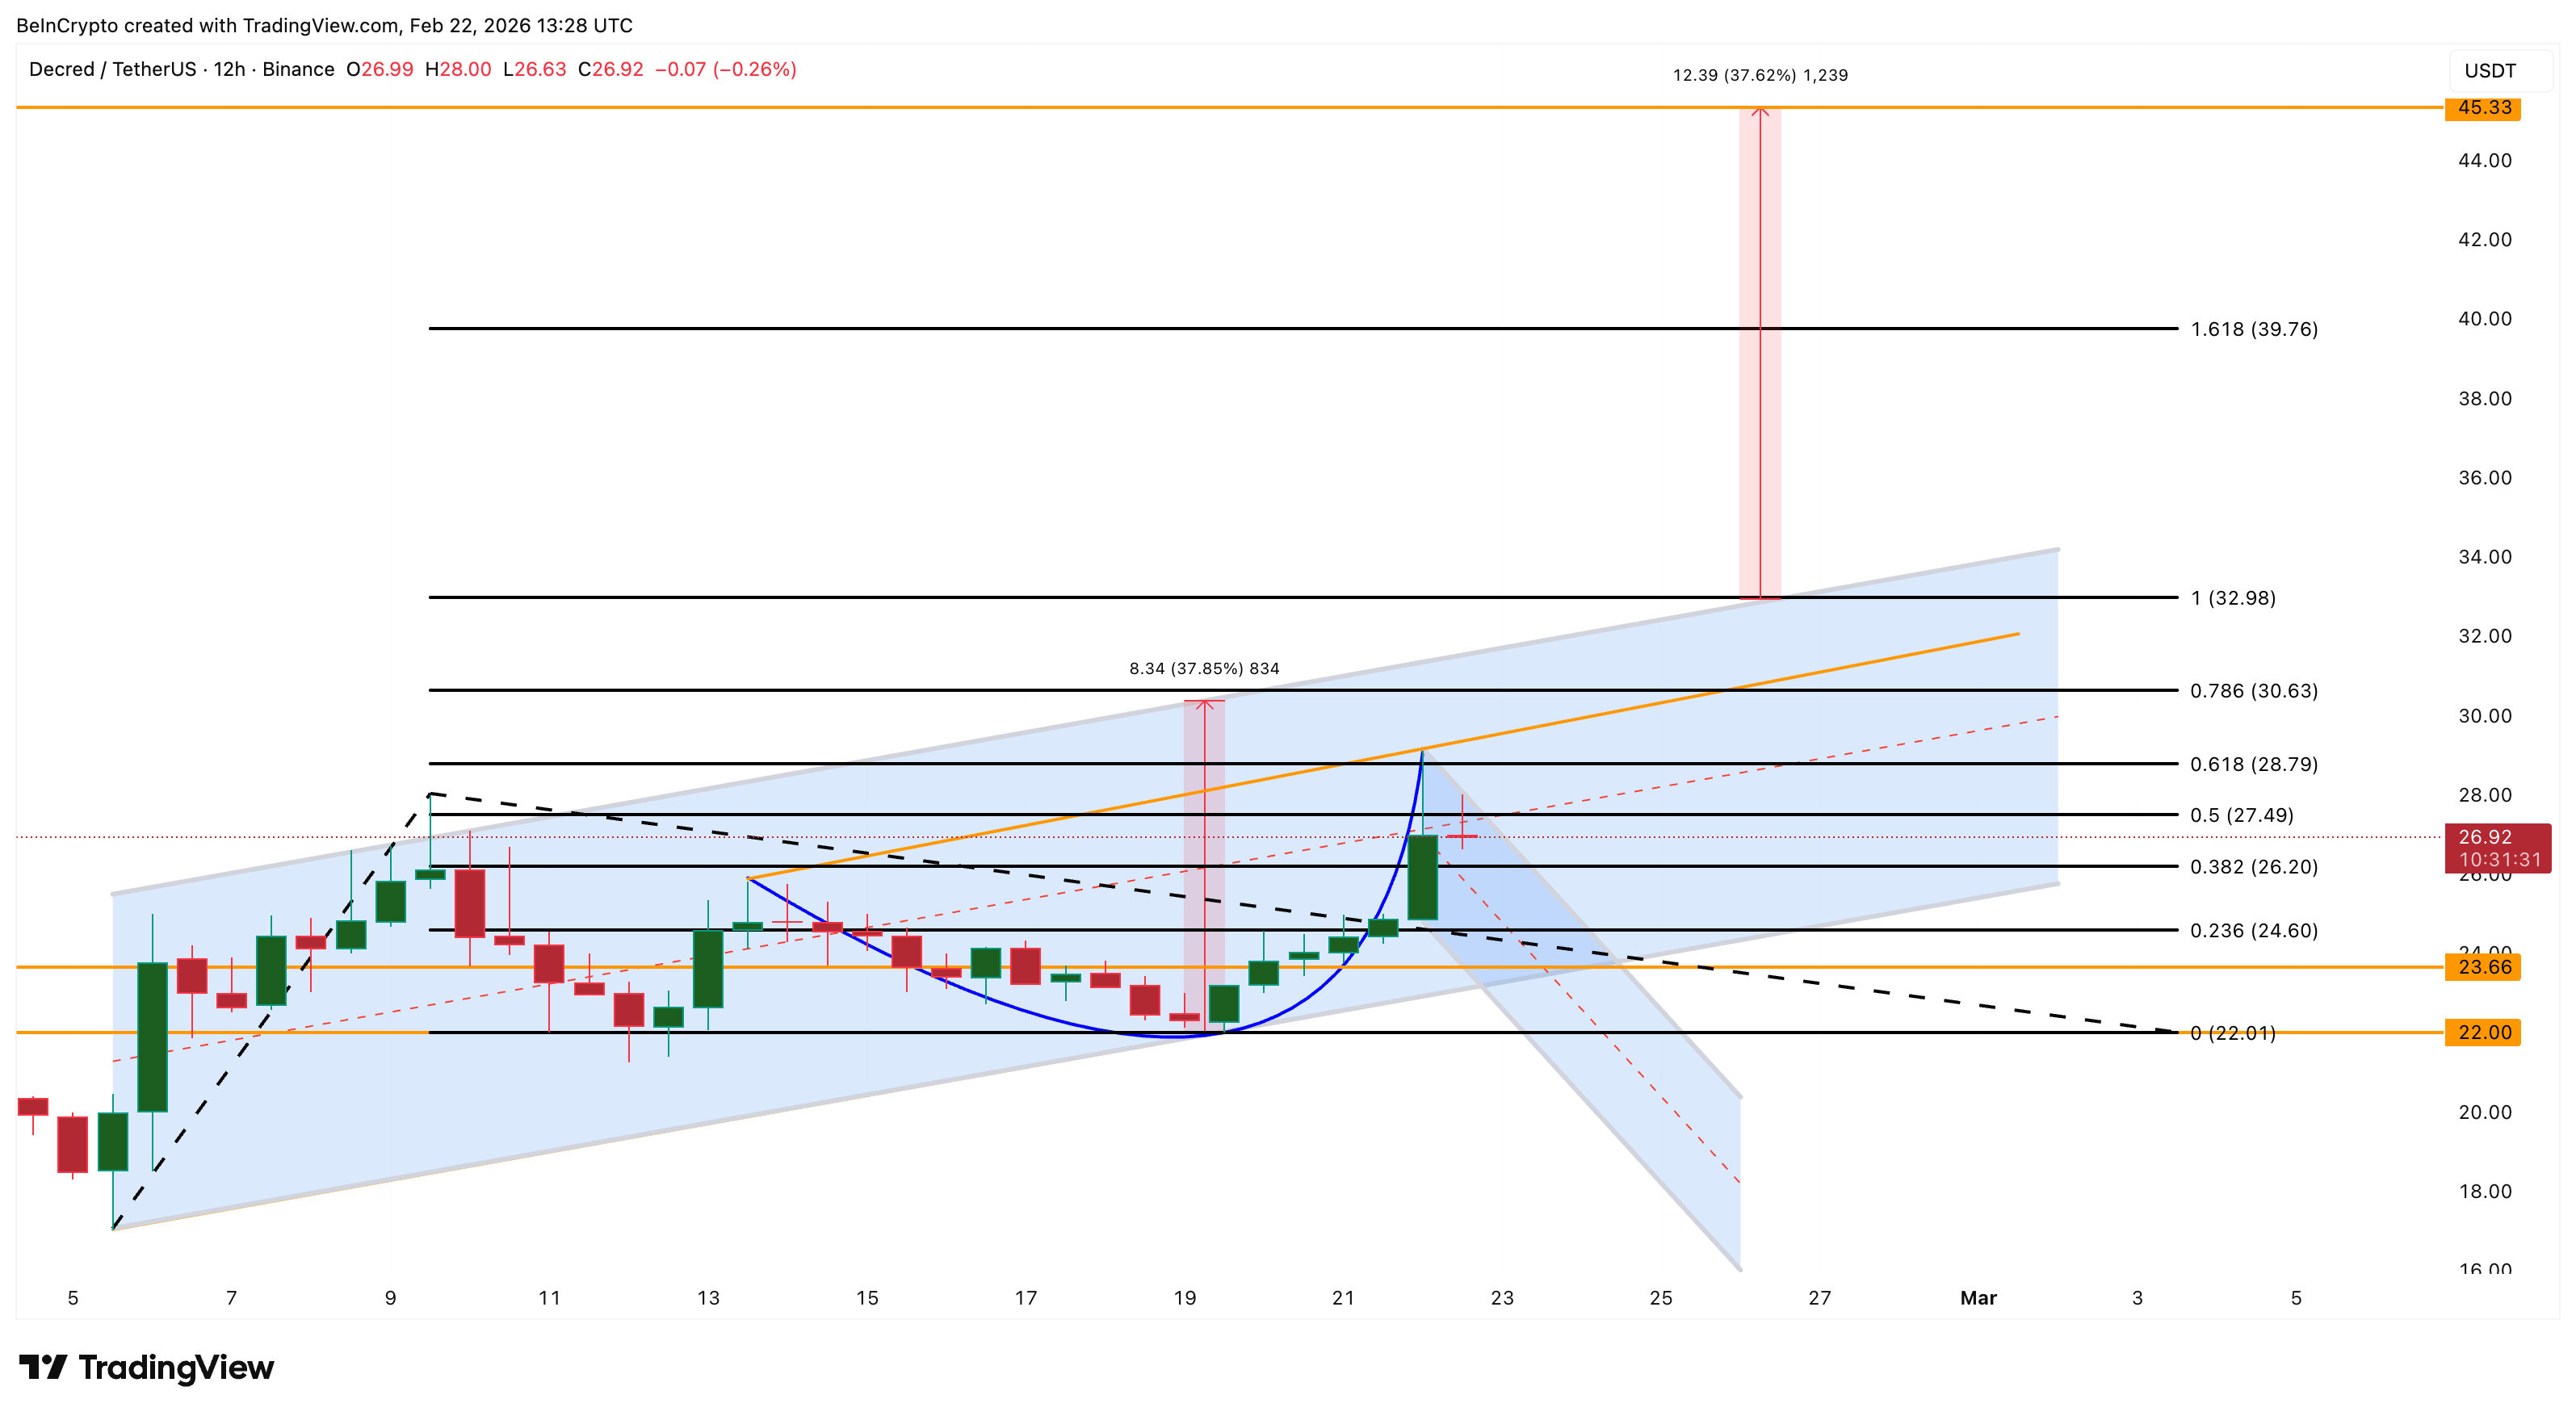
However, a drop below $22.01 would weaken the pattern and shift the structure from bullish to neutral. For now, Decred’s rare combination of strong performance and a layered bullish chart setup shows why it continues to stand out amid most altcoins’ struggles.


TLDR:
- USDT 60-day market cap change has fallen below -$3B for only the second time in crypto market history.
- The first instance occurred in late 2022, aligning precisely with Bitcoin’s cycle bottom near the $16,000 level.
- Three single-day USDT outflows exceeding -$1B have each coincided with local bottoms or sharp Bitcoin volatility.
- Historical data shows Bitcoin entered strong recovery phases once USDT outflows stabilized after peak liquidity stress.
USDT is flashing a rare on-chain signal that has only appeared twice in crypto market history. The stablecoin’s 60-day market cap change has dropped below -$3 billion.
This level was last reached in late 2022, when Bitcoin bottomed near $16,000. That period marked one of the most severe liquidity contractions in the digital asset market.
Now, this same metric is triggering again in early 2026, with Bitcoin trading between $65,000 and $70,000.
USDT Outflows Mirror Patterns From the 2022 Cycle Bottom
The 60-day USDT market cap contraction has only breached -$3 billion on two occasions. The first came during the late 2022 market collapse, a period of forced selling and maximum fear.
The second is occurring now, in early 2026, after Bitcoin’s recent all-time high run.
On a daily basis, USDT has recorded three separate instances of single-day outflows exceeding -$1 billion. Each of those episodes lined up with either local market bottoms or sharp Bitcoin volatility clusters. That pattern is difficult to ignore given the current market conditions.
Analyst CrptosRus qouting MorenoDV_ flagged this development on X, noting the historical weight of the signal. “The 60-day Market Cap Change has dropped below -$3B, on only two occasions,” the post read. “The first occurred in late 2022, precisely as Bitcoin was carving its cycle bottom near $16K.”
Large-scale USDT redemptions at this rate typically reflect institutional or major holder exits from the broader crypto ecosystem.
Historically, these exits tend to cluster near exhaustion points rather than at the start of prolonged downtrends.
Liquidity Conditions Now Determine Bitcoin’s Next Move
Stablecoins function as the dry powder of the crypto market. When USDT supply grows, it points to fresh capital entering the ecosystem. When it contracts sharply, it reflects risk-off behavior, liquidity withdrawal, or forced redemptions.
For Bitcoin, a liquidity-sensitive asset, USDT supply trends carry measurable weight. The current 60-day contraction points to sustained capital outflows and structural tightening in crypto-native liquidity. That creates a fragile environment for price stability.
However, past cycles offer some useful context here. Once forced deleveraging completed and USDT flows stabilized, Bitcoin moved into strong medium-term recovery phases. The normalization of liquidity conditions preceded meaningful upside in prior cycles.
The current setup presents a conditional risk-reward scenario. If USDT contraction continues, downside pressure may extend further.
If flows flatten or reverse, the asymmetry shifts rapidly toward upside potential. Extreme liquidity stress has historically marked opportunity, but only once selling exhaustion is confirmed by stabilizing on-chain flows.

Digital asset company New Frontier Labs has partnered with BitGo Bank & Trust National Association, the entity that crypto infrastructure company BitGo will use to issue and provide custodial services for the FYUSD stablecoin, a dollar-pegged token for Insitutional investors in the Asia region.
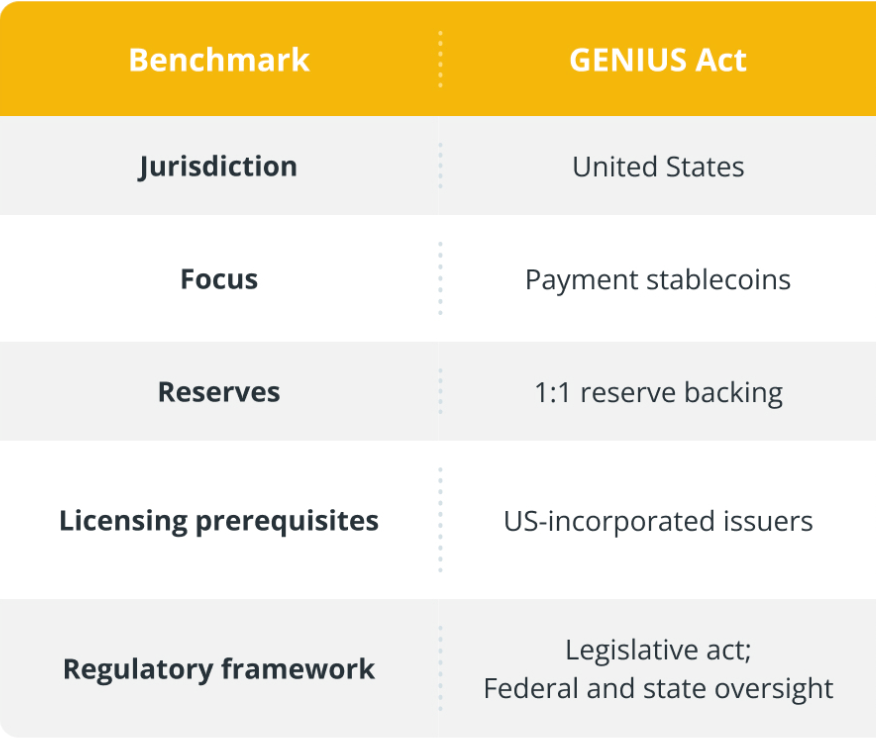
BitGo’s announcement said FYUSD is compliant with the GENIUS Act stablecoin regulatory framework. The regulations include 1:1 backing with cash deposits held by a custodian or short-term US government debt instruments, anti-money laundering (AML) requirements and know-your-customer (KYC) checks.

The company also developed “Fypher,” a suite of stablecoin infrastructure tools that provides a “programmable settlement” layer for the FYUSD token that allows it to be used by autonomous AI agents for commercial transactions.
US Treasury Secretary Scott Bessent has touted stablecoins as a way to preserve US dollar dominance by reducing settlement times, transaction costs and democratizing access to US dollars for individuals without access to traditional banking infrastructure.
Related: 21Shares taps BitGo for expanded regulated staking, custody support across US, Europe
Stablecoins are down from the market cap peak of over $300 billion
The total market capitalization of stablecoins is over $295 billion at the time of this writing, according to RWA.XYZ, down from the peak of over $300 billion recorded in December.

Stablecoin issuer Tether, the issuer of the USDt (USDT) dollar-pegged token, is on-track for the steepest monthly drop in USDt circulating supply since the collapse of the FTX crypto exchange in 2022. At time of writing, circulating supply was 183.64 billion USDT, CoinMarketCap data showed.
While USDt remains the world’s largest stablecoin by market capitalization, its circulating supply is down $1.5 billion so far in February, data from Artemis shows. This is shaping up to be the second month of ramped up user redemptions, following a $1.2 billion drop in January.
Stablecoin redemptions could signal a broader contraction in the crypto market, as investors liquidate their positions and move their holdings off-chain, potentially into other investments.
However, spokespeople for Tether told Cointelegraph that the data represent short-term positioning, rather than a long-term trend of sustained outflows and market contraction.
Magazine: Bitcoin payments are being undermined by centralized stablecoins
Crypto World
Ethereum RWAs Hit $15B as Tokenized Gold and Treasury Products Fuel Institutional Growth
TLDR:
- Ethereum’s RWA market surpassed $15B in 2025, marking more than 3x growth within a single calendar year.
- Tether Gold and Paxos Gold combined to add over $4B in new tokenized gold value on-chain this year.
- BlackRock BUIDL, Ondo USDY, and WisdomTree posted triple to four-digit growth in Treasury-backed products.
- Syrup USDC and USDT scaled to $2.3B combined, proving strong demand for yield on idle stablecoins.
RWAs on Ethereum have crossed the $15 billion mark, reflecting more than triple growth within a single year. The surge is largely driven by tokenized funds, gold products, and yield-bearing stablecoins.
Institutions are no longer testing the waters — they are committing real capital. This shift marks a turning point for on-chain finance, as real-world asset tokenization moves from concept to active deployment across major financial players.
Tokenized Gold and Treasury Products Lead the Charge
Tokenized gold has scaled at an aggressive pace over the past year. Tether Gold grew from roughly $500 million to $2.7 billion during this period.
Paxos Gold also climbed to around $2.3 billion in total value. Together, gold products alone added over $4 billion in new on-chain value.
Treasury-backed products followed a similar trajectory. Ondo USDY, BlackRock BUIDL, Janus Henderson, Superstate, and WisdomTree all posted triple- to four-digit growth rates.
These are not small or speculative positions—institutions are directing meaningful capital toward these products. The numbers reflect a structural shift, not a temporary trend.
Crypto analyst Ted, posting under the handle @TedPillows, noted the pace of this growth. He wrote that RWAs on Ethereum “just crossed $15B” and described it as “more than 3x growth in a single year.”
His observation pointed to tokenized funds and short-duration U.S. Treasuries as the primary catalysts behind the move.
The appeal of Treasury products lies in their familiarity and yield. These instruments offer stable returns while settling on-chain with full transparency.
As a result, they attract both traditional finance firms and crypto-native protocols seeking low-risk allocations.
Yield Products and DeFi Integration Expand the RWA Market
New yield products have also contributed to the RWA market’s expansion. Syrup USDC and USDT scaled to approximately $2.3 billion combined within a short period. The speed of that growth points to strong existing demand for yield on idle stablecoins.
These products work because they plug directly into decentralized finance as collateral. Stablecoins parked in RWA-backed instruments can earn returns that were previously unavailable on-chain. This creates a practical use case that goes beyond speculation.
Ethereum continues to hold around 60% of the RWA market share. Stablecoins on Ethereum alone exceed $160 billion, which means RWAs at $15 billion still represent a relatively small portion of the broader base. There is room for continued expansion as more assets come on-chain.
Ted framed it plainly: “This is no longer pilots or experiments.” Settlement is transparent, programmable, and increasingly efficient.
The infrastructure supporting RWAs on Ethereum is maturing, and capital flows are following that maturity in real time.

Healthy governance in decentralized organizations hinges on disagreement, not uniform assent. That perspective, articulated by Dr. Michael Egorov, founder of Curve Finance, frames a rising discourse around the vitality of on-chain decision-making. In practice, disagreements are not only tolerated but expected as a feature of how these communities steer protocol direction through smart contracts and member voting. Two recent episodes illuminate this dynamic: a long-running governance debate over a grant to Swiss Stake AG—the company behind Curve’s development—and a December 2025 clash within the Aave ecosystem that turned on how fees from a CoW Swap integration should be allocated and who controls related intellectual property. Taken together, the episodes underscore that healthy friction can drive accountability and innovation in decentralized governance.
Key takeaways
- Disagreement within DAOs is a sign of engagement and vitality, not dysfunction, according to key voices in the space.
- The Swiss Stake AG grant controversy at Curve’s governance forum highlighted how large sums can provoke heated debate and turnout, with revised proposals attracting strong participation.
- IP rights and attribution emerged as a flashpoint in the Aave ecosystem, illustrating how governance structures handle ownership of brand assets and code assets in a decentralizing environment.
- Empirical observations from external analyses show that turnout in many DAOs remains concentrated among a relatively small, active cohort, prompting debates about inclusive participation.
- Experts argue that giving DAOs clearer legal recognition could reduce disputes by enabling more straightforward interaction with traditional financial and corporate frameworks.
Tickers mentioned: $CRV, $AAVE
Sentiment: Neutral
Market context: The episodes sit within a broader trend of on-chain governance evolving from experimental phases toward more structured, if still highly contested, governance models. As DAOs experiment with funding, IP, and external integrations, the debate over how to balance participation with accountability is increasingly central to long-term sustainability.
Why it matters
DAO governance is quickly becoming a standard mechanism for steering open-source finance and non-custodial protocols. The Curve-related discussions demonstrate that communities are willing to revisit and revise proposals when members feel the financial or strategic stakes are high. In practice, the process involves not only voting but a cycle of proposal disclosure, debate, revision, and turnout that tests the resilience of on-chain governance. The central question is how to retain broad engagement while ensuring that proposals are not merely the product of a narrow cadre of active participants. In this sense, the Curve saga reflects a broader governance design challenge: how to translate on-chain votes into outcomes that stakeholders can trust and implement.
The Aave dispute adds another layer to the governance conversation: who owns the fruits of a protocol’s development and how that ownership translates into control of branding, IP, and related assets when the DAO delegates or distributes funds. The decoupling of development work from governance, and the tension over whether IP should reside in a DAO-controlled bucket or remain with a development entity, frames a key governance dilemma for DeFi projects that seek both rapid innovation and robust democratic oversight. Taken together, these cases suggest that the next phase of on-chain governance will involve not just votes but governance-in-ownership—how legal and organizational structures map onto code and communities.
Experts also argue that the current friction underscores the potential benefits of clearer legal recognition for DAOs. If DAOs could attain formal recognition—own business entities, hold bank accounts, and interact with traditional financial systems—the risks around disputes over ownership and control could be reduced. In Egorov’s view, the law has not yet fully caught up with the pace of decentralized technology, and greater regulatory clarity could help align on-chain governance with real-world operations without stifling innovation.
What to watch next
- Follow the amendment cycle for the Swiss Stake AG grant, including any new drafting rounds or updated voting timelines in Curve’s governance portals (e.g., the amendment of the 2026 proposal).
- Monitor Aave governance discussions surrounding IP governance and branding assets as the community debates next steps after the December 2025 discussions.
- Track regulatory developments related to DAO recognition and access to traditional financial rails that could impact how DAOs interact with lawyers, banks, and custodians.
- Observe whether future governance events increase turnout beyond the levels seen in prior analyses and how protocol communities address representation and inclusivity concerns.
- Watch for new analyses or empirical studies on turnout and governance participation to gauge whether the anecdotal trends around active participation persist or shift over time.
Sources & verification
- Curve governance page detailing Swiss Stake AG grant proposal and related discussions.
- News coverage and archival material on the 2025 revised Swiss Stake AG grant proposal ( turnout and voting results).
- Aave governance thread discussing CoW Swap integration and tokenholder questions about fees and IP control.
- Cointelegraph coverage on Aave founder strategy after governance vote and the broader governance discourse surrounding IP and brand assets.
- LamprosTech analysis on DAO voter turnout in 2025 and its implications for governance structures.
DAO governance in practice: what this means for the ecosystem
The debates around Swiss Stake AG’s Curve grant and the Aave IP dispute illustrate a broader trend: governance deliberations are increasingly treated as an ongoing process rather than a one-off decision. These cases underscore how communities must continuously negotiate the balance between ambitious, well-funded initiatives and the need for broad-based participation and accountability. The existence of firm positions on grants and IP signals that communities are not merely rubber-stamping proposals; they are dissecting the long-term implications of funding and ownership in a way that aligns incentives across actors—developers, token holders, and users.
Importantly, the discussions also highlight that governance is not purely about abstract vote counts. They touch on practical outcomes—how funds are allocated, who holds decision-making power over branding and code, and how disputes between on-chain governance and off-chain management are resolved. As these ecosystems mature, the interplay between what is coded on-chain and what is recognized legally off-chain will become a defining factor in the durability of these platforms. That ongoing evolution will require thoughtful design, transparent processes, and, perhaps most crucially, a willingness to admit missteps and iteratively improve governance structures to reflect changing technologies and community expectations.
Market reaction and key details
The ongoing governance episodes underscore a core reality of crypto markets: governance decisions can materially influence investor sentiment and strategic direction, even when the financial impact appears indirect. For participants, watching how the Curve ecosystem handles the Swiss Stake AG grant and how Aave navigates IP-related governance questions will offer insights into how other DAOs might approach similar challenges. The balance between active participation and practical execution remains delicate; successful governance will likely hinge on clear processes, transparent communications, and the ability to translate on-chain votes into concrete, auditable outcomes.
TLDR:
- Buterin defines security as minimizing divergence between user intent and actual system behavior at all times.
- Perfect security is impossible because human intent is too complex to capture in any single mathematical definition.
- Good security systems rely on redundant, overlapping specifications that approach user intent from multiple distinct angles.
- LLMs can approximate user intent as one layer of security but should never act as the sole decision-making authority.
Security, as Ethereum co-founder Vitalik Buterin sees it, is not about adding more steps to a process. It is about minimizing the gap between what a user intends and what a system actually does.
Buterin shared this perspective in a detailed post on X, connecting security directly to user experience. His framework draws on type systems, formal verification, and even large language models as tools to close that gap.
Security and User Experience Share the Same Definition
Buterin argues that security and user experience are not separate disciplines. Both aim to reduce the divergence between user intent and system behavior.
The only real difference is that security focuses on tail-risk situations — cases where divergence carries a large downside.
These tail-risk situations become more dangerous when adversarial behavior is involved. A bad actor can exploit any gap between what the user intended and what the system executed. That gap, however small, becomes the attack surface.
Buterin wrote, “Perfect security is impossible. Not because machines are flawed, or even because humans designing them are flawed, but because the user’s intent is fundamentally a complex object.” This framing shifts responsibility from pure engineering toward understanding human cognition itself.
The Problem of Representing Intent in Mathematical Terms
A straightforward goal like sending one ETH to a contact named Bob already carries hidden complexity. Representing Bob as a public key or hash introduces the risk that the key does not actually correspond to Bob. Even the definition of ETH becomes contested in the event of a hard fork.
More abstract goals make the problem even harder. Preserving a user’s privacy, for instance, goes well beyond encrypting messages.
Metadata patterns, message timing, and communication graphs can leak substantial information even when content is fully encrypted.
Buterin draws a direct comparison to early work in AI alignment, noting that robustly specifying goals is one of the hardest parts of the problem. The challenge of defining user intent in security is structurally identical to that challenge.
Redundant Specifications as the Core Design Principle
Buterin’s proposed solution centers on redundancy. Good security systems ask users to specify their intent in multiple overlapping ways, and only act when those specifications align. This pattern appears across many existing tools.
Type systems in programming require a developer to describe both what the code does and what shape the data takes at each step.
Formal verification adds mathematical properties on top of that. Transaction simulations ask users to review expected outcomes before confirming an action.
Post-assertions, multisig setups, spending limits, and new-address confirmations all follow this same structure. Each layer approaches intent from a different angle — action, expected effect, risk level, and economic bound. Together, they reduce divergence without any single layer being foolproof.
How Large Language Models Fit Into This Framework
Buterin also addresses the role of LLMs within this redundancy model. A general-purpose LLM functions as an approximation of human common sense. A fine-tuned model can serve as a closer approximation of a specific user’s normal behavior patterns.
That said, Buterin is clear that LLMs should never serve as the sole determinant of intent. Their value comes from the angle they offer — one that is structurally different from traditional, rule-based specifications. That difference increases the practical value of the redundancy.
The broader takeaway is straightforward. Security should make low-risk actions easy and high-risk actions harder to complete. Getting that balance right, rather than adding friction across the board, is the actual engineering challenge.


Binance controls nearly a third of exchange-held supply, underscoring how liquidity power is concentrating among a few venues.
Nearly 3 million Bitcoin (BTC), worth approximately $200 billion and representing 15% of the circulating supply, currently sits on centralized exchange platforms.
The concentration of assets on trading venues reveals that, despite the shock of the FTX collapse in 2022 and years of industry messaging around self-custody, about one out of every six BTC in existence remains stored with third-party intermediaries.
Binance Dominates
Data shared by crypto analyst Darkfost shows that centralized exchange reserves have climbed alongside the expansion of trading services.
Platforms now offer yield generation, collateralized derivative products, and lending solutions, all of which require maintaining significant Bitcoin reserves to meet user liquidity needs. The result is that approximately 3 million BTC now sits on exchanges, with the distribution heavily skewed toward market leaders.
According to the on-chain observer, Binance holds the largest share, controlling around 30% of all Bitcoin stored on centralized platforms. Bitfinex follows with almost 20% of reserves, while Robinhood and South Korea’s Upbit each account for about 8.2%. Kraken, OKX, and Gemini round out the top tier with holdings between 5% and 7%, respectively.
The concentration becomes even more pronounced when examining absolute figures. Per data from CoinGlass, Coinbase Pro currently holds approximately 792,000 BTC, making it the single largest exchange holder despite its smaller percentage of the CEX-specific ranking. Binance follows with nearly 662,000 BTC, while Bitfinex holds roughly 430,000 BTC.
“The liquidity depth, fast order execution, and access to additional services such as lending and staking contribute to maintaining a significant share of Bitcoin’s circulating supply within these centralized infrastructures,” Darkfost noted in their analysis.
This observation matches up with trading volume data showing continued activity concentration, with a CryptoQuant report from earlier in the year showing that Binance captured over 40% of spot and Bitcoin perpetual volumes across major global exchanges in 2025. The platform also processed $25.4 trillion in Bitcoin perpetual futures alone.
You may also like:
Market Structure Shifts Despite Persistent Exchange Holdings
The $200 billion held on exchanges represents a complex market dynamic because, while total exchange reserves are substantial, the past month has seen mixed movements across platforms.
CoinGlass data shows overall exchange balances increased by some 16,990 BTC over the past 30 days, but individual platform trends diverged significantly. For example, Binance added more than 22,000 BTC during that period, while OKX and Bithumb recorded outflows exceeding 2,700 BTC and 3,600 BTC, respectively. Gemini saw the largest 30-day decline, with balances dropping by almost 13,900 BTC.
These movements are happening against a backdrop of evolving exchange business models and regulatory positioning. Kraken confidentially filed for an IPO with the U.S. Securities and Exchange Commission (SEC) in November 2025, following an $800 million funding round that valued the exchange at $20 billion.
Meanwhile, Robinhood, which holds approximately 8.2% of exchange BTC reserves, recently launched the public testnet for Robinhood Chain in February 2026, an Ethereum Layer 2 network built on Arbitrum designed to accelerate development of tokenized assets.
Binance Free $600 (CryptoPotato Exclusive): Use this link to register a new account and receive $600 exclusive welcome offer on Binance (full details).
LIMITED OFFER for CryptoPotato readers at Bybit: Use this link to register and open a $500 FREE position on any coin!
Gold is on the verge of an unprecedented eighth consecutive monthly gain, a streak that would mark the longest in its history. However, several headwinds are threatening to interrupt the rally.
While investors have flocked to the safe-haven metal amid macroeconomic uncertainty, market strategists warn that the run-up may be reaching a critical juncture.
Gold’s Historic Rally Faces Unprecedented Risks
Chief Economist at Moody’s Analytics, Mark Zandi, warns that financial markets feel increasingly fraught, with the elements for a meaningful selloff coming into place.
This threat, he says, is highest for stocks and corporate bonds, but even crypto, gold, and silver remain at risk despite recent pullbacks.
“Valuations are high…investors are simply investing on the faith that prices will rise quickly in the future because they have in the recent past,” Zandi stated.
The economist points to mixed economic fundamentals as a source of tension. US real GDP is growing just over 2%, below the economy’s potential of roughly 2.5%. Meanwhile, employment has flatlined, and unemployment continues creeping higher.
Inflation, measured by the Fed’s preferred consumer expenditure deflator, remains stubbornly and uncomfortably high at 3%.
Meanwhile, renewed tariff chaos and the looming threat of conflict with Iran provide little upside for risk assets.
The Treasury market adds another layer of uncertainty. Zandi warns that leveraged hedge funds have stepped into a fragile market left by a retreating Federal Reserve and global investors.
“It’s not hard to imagine them running for the proverbial door all at once, and interest rates spike,” he said.
Massive budget deficits and questions about the safe-haven status of Treasuries in a de-globalizing world exacerbate the risk.
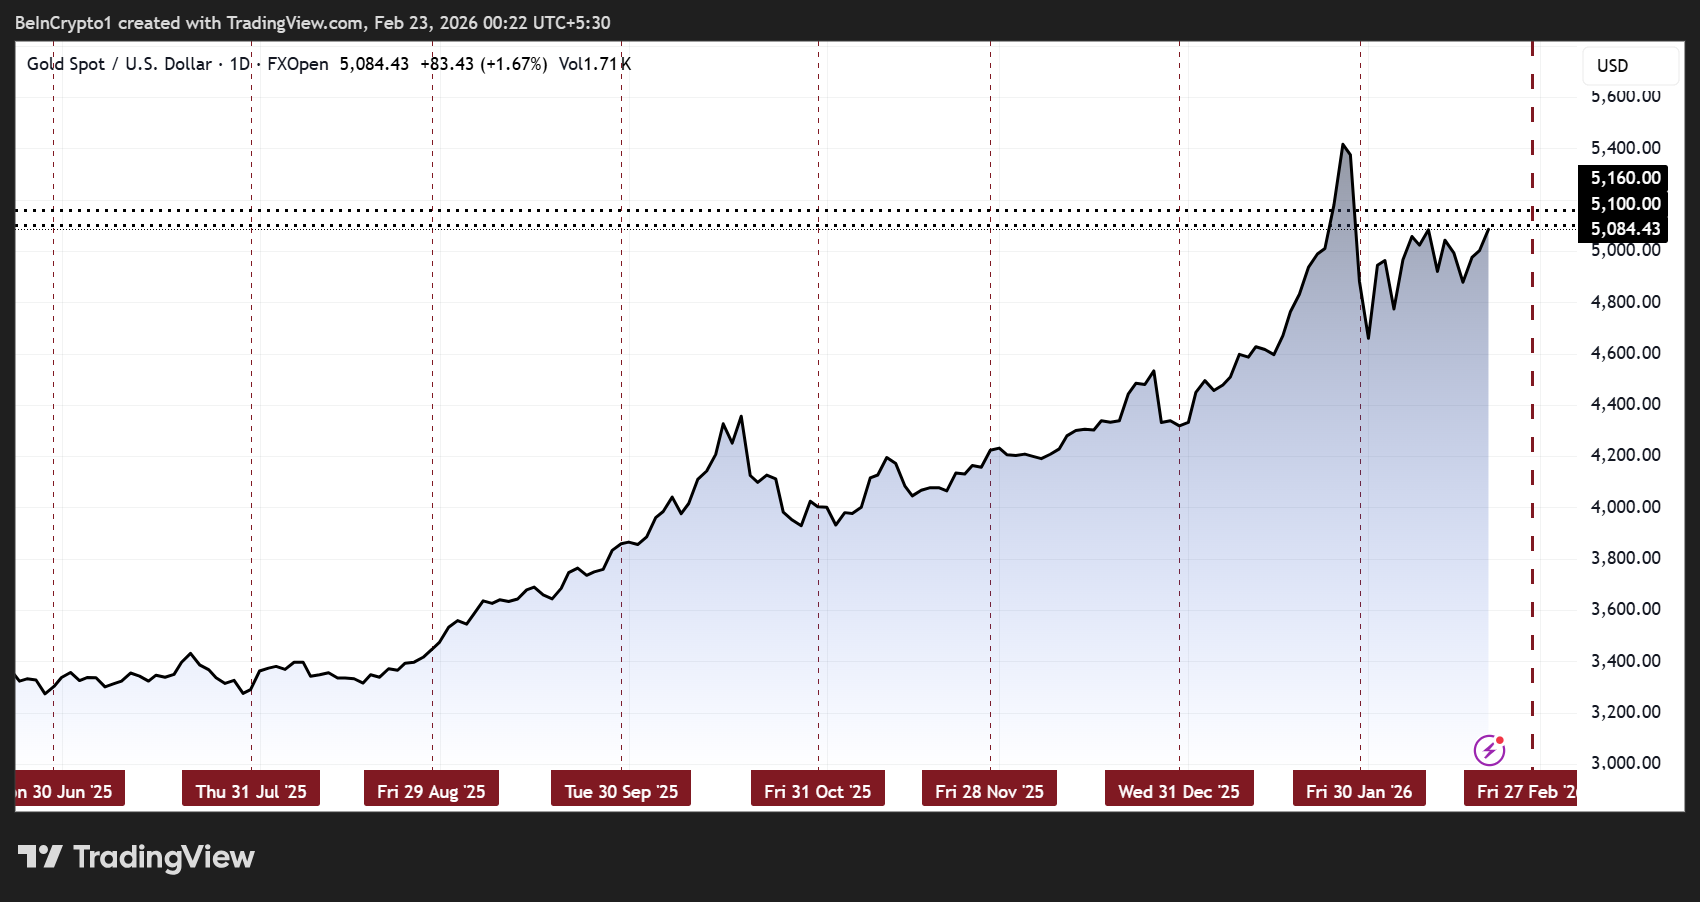
Despite these headwinds, gold continues to attract investors as a durable store of value. Data from Kalshi shows the metal on track for its eighth straight green month.
Meanwhile, Bank of America strategist Michael Hartnett advises trading oil for short-term geopolitical gains but “owning gold” for longer-term safety.
Central banks now hold more gold than US Treasuries in reserves for the first time since 1996, reflecting their role as a hedge against fiat currency risk.
China’s Gold Shortage Sparks Supply Crunch Amid Historic Rally
China’s post-Chinese New Year gold shortage is also adding bullish momentum, though it comes with its own risks.
Reports indicate that many gold shops halted bar sales and refunded pre-holiday contracts due to severe supply constraints.
Analysts suggest this could push gold toward $10,000 per ounce in extreme scenarios, though abrupt market reactions may trigger short-term corrections.
“Extremely severe gold shortage to Send Gold to $10,000/oz soon!” Silver Trade noted.
Technical analysts remain cautious as well. Rashad Hajiyev notes resistance near $5,160. Meanwhile, FXGold Analyst highlights the critical $5,100 gap, suggesting that opening below this level could favor sellers and limit buying momentum.

In sum, while gold’s historic streak remains intact for now, investors face a delicate balancing act between soaring demand, geopolitical uncertainty, fragile markets, and key technical levels.
The combination of these factors means that the metal’s next moves may be as volatile as they are historic.
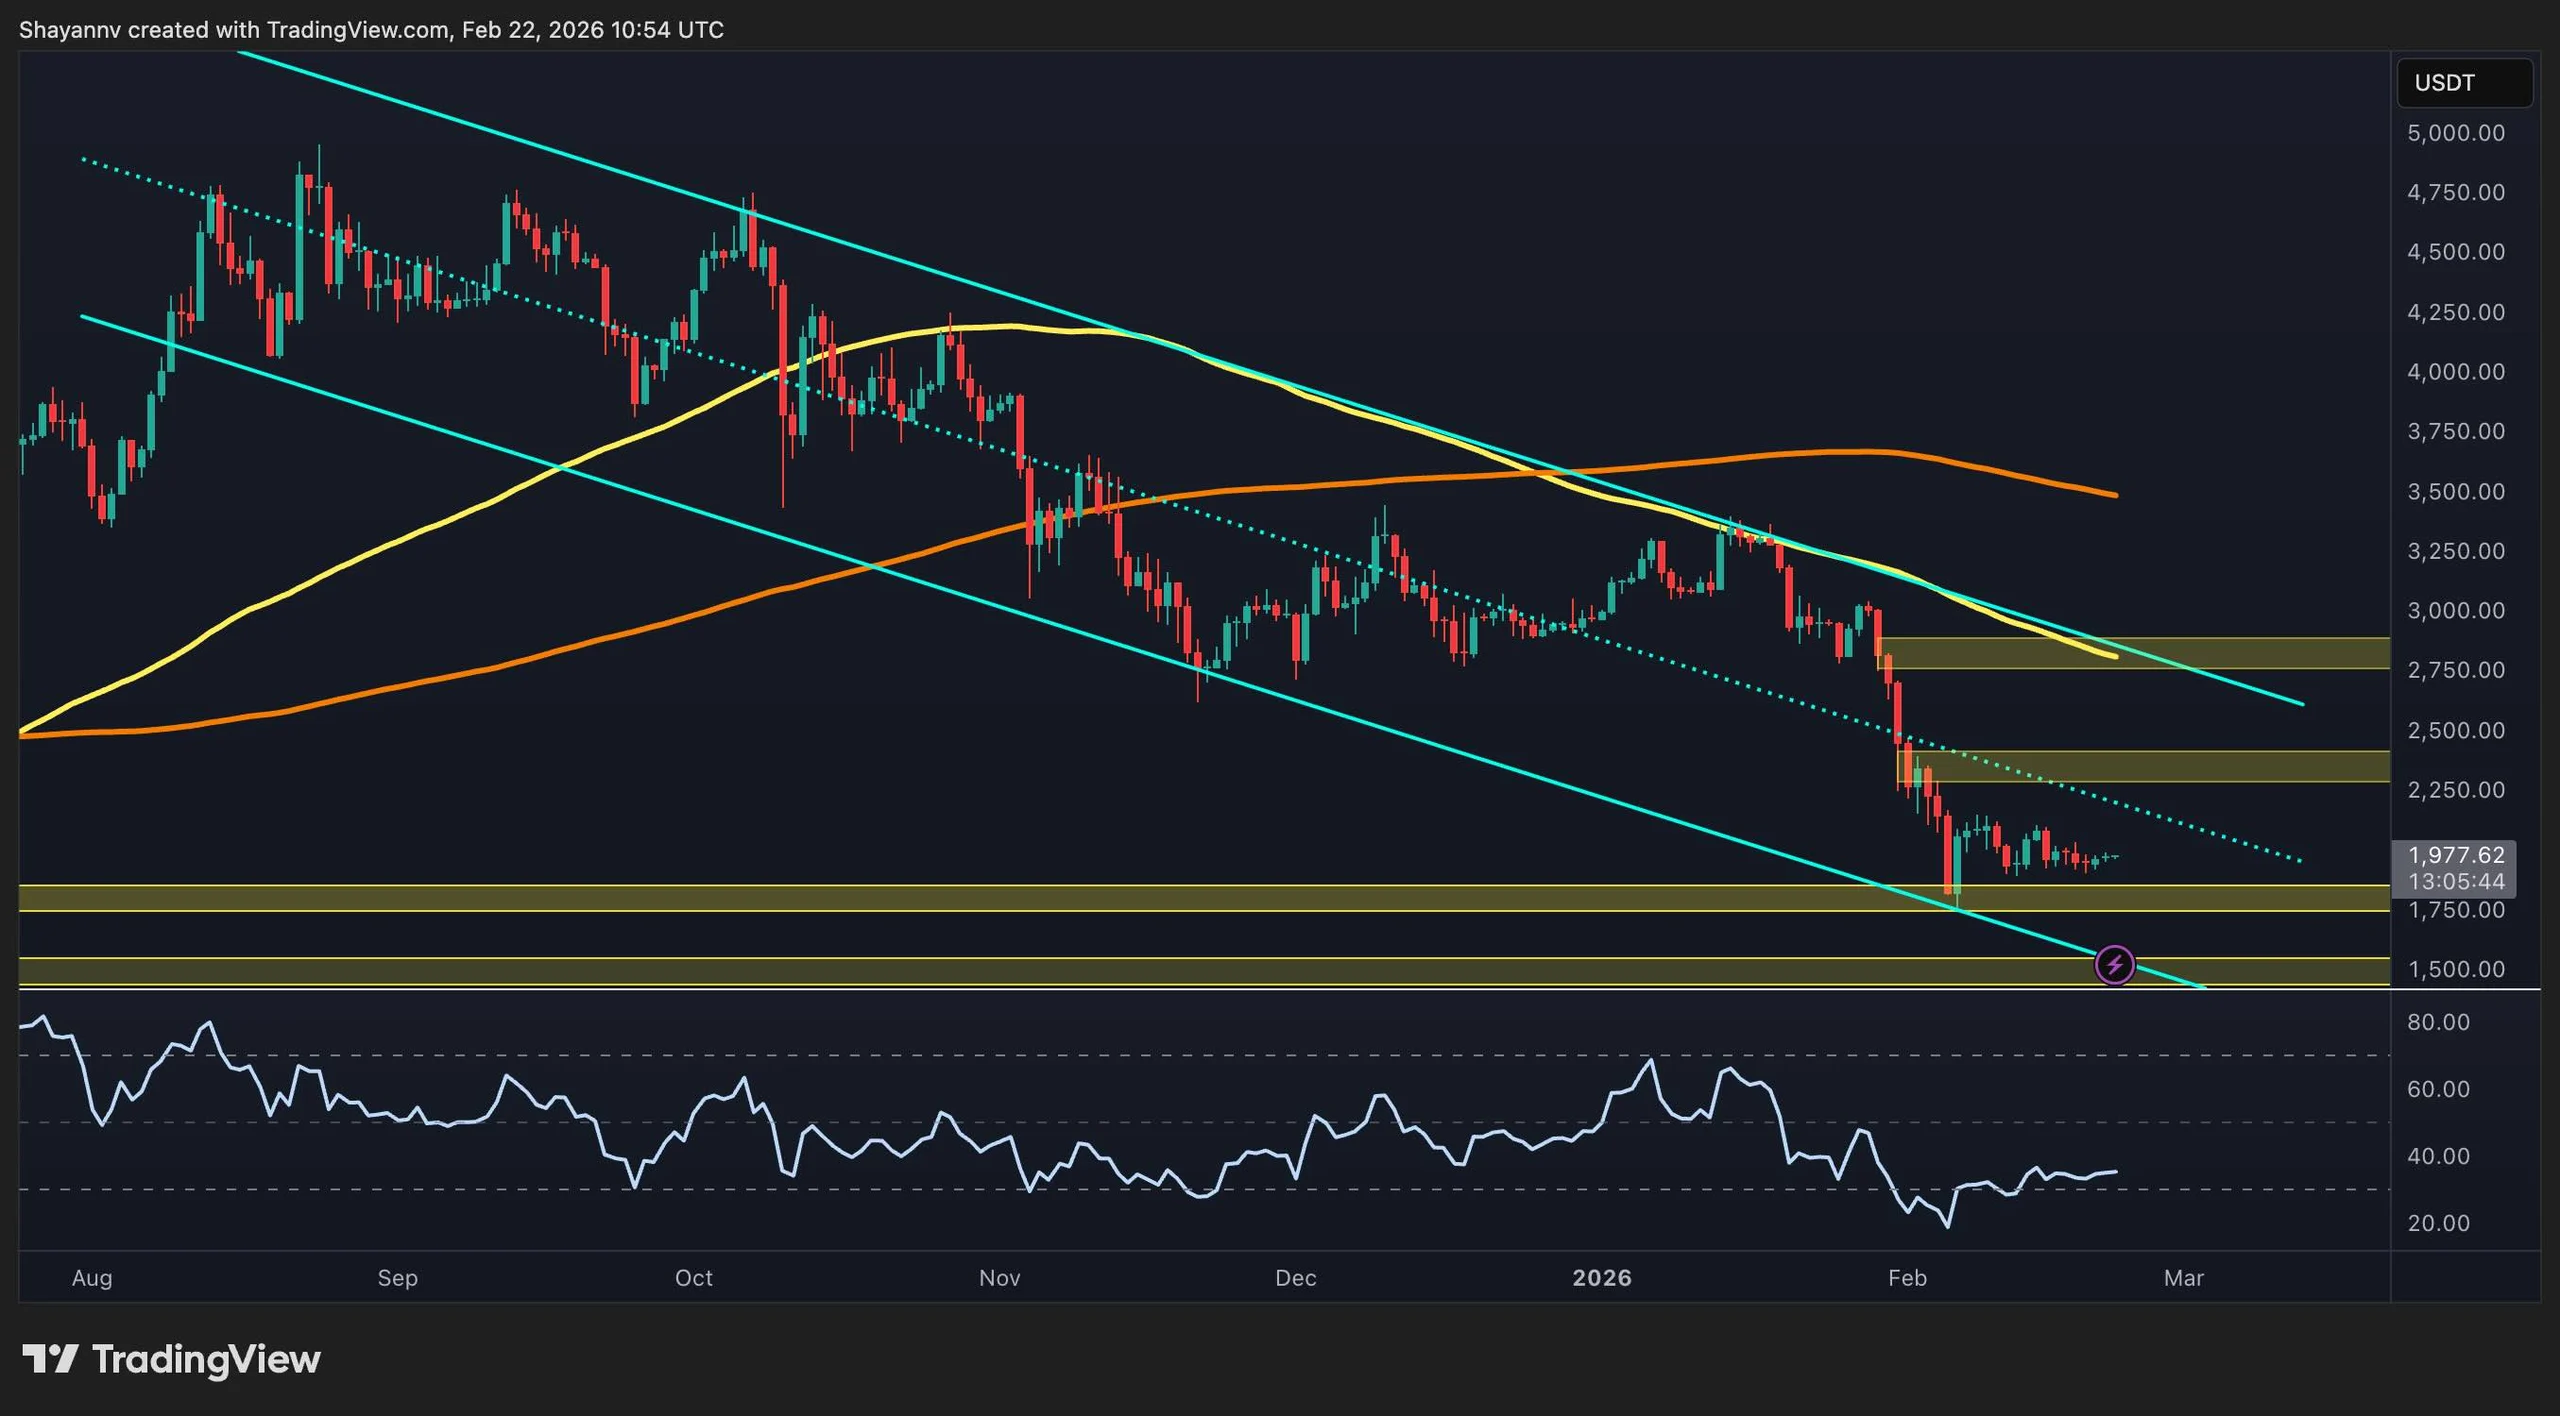
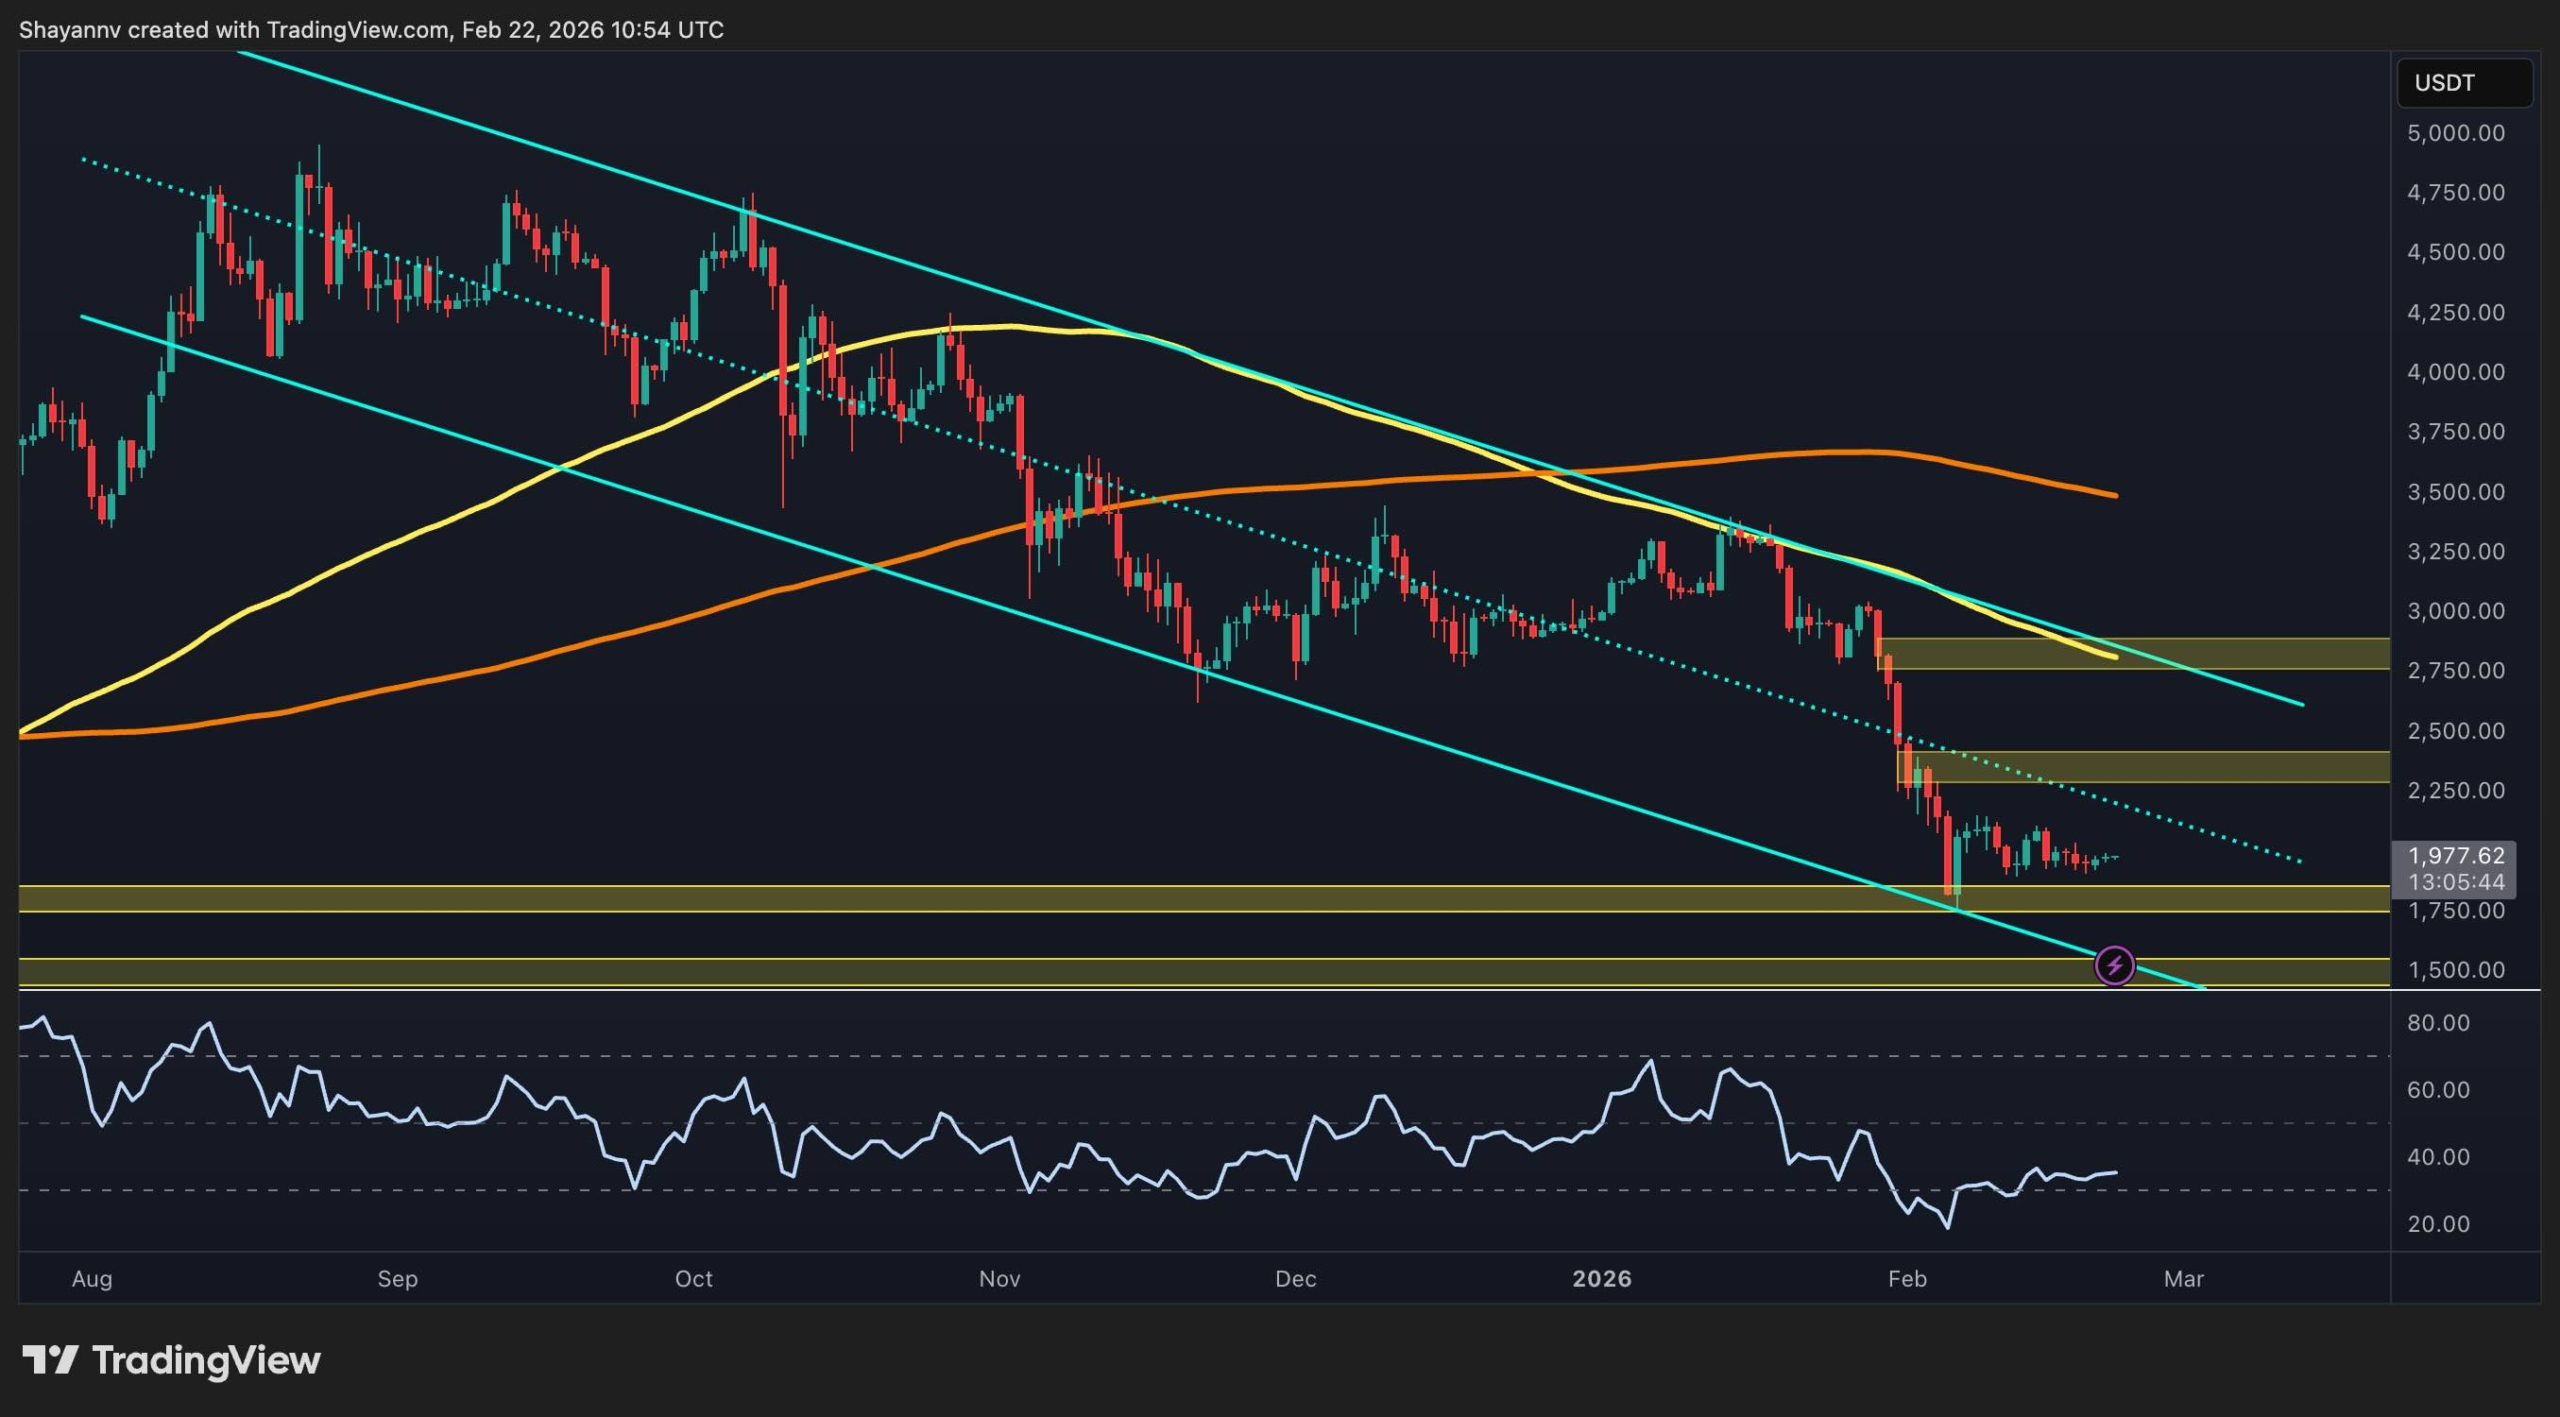
Ethereum remains in a broader corrective phase, trading below key moving averages and inside a well-defined descending structure. While short-term stabilization is visible near support, the higher-timeframe trend still favors sellers unless major resistance levels are reclaimed with strong momentum.
Ethereum Price Analysis: The Daily Chart
On the daily timeframe, ETH continues to respect a descending channel, consistently forming lower highs beneath both the 100-day and 200-day moving averages. The recent breakdown accelerated the price into the $1,750–$1,800 demand zone, where buyers have stepped in to slow the decline, but the structure remains bearish overall.
The $2,300–$2,400 region now acts as a key resistance cluster, aligning with prior breakdown levels and just below the declining 100-day moving average. Unless ETH can reclaim that zone and break above the channel’s upper boundary, rallies are likely to be corrective, with the risk of another leg toward lower channel support still present.
ETH/USDT 4-Hour Chart
On the 4H timeframe, the asset has been compressing inside a symmetrical triangle formed from recent lower highs and higher lows, above the $1,800 horizontal support zone. This short-term symmetrical contraction reflects indecision rather than confirmed reversal, as lower highs are still being printed.
A breakout above $2,000–$2,100 highs would be the first signal of a short-term momentum shift and could open a move toward the $2,300-$2,400 resistance band. Conversely, losing the $1,800 base would invalidate the consolidation thesis and likely trigger renewed downside pressure toward deeper support levels.

On-Chain Analysis
Active address data shows a sharp spike in network activity recently, with the 30-day EMA of active addresses surging to multi-month highs. Historically, similar expansions in activity have coincided with periods of heightened volatility and often precede major directional moves.
However, despite the spike in participation, the asset has not yet confirmed a bullish reversal. This divergence suggests that while engagement is rising, capital flows are not decisively pushing prices higher, and might be indicating panic selling at lows by weaker hands. If elevated activity sustains while the price stabilizes, it could form a constructive base. However, a confirmation would require a clear break above key technical resistance levels.

Binance Free $600 (CryptoPotato Exclusive): Use this link to register a new account and receive $600 exclusive welcome offer on Binance (full details).
LIMITED OFFER for CryptoPotato readers at Bybit: Use this link to register and open a $500 FREE position on any coin!
Disclaimer: Information found on CryptoPotato is those of writers quoted. It does not represent the opinions of CryptoPotato on whether to buy, sell, or hold any investments. You are advised to conduct your own research before making any investment decisions. Use provided information at your own risk. See Disclaimer for more information.
Disagreements within a decentralized autonomous organization (DAO) are a sign of a healthy DAO, according to Dr. Michael Egorov, founder of the decentralized finance (DeFi) platform Curve Finance.
DAOs are a decentralized organizational structure that relies on smart contracts to automate functions and member voting to govern onchain protocols.
Egorov said that both a 2024 governance proposal involving the Curve DAO and the recent dispute involving the Aave DAO illustrate the importance of disagreements to the structure’s vitality. He told Cointelegraph:
“If everyone automatically agrees on something, it feels like people just don’t really care. They vote for whatever comes in, or they don’t participate at all. The first sign of that would be governance apathy, like when people are not voting at all.”
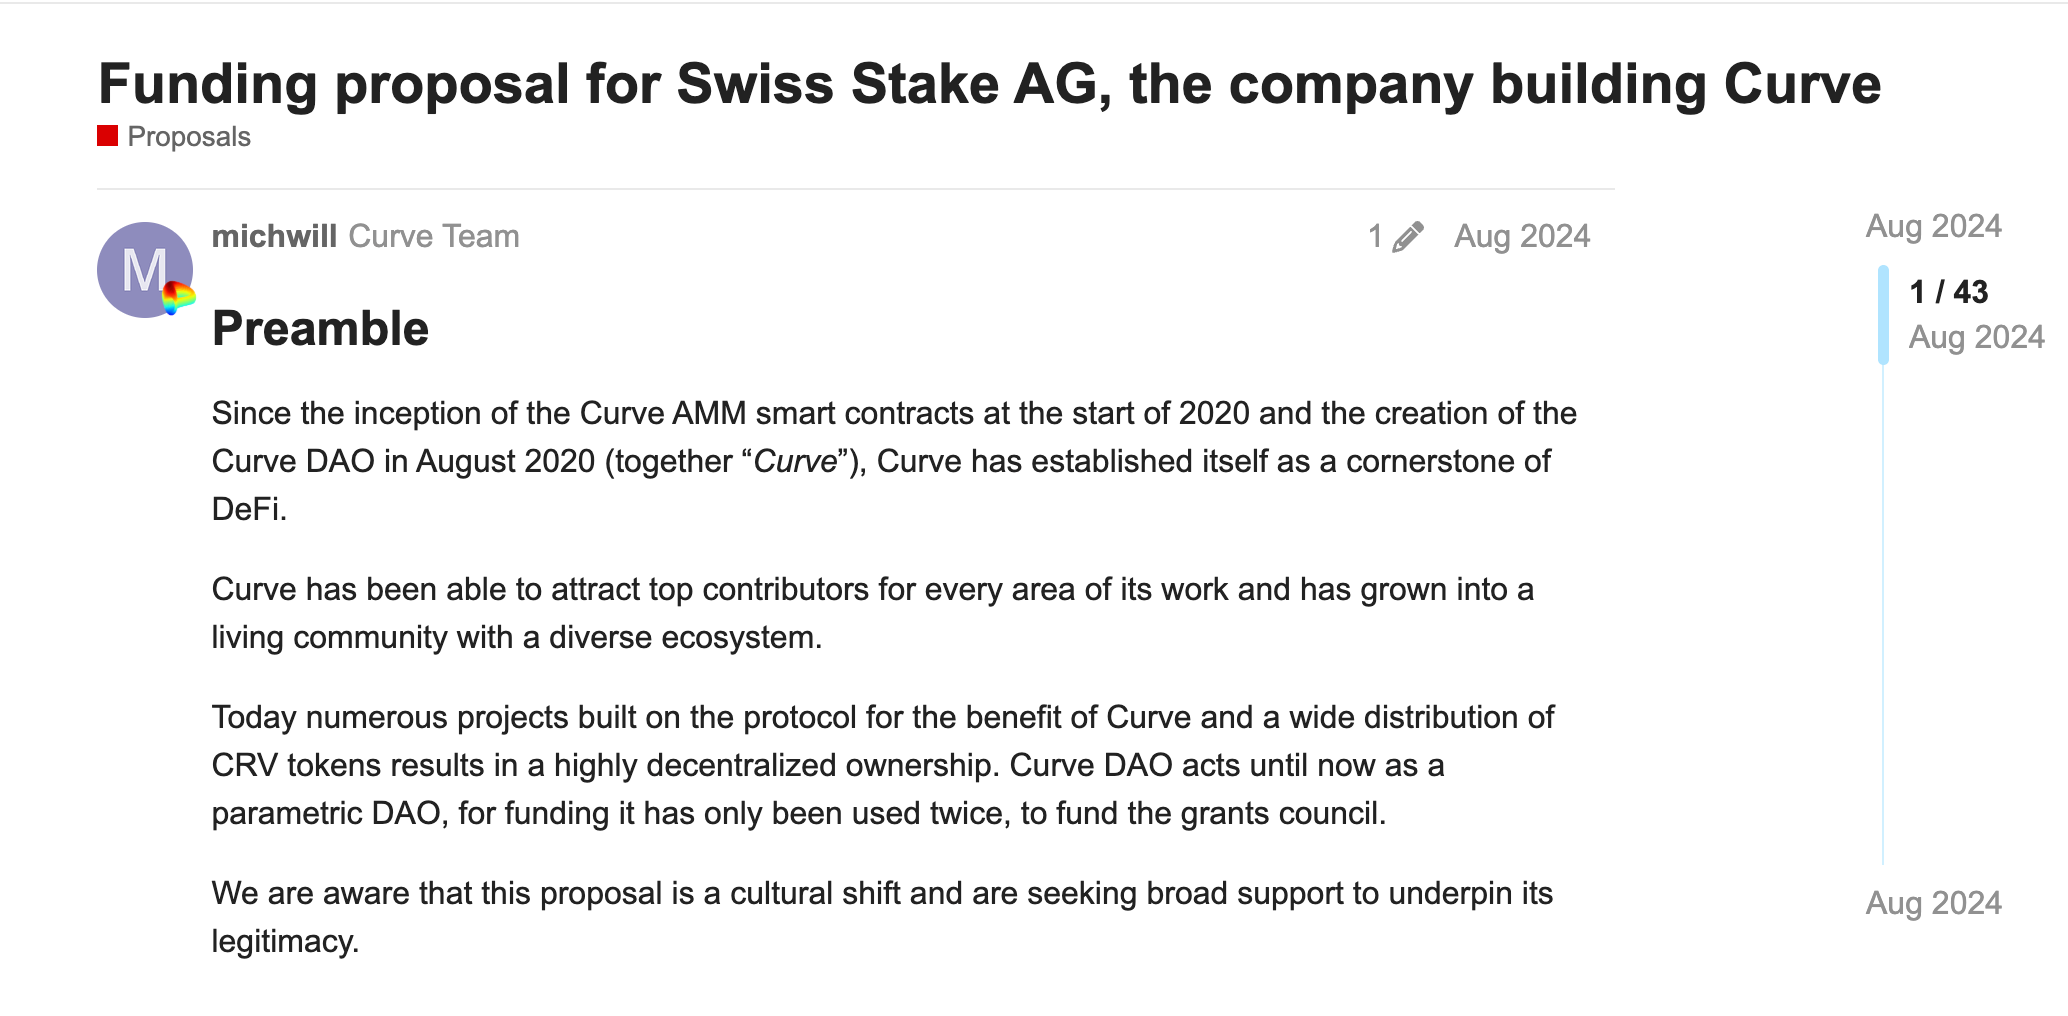
That earlier Curve DAO matter concerned a 2024 governance proposal to provide Swiss Stake AG, the main developer behind the Curve Finance protocol, with a grant valued at about $6.3 million at the time, which drew significant pushback from members of the Curve DAO.

Egorov noted that the proposal was revised and resubmitted in December 2025, and the redrafted proposal received over 80% turnout from DAO members.
An analysis last year by blockchain development company LamprosTech found that “Voter turnout in most DAOs rarely passes 15%, concentrating decision-making power in the hands of a small, active group.”
Curve token holders lock up their tokens for a long period, which encourages long-term governance engagement, Egorov said.
Egorov said that DAOs represent a new model for human organization that is distinct from a company or a self-sovereign country, but features elements of a sovereign country, including political parties voicing disagreement about how to govern a protocol.
Related: Core technical contributor to cease involvement with Aave DAO
Aave dispute highlights challenges in onchain governance and intellectual property rights
In December 2025, a governance dispute erupted between Aave Labs, the main development company of Aave products, and the Aave DAO over fees from the integration with DeFi exchange aggregator CoW Swap.

Members of the DAO were critical of the fees from the integration going directly to a wallet controlled by Aave Labs, and the pushback sparked a debate over which entity has rightful control over intellectual property on the DeFi platform.
A proposal was then submitted to the Aave DAO to bring Aave brand assets and intellectual property under the control of the DAO; it ultimately failed to pass.
Legal recognition of DAOs could mitigate governance disputes
DAOs cannot interact with the real world without regulated legal structures, like business entities or bank accounts, and DAO control over intellectual property is a common governance issue, Egorov said.
DAOs are a great fit for governing anything onchain, he said, adding that users should also experiment with DAOs for offchain elements as well, though centralized companies might be a better fit to manage offchain structures.
If DAOs could be legally recognized and interact with the traditional financial world, owning business entities and bank accounts, it could mitigate governance disputes, Egorov said, adding that the legal system has yet to catch up to the latest technology.
Magazine: Real AI use cases in crypto, No. 2: AIs can run DAOs
TLDR:
- Elon Musk is alleged to be collaborating with Ripple, though no official confirmation has been issued by either party.
- REAL Token is reportedly scheduled to list on BTCC Exchange on February 28th, pending verified disclosure from the platform.
- Price projections suggest a move from $0.045 to $690.70 if 0.01% of the $228 trillion global market enters the network.
- XRP Ledger daily transactions have surged 40%, approaching 2.5 million per day, reflecting measurable real-world network growth.
Elon Musk’s alleged connection to the XRP Ledger ecosystem has sparked fresh market interest across crypto communities.
Unverified reports claim that Ripple CEO Brad Garlinghouse confirmed a collaboration with Musk, tied to the upcoming REAL Token listing on BTCC Exchange.
The listing is reportedly scheduled for February 28th. However, neither Musk nor Garlinghouse has issued any public statement confirming these claims.
Market participants are being advised to approach the circulating reports with caution before making any financial decisions.
Musk’s Alleged Involvement Draws Attention to XRP Ledger Activity
Elon Musk’s name has long carried weight in cryptocurrency markets, often triggering sharp price and volume movements.
Reports linking him to the XRP Ledger through REAL Token have generated notable traction in online communities.
None of Musk’s companies, however, have released any announcements directly referencing REAL Token or related initiatives.
A post from CryptoGeekNews stated that Ripple CEO Brad Garlinghouse confirmed a close collaboration with Musk. The same post tied this alleged partnership to a global XRPL token listing scheduled for February 28th on BTCC Exchange.
The post itself acknowledged that claims connecting both parties require careful interpretation by market participants.
Crypto markets have historically responded strongly to narratives involving prominent public figures and major exchange listings.
As a result, short-term trading volumes can surge considerably even without verified fundamentals in place. Volatility in these situations tends to follow sentiment cycles rather than confirmed operational developments.
REAL Token Listing and XRP Ledger Liquidity Claims Remain Unverified
REAL Token is reportedly scheduled to debut on BTCC Exchange on February 28th, marking its entry onto a recognized international trading platform.
Liquidity flows are said to be increasingly converging through the XRP Ledger via REAL Token. This movement is reported to position the ecosystem for a potential supply squeeze, based on circulating market commentary.
Price projections tied to the listing suggest a possible move from $0.045 to $690.70 per token. These figures assume that just 0.01% of the $228 trillion global market enters the network. Ripple has not confirmed or validated any of these circulating valuation projections publicly.
BTCC Exchange has not published detailed listing conditions beyond general references found across online communities.
Token supply metrics, contract specifications, and distribution schedules also remain unclear at this time. Until official disclosures are made, market participants have limited verified information to assess the listing accurately.
XRP Ledger Network Growth Provides Backdrop for Rising Speculation
Daily successful transactions on the XRP Ledger have grown by approximately 40%, approaching 2.5 million per day.
This rise points to measurable real-world network usage growing within the XRP ecosystem. Despite this activity, XRP’s price remains below key moving averages, currently trading at $1.39.
The XRP Ledger continues to expand through payments, tokenization, and decentralized finance experimentation. Developments tied to rumored partnerships, including the alleged Musk connection, currently exist outside confirmed corporate announcements.
Official statements or exchange filings are expected to provide further clarity as the reported February 28th date approaches.
Regulatory frameworks are also playing a growing role in how institutions evaluate token listings and liquidity conditions.
Compliance standards increasingly require verified disclosures and transparent communication from projects seeking credibility. Until such disclosures emerge, the market is largely operating on sentiment rather than substantiated developments.

Judelow and Chuck Nasty Join Money SMP…

Specs, AI Upgrades, Price Rumors & Release Date
Boosie Opens Up About Health Scare Amid Louisiana AG Lawsuit


-

 Video6 days ago
Bitcoin: We’re Entering The Most Dangerous Phase
-

 Crypto World5 days ago
Can XRP Price Successfully Register a 33% Breakout Past $2?
-

 Video3 days ago
XRP News: XRP Just Entered a New Phase (Almost Nobody Noticed)
-

 Fashion2 days ago
Weekend Open Thread: Boden – Corporette.com
-

 Sports6 days ago
GB's semi-final hopes hang by thread after loss to Switzerland
-

 Politics14 hours ago
Baftas 2026: Awards Nominations, Presenters And Performers
-
 Tech6 days ago
The Music Industry Enters Its Less-Is-More Era
-

 Business5 days ago
Infosys Limited (INFY) Discusses Tech Transitions and the Unique Aspects of the AI Era Transcript
-

 Entertainment4 days ago
Kunal Nayyar’s Secret Acts Of Kindness Sparks Online Discussion
-

 Video5 days ago
Financial Statement Analysis | Complete Chapter Revision in 10 Minutes | Class 12 Board exam 2026
-

 Tech4 days ago
Retro Rover: LT6502 Laptop Packs 8-Bit Power On The Go
-
 Sports4 days ago
Clearing the boundary, crossing into history: J&K end 67-year wait, enter maiden Ranji Trophy final | Cricket News
-

 Business8 hours ago
Mattel’s American Girl brand turns 40, dolls enter a new era
-

 Business4 hours ago
Law enforcement kills armed man seeking to enter Trump’s Mar-a-Lago resort, officials say
-

 Entertainment4 days ago
Dolores Catania Blasts Rob Rausch For Turning On ‘Housewives’ On ‘Traitors’
-

 Business5 days ago
Tesla avoids California suspension after ending ‘autopilot’ marketing
-

 Politics6 days ago
Eurovision Announces UK Act For 2026 Song Contest
-

 Tech3 hours ago
Anthropic-Backed Group Enters NY-12 AI PAC Fight
-

 NewsBeat2 hours ago
Armed man killed after entering secure perimeter of Mar-a-Lago, Secret Service says
-

 Crypto World4 days ago
WLFI Crypto Surges Toward $0.12 as Whale Buys $2.75M Before Trump-Linked Forum