

Crypto World
3 Positive Signs for Bitcoin That Investors May Miss Due to Fear
The market remains gripped by extreme fear. Many Bitcoin investors focus only on short-term price fluctuations and fixate on negative factors. As a result, they overlook strong underlying fundamentals.
Although the price may be correcting, the following data reinforces the case for a recovery.
Lightning Network Growth Despite a Sharp Bitcoin Price Decline
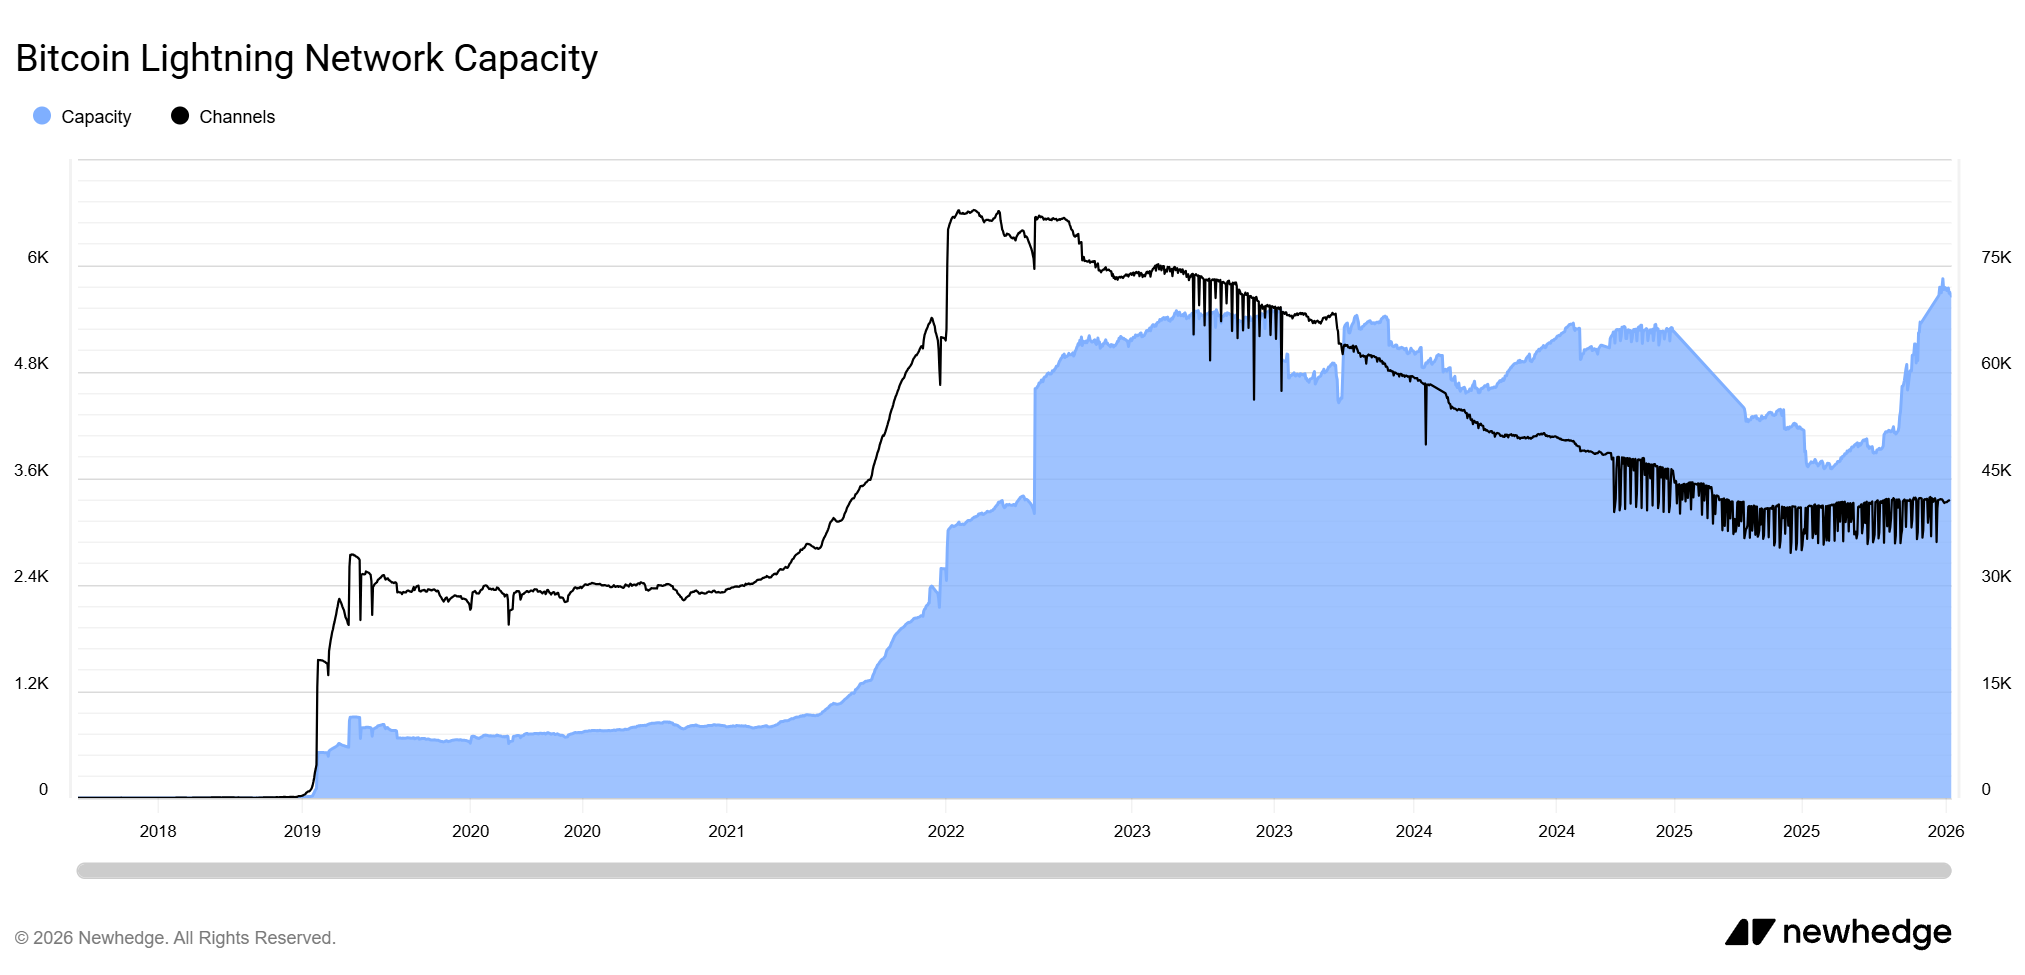
Bitcoin’s price has fallen sharply. However, its use as a payment network has reached an all-time high, as reflected in breakthrough data from the Lightning Network.
The Lightning Network is a Layer 2 protocol built on top of Bitcoin. It enables scalable, low-cost, and near-instant transactions, making it ideal for everyday payments.
Data from Newhedge shows that Bitcoin Lightning Network capacity rose to a record high of 5,800 BTC in December. It remained above 5,600 BTC in early 2026.

Capacity (blue) represents the total amount of Bitcoin locked in Lightning Network payment channels. For the Lightning Network to function, participants must commit BTC to channels in advance. This committed BTC forms the network’s capacity.
Therefore, capacity determines the total value that can be transacted through the Lightning Network at any given time. An increase signals improvements in scalability, reliability, and user adoption.
In addition, a recent report from River revealed that the Lightning Network surpassed $1 billion in monthly transaction volume for the first time. It processed 5.22 million transactions. This growth indicates that businesses and exchanges are using Lightning to move real funds.
“While everyone is focused on Bitcoin dropping to $63K, something happened last week that nobody talked about. The Lightning Network crossed $1 billion in monthly transaction volume for the first time ever… Businesses are using it,” said Fernando Nikolić, a developer at Perception.
Sam Wouters, Director of Marketing at River, explained that most transactions involve transfers between exchanges, often with large amounts. He predicted that in the future, the emergence of AI agents could reduce the average transaction size when executing many small transactions.
Hashrate Recovery Reflects Renewed Miner Confidence
Second, Bitcoin’s hashrate—an important metric that measures the network’s total computational power—has recovered to levels equivalent to September last year, when BTC traded above $100,000.
The strong V-shaped recovery in February shows that miners have returned with renewed confidence. It also strengthens the network’s security and resilience.
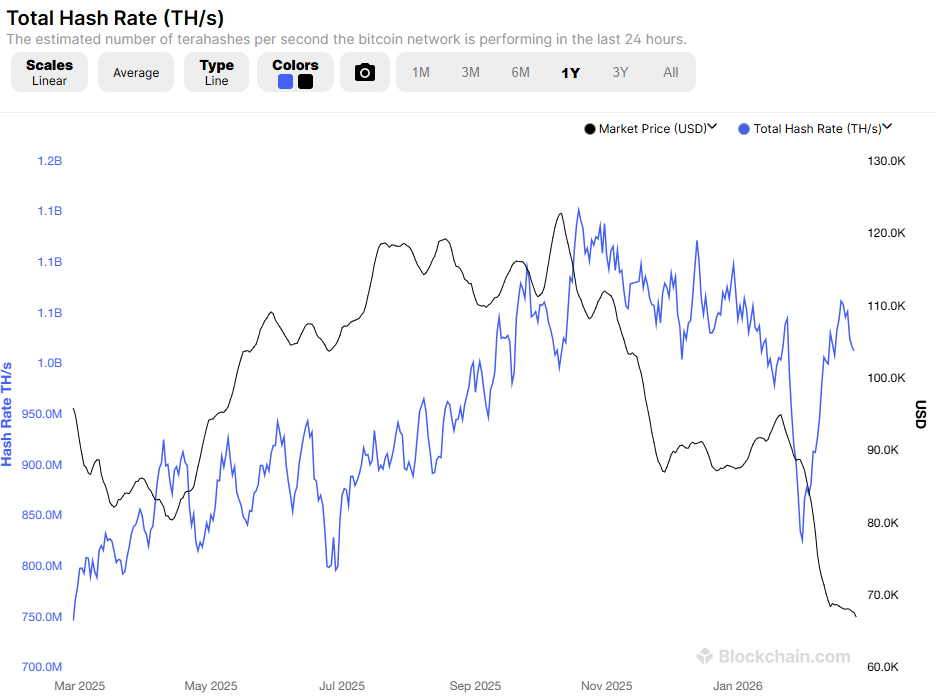
Miners appear to have moved past extreme negative sentiment. They have restarted operations after severe weather disruptions earlier in the year.
Historically, hashrate tends to rise alongside Bitcoin’s price. This pattern often signals a potential recovery in BTC.
The Sign of Strengthening Demand From US Investors
Third, the Coinbase Premium Index turned positive again in the final week of the month after remaining negative for a full month.
The Coinbase Premium Index measures the price difference between Bitcoin on Coinbase and on Binance. A return to positive territory reflects that US investors are willing to buy BTC at higher prices.
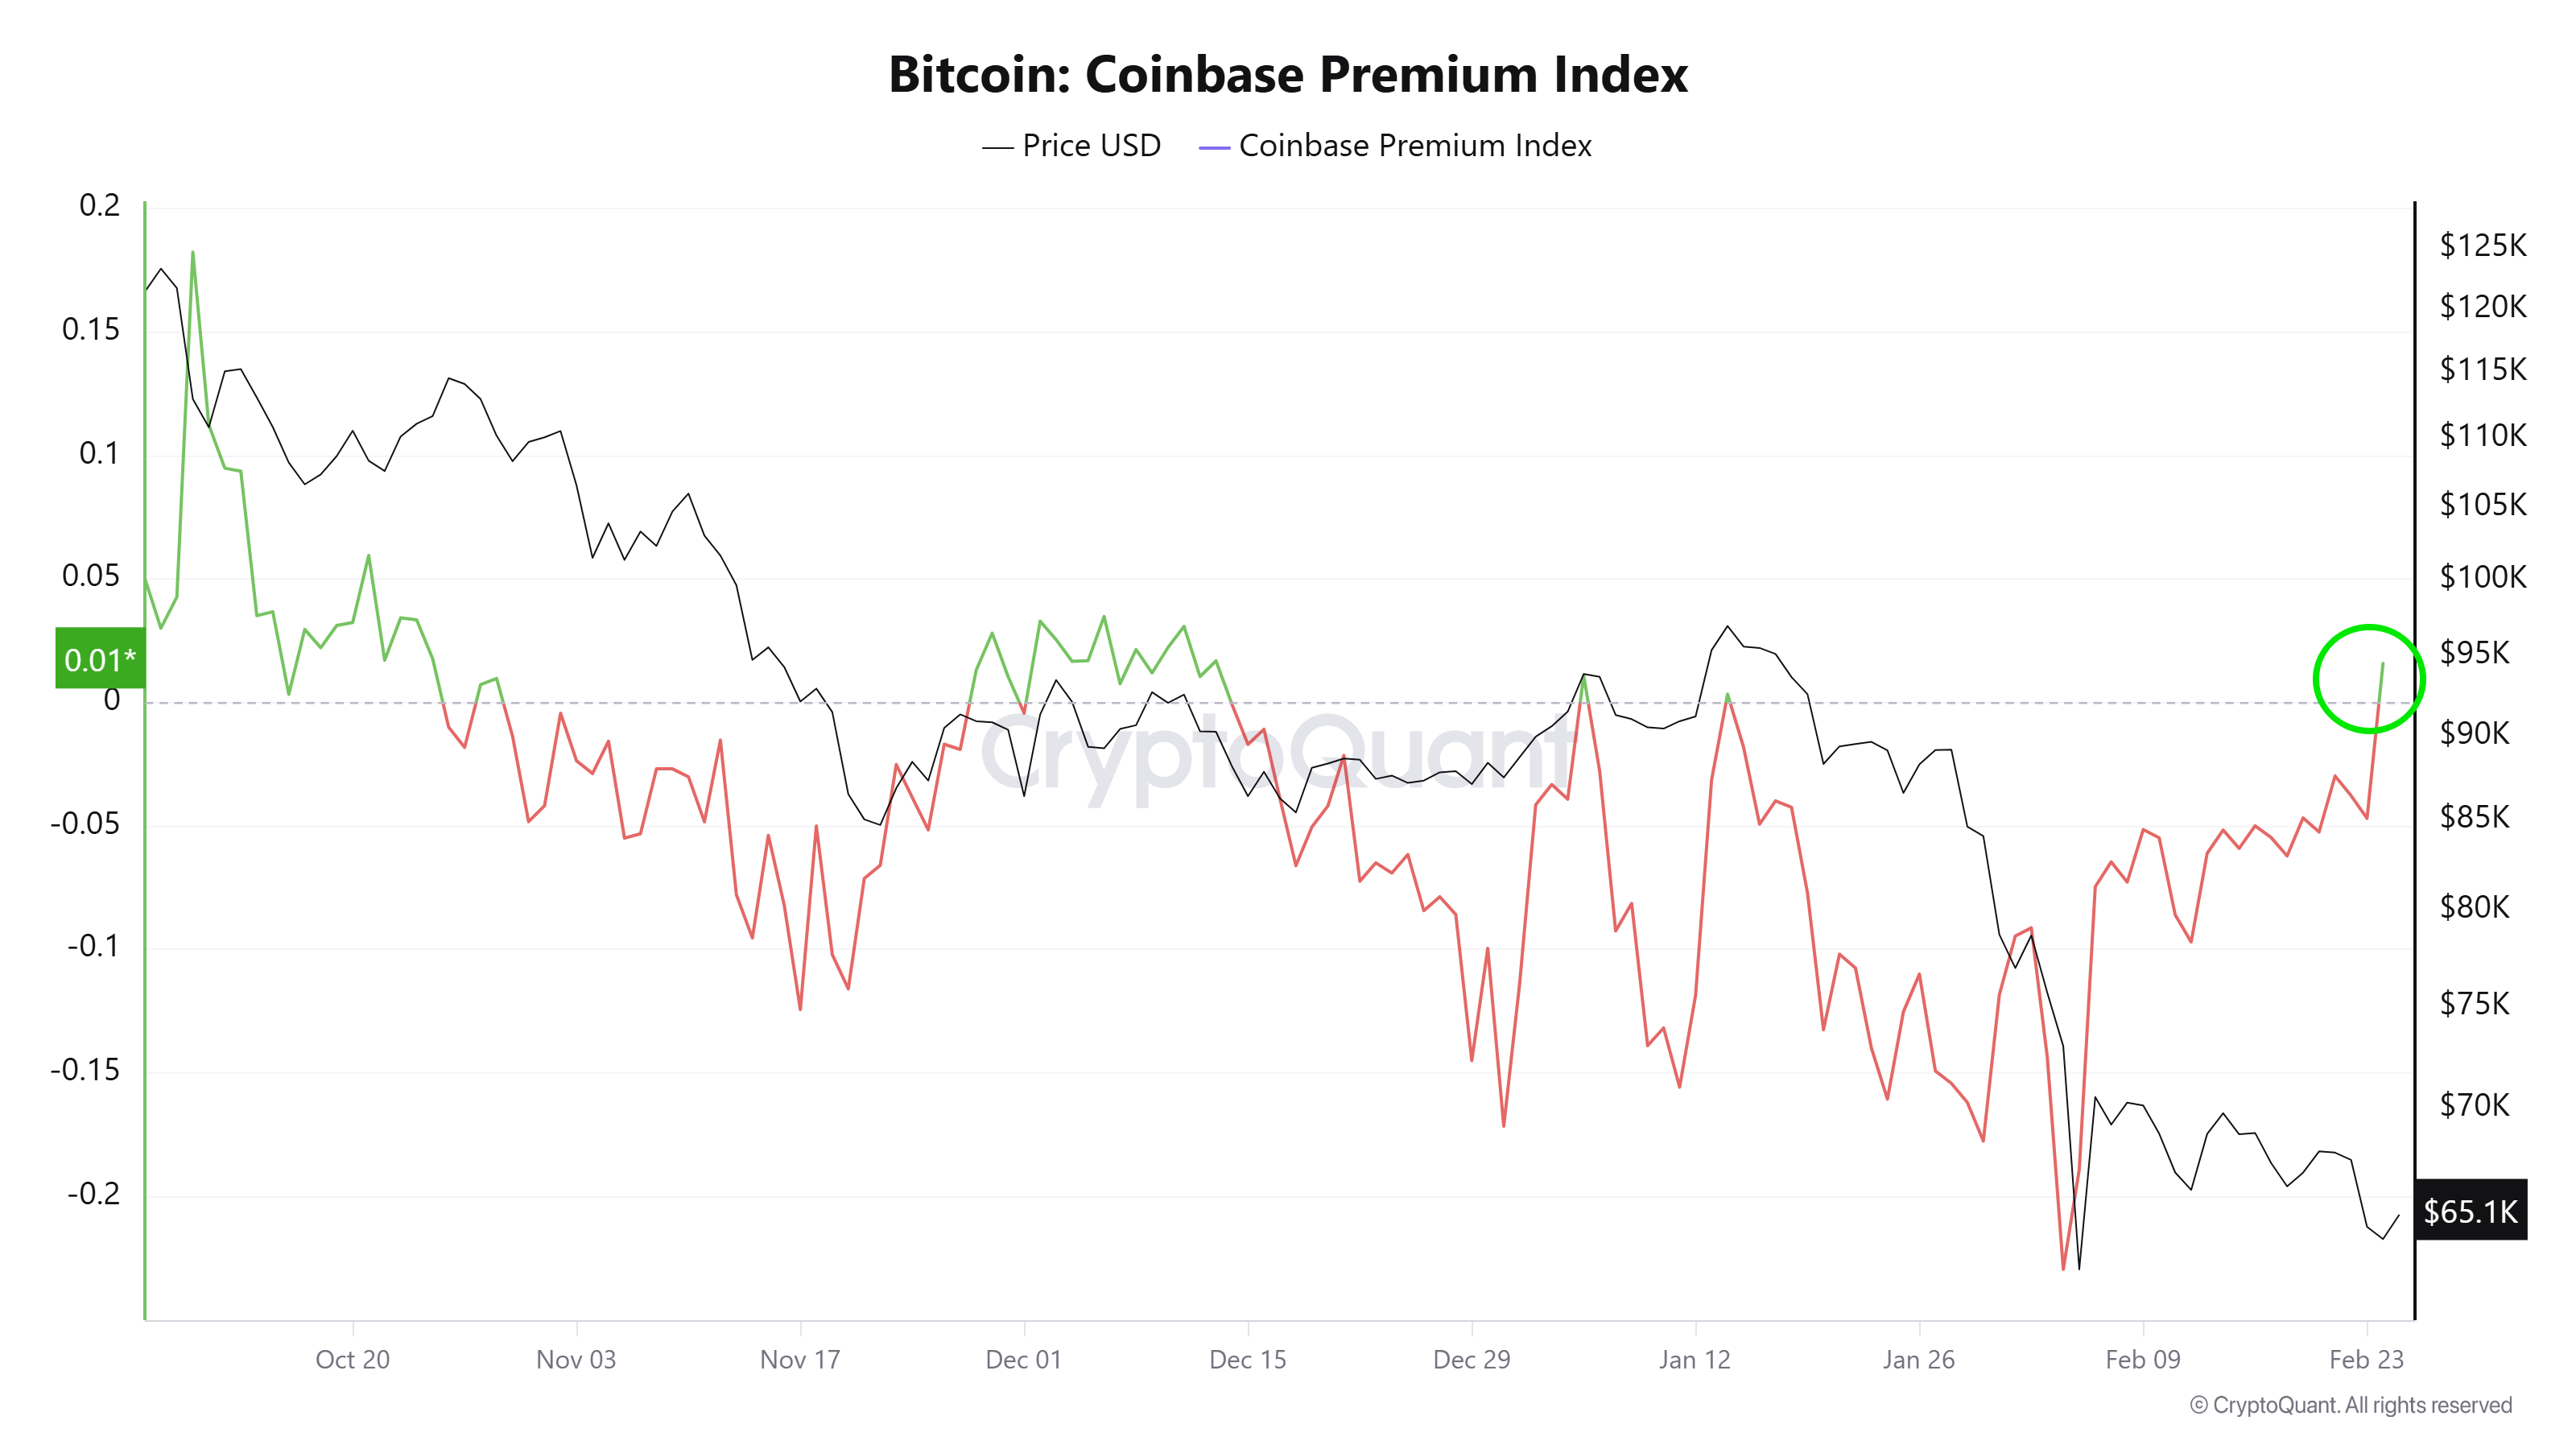
“This return to positive territory suggests a gradual improvement in demand from professional and institutional participants, particularly those based in the United States. This signal remains tentative and reflects ongoing investor caution. However, current price levels appear to be gradually becoming attractive again for professional participants,” commented Darkfost, an analyst at CryptoQuant.
These positive signals may appear faint amid prevailing pessimism. However, they could act as catalysts for a recovery.
Recent analysis from BeInCrypto emphasized that a breakout above the $67,394 resistance level would improve the negative short-term price structure. Such a move would lay the foundation for further upside.

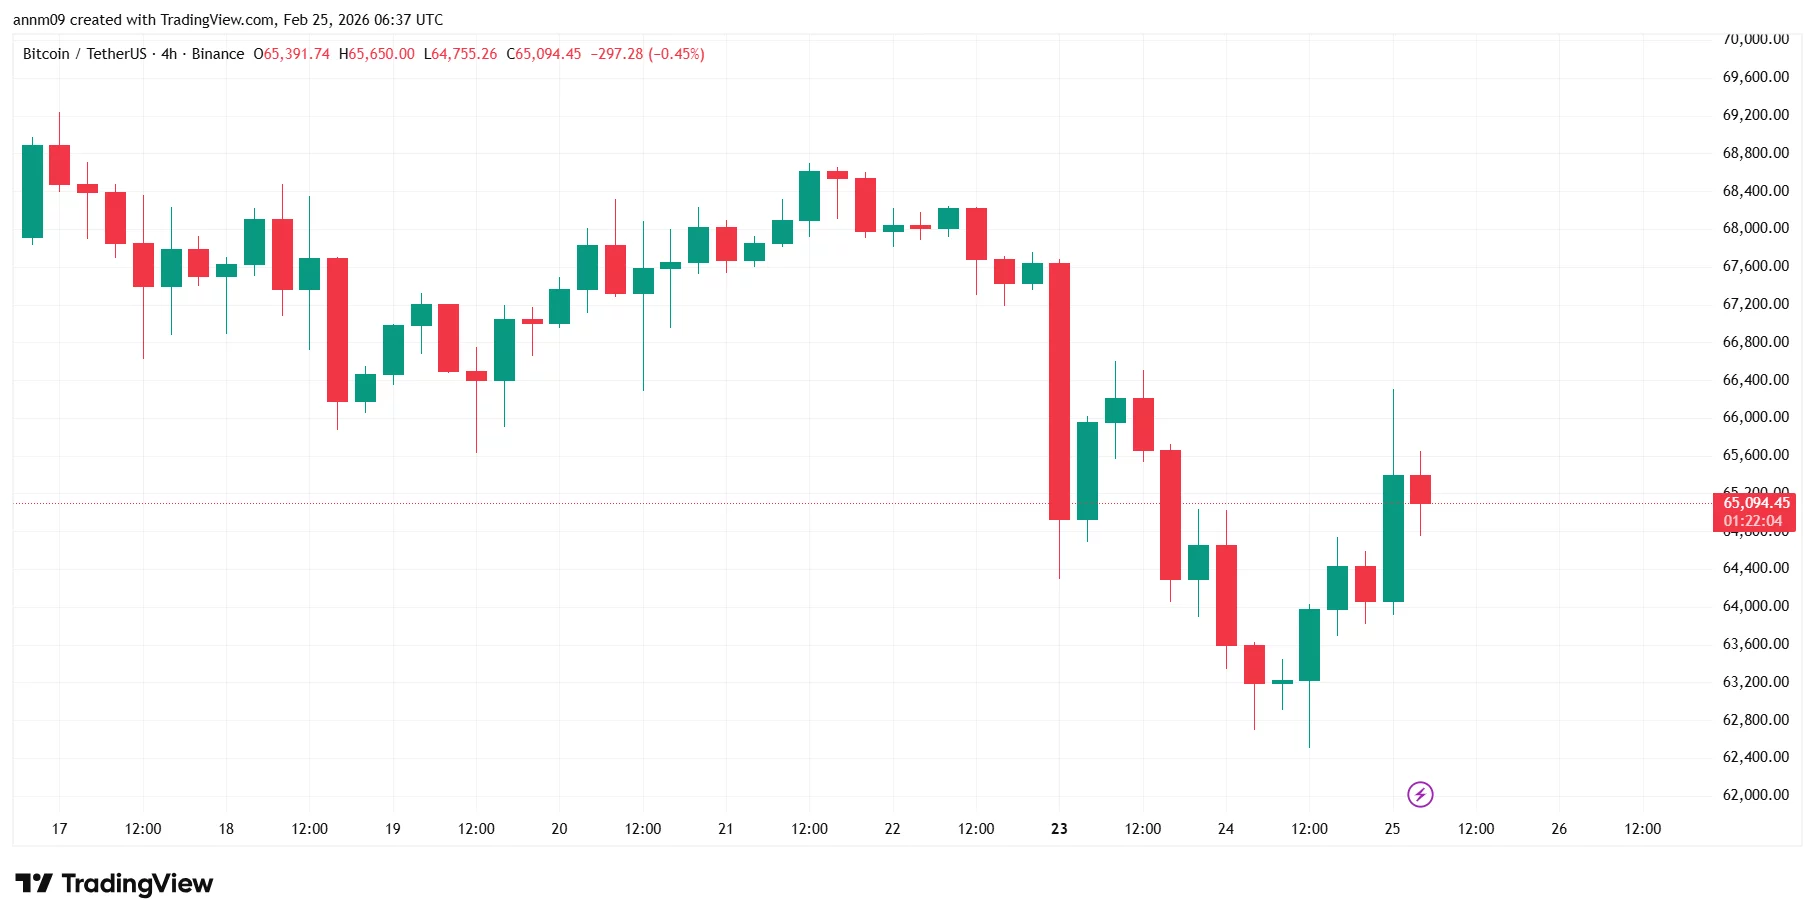
XRP price is back in focus as Bitcoin stages a sharp 24-hour rebound, reclaiming the $65,000 level after dipping to roughly $62,800 earlier this week.
Summary
- Bitcoin has rebounded to $65,000 after defending the $62,800 support zone, shifting short-term momentum back to buyers.
- XRP is consolidating near $1.36, with resistance at $1.45 and $1.60, while $2 remains a distant macro target.
- The XRP/BTC pair remains in a broader downtrend, suggesting XRP is still underperforming Bitcoin despite improving momentum indicators.
Can XRP price follow Bitcoin’s $65K rebound?
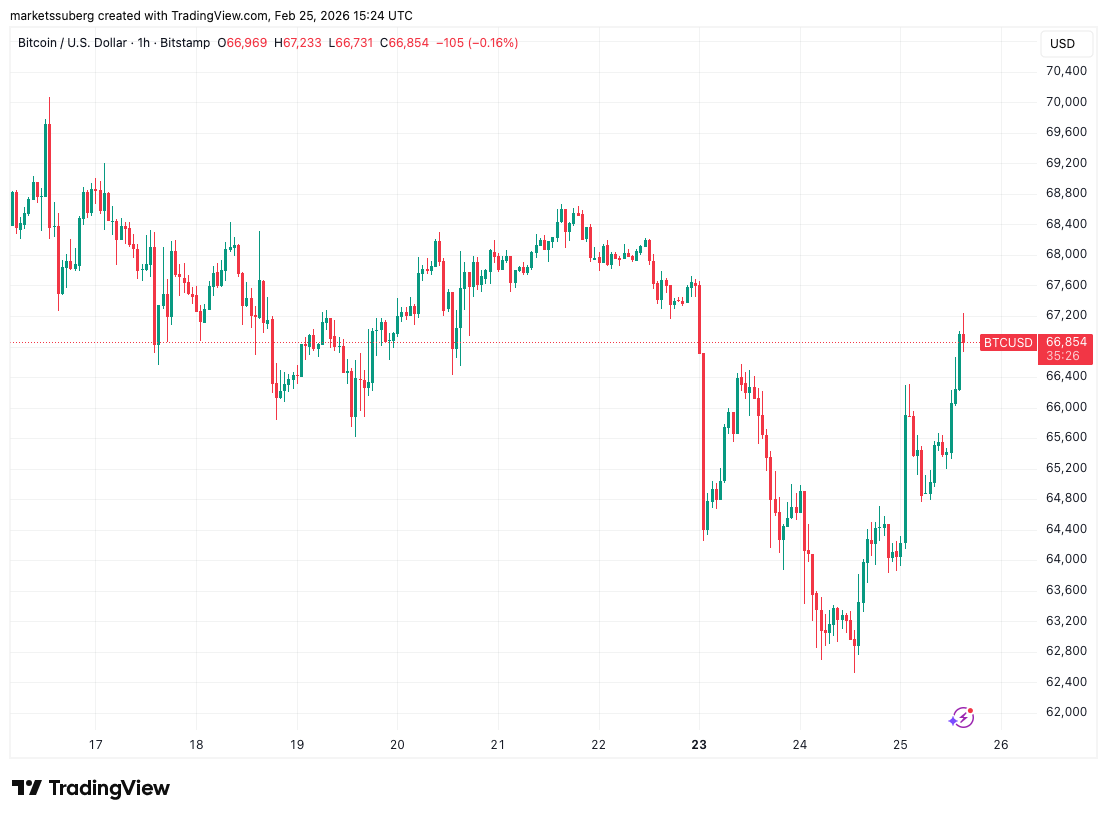
The Bitcoin (BTC) price chart shows a strong impulsive bounce, with BTC climbing back above short-term consolidation levels and attempting to stabilize after the heavy sell-off on Feb. 23–24.
The recovery suggests buyers are defending the mid-$62K region, turning it into near-term support, while $66,000–$67,000 now stands as immediate resistance.

Against this backdrop, the Ripple token (XRP) is trading near $1.36 on the daily chart, consolidating after a prolonged downtrend from above $2.20 in January. Price action shows XRP holding above the $1.30 support zone, with stronger structural support sitting near $1.20, the level that triggered the early-February bounce.
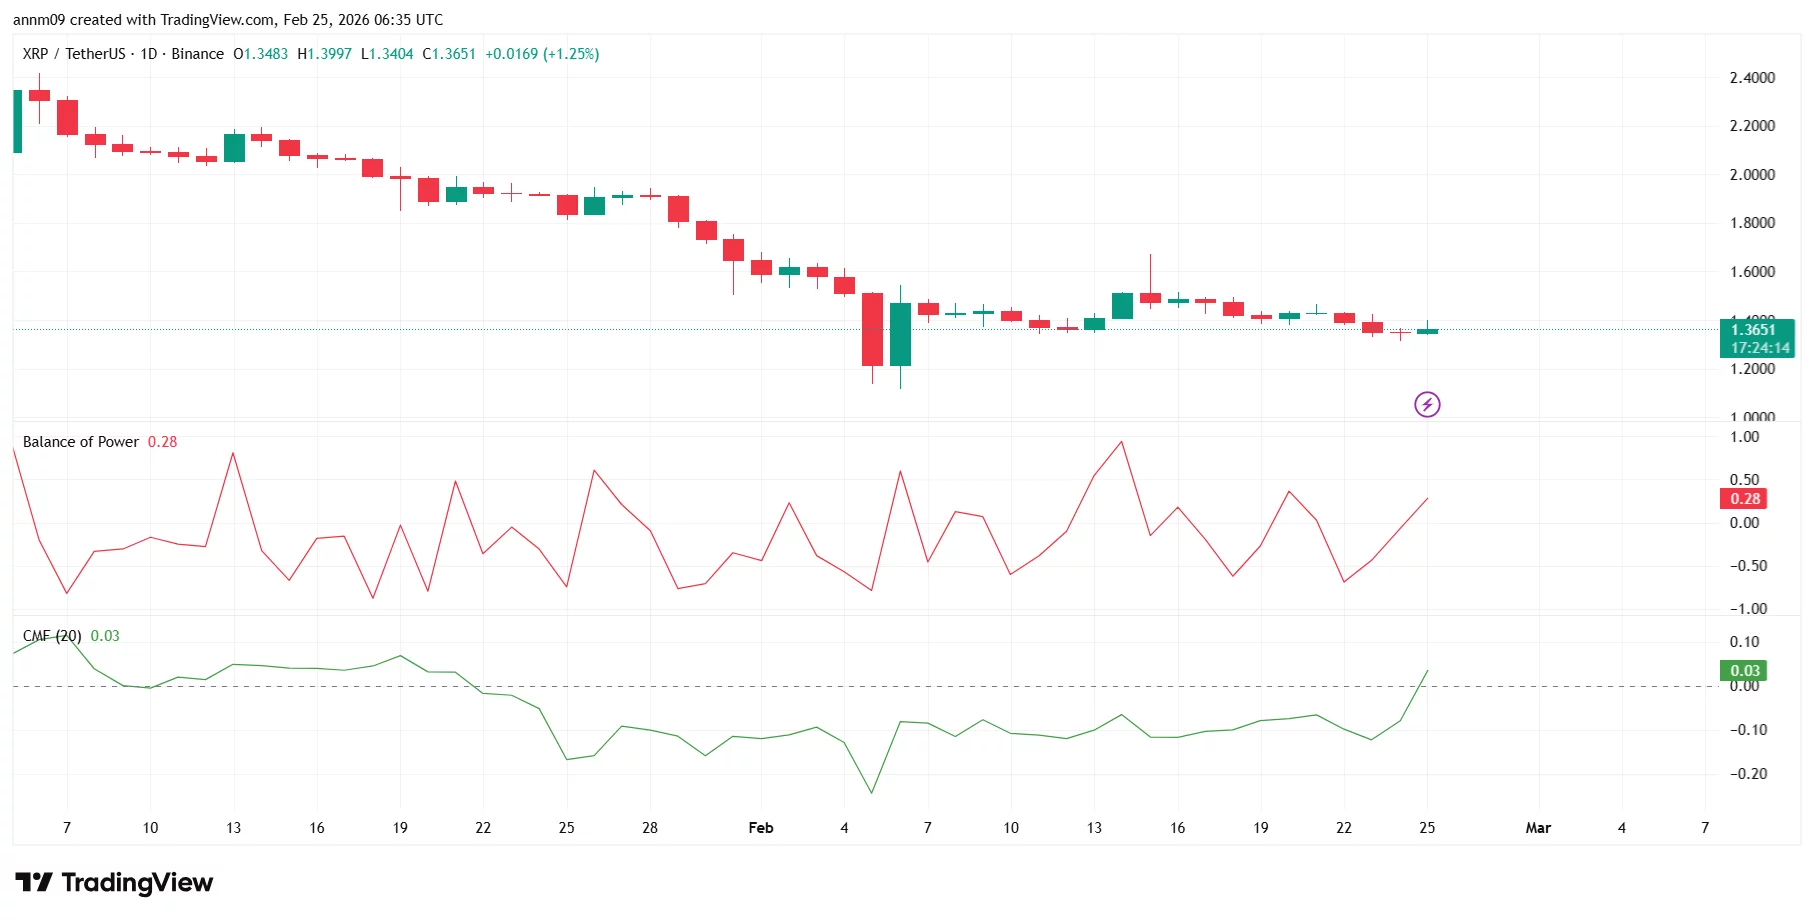
On the upside, XRP faces layered resistance at $1.45 and $1.60. A break above $1.60 would open the path toward $1.80, but bulls would still need a sustained breakout above that level before $2.00 comes into focus. At present, the $2 mark remains a distant macro resistance rather than an immediate target.
Indicators show tentative improvement. Balance of Power has flipped positive at 0.28, suggesting buyers are regaining short-term control, while the Chaikin Money Flow (CMF) has turned slightly positive at 0.03 — signaling mild capital inflows.
However, neither indicator reflects strong bullish momentum yet.
Meanwhile, the XRP/BTC pair remains in a broader downtrend, hovering around 0.0000209 BTC, indicating XRP is still underperforming Bitcoin. For a credible move toward $2, XRP would likely need not just Bitcoin stability above $65K, but also renewed relative strength against BTC.
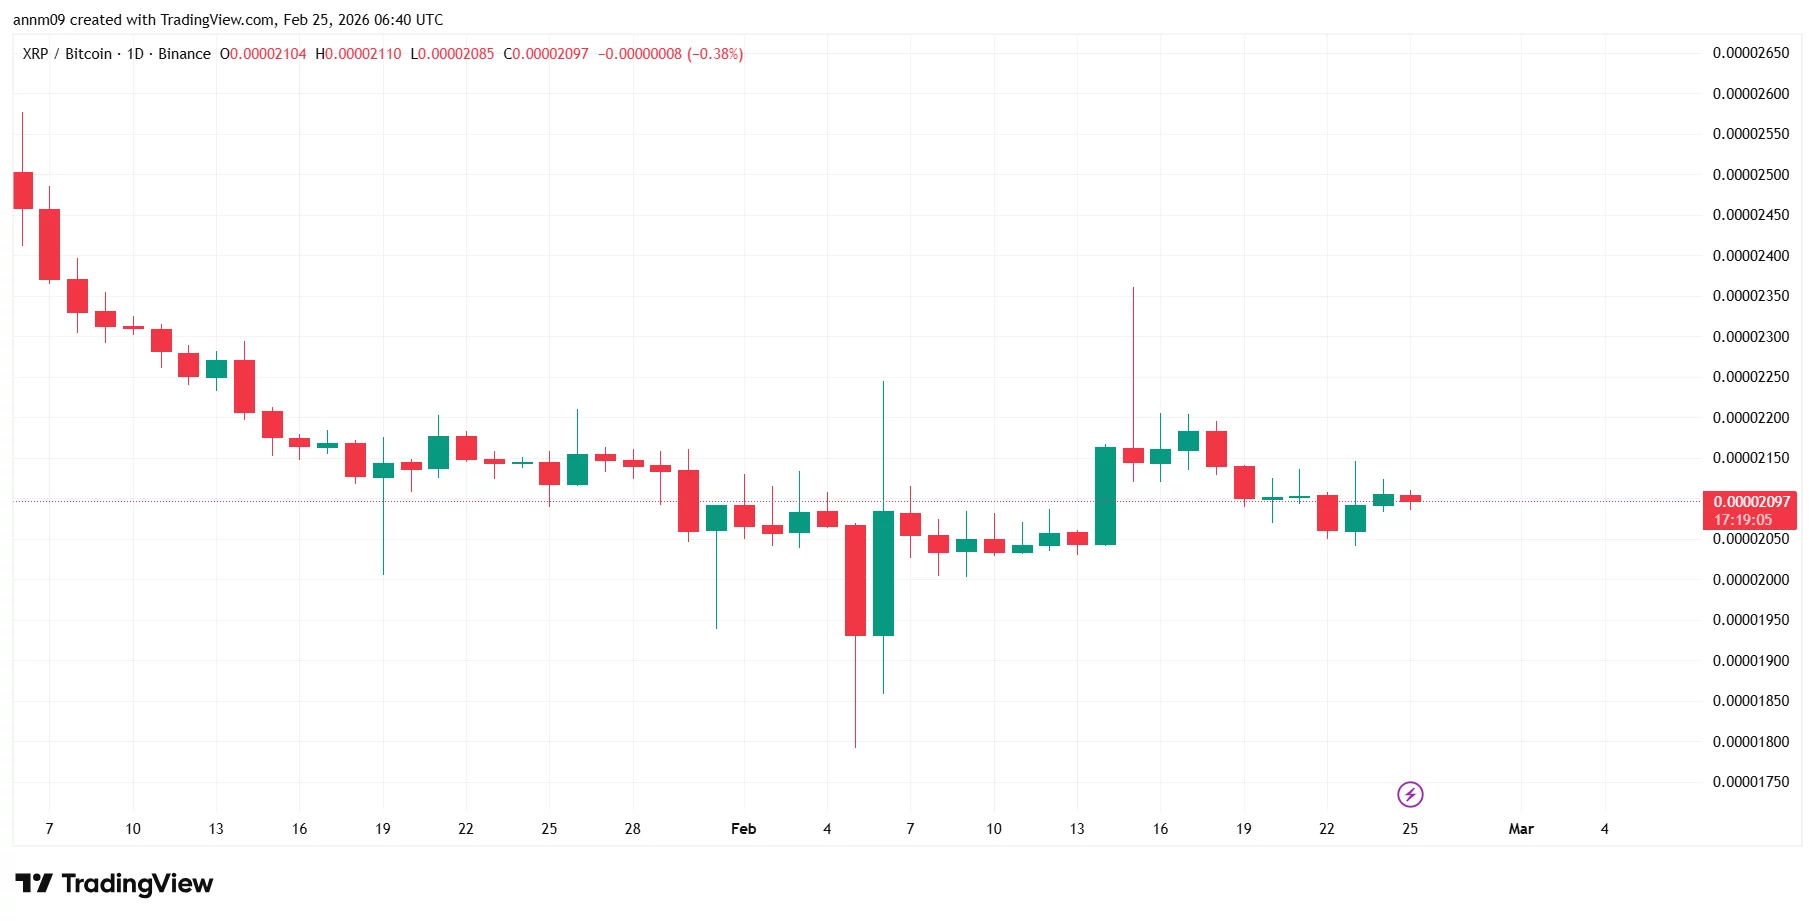
For now, XRP’s outlook improves if $1.30 holds, but a decisive breakout above $1.60 is the real trigger bulls must clear before $2 enters the conversation. At current momentum, a move to $2 would likely require a broader market breakout led by Bitcoin clearing $67K.
Bitcoin began an assault below the 200-week exponential moving average in fresh signs of upward BTC price momentum at the start of the US session.
Bitcoin (BTC) hit $67,000 at Wednesday’s Wall Street open as bulls shook off fresh US tariff pledges.
Key points:
-
Bitcoin enjoys a sustained rebound as BTC price action rises above $67,000.
-
A key long-term trend line now comes back into view, with the weekly close in focus.
-
Gold analysis reveals a developing RSI divergence with Bitcoin.
BTC price sets up rematch with 200-week trend
Data from TradingView showed daily BTC price gains hitting 4.5% as a local rebound continued.

Bitcoin appeared unfazed by an announcement from U.S. Trade Representative Jamieson Greer over 15% tariffs, which may become reality “within the coming days.”
“So right now, as we talked about, 10% is in place. There will be a proclamation raising it to 15% where appropriate,” he told Bloomberg.
Tariff headlines often spark volatility in crypto markets, with their impact nonetheless cooling in recent months.
Already enjoying respite from sustained selling pressure, BTC/USD thus approached a key long-term level in the form of the 200-week exponential moving average (EMA).
As Cointelegraph reported, BTC price losing the level as support has become a classic bear market signal.
Commenting, trader and analyst Rekt Capital repeated analysis from earlier in February, suggesting that the upcoming weekly close should be above the 200-week EMA, now at $68,330.

Trader Castillo Trading also eyed weekly time frames, with a potential upside target near $74,500 — Bitcoin’s 2025 yearly lows.
Still watching the same Weekly structure on $BTC.
Nice start on the bounce, and if this continues to hold as a support level a good re-test and potential short could be that 2025 Yearly Lows level around $74,492.#Bitcoin https://t.co/olaw6RO9Kr pic.twitter.com/NYHWSu8d5q— Castillo Trading (@CastilloTrading) February 25, 2026
Bitcoin teases RSI bullish divergence versus gold
As gold ranged above the $5,000 per ounce mark, meanwhile, crypto trader, analyst and entrepreneur Michaël van de Poppe saw reason for Bitcoin bulls to stay optimistic.
Related: Bitcoin ETF sell-off is ‘purification’ of bull case, investor says
“Interesting enough; There’s a strong bullish divergence on the daily chart of $BTC vs. Gold,” he told X followers on the day, referring to the relative strength index (RSI).
“It’s not confirmed, but given the recent strength (today and yesterday) in Bitcoin, I think a slight rotation is starting. It’s about time.”

Such a turnaround in capital flows would upend market opinions from earlier in the year.
As Cointelegraph reported, analysis even concluded that Bitcoin had lost its quest to be “digital gold” with its comedown from October 2025 all-time highs.
This article does not contain investment advice or recommendations. Every investment and trading move involves risk, and readers should conduct their own research when making a decision. While we strive to provide accurate and timely information, Cointelegraph does not guarantee the accuracy, completeness, or reliability of any information in this article. This article may contain forward-looking statements that are subject to risks and uncertainties. Cointelegraph will not be liable for any loss or damage arising from your reliance on this information.
Stablecoin issuer Circle Internet Group reported stronger-than-expected fourth-quarter earnings on Wednesday, driven by rapid growth in its USDC stablecoin business and expanding payments operations, underscoring continued momentum in an otherwise challenging crypto market.
For the quarter ending Dec. 31, 2025, Circle posted revenue of $770 million, a 77% increase from a year earlier, and reported net income of $133.4 million, or 43 cents per share. Analysts expected per-share earnings of 16 cents on revenue of $747 million.
The strong quarter was fueled in part by a 72% year-on-year increase in the circulation of Circle’s US dollar-pegged stablecoin, USDC (USDC), which reached about $75.3 billion by year-end.
For the full year 2025, Circle reported revenue of $2.7 billion, up 64% from the prior year. The company recorded a net loss of $70 million for the year, largely due to $424 million in stock-based compensation tied to its 2025 initial public offering (IPO).
Despite the annual loss, operating income was positive at about $157 million, reflecting solid underlying performance.
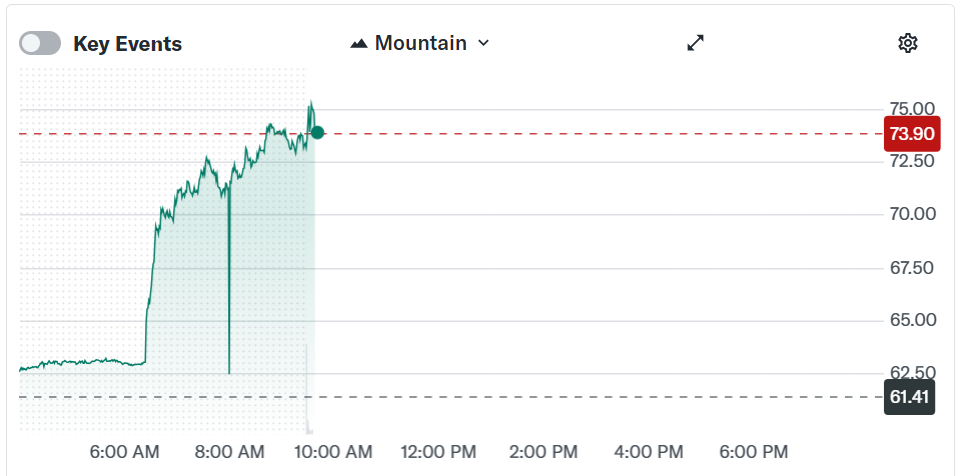
Circle’s shares surged on the news, rising more than 20% in early trading Wednesday morning, to nearly $74.

Related: Better, Framework Ventures reach $500M stablecoin mortgage financing deal
Arc rollout and policy tailwinds bolster Circle’s expansion
Circle highlighted several operational milestones during the quarter, including the public testnet launch of Arc, its new blockchain infrastructure platform designed to help institutions build tokenized financial applications. More than 100 institutional participants have joined the testnet, the company said.
The Circle Payments Network, a cross-border payments coordination layer enabling banks to settle transactions using stablecoins, expanded to 55 financial institutions, with additional companies undergoing eligibility review and onboarding.
While Circle is best known for issuing USDC, the world’s second-largest stablecoin by market capitalization, its euro-denominated stablecoin, EURC, also posted strong growth. EURC circulation reached 310 million euros ($365 million), up 284% year over year.

Circle has also benefited from a more favorable regulatory backdrop in the United States under President Donald Trump’s administration, including the passage of the GENIUS Act, which establishes a federal framework for payment stablecoins and issuer oversight.
However, broader industry momentum has faced hurdles. As The Wall Street Journal reported, progress on a separate market structure bill known as the CLARITY Act has stalled amid ongoing tensions between crypto industry advocates and banking groups over issues including stablecoin yield and reward mechanisms.
Related: Bank lobby is ‘panicking’ about yield-bearing stablecoins — NYU professor


DeFi cryptocurrency Mutuum Finance has launched its V1 protocol on the Sepolia testnet, introducing the core mechanics of its lending and borrowing system. The team also stated that an additional feature is scheduled to be rolled out next week as development continues.
Mutuum Finance Protocol Upgrade
In a recent statement published on X, the team confirmed that it is working on several upcoming features while refining key components of the codebase, including optimizations to the Stability Factor. According to the update, a new protocol feature is expected to be released in the coming week.
The project has reported more than $20.6 million raised to date, with over 19,000 holders of its MUTM token, currently priced at $0.04. In the same update, the team noted that the Sepolia testnet version of its lending and borrowing protocol has surpassed $90 million in testnet total value locked (TVL), reflecting simulated liquidity activity during beta testing.
Lending and Borrowing with Mutuum Finance
In the current beta version, users can interact with the protocol’s core functionality. The interface displays a protocol overview including total liquidity, available liquidity, and total variable debt. Four assets are currently supported for minting and interaction on testnet: ETH, USDT, LINK, and WBTC. The portfolio section provides data on net worth, net APY, Stability Factor, and total supplied and borrowed balances, with mtTokens also integrated into the current version of the platform.
When users supply assets to the platform, they receive corresponding mtTokens as proof of deposit. For example, supplying WBTC results in the issuance of mtWBTC. These tokens accrue value over time based on the applicable APY, which is determined by pool utilization.
By depositing $10,000 worth of USDT into the protocol, users receive mtUSDT in return. If the average annual percentage yield (APY) is around 4–5% over a one-year period, the position could generate approximately $400 to $500 in passive income, depending on pool utilization and borrowing demand. In addition, users can stake their mtTokens within the safety module, where eligible participants receive dividends denominated in MUTM tokens.
On the borrowing side, collateral is required to secure loans and protect the protocol against default risk. Rather than selling assets, users can post them as collateral and borrow against their value. For example, an investor holding $1,000 worth of ETH who does not wish to liquidate the position can deposit that ETH as collateral and borrow USDT. The borrowed stablecoins can then be used for expenses or deployed into other investments, while the user retains exposure to potential upside in ETH. Once the borrowed amount and accrued interest are repaid, the full collateral can be withdrawn.
Audited Protocol
Mutuum Finance has undergone a security audit of its lending and borrowing protocol conducted by Halborn, a blockchain security firm that has also performed audits for major projects such as Solana. In addition, the MUTM token smart contract was reviewed by CertiK, receiving a Token Scan score of 90 out of 100.
In partnership with CertiK, Mutuum Finance has established a bug bounty program with a reward pool of up to $50,000, aimed at identifying potential vulnerabilities and strengthening protocol security.
The total supply of MUTM is capped at 4 billion tokens. A portion of this allocation is designated for incentives, including giveaways, leaderboard bonuses, and other community reward programs.
Mutuum Finance continues to advance development of its lending and borrowing protocol as testing progresses on the Sepolia network. With additional features scheduled for rollout and security reviews completed, the project remains focused on refining its infrastructure ahead of full deployment.


The U.S. Department of the Treasury has sanctioned a Russia-based cyber “exploit broker” and its affiliates in a high-profile national security action targeting the theft and sale of proprietary U.S. government cyber tools, officials announced Tuesday.
Summary
- The U.S. Treasury sanctioned Russian exploit broker Operation Zero and associates for trafficking stolen U.S. cyber tools, using the Protecting American Intellectual Property Act.
- The action adds individuals and entities to the SDN list, blocking their U.S. assets and barring U.S. persons from dealings with them.
- The sanctions coincide with a DOJ and FBI investigation into a former defense contractor employee who sold proprietary cyber tools for cryptocurrency
Operation Zero blacklisted by U.S.
The designation marks the first use of the Protecting American Intellectual Property Act (PAIPA) in a sanctions case aimed at combatting digital trade-secret theft.
The Treasury’s Office of Foreign Assets Control (OFAC) placed Russian national Sergey Sergeyevich Zelenyuk and his St. Petersburg-based company Matrix LLC, also known as Operation Zero, on the Specially Designated Nationals (SDN) list, along with five associated individuals and entities.
The sanctions target the acquisition and redistribution of “exploits,” specialized computer code that can be used to take advantage of vulnerabilities in widely used software.
According to the Treasury, at least eight U.S. government cyber tools developed for defense and intelligence use were stolen from a U.S. company and allegedly sold by Operation Zero to unauthorized actors.
In its announcement, the Treasury said that Zelenyuk and his network offered substantial bounties to obtain exploits and then monetized the tech with buyers in Russia and elsewhere. Federal officials have expressed concern that such tools could be used for criminal activity or espionage, including ransomware and other destabilizing cyber operations.
The sanctions also encompass individuals linked to the group’s operations, including an affiliate company based in the United Arab Emirates and suspected members of the Trickbot cybercrime gang, previously sanctioned in other actions.
Under U.S. sanctions law, the property and interests of SDN-designated persons within U.S. jurisdiction are blocked, and U.S. persons are generally prohibited from engaging in transactions with them.
The action works in tandem with an ongoing criminal investigation by the Department of Justice and FBI into a former U.S. defense contractor employee who pleaded guilty last year to stealing the cyber tools and selling them for cryptocurrency.
Treasury officials said the sanctions aim to deter future theft of American intellectual property that could threaten national security, underscoring Washington’s broader strategy to hold foreign cyber actors accountable through economic and financial tools.

A regulatory spotlight has intensified around prediction markets after Kalshi, a Commodity Futures Trading Commission-regulated platform, banned a high-profile political candidate for trading on his own candidacy. The case underscores how even modest bets on real-world outcomes can trigger fast discipline when they intersect with insider-trading rules, and it comes as lawmakers and agencies sharpen their focus on the speculative-use cases that have quietly grown alongside the crypto ecosystem.
Key takeaways
- Kalshi issued a five-year ban plus a $2,000 penalty after a former California gubernatorial candidate wagered on his own bid and publicized the action on social media, violating platform rules.
- The politician’s actions align with reports that the description matches Kyle Langford, who has shifted from a Republican to a Democrat run for California’s 26th Congressional District; Kalshi noted he is no longer seeking the governorship and is pursuing Congress instead.
- In a May 25, 2025 X post, Langford showed a Kalshi bet of $98.76 on the odds of his victory, a detail Kalshi disclosed as part of the enforcement case and the public record surrounding the incident.
- Separately, a YouTube editor—widely reported as Artem Kaptur of MrBeast notoriety—tolerated a roughly $4,000 accumulation on YouTube stream markets between August and September 2025, resulting in a two-year penalty and about $20,000 in fines for insider-trading violations.
- Kalshi has signaled a broader crackdown, stating it has investigated around 200 cases, frozen several flagged accounts, and now operates with a surveillance audit committee and a partnership with Solidus Labs to detect market abuse as prediction markets scale.
Market context: Kalshi’s enforcement actions occur as prediction markets move toward greater mainstream participation and face intensified regulatory scrutiny. The company has pointed to internal surveillance capabilities and industry collaboration to curb abuse, while lawmakers have floated bills to curb insider trading among government insiders on these venues. The evolving framework aims to balance innovation with investor protection in markets that resemble, in some respects, both traditional trading and decentralized crypto ecosystems.
Why it matters
For traders and ordinary users, the Kalshi cases emphasize a core truth of prediction markets: information asymmetry and improper access carry legal risk. When a participant leverages privileged information—whether real-time, non-public data or an enhanced awareness of an opponent’s strategy—the odds of a fair outcome are eroded. Kalshi’s enforcement actions demonstrate that even seemingly modest bets can become substantial violations if they breach platform rules or disclosures, and they highlight the tension between the novelty of prediction markets and established securities-like expectations of fairness and compliance.
The enforcement framework also signals to other platforms that regulators and market monitors will pursue insider-trading and market-manipulation cases with visible penalties. Kalshi’s public disclosures about the Langford case and the YouTube-creator episode reveal a broader ambition: to deter participants from exploiting private information or unusual access to information channels, whether through social media disclosures, behind-the-scenes connections, or content-driven data streams. The platform’s stance can be read as a commitment to strict governance as prediction markets integrate with mainstream media, political events, and high-profile personalities.
From a policy perspective, the incidents sit at an intersection of financial-market integrity and digital-age governance. The industry has long argued that prediction markets offer useful foresight on real-world events, yet skeptics warn about the potential for manipulation and the overhang of regulatory risk. The Kalshi actions echo broader conversations in Washington about how to supervise new betting formats that blend real-world outcomes with digital platforms, while ensuring that insiders do not gain unfair advantage or profit from information unavailable to the broader public.
Beyond Kalshi, the regulatory mood has grown louder. Congressional discussions and CFTC-led efforts point to a growing taxonomy of enforcement priorities—insider trading, information leakage, and market abuse—that now extend to online prediction platforms with real-money stakes. In parallel, related coverage around Polymarket and other venues has amplified calls for clear guardrails, while public officials outline steps to harmonize the rules with ongoing crypto-market developments. The tension between innovation and accountability remains central to the evolving narrative around prediction markets and crypto-linked financial ecosystems.
In this environment, enforcement actions that surface publicly—such as the Langford-related ban and the YouTube-creator incident—serve as high-profile reminders for participants to treat prediction-market markets with the seriousness they deserve. Kalshi’s leadership has framed these cases as part of a broader discipline strategy, noting that its surveillance apparatus, governance enhancements, and third-party partnerships are designed to identify, investigate, and address market abuse before it becomes systemic.
What to watch next
- Follow Kalshi’s ongoing enforcement docket for new cases and the status of active investigations, including any additional penalties or account suspensions.
- Monitor the CFTC’s predicted shift toward formal advisory collaboration with industry players on prediction-market integrity and insider-trading enforcement.
- Watch for any legislative developments in the United States that would constrain or guide insider trading in prediction markets, especially in relation to government insiders.
- Track updates on the Kalshi-surveillance partnership with Solidus Labs and how their joint framework shapes market abuse detection across listings and events.
- Observe related coverage around high-profile figures and content creators involved in prediction-market activities, including how platforms handle disclosures and potential MNPI issues.
Sources & verification
- Kalshi’s enforcement case page documenting the governance action and penalties tied to the California candidate case.
- Public X posts by Kyle Langford referencing his Kalshi bet and candidacy status.
- Reports surrounding Artem Kaptur and the YouTube-stream-market enforcement action, including Kalshi’s disclosures and penalties.
- Kalshi’s statements on expanding surveillance and partnering with Solidus Labs to address market abuse.
- CFTC leadership statements and the establishment of a prediction markets advisory to coordinate enforcement efforts.
Kalshi enforcement actions highlight insider-trading risk in prediction markets
A political candidacy became the focal point for a broader discussion about market integrity after Kalshi announced a five-year ban and a $2,000 penalty on a former California gubernatorial hopeful who bet on his own bid and publicized it on X. The company said the individual placed a wager of about $200 on his candidacy, and Kalshi emphasized that the account did not generate profits from the trade. The public references tied to this case align with a broader pattern in which prediction-market platforms maintain strict prohibitions against insider trading, and violations are met with tangible penalties and disqualification from the platform.
The athlete-candidate narrative quickly shifted to a widely discussed possible match to Kyle Langford, who has since pivoted to a bid for California’s 26th Congressional District. Kalshi confirmed that the description fits Langford, noting he is no longer pursuing the governorship and has turned his ambitions toward Congress. A May 25, 2025 post on X shows Langford sharing a video of himself placing the Kalshi bet—specifically $98.76 on the odds of victory. Kalshi stated that this account did not withdraw profits, and the case was reported to the CFTC for further review. The company’s decision to publicize the enforcement action underscores its commitment to transparency in maintaining a level playing field for all users.
In a separate enforcement action that drew public attention, Kalshi flagged a YouTube editor for insider-trading-like activity across YouTube stream markets during August and September 2025. The editor traded approximately $4,000 on Kalshi markets in ways that violated Kalshi’s internal rules, resulting in a two-year penalty and roughly $20,000 in fines. The platform described the trading as statistically anomalous, pointing to an unusually high success rate on markets with low odds. Kalshi’s investigators concluded that the individual likely had access to material non-public information, though the specific identity was not disclosed in the company’s public release. The coverage in mainstream media has widely identified the implicated party as Artem Kaptur, a member of MrBeast’s team, highlighting how public content creators can intersect with financial-market activity in novel ways.
Kalshi’s broader enforcement program is not limited to these cases; the platform has publicly disclosed investigations into around 200 cases and has frozen several flagged accounts. Earlier in the month, Kalshi announced the creation of a surveillance-audit committee and a collaboration with Solidus Labs to bolster its ability to detect market abuse and insider trading across its prediction markets. The aim is to raise the bar for governance, promote integrity, and deter would-be insiders from exploiting information asymmetries for personal gain as these markets continue to attract participation from a broader audience, including institutions and highly-visible public figures.
The intensified regulatory posture surrounding prediction markets is also reflected in political developments. US lawmakers introduced a bill aimed at curbing trading by government insiders after a Polymarket user earned more than $400,000 on bets tied to Venezuelan President Nicolás Maduro—trades executed hours before U.S. authorities captured Maduro in Caracas. In response, the CFTC chair signaled that the agency would not hesitate to pursue violators, stating that a new advisory group would work with industry participants to identify and address insider trading in prediction markets. The combined signal from Kalshi, policymakers, and regulators suggests a turning point for how these markets are policed as they move from niche experiments to potential mainstream financial instruments.
As this environment evolves, the line between innovation and enforcement becomes more pronounced. Kalshi’s actions, the high-profile cases, and the regulatory dialogue reflect a broader industry shift toward more robust surveillance, clearer governance, and stricter penalties for those who undermine market integrity. For users, developers, and participants in the growing ecosystem around event-based markets, these developments serve as a reminder to prioritize compliance, transparency, and responsible trading practices—an essential framework if prediction markets are to achieve scalable trust and sustainable growth.


The Blockchain Association has proposed a set of crypto tax reforms after meeting with House Ways and Means Committee offices on Capitol Hill.
Summary
- The Blockchain Association has proposed crypto tax reforms in a meeting with House Ways and Means Committee offices.
- The group called for staking rewards to be taxed only upon sale, alongside privacy-focused reporting rules and broker clarity for non-custodial platforms, among others.
“There is real bipartisan opportunity to modernize digital asset tax policy in 2026. We look forward to continued engagement with lawmakers to deliver clear, workable rules that support compliance and strengthen U.S. competitiveness,” the Blockchain Association wrote in a Tuesday X post.
In its Digital Asset Tax Principles, released the same day, the crypto advocacy group lobbied lawmakers for a “de minimis exemption for small digital asset transactions” and for treating stablecoins as cash for tax purposes, saying routine use should not create disproportionate tax reporting obligations.
The Blockchain Association also said that reporting rules should safeguard taxpayer privacy while still enabling effective enforcement against illicit activities. Further, it added that developers and non-custodial platforms should not be treated as brokers.
The group also contends that taxing staking rewards “upon creation” can create liquidity and valuation challenges, and proposed treating them as self-created property taxable only upon sale or disposition.
Other key proposals included extending wash sale rules to digital assets and introducing a statutory safe harbor for foreign persons trading on U.S. exchanges.
As previously reported by crypto.news, last year Senator Cynthia Lummis introduced a standalone bill that pushed for a de minimis exemption on crypto transactions under $300 alongside a $5,000 annual cap on total tax-free activity.
The senator’s bill also targeted the issue of double taxation that digital asset holders face during the staking and mining process, where rewards can be taxed at the time of receipt and again upon sale.
However, it was met with strong opposition from Democratic Senator Elizabeth Warren, who said at the time that the proposal would allow crypto investors to avoid reporting income on certain transactions and create what she described as a loophole in the tax code.

Decentralized finance protocol Aave has surpassed $1 trillion in cumulative lending volume, marking a historic first in the DeFi industry.
“A decade ago, DeFi and Aave didn’t exist. They were just ideas. Today, Aave stands as the backbone of onchain lending, powering a new financial system that is open, global, and unstoppable,” Aave Labs CEO Stani Kulechov said in an X post on Wednesday.
The feat marked another step toward Aave’s goal of becoming the “largest, most efficient liquidity network in the world,” Kulechov added. “One that builders, banks, and fintechs plug into by default, fundamentally improving liquidity and cost structures across global finance.”

In August, Aave Labs launched Aave Horizon, a new lending market on Ethereum, specifically for traditional finance firms and other institutional investors to borrow stablecoins against real-world assets.
VanEck, WisdomTree and Securitize were among the first participants to use Aave’s institutional offering.
On Feb. 15, Kulechov said DeFi lending could benefit from tokenizing “abundance assets,” like solar, batteries for energy storage and robotics for labor. He expects those assets to be worth a combined $50 trillion by 2050.
Kulechov originally launched Aave as ETHLend in November 2017 before rebranding to Aave in September 2018. It now secures over $27.2 billion in total value locked, enabling users to earn interest on deposits and borrow instantly using crypto as collateral.
Aave leads several prominent DeFi lending platforms in TVL, such as Morpho, JustLend, SparkLend, Maple, Kamin Lend and Compound Finance, each of which holds over $1 billion in total value locked.
Related: Tokenization without provenance is complicity
Aave has generated over $83.3 million in fees over the last 30 days, nearly four times that of its next-closest competitor, Morpho.
DAO proposal has caused division within Aave community
Aave’s milestone comes amid a protocol-wide feud over how much funding and revenue control Aave Labs should receive versus Aave’s decentralized autonomous organization.
Aave (AAVE) token holders have been asked to approve a package worth up to $42.5 million in stablecoins and 75,000 AAVE for Aave Labs.
In return, Aave Labs would route all revenue from Aave-branded products to the Aave DAO treasury under a DAO-funded operating model.
Magazine: A ‘tsunami’ of wealth is headed for crypto: Nansen’s Alex Svanevik


The crypto market cap rebounded 2.7% to $2.32 trillion on Wednesday after recovering some of the previous days’ losses as investors bought the dip.
Summary
- The crypto market recovered from Tuesday’s losses as institutional investors capitalized on the dip.
- A rally in tech stocks and improving geopolitical conditions have acted as a tailwind for risk assets like crypto.
Bitcoin (BTC), the industry’s primary bellwether, climbed 5.5% to hit an intraday peak of $66,233 before consolidating near $65,000, a level now serving as a vital psychological floor.
Ethereum (ETH) followed suit with a 4% rise, stabilizing around $1,900, while other major assets, including XRP, Tron (TRX), and Dogecoin (DOGE), recorded more modest gains between 1% and 3%.
Leading the large-cap pack, Solana (SOL) outperformed with a surge of nearly 7% and had successfully reclaimed the $80 threshold at the time of writing.
Crypto prices rebounded amid millions of liquidations across leveraged markets. Data from CoinGlass shows that around $154 million in short positions were liquidated across the futures market. Over the past 24-hour session, nearly $343 million was liquidated from the broader market, with the majority coming from short liquidations.
When short positions get liquidated, they force the exchange’s liquidation engine to buy back the underlying assets at current market prices to close out the positions, and thus result in an upward short squeeze that accelerates the price recovery.
Crypto market rebounds amid institutional dip buying
The crypto market recovery was primarily supported by investors buying into the recent dip.
Notably, Bitcoin plunged more than 7.5% yesterday, as it moved closer to the critical $60,000 support level. The move sparked a relief bounce, during which BTC successfully reclaimed the $65,000 threshold. The biggest tailwind for the jump was a surge in institutional buying spearheaded by Michael Saylor’s Strategy, which acquired additional BTC during the pullback.
Another key catalyst fueling the market rally came in the form of the Coinbase Premium becoming positive for the first time in 40 days. A positive reading on this metric means Bitcoin is more expensive on Coinbase than on global exchanges. Such a significant price gap is a classic signal of strong buying pressure from American investors and institutions.
As Bitcoin reclaimed the support that analysts believe is essential to avoid more downside volatility, the positive momentum rippled across the broader market.
Market rebound was supported by tech stocks rally
Crypto prices also rose after several Asian tech stocks rallied. South Korea’s KOSPI Index rose to record highs, signaling a broader risk-on sentiment among investors across global markets.
Major traditional U.S. stock indices, such as the S&P 500 and Russell 2000, also stood higher on the day. Cryptocurrencies often tend to rally when such equity markets show signs of strength and stability.
Meanwhile, the crypto market’s tight correlation with technology stocks remained evident, with software shares (IGV) rebounding nearly 1.7% over the past day after recent losses triggered by fears that generative AI tools could disrupt traditional software business models.
However, these concerns are easing as industry leaders like Intuit and DocuSign announce strategic partnerships with AI firm Anthropic, signaling that established companies may successfully adapt to the technology rather than being displaced by it.
Hopes of de-escalation in U.S. and Iran conflict
Another major catalyst for today’s rally is market hopes of a potential de-escalation of conflict between the U.S. and Iran. Reports cited that Iran’s deputy foreign minister has hinted that the country is looking to take any required step to reach a deal with the U.S., reducing fears of an imminent military conflict.
Earlier last Thursday, U.S. President Donald Trump had threatened to launch an attack within ten days from that time, spooking investors and reducing risk-on appetite.
With the latest positive headlines, investors are likely taking a breather as they await more clarity on the diplomatic front. As the geopolitical tensions eased, traditional safe-haven assets such as gold and crude oil lost the momentum they had been riding on, giving crypto assets the room to regain footing.
Disclosure: This article does not represent investment advice. The content and materials featured on this page are for educational purposes only.
Crypto World
Bitcoin Depot announces mandatory ID check for every crypto ATM transaction across U.S.


Bitcoin Depot has been implementing a new requirement across its crypto ATM network in the United States, and now requires users to provide identification for every transaction.
Summary
- Bitcoin Depot now requires identification for every transaction across its U.S. crypto ATM network.
- The rollout began in early February, with the company stating that continuous verification will help flag suspicious activity.
According to the official announcement, the new policy has been live since early February as it hopes to strengthen “safeguards against potential misuse.”
“By requiring identification for every transaction, the enhancement adds another layer of protection designed to help prevent account sharing, identity theft, and account takeover attempts as deployment continues,” the company said.
According to the firm’s CEO, Scott Buchanan, using continuous verification will help detect suspicious activity based on “customers, locations, or transaction amount.”
The mandate comes as Bitcoin Depot faces increased scrutiny from regulators. Earlier this month, the Massachusetts Attorney General Andrea Campbell sued the company for not implementing proper safeguards to prevent scams.
Bitcoin Depot was also targeted by Iowa Attorney General Brenna Bird last year for similar reasons.
According to data from Coin ATM Radar, Bitcoin Depot is the largest crypto ATM operator in the U.S., with 9,019 kiosks in operation. It first started implementing ID requirements in October, but the measure was limited to new users only.
Reports from the FBI and other third-party agencies have warned that bad actors have continued to misuse crypto ATMs to conduct fraud, impersonation scams, and other illicit transfers, often targeting elderly victims and pressuring them to convert cash into digital assets that are difficult to trace or recover. As a result, lawmakers across the U.S. have moved to tighten oversight.
Last year, Washington’s Spokane city implemented a ban on all crypto ATMs. Elsewhere, in North Dakota, a bill was introduced to implement daily transaction caps and mandatory fraud warnings. Nebraska has also taken similar steps.

Can bulls break $2 as Bitcoin reclaims $65K?
Eva Marcille Says ‘Never Say Never’ to Possible ‘RHOA’ Return

Vinicius Jnr dances with joy in fitting end to toxic Benfica tie


-

 Video6 days ago
XRP News: XRP Just Entered a New Phase (Almost Nobody Noticed)
-

 Politics4 days ago
Baftas 2026: Awards Nominations, Presenters And Performers
-

 Fashion5 days ago
Weekend Open Thread: Boden – Corporette.com
-

 Sports2 days ago
Women’s college basketball rankings: Iowa reenters top 10, Auriemma makes history
-

 Politics2 days ago
Nick Reiner Enters Plea In Deaths Of Parents Rob And Michele
-

 Crypto World2 days ago
XRP price enters “dead zone” as Binance leverage hits lows
-

 Business4 days ago
Mattel’s American Girl brand turns 40, dolls enter a new era
-

 Business3 days ago
Law enforcement kills armed man seeking to enter Trump’s Mar-a-Lago resort, officials say
-

 Tech1 day ago
Unsurprisingly, Apple's board gets what it wants in 2026 shareholder meeting
-
 NewsBeat6 hours ago
Manchester Central Mosque issues statement as it imposes new measures ‘with immediate effect’ after armed men enter
-

 NewsBeat4 hours ago
Cuba says its forces have killed four on US-registered speedboat | World News
-
 NewsBeat3 days ago
‘Hourly’ method from gastroenterologist ‘helps reduce air travel bloating’
-

 Tech3 days ago
Anthropic-Backed Group Enters NY-12 AI PAC Fight
-

 NewsBeat3 days ago
Armed man killed after entering secure perimeter of Mar-a-Lago, Secret Service says
-

 Business1 day ago
True Citrus debuts functional drink mix collection
-

 Politics4 days ago
Maine has a long track record of electing moderates. Enter Graham Platner.
-
 NewsBeat1 day ago
Police latest as search for missing woman enters day nine
-

 Crypto World1 day ago
Entering new markets without increasing payment costs
-
 Sports3 days ago
2026 NFL mock draft: WRs fly off the board in first round entering combine week
-

 Crypto World6 days ago
83% of Altcoins Enter Bear Trend as Liquidity Crunch Tightens Grip on Crypto Market