

Crypto World
$8.72B Bitcoin and Ethereum Options Expiry: Pain Trade Looms?
Over $8.72 billion in Bitcoin and Ethereum options expire today, marking February’s largest derivatives event.
The expiring options place the crypto market at a critical inflection point, with volatility elevated and sentiment fragile.
February’s $8.72 Billion Expiry Crossroads: Will Bitcoin and Ethereum Face the Pain Trade?
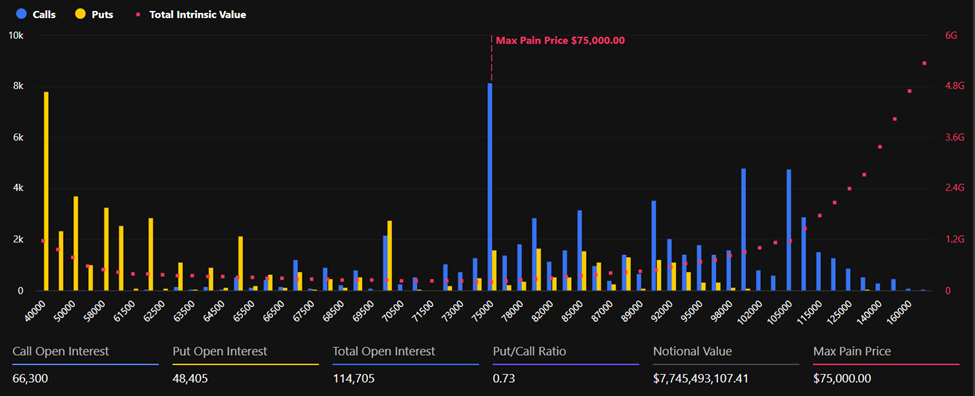
Bitcoin accounts for the lion’s share of the exposure, with 114,705 contracts representing $7.74 billion in notional value heading into settlement.

Ethereum follows with 478,992 contracts worth approximately $975 million. Combined, the expiries account for roughly 20% of total open interest, suggesting their potential market impact.
At current prices, both assets sit notably below their respective “max pain” levels or the strike price at which the greatest number of options expire worthless.
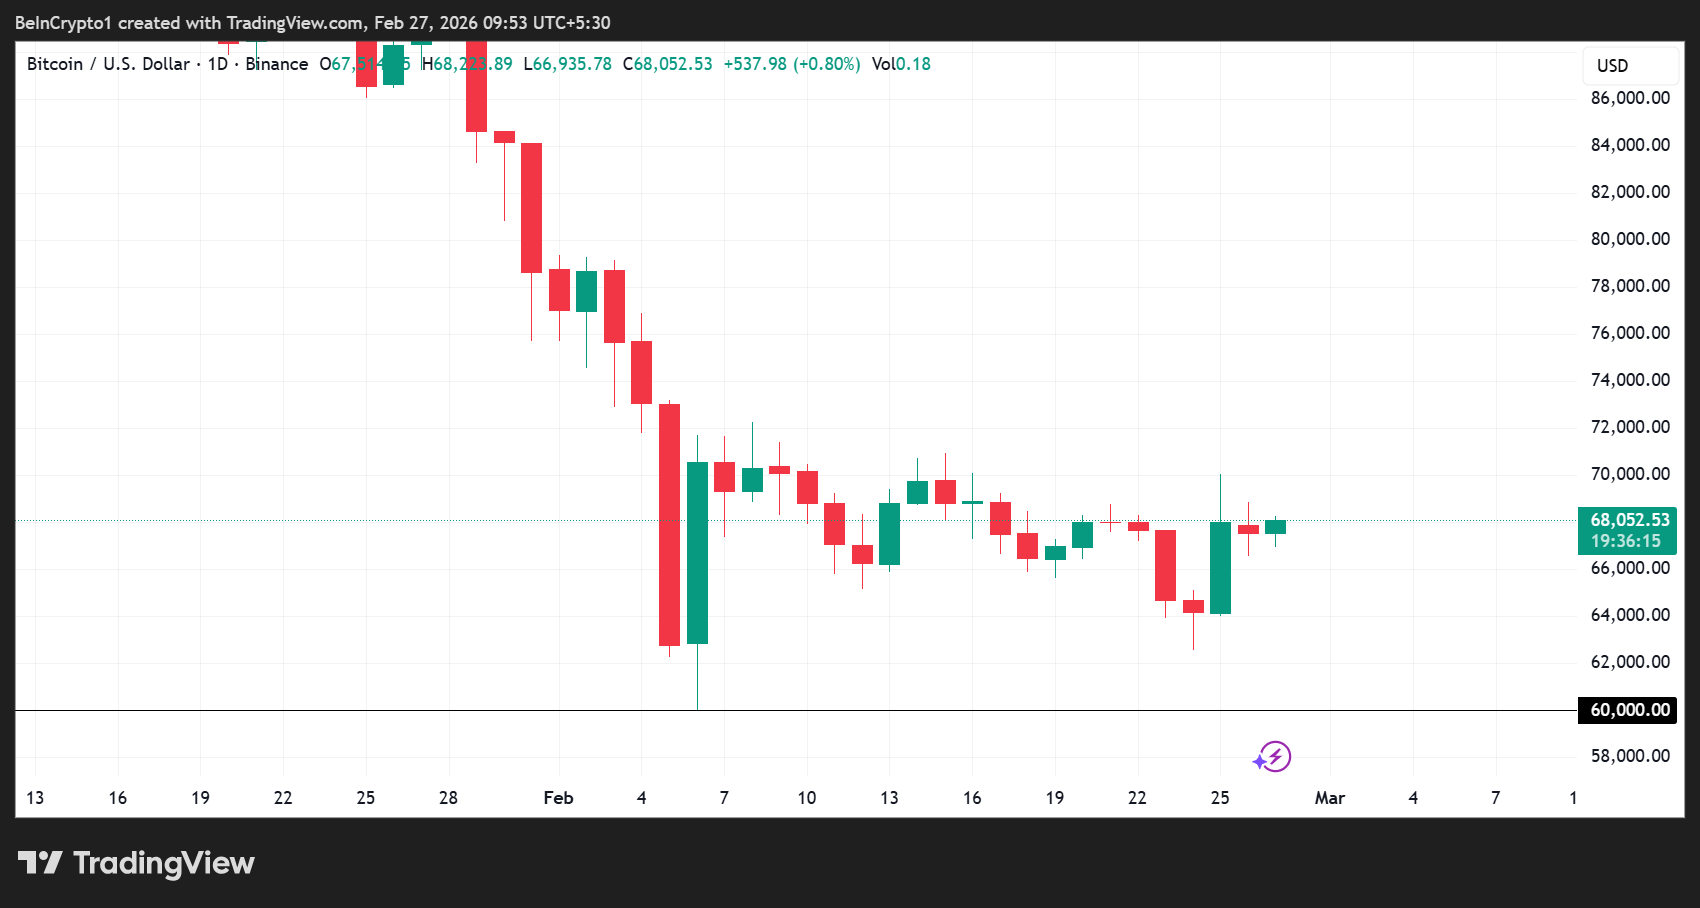
Bitcoin was trading for $68,052, compared to a max pain level of $75,000. Ethereum changes hands near $2,035, below its $2,200 max pain threshold.
Call open interest (OI) dominates across both assets. Bitcoin shows 66,300 call contracts versus 48,405 puts, giving a put-to-call ratio of 0.73. Ethereum’s ratio stands at 0.78, with 268,642 calls and 210,350 puts outstanding.

Analysts at Deribit note that call OI leads across both majors, with Bitcoin carrying the significantly larger notional weight into settlement. This factor could amplify spot sensitivity if hedging flows intensify.
Volatility Divergence Signals Unease
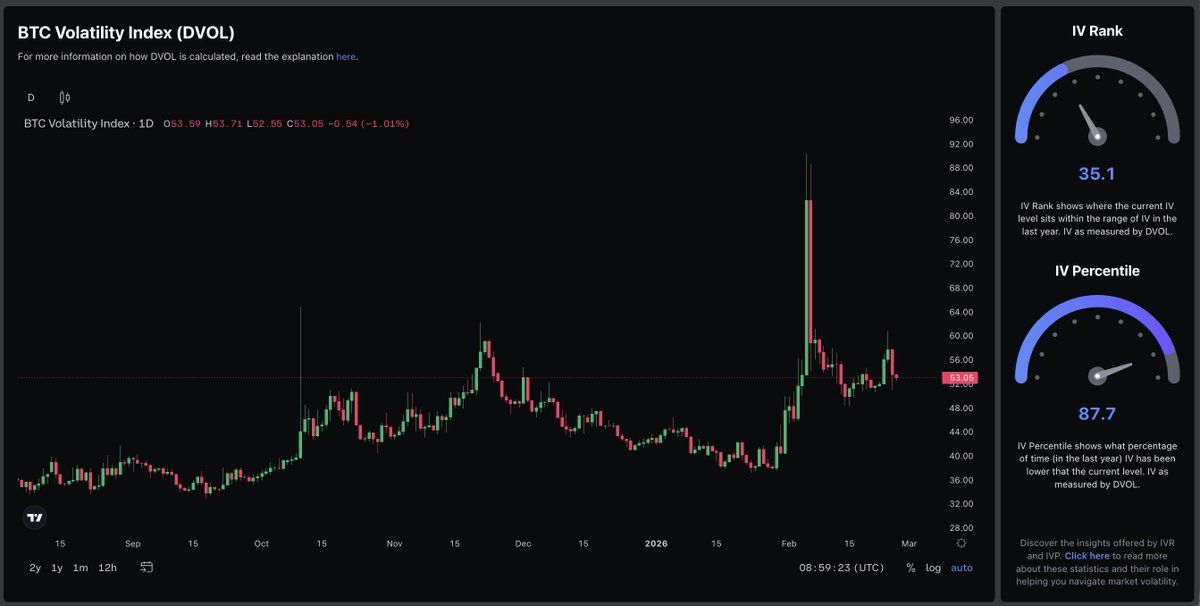
Meanwhile, volatility metrics reveal a nuanced picture. According to Deribit data, Bitcoin’s DVOL index sits at 53, with an implied volatility (IV) percentile of 87.7, which is elevated relative to its historical range.
Ethereum’s DVOL is higher in absolute terms at 70, but its IV percentile of 55.7 suggests it is less extreme than its historical behavior.
Still, Ethereum volatility is running approximately 15–20 points above Bitcoin across the curve. It indicates traders are pricing in materially higher uncertainty across ETH maturities.
Term structure remains in contango for both assets, with a front-end volatility premium concentrated around the February expiry.
Fear Unwinds, But Conviction Lags
Earlier this month, 25-delta skew for both Bitcoin and Ethereum plunged toward -30, reflecting intense demand for downside protection as prices slid sharply.
Since then, skew has steadily recovered to around -8 to -9, signaling that panic hedging has eased. However, skew remains negative, indicating the market has not fully shaken off its defensive posture. Against this backdrop, analysts at Greeks.live describe the broader market as sluggish.
In early February, Bitcoin briefly tested the $60,000 psychological threshold and has since oscillated weakly above it.
While a recent two-day rebound lifted implied volatility (with BTC main-term IV at 47% and ETH at 65%) confidence remains thin.
“The downward price trend has eased, but market confidence remains insufficient,” Greeks.live noted, adding that large-block call options have dominated recent trading activity, particularly in medium- to long-term maturities.
Skew metrics rebounding indicates emerging bottom-fishing activity, but the firm cautions that the market remains firmly in bear territory.
Crucially, analysts argue that the crypto market lacks fresh capital inflows and clear catalysts, with pessimistic narratives still dominating social channels. Despite signs that extreme fear is unwinding, conviction behind the rebound appears tentative.
With both Bitcoin and Ethereum trading well below their max pain levels, spot prices could gravitate higher heading into today’s options expiry. Such an outcome could intensify a potential “pain trade.”
However, subdued demand could allow volatility to compress after expiry, with derivatives markets pricing less panic, but not yet a return of confidence.

Crypto World
Hedera price eyes bullish crossover as stablecoin activity fires up, will it break out?

Hedera price rallied over 8% this week amid a notable jump in the stablecoin supply held on the network.
Summary
- Hedera price rebounded 8% this week amid an uptick in network activity.
- HBAR price action is close to confirming a bullish crossover on the daily chart.
According to data from crypto.news, Hedera (HBAR) price rallied 8.7% over this week amid a broader crypto market rebound largely fueled by Bitcoin reclaiming key support levels and improved investor appetite for risk assets amid a surge in tech stocks.
The token’s rally also gained support from a jump in stablecoin supply held on the network. Data from DeFiLlama show that its stablecoin supply has surged nearly 17% over the past seven days, driven largely by USDC, which accounts for about 99.8% of the total supply.
A surge in stablecoin means more users are transacting, deploying capital, or seeking yield on the network. Such activities tend to support retail sentiment.
Demand from derivative traders also provided an impetus to HBAR’s rally. Notably, Hedera futures open interest has increased by 3% in the past 24 hours, while its weighted funding rate has also turned positive.
A positive funding rate means more traders are entering the market with bullish bets, which in turn is improving overall market sentiment.
On the daily chart, Hedera price has broken above a descending trendline that had been acting as a dynamic resistance, capping price movement since late October last year. When an asset breaks out of such a descending trendline resistance, it is typically a sign of a trend reversal, with dominance shifting to the hands of bulls.
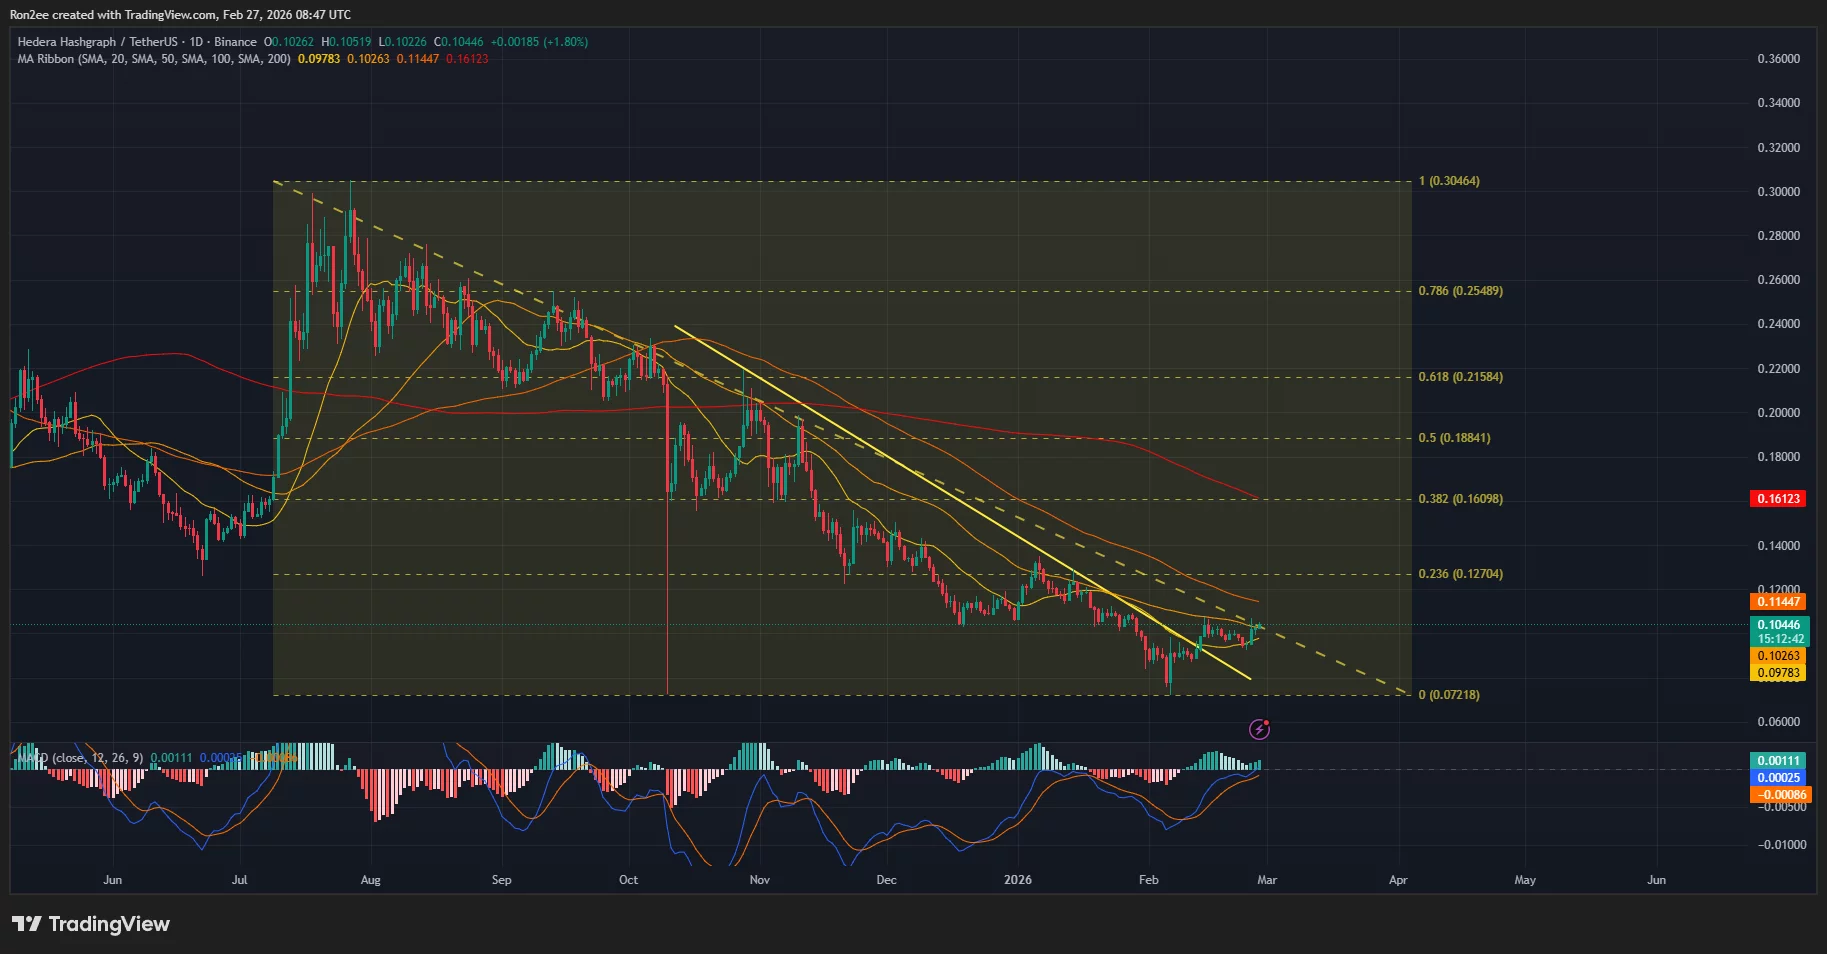
The 20-day SMA appears close to moving above the 50-day SMA, forming what traders term a short-term bullish crossover. When such crossovers are confirmed, cryptocurrencies have often sparked sharp rallies.
Adding to the bullish outlook, the MACD lines have also pointed upwards and are close to moving above the zero line.
Hence, the price outlook for Hedera appears to be bullish for now, with the token most likely to target $0.12 next, which aligns with the 23.6% Fibonacci retracement level.
On the contrary, if bears can push the price below the 20-day SMA of $0.097, Hedera could enter a downtrend.
However, the lackluster demand for Hedera spot ETFs could become a bottleneck for any upside move, especially since other assets like XRP and Solana ETFs have continued to outpace HBAR in both net daily inflows and total assets under management (AUM).
Disclosure: This article does not represent investment advice. The content and materials featured on this page are for educational purposes only.
This Friday, we examine Ethereum, Ripple, Cardano, Binance Coin, and Hyperliquid in greater detail.
Ethereum (ETH)
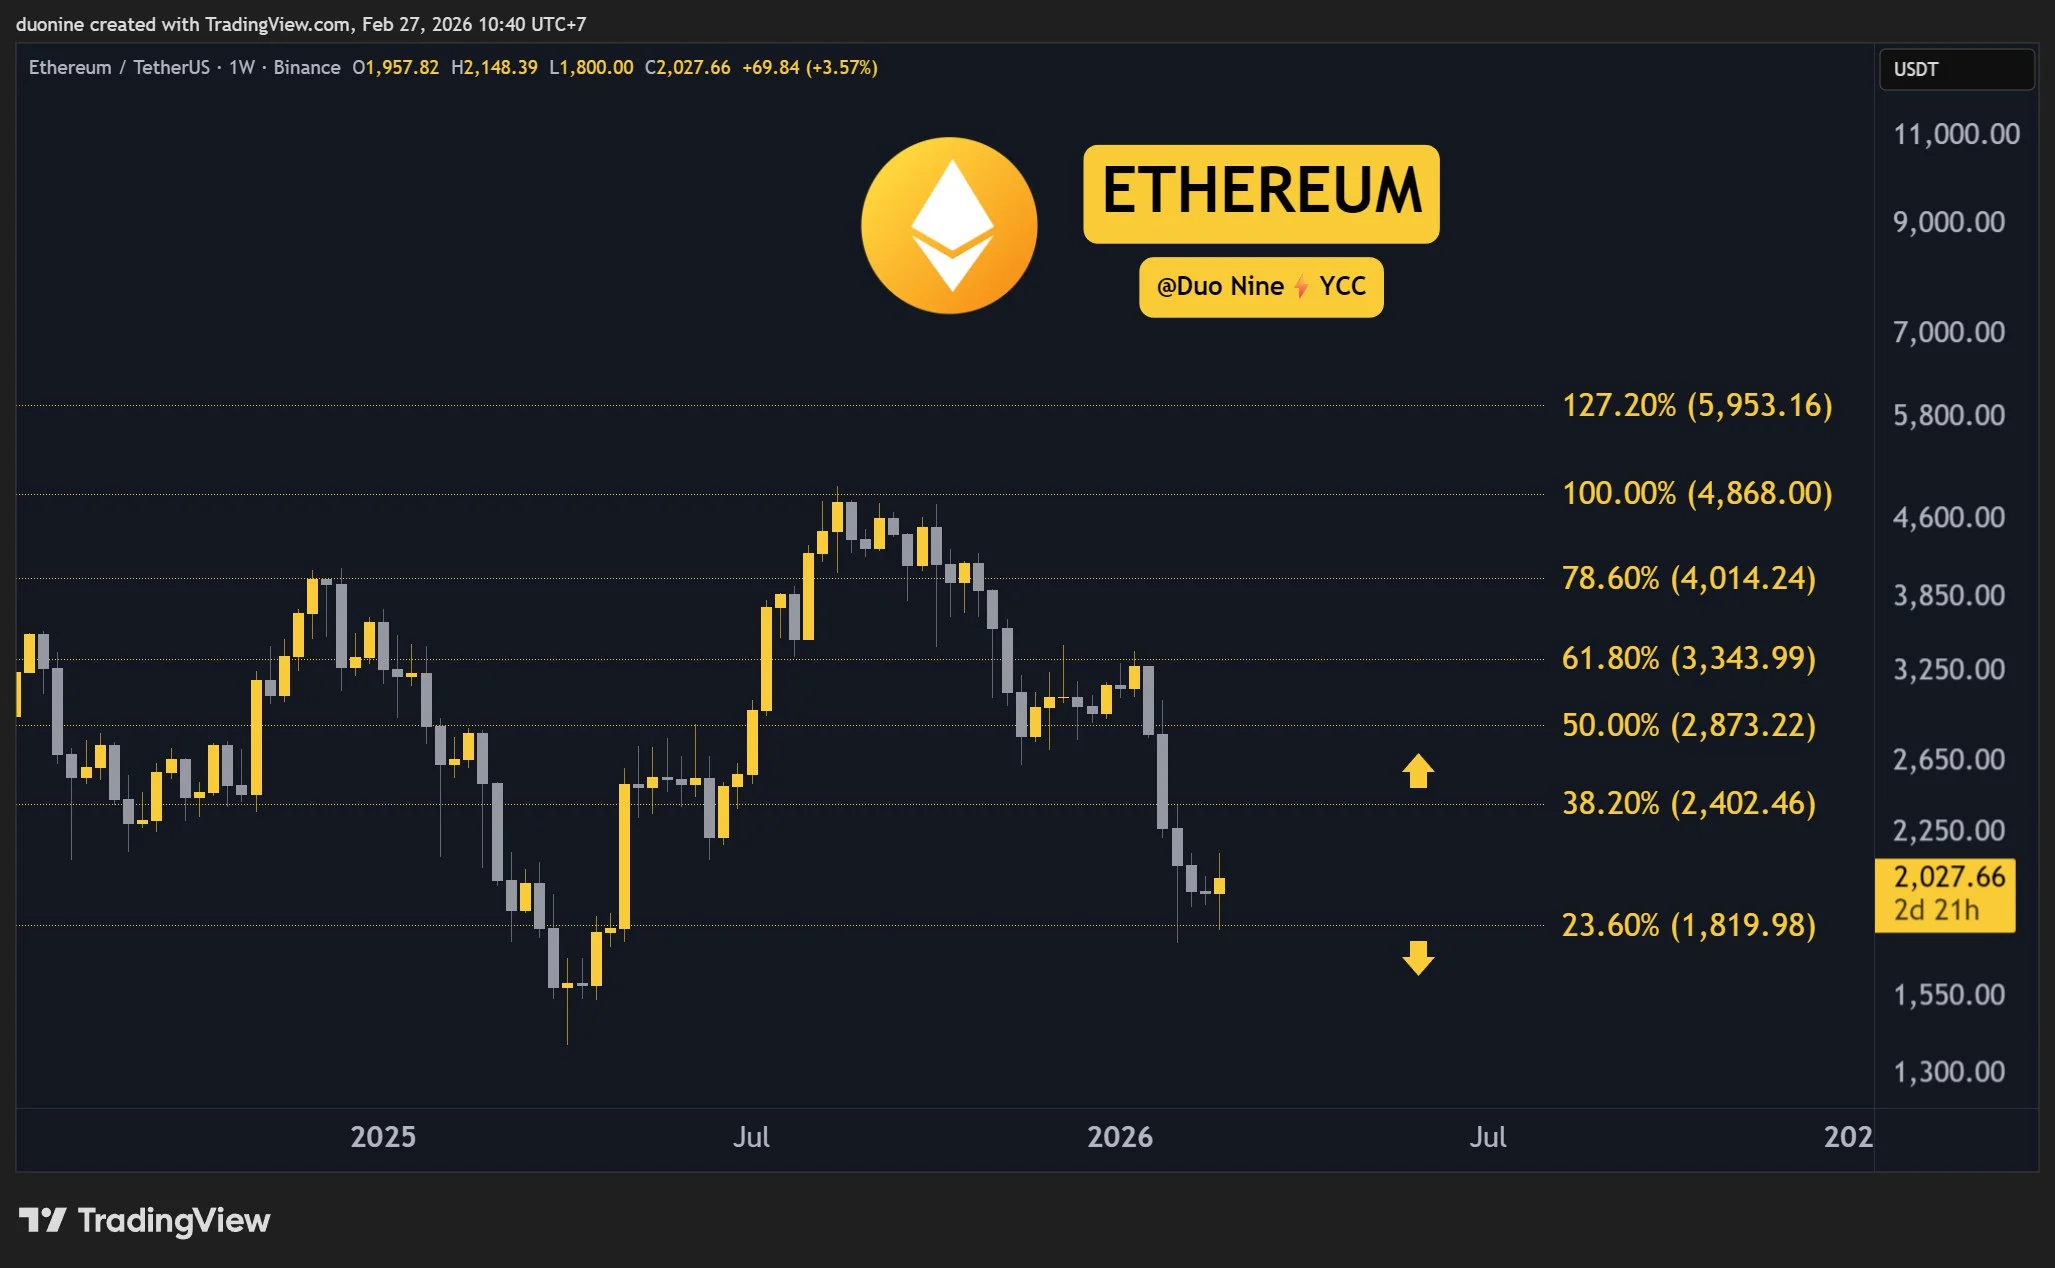
After weeks of bearish price action, Ethereum has finally found support at the $1,800 level, where buyers have shown interest. This allowed ETH to close the week 5% higher, reaching $2,000, which is currently being contested.
If the bulls manage to hold the price above $2,000 and turn this level into a key support, then the cryptocurrency has a good shot at moving much higher and towards $2,400, which is the next resistance on the chart.
Looking ahead, ETH may be entering a relief rally that could take it as high as $2,800. Once there, sellers could step up the pressure again.

Ripple (XRP)
XRP has been flat over the past week and has not made any gains. Nevertheless, there are signs the price wants to move higher since sellers have failed to make lower lows.
This pause in price action could be interpreted as bullish because sellers have lost the initiative, which opens the door for buyers to return and push XRP to the next key level at $1.6. This becomes likely if the current support at $1.4 continues to hold.
Looking ahead, a bounce higher can be expected, but sellers could return at $1.6. Only if that level is broken can bulls hope to reclaim $2 or higher.

Cardano (ADA)
ADA had a good week, closing with a 7% gain. This is the first time in months that ADA is managing to look bullish after a prolonged correction. To consolidate the current gains, buyers will have to push this cryptocurrency above 30 cents, which acts as a resistance.
If 30 cents falls, then the next key target will be found at 36 cents, which is likely to be defended by sellers quite aggressively based on the past price action.
Looking ahead, Cardano may be forming a bottom here, which would be in line with the past. If so, this is an attractive area for buyers, especially since this downtrend lasted for over a year and a reversal is overdue.

Binance Coin (BNB)
Binance Coin closed the week 4% higher and found strong support around $600. It seems sellers ran out of steam and were unable to break lower and hold the price there. Because of this a bounce here is likely.
Should buyers become more active in the days to come, their first target is found at $690. If that level is reclaimed, then they will look at $900 next.
Looking ahead, BNB wants to recover some of the recent losses, and considering most altcoins are turning bullish, it would not be surprising to see this cryptocurrency also make steady gains in the coming days and weeks.

Hype (HYPE)
HYPE is flat on the weekly chart and is trying to return above $30. So far, buyers will need at least one more push to be successful, but sellers may be waiting for that move before they return.
With momentum building up behind bulls across the market, HYPE has a good shot at a breakout beyond $30, especially if the recent test of the $26 support is confirmed as a higher low.
Looking ahead, HYPE has a real chance to rally if the $30 is turned into support. Watch the price action in the next few days, as it will be decisive to where this cryptocurrency goes next.

Binance Free $600 (CryptoPotato Exclusive): Use this link to register a new account and receive $600 exclusive welcome offer on Binance (full details).
LIMITED OFFER for CryptoPotato readers at Bybit: Use this link to register and open a $500 FREE position on any coin!
Disclaimer: Information found on CryptoPotato is those of writers quoted. It does not represent the opinions of CryptoPotato on whether to buy, sell, or hold any investments. You are advised to conduct your own research before making any investment decisions. Use provided information at your own risk. See Disclaimer for more information.

In its latest quarterly update, MARA Holdings confronted a stark reality: even as its bitcoin mining fleet generated fewer coins, the company’s balance sheet was weighed down by falling crypto valuations and a strategic pivot away from pure mining. MARA reported a fourth-quarter 2025 net loss of $1.71 billion, or $4.52 per diluted share, compared with a year-earlier net income of $528.3 million. Revenue slipped 6% year over year to $202.3 million, as a softer Bitcoin (CRYPTO: BTC) price offset a higher hashrate. For the full year, the firm posted a net loss of $1.31 billion on revenue of $907.1 million, reversing 2024’s $541 million profit.
Key takeaways
- MARA’s Q4 2025 net loss was $1.71 billion and revenue was $202.3 million, with earnings pressured by the decline in BTC prices despite a higher mining hashrate.
- For the full year 2025, the company recorded a net loss of $1.31 billion on $907.1 million in revenue, reversing 2024’s profit as crypto prices remained volatile.
- A $1.5 billion negative adjustment to the fair value of digital assets and receivables contributed to the quarterly loss, reflecting BTC price declines from around $114,300 on Sept. 30 to $88,800 on Dec. 31 (per CoinGecko).
- MAR A’s BTC holdings at year-end totaled 53,822, with 15,315 pledged or loaned, and the balance-sheet BTC carried a roughly $4.7 billion value at quarter-end prices.
- The company unveiled a strategic pivot into AI and high-performance compute, including a joint venture with Starwood Digital Ventures to build data centers at power-rich sites, initially targeting more than 1 GW of IT capacity and potentially expanding to 2.5 GW.
- In February, MARA acquired a 64% stake in Exaion to pursue sovereign-grade and enterprise AI deployments as part of the broader diversification plan.
Tickers mentioned: $BTC, $MARA
Sentiment: Bearish
Price impact: Negative. MARA’s stock has fallen about 46% over the past six months as results and strategic pivots weigh on investor sentiment.
Trading idea (Not Financial Advice): Hold. While the transition toward AI/HPC is notable, near-term investors should watch project execution and BTC price stability before reassessing risk/reward.
Market context: The results come amid a broader crypto downturn where mining economics remain sensitive to BTC price swings, regulator signals, and capital allocation shifts among miners pursuing diversified revenue streams rather than pure hodling or mining.
Why it matters
The quarterly and annual figures underscore a pivotal moment for MARA as it moves beyond a pure-play bitcoin miner toward an energy and digital infrastructure company. The heavy accounting hit from the fair value of digital assets illustrates how price volatility can disproportionately affect mining-focused models, even when production levels hold steady or improve. By contrast, the balance sheet remains robust in crypto terms, with a substantial BTC stash that, on paper, still carries significant value given the ongoing, albeit uneven, interest in asset-backed mining operations.
Beyond the numbers, the strategic pivot is the centerpiece. MARA’s collaboration with Starwood Digital Ventures aims to unlock a significant AI/HPC footprint on existing energy-rich sites, a move that could open new revenue channels independent of BTC cycles. The plan envisions more than 1 gigawatt of IT capacity in the initial phase, with a roadmap to exceed 2.5 GW over time. Crucially, MARA retains the option to invest up to 50% in individual projects, while continuing to mine where power remains economical. This hybrid model reflects a broader industry trend: miners seeking to hedge against crypto price volatility by anchoring operations in data centers and AI workloads that can generate steady, long-term demand.
Additionally, the February acquisition of a 64% stake in Exaion signals a concrete push into AI deployments that could leverage MARA’s grid-scale energy footprint. Exaion’s focus on sovereign-grade and enterprise AI deployments aligns with the growing demand for specialized compute resources, particularly at the intersection of crypto mining infrastructure and high-performance compute networks. As more miners explore blended business models, MARA’s approach stands out for attempting to formalize AI-centric data center capacity alongside mining operations.
In comparison, peers are testing similar pivots with varying degrees of commitment. Some miners are leaning into large AI data-center leases, while others continue to emphasize a combined strategy of mining and hoarding BTC to preserve, and potentially grow, crypto exposure. The sector’s direction remains dependent on macro conditions, including BTC price trajectories, energy costs, and regulatory developments that could influence the economics of large-scale mining and data-center deployments alike.
The financials also hint at the balancing act between growth investments and shareholder value. If the Starwood joint venture and Exaion initiatives deliver on capacity and utilization, MARA could unlock a multi-year path toward diversified cash flows. Yet the immediate picture is clouded by historical volatility in the crypto markets and the challenge of turning large capex programs into near-term profits. Investors will be watching how the company manages capital deployment, debt, and any potential tranche financing to accelerate its AI/HPC push while supporting ongoing mining operations.
The company’s overall strategy, while ambitious, mirrors a broader move within the crypto hardware space toward building resilient, diversified platforms. As data centers become a more common anchor for crypto firms, MARA’s ability to translate capacity into meaningful revenue streams will be a key test for the model’s sustainability in a market where price signals for BTC remain bifurcated and often unpredictable.
What to watch next
- Progress updates on the Starwood Digital Ventures AI/HPC data-center partnership, including projected milestones for the initial >1 GW capacity and any expansions toward 2.5 GW.
- Operational and financial details on Exaion deployments and contracts, particularly any sovereign-grade AI projects and enterprise compute commitments.
- Bitcoin price movements and realized/batched mining yields as MARA advances its hybrid strategy, plus any changes to the company’s balance-sheet BTC position or collateral arrangements.
- Any capital-raising efforts, debt restructurings, or financing agreements tied to the new AI/HPC initiatives and data-center builds.
- Regulatory developments affecting crypto mining, energy use, and AI infrastructure deployments that could impact project economics or timelines.
Sources & verification
- MARA Holdings Q4 2025 shareholder letter filed with the SEC (SEC: q425shareholderletter.htm).
- Bitcoin price data used for the fair value discussion (CoinGecko: bitcoin).
- Company updates and stock performance coverage (Yahoo Finance: MARA).
- Exaion stake and AI/HPC deployments referenced in MARA communications (Cointelegraph article on Exaion stake).
Key figures and next steps
What the announcement changes
The fourth quarter reports reveal a company navigating a difficult macro environment for mining while actively pursuing a structural shift toward AI-enabled data centers. If successful, the Starwood JV and Exaion partnerships could provide MARA with nonmining revenue streams that weather BTC price cycles. The path forward will hinge on project execution, the pace of capacity buildup, and the ability to translate compute demand into sustained profitability.
Sources & verification
- SEC filing: q425shareholderletter.htm
- CoinGecko data: bitcoin
- Yahoo Finance: MARA
- Exaion stake coverage: Cointelegraph

Ethereum is attempting to stabilize above the $2,000 level as fresh details around the network’s long-term scaling roadmap, dubbed the “Strawmap,” inject renewed fundamental optimism into the market.
Summary
- Ethereum is holding above $2,000 as the Ethereum Foundation unveils its “Strawmap,” a roadmap aimed at faster slot times and improved transaction finality.
- ETH is consolidating between $1,900 and $2,100 after a sharp January–February sell-off, with $2,100 acting as key breakout resistance.
- Momentum indicators, including the Aroon Oscillator and Bull-Bear Power, are turning positive, suggesting early-stage accumulation but confirmation requires a decisive move above range highs.
The proposal, outlined by Vitalik Buterin and backed by the Ethereum Foundation, sketches a path toward significantly faster slot times and improved transaction finality.
The plan envisions reducing block times and tightening confirmation latency, a move that could materially enhance user experience, rollup efficiency, and DeFi execution speeds.
While the Strawmap remains a directional framework rather than a finalized upgrade schedule, its focus on faster slots and stronger finality reinforces Ethereum’s commitment to long-term scalability, a narrative that may help underpin price recovery after weeks of heavy selling pressure.
Ethereum price analysis: Can bulls reclaim $2,100?
On the daily ETH/USDT chart, Ethereum is trading around $2,035 after rebounding from a sharp early-February sell-off that briefly pushed the price below $1,900.
The broader structure shows that ETH fell aggressively from the $3,200–$3,300 region in January before finding demand near the $1,850 zone. Since that capitulation-style move, price action has shifted into consolidation, forming a range between approximately $1,900 and $2,100.
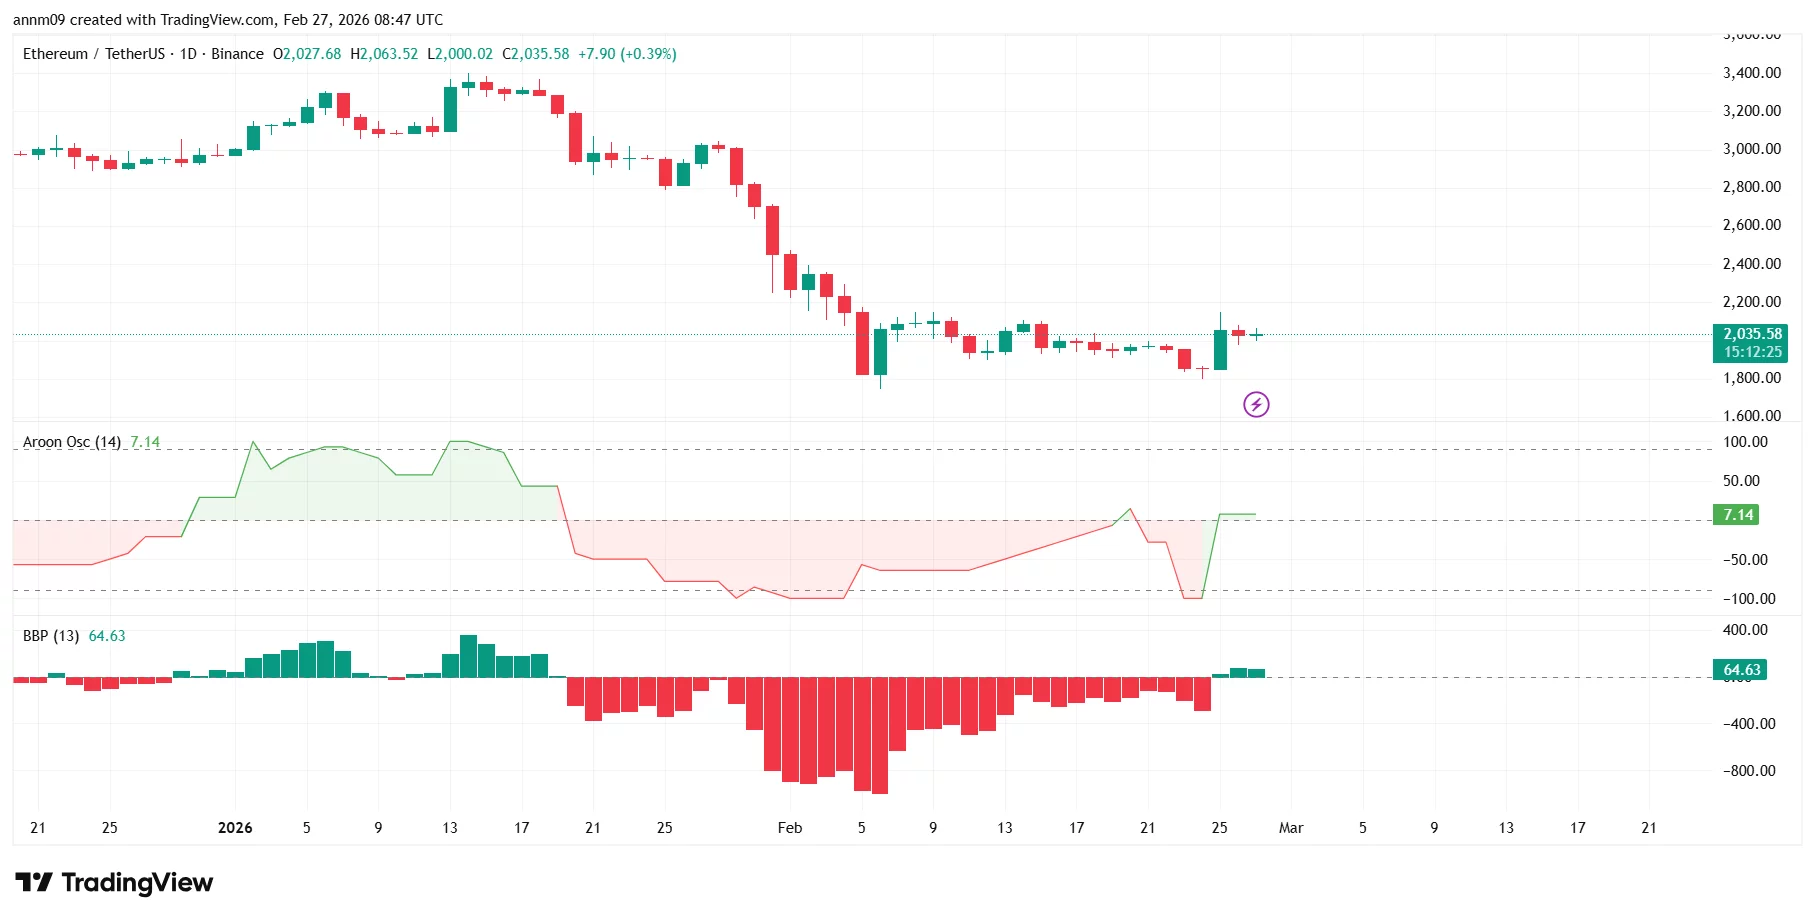
This sideways structure suggests the market is attempting to build a base following weeks of heavy distribution.
The $2,100 level now stands as immediate resistance and represents the upper boundary of the current range. A decisive daily close above this area would mark the first meaningful higher high on the daily timeframe and could open the path toward $2,300, where prior breakdown momentum accelerated.
Beyond that, $2,500 remains a major resistance zone, having previously acted as structural support before the January collapse.
On the downside, $1,900 continues to serve as critical short-term support. A break below that level would expose the $1,800 area, the site of the February wick low, as the next major demand zone.
Momentum indicators are beginning to show early signs of improvement. The Aroon Oscillator has flipped back into positive territory after an extended period of negative readings, indicating that bearish dominance is weakening.
Meanwhile, Bull-Bear Power has shifted from deeply negative levels to printing green histogram bars above the zero line, suggesting that buying pressure is gradually returning.
Together, these signals point to a transition from capitulation to accumulation. However, confirmation of a trend reversal requires a clean breakout above $2,100 and sustained follow-through. Until then, Ethereum remains in a consolidation phase, balancing improving technical momentum against overhead resistance.
TeraWulf, a publicly listed US digital infrastructure company, missed fourth-quarter earnings estimates as its mining revenue dropped amid falling Bitcoin prices in late 2025.
TeraWulf (WULF) released 2025 earnings on Thursday, reporting a fourth-quarter loss of $1.66 per share, compared with a loss of $0.21 per share a year earlier. Analysts surveyed by Yahoo Finance had expected a $0.16 loss.
Revenue for the quarter ended Dec. 31 totaled $35.8 million, including $26.1 million from digital assets and $9.7 million from high-performance computing (HPC), down from $50.6 million in the third quarter. Analysts had expected an average of $44.1 million.
For the full year, Terawulf’s revenue rose from $140.1 million in 2024 to $168.5 million, expecting further growth in 2026 with $12.8 billion in signed AI and HPC contracts.
“We are advancing build schedules and optimizing design to support next‑generation AI workloads at scale,” TeraWulf’s chief technology officer Nazar Khan said.
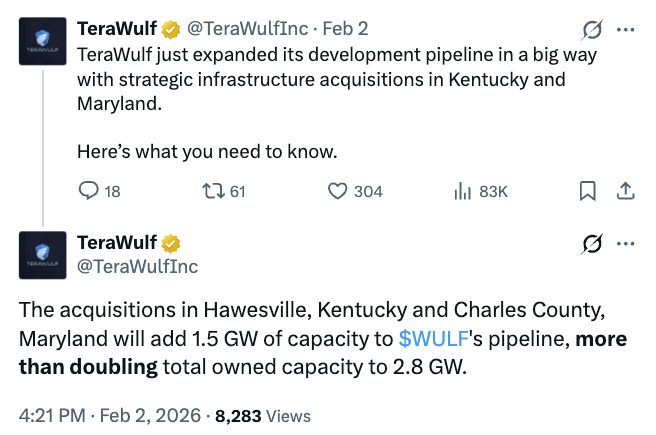
TeraWulf plans to double total capacity with Kentucky and Maryland sites
TeraWulf plans to expand its infrastructure in 2026 with the acquisition of a site in Kentucky (MISO) and a planned acquisition in Maryland (PJM).
The company expects these acquisitions to add 1.5 gigawatts (GW) to its platform, more than doubling its current capacity and bringing total owned platform capacity to approximately 2.8 GW across five sites.

Together, the sites form a multi-year development path capable of supporting 250-500 megawatts (MW) of critical IT capacity annually, allowing TeraWulf to scale with growing AI demand while maintaining disciplined capital deployment and credit-backed contracts.
“We enter 2026 with 522 critical IT MW of contracted HPC capacity and a gross 2.9-GW multi-regional platform designed for long-term expansion,” CEO Paul Prager said.
Related: Bitcoin miner MARA posts $1.7B quarterly loss on BTC slump
Bitcoin mining companies have struggled as the cryptocurrency’s price fell from around $125,000 in early October to nearly $60,000 by February 2026, according to TradingView.
At $67,982 at the time of publication, Bitcoin is trading well below the estimated average cost to mine one coin, $87,310, according to MacroMicro.
The decline has intensified pressure on miners to pivot into AI and HPC, fueling a broader rush into data center operations.
Magazine: Bitdeer sells all Bitcoin, Metaplanet rejects misconduct claims: Asia Express
Crypto World
Meta Expands AI Chip Strategy with Google TPU Partnership Following Nvidia and AMD Deals

Key Highlights
- Meta Platforms has finalized a multi-year, billion-dollar agreement with Google to lease Tensor Processing Units (TPUs) for artificial intelligence development.
- The social media giant is negotiating to acquire Google TPUs directly for deployment in its proprietary data centers beginning next year.
- This partnership comes on the heels of Meta announcing separate long-term chip agreements with both Nvidia and AMD earlier this week.
- Meta’s agreement with Nvidia encompasses millions of Blackwell and Rubin GPU units, while its AMD contract totals approximately $100 billion across five years.
- Wall Street analysts maintain a Strong Buy rating on META stock, projecting an average target price of $864.62—representing potential upside of around 31.6%.
Meta Platforms has concluded a remarkably active week in the semiconductor industry, finalizing significant chip procurement agreements with three major players in AI computing: Nvidia, AMD, and most recently, Google.
The most recent arrangement involves Meta leasing Google’s Tensor Processing Units (TPUs), specialized chips designed for artificial intelligence workloads. According to The Information’s initial coverage, this multi-year commitment represents a financial commitment in the billions.
Beyond simply renting cloud capacity, Meta is reportedly discussing purchasing Google TPUs outright for installation within its own infrastructure, with deployment potentially beginning as early as next year.
Developed by Google’s parent corporation, Alphabet, TPUs represent a strategic alternative to Nvidia’s dominant GPU offerings. The chips have increasingly contributed to Google Cloud’s revenue stream, and securing Meta as a customer provides Alphabet with a prestigious reference account.
Alphabet has additionally established a joint venture with a major institutional investor (name undisclosed) focused on TPU leasing arrangements—indicating the tech giant’s commitment to expanding its chip business beyond internal applications.
Meta’s Massive Chip Investment Wave
Just days ago, Meta unveiled an AMD partnership covering 6 gigawatts of computational capacity. Industry analysts estimate this five-year deal at approximately $100 billion in total value.
Under the AMD terms, Meta will become the inaugural recipient of custom-designed MI450 GPUs alongside Venice CPU processors in late 2026. The agreement includes warrants allowing Meta to acquire up to 160 million AMD shares, creating aligned financial incentives between the partners.
The Nvidia partnership matches this scale of ambition. Meta intends to roll out millions of Nvidia’s next-generation Blackwell and Rubin GPU architectures, complemented by Grace and Vera central processing units, plus Spectrum-X networking infrastructure. Notably, this represents Nvidia’s first major standalone deployment of Grace CPUs with any client.
Collectively, these three partnerships demonstrate Meta’s aggressive capital deployment strategy aimed at narrowing the competitive gap in artificial intelligence capabilities.
Google Challenges Nvidia’s Market Position
For Google, securing Meta as a TPU client represents a significant milestone in its campaign to challenge Nvidia’s overwhelming market leadership in AI accelerators.
Nvidia shares declined more than 5% following the announcement, while AMD fell over 3%. Alphabet stock dropped approximately 1.76%. Meta, conversely, posted gains of 0.51%.
Previous reporting this week suggested Google has been actively pursuing strategies to broaden TPU adoption, with several startups already onboard. Nevertheless, the company has encountered manufacturing constraints and tepid interest from major cloud service providers.
Meta’s participation offers Google an opportunity to showcase TPU performance on enterprise-scale, computationally intensive AI applications.
Alphabet’s joint venture with an unnamed institutional partner aims to facilitate TPU leasing operations—a framework that could provide the capital necessary to expand production capacity in response to rising demand.
From an investment perspective, META currently carries a Strong Buy consensus rating on TipRanks, supported by 39 Buy recommendations against 4 Hold ratings. The consensus price target of $864.62 suggests approximately 31.6% appreciation potential from present trading levels.


TLDR
- Intel (INTC) declined approximately 3% on Thursday, closing at $45.46 with volume 41% below average
- Kevin O’Buckley, the SVP and general manager of Intel Foundry Services, departed to join Qualcomm as VP of global operations and supply chain
- The company revealed a partnership with AI chip startup SambaNova focused on the SN50 inference chip
- Wall Street consensus remains at “Hold/Reduce” with price targets ranging from $45.74 to $48.21
- Q4 earnings showed EPS of $0.15, surpassing expectations, though margins remain negative with cautious forward outlook
Shares of Intel (INTC) slipped nearly 3% during Thursday’s session, settling at $45.46 compared to the prior close of $46.88. Volume registered approximately 71 million shares, representing a 41% decline from typical daily levels.
The decline was primarily attributed to a significant personnel change: Kevin O’Buckley, who served as senior vice president and general manager of Intel Foundry Services, has exited the company.
O’Buckley is transitioning to Qualcomm, where he’ll assume the position of vice president of global operations and supply chain. The lateral move between two semiconductor powerhouses triggered immediate market reaction.
Intel acted swiftly to calm investor concerns. The chipmaker emphasized that Intel Foundry continues to be “one of Intel’s highest strategic priorities” and will operate under Naga Chandrasekaran’s leadership, who assumed the top foundry position last year.
The company publicly acknowledged O’Buckley’s contributions and extended best wishes. Official reasons behind his departure remain undisclosed.
Speculation suggests O’Buckley may have previously held a direct reporting relationship with CEO Lip-Bu Tan. Following Intel Foundry’s reorganization, his reporting structure shifted to Chandrasekaran. Whether this organizational change influenced his decision remains unclear.
Intel’s AI Inference Push
The week brought positive developments as well. Intel unveiled a partnership with AI chip startup SambaNova centered on the company’s latest SN50 inference chip. Intel is also contributing to SambaNova’s current funding round.
This collaboration positions Intel more competitively in the AI inference space, which industry analysts identify as a rapidly expanding, higher-margin segment. The partnership demonstrates Intel’s strategic efforts to establish stronger positioning in AI hardware beyond its core CPU operations.
Regarding financial performance, Intel delivered Q4 EPS of $0.15, exceeding the consensus forecast of $0.08. Revenue reached $13.67 billion, topping analyst projections of $13.37 billion. However, revenue declined 4.2% compared to the previous year.
The forward outlook presents challenges. Intel projected Q1 2026 EPS at zero, while analysts anticipate -$0.11 EPS for the complete fiscal year. The company continues facing negative net margins and negative return on equity.
Nvidia Eyes Intel’s Turf
Additional competitive dynamics are emerging. Nvidia, following its $5 billion Intel investment in December, is now advancing into the CPU sector — territory Intel has traditionally dominated.
As artificial intelligence firms transition from model training to deployment phases, CPU requirements are increasing. Nvidia aims to capture market share in this segment.
Analyst opinions show divergence. Tigress Financial maintains a Buy rating with a $66 price objective. Conversely, Wedbush holds a Neutral stance with a $30 target. UBS established a $51 target. MarketBeat’s consensus stands at “Reduce” with a $45.74 price target, while TipRanks reports an average of $48.21 based on recent analyst coverage.
Insider transactions show mixed signals. EVP David Zinsner acquired approximately $250,000 in stock during late January. EVP April Miller disposed of $981,000 worth of shares in early February.
Institutional ownership accounts for 64.53% of INTC shares. The stock’s 50-day moving average stands at $44.26, while the 200-day moving average registers at $37.07.
The consensus analyst price target of $48.21 suggests approximately 6.67% potential upside from current trading levels.

Reports reveal that Jack Dorsey’s September 2025 in-person company event cost a staggering $68.1 million, roughly equivalent to the annual payroll for 200 employees, only to be followed five months later by layoffs slashing 40% of Block’s workforce.
The sequence of events draws criticism, sparking a broader conversation about AI, corporate culture, and fiscal responsibility. The Twitter co-founder turned Block CEO remains in the headlines over corporate strategy in Silicon Valley.
Block’s $68 Million Party, 4,000 Layoffs, and the AI Excuse: Did Jack Dorsey Just Redraw Silicon Valley’s Playbook?
According to Dorsey, the choice was between a gradual reduction that could undermine morale and a decisive, single cut that would position Block to grow “on our own terms.”
He framed the layoffs as a forward-looking pivot toward AI and agentic workflows, claiming in a company-wide note: “100 people + AI = 1,000 people.” According to the Twitter co-founder, intelligence tools paired with smaller, flatter teams enable a new, accelerated model of operations.
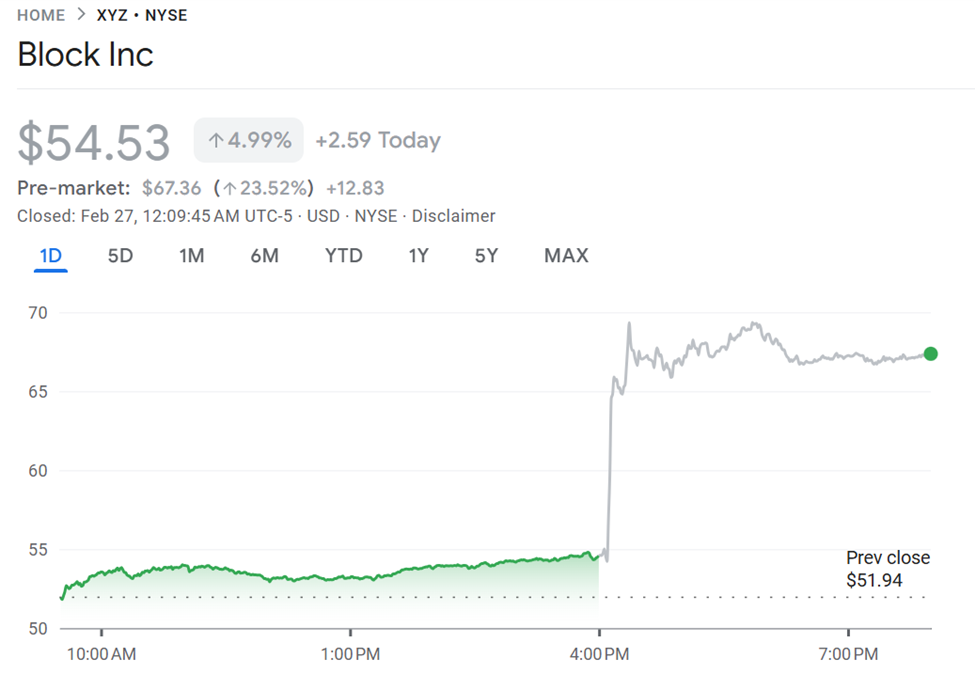
Wall Street responded with immediate approval, with Block’s XYZ stock surging 20–23% within an hour, adding approximately $6 billion in market capitalization. This translates to roughly $1.5 million in enterprise value per eliminated role.
Block’s $68 Million Party Draws Criticism
Meanwhile, Jack Dorsey has sparked outrage and debate with a spectacle that many critics say redefines corporate norms.
In September 2025, the former Twitter CEO reportedly spent $68.1 million on a Block in-person event, an amount roughly equal to the annual payroll of 200 employees.
The three-day festival in downtown Oakland featured performances by Jay-Z, Anderson .Paak, T-Pain, and Soulja Boy, and brought 8,000 employees from around the globe.
The party, recorded in Block’s own earnings as a $68.1 million increase in general and administrative expenses, has drawn widespread criticism.
Social media users described it as “psycho” and “crazy,” with some pointing to the stark contrast between celebration and accountability, particularly in light of the layoffs that followed.
To some, the spectacle of the $68 million party followed by mass layoffs sends a troubling message about priorities and managerial judgment.
It highlights the dangers of pandemic-era overexpansion and executive indulgence, with some critics arguing that the layoffs were a correction of years of overhiring and mismanagement.
“Yes, we over-hired during COVID because I incorrectly built 2 separate company structures (Square & Cash App) rather than 1, which we corrected mid-2024. But this misses all the complexity we took on through lending, banking, and BNPL. And that we’re now targeting $2M+ gross profit per person, 4x our pre-COVID efficiency, which stayed flat at ~$500k from 2019 until 2024. We have and do run an efficient company… better than most,” Dorsey responded.
Meanwhile, others see the layoffs as AI-washing, a convenient cover for structural inefficiencies.
“Sam Altman previously stated that ‘some firms are attributing job cuts to AI, when in reality, those layoffs were already planned or would have occurred regardless.’ He describes this, along with other exaggerations of AI capabilities, as “AI washing”… a tactic aimed at masking business issues. Just saying,” noted Graham Stephan.
Notwithstanding, Coinbase’s first CTO, Balaji Srinivasan, suggests that it signals a broader shift in tech toward AI-driven productivity and smaller teams.
Block’s severance packages, including 20 weeks’ pay, six months of healthcare, equity, and $5,000 in transition support, were generous by tech standards.


Trescon marks 10 years, delivering 500+ government-backed events and scaling from Bengaluru to Dubai-led MEASA expansion.
Summary
- Founded in 2016 in Bengaluru, Trescon now runs 500+ events across 10+ countries, connecting 250k+ attendees and 3.5k+ investors.
- Dubai FinTech Summit under Dubai Future Finance Week has grown past 9,000 participants, cementing Trescon as a key DIFC partner.
- The firm is expanding from Dubai into Riyadh, Saudi, ASEAN and African markets with new AI, cybersecurity, STEM and deeptech platforms.
Trescon, a business events company, has marked its 10-year anniversary as a provider of government-backed business platforms in the Middle East and North Africa region, the company announced.
The company was founded in Bengaluru in 2016 by Mohammed Saleem, Mithun Shetty and Swarnavo Roy, according to company records. Trescon established its UAE office in 2021, designating Dubai as its regional headquarters.
The firm currently manages four events within Dubai Future Finance Week, organized by the Dubai International Financial Centre (DIFC): Dubai FinTech Summit, Future Sustainability Forum, Future Islamic Finance Forum, and Reg3 Forum, according to the company.
The Dubai FinTech Summit has grown to more than 9,000 participants, according to event data. Trescon has also provided services for government initiatives including the World Police Summit organized by Dubai Police and Dubai Future Forum organized by Dubai Future Foundation.
Over the past decade, the company has delivered more than 500 events globally across 10-plus countries, attracted over 250,000 attendees, generated more than 1 million business connections, and engaged over 3,500 investors, according to company figures.
The company’s leadership team includes Madhukar Dudda, Ummer Shameem, Sanjiv Singh, Anil Kumar, Edward Maben, Christine Davidson, Vimal Bhat and Naveen Bharadwaj, who oversee more than 250 professionals across international offices, according to the company.
“With government-entrusted flagship platforms, delivery must be flawless. At this level, the organiser’s credibility and the government’s reputation are inseparable,” Mohammed Saleem stated.
The company has expanded operations to Riyadh and is pursuing growth in Saudi Arabia, Indonesia, Malaysia, and African markets including Mauritius, according to the announcement. Trescon is developing platforms focused on artificial intelligence, cybersecurity, STEM and deeptech sectors.
“As we enter our second decade, we are scaling that framework across high-growth economies aligned with future technologies, sustainability and capacity building,” Naveen Bharadwaj stated.
Trescon operates with six business divisions across seven global offices. The company’s portfolio includes managed events under Dubai Future Finance Week, alongside event brands including World AI Show, HODL, DATE, CARE for Sustainability and the World FinTech Show, according to company information.
The company focuses on mid-to-large scale leadership platforms, typically hosting 3,000 to 10,000 senior stakeholders, according to its business model description.
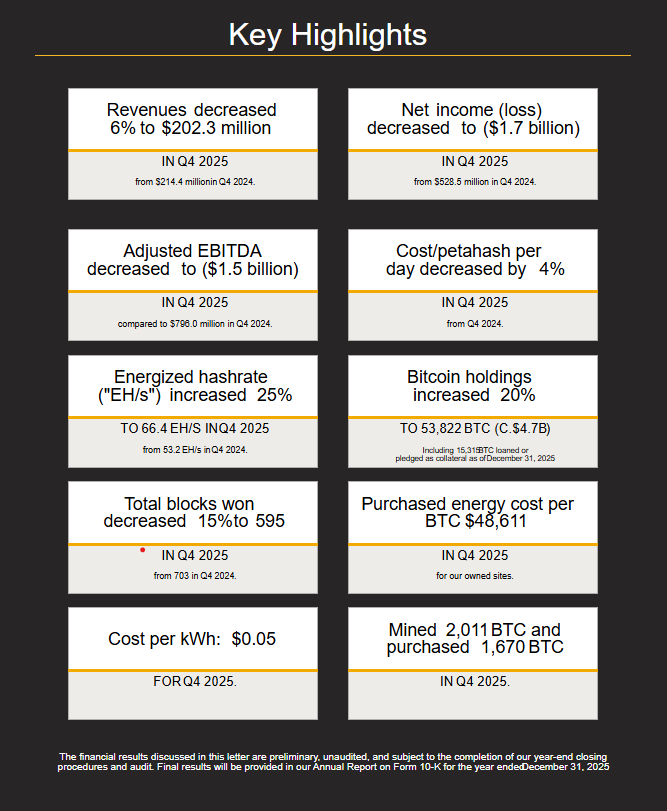
MARA Holdings (MARA) reported a fourth quarter 2025 net loss of $1.71 billion, or $4.52 per diluted share, compared with net income of $528.3 million, or $1.24 per diluted share, in the same period a year earlier.
Its shareholder letter filed with the US Securities and Exchange Commission (SEC) said revenue in Q4 fell 6% to $202.3 million from $214.4 million in Q4 of 2024, as a lower average Bitcoin (BTC) price outweighed the impact of a higher hashrate.
For the full year 2025, Marathon booked a net loss of $1.31 billion, compared with net income of $541 million in 2024, even though its revenue rose to $907.1 million from $656.4 million a year earlier.

The company said that its Q4 net income was hit by a $1.50 billion negative change in the fair value of digital assets and digital assets receivable, reflecting the decline in Bitcoin’s price from around $114,300 on Sept. 30 to roughly $88,800 on Dec. 31, according to data from CoinGecko.
The company’s share price also took a beating, with MARA stock down 46% in the past six months.

On the production side, Marathon said that it mined 2,011 BTC in Q4 2025, down 6% from 2,144 BTC in the prior quarter and 2,492 BTC in the year-earlier period, and 8,799 BTC for the full year, compared with 9,430 BTC in 2024.
Related: Bitdeer sells all Bitcoin, Metaplanet rejects misconduct claims: Asia Express
The company said that it ended 2025 holding 53,822 BTC, including 15,315 BTC loaned or pledged as collateral, with its balance sheet BTC valued at about $4.7 billion at a quarter‑end spot price of $87,498 per coin.
Marathon’s AI and high‑performance compute push
Alongside the numbers, Marathon used its Q4 shareholder letter to outline a multi‑year shift “from a pure‑play Bitcoin miner into an energy and digital infrastructure company,” announcing a strategic joint venture with Starwood Digital Ventures to develop artificial intelligence (AI) and high‑performance compute (HPC) data centers at its power‑rich sites.
Marathon said that the Starwood partnership was designed to support more than 1 gigawatt of IT capacity in its initial phase, with a roadmap that could extend above 2.5 gigawatts over time, and giving Marathon the option to invest up to 50% in individual projects while continuing to mine where power remains attractive.
The company also highlighted its acquisition of a 64% stake in Exaion in February to target “sovereign‑grade” and enterprise AI deployments.
Miners diverge on strategy as drawdown bites
Marathon’s hybrid approach comes as other major miners continue to experiment with different playbooks in response to the latest Bitcoin drawdown.
Hut 8 reported a fourth‑quarter net loss of $279.7 million on Wednesday, as it leans into a $7 billion AI data center lease, while Trump‑backed American Bitcoin reported a $59.5 million Q4 2025 loss on Thursday, yet continues to double down on its mine-and-hoard BTC model.
Magazine: South Korea gets rich from crypto… North Korea gets weapons
Mum in stitches after nursery’s solution for telling identical twins apart

Cash pledges WA Liberal GST support

Hedera price eyes bullish crossover as stablecoin activity fires up, will it break out?


-

 Politics5 days ago
Baftas 2026: Awards Nominations, Presenters And Performers
-

 Fashion7 days ago
Weekend Open Thread: Boden – Corporette.com
-

 Sports4 days ago
Women’s college basketball rankings: Iowa reenters top 10, Auriemma makes history
-

 Politics4 days ago
Nick Reiner Enters Plea In Deaths Of Parents Rob And Michele
-

 Business3 days ago
True Citrus debuts functional drink mix collection
-

 Politics9 hours ago
ITV enters Gaza with IDF amid ongoing genocide
-

 Crypto World3 days ago
XRP price enters “dead zone” as Binance leverage hits lows
-

 Business5 days ago
Mattel’s American Girl brand turns 40, dolls enter a new era
-

 Business5 days ago
Law enforcement kills armed man seeking to enter Trump’s Mar-a-Lago resort, officials say
-

 Tech3 days ago
Unsurprisingly, Apple's board gets what it wants in 2026 shareholder meeting
-
 NewsBeat1 day ago
Manchester Central Mosque issues statement as it imposes new measures ‘with immediate effect’ after armed men enter
-

 NewsBeat1 day ago
Cuba says its forces have killed four on US-registered speedboat | World News
-
 NewsBeat4 days ago
‘Hourly’ method from gastroenterologist ‘helps reduce air travel bloating’
-

 Tech5 days ago
Anthropic-Backed Group Enters NY-12 AI PAC Fight
-

 NewsBeat5 days ago
Armed man killed after entering secure perimeter of Mar-a-Lago, Secret Service says
-

 Politics5 days ago
Maine has a long track record of electing moderates. Enter Graham Platner.
-
 NewsBeat2 days ago
Police latest as search for missing woman enters day nine
-

 Business1 day ago
Discord Pushes Implementation of Global Age Checks to Second Half of 2026
-

 Crypto World2 days ago
Entering new markets without increasing payment costs
-

 Business13 hours ago
Only 4% of women globally reside in countries that offer almost complete legal equality