
Crypto World
Another 80% Crash Comes Next?
Are SHIB bulls about to face another massive setback?
Shiba Inu (SHIB) has lately been a pale shadow of its former self, with its valuation tumbling by double digits in a matter of weeks.
According to some analysts, the bad days for the bulls might be just starting.
Devastating Crash Ahead?
As of press time, SHIB trades at around $0.000006127, representing a 20% decline on a 14-day scale. Its market cap slipped to around $3.6 billion, making it the 30th-biggest cryptocurrency. Recall that it ranked much higher in the spring of last year when the capitalization neared $10 billion.
One popular analyst who touched upon the meme coin’s downfall is Ali Martinez. He claimed that the recent drop below $0.00000667 could have opened the door to a much deeper collapse to as low as $0.00000138. Such a move south would represent a whopping 77% crash from current levels.
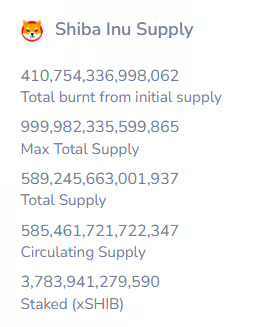
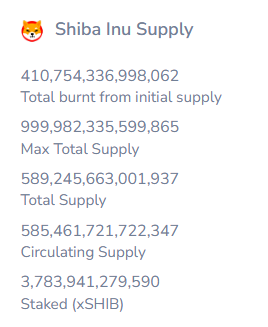
Several key indicators also suggest that SHIB’s price could be headed for a further plunge. Over the past 24 hours, the Shiba Inu team and community have burned a negligible 483 coins, representing a 99% decline from yesterday’s figure.
The ultimate goal of the mechanism, adopted in 2022, is to reduce the meme coin’s overall supply, potentially making it more valuable in time (assuming demand remains constant or heads north). Data shows that the current circulating supply is roughly 585.46 trillion tokens after more than 410.7 trillion SHIB have been scorched over the years.
Meanwhile, Shibburn – the X account spreading information about the recent token burns – has been inactive lately. The last update on the matter, from January 9, showed that the daily and weekly burn rates have been unimpressive.
You may also like:
Shiba Inu’s Relative Strength Index (RSI) supports the bearish scenario. Over the past few hours, the metric’s ratio exceeded 70, indicating the asset is overbought and could be gearing up for a pullback. The technical analysis tool ranges from 0 to 100, where readings between 30 and 70 are considered neutral, whereas anything below 30 may be viewed as a buying opportunity.

Can the Bulls Return?
Contrary to Martinez’s grim prediction, the analyst who goes by the X moniker Vuori Trading argued that SHIB may explode in the foreseeable future.
They claimed that the asset remains in the “bear trap” stage, characterizing the setup as “pure manipulation before shooting higher.” The analyst set a target of “at least” $0.00014, which would be an all-time high and represent a staggering 2,200% increase from the ongoing valuation.
Despite the recent price plunge, SHIB investors don’t appear to be rushing to sell. In fact, CryptoQuant’s data shows that the number of coins stored on exchanges has declined over the past month. This trend signals a shift toward self-custody and reduces immediate selling pressure.

SECRET PARTNERSHIP BONUS for CryptoPotato readers: Use this link to register and unlock $1,500 in exclusive BingX Exchange rewards (limited time offer).

Crypto World
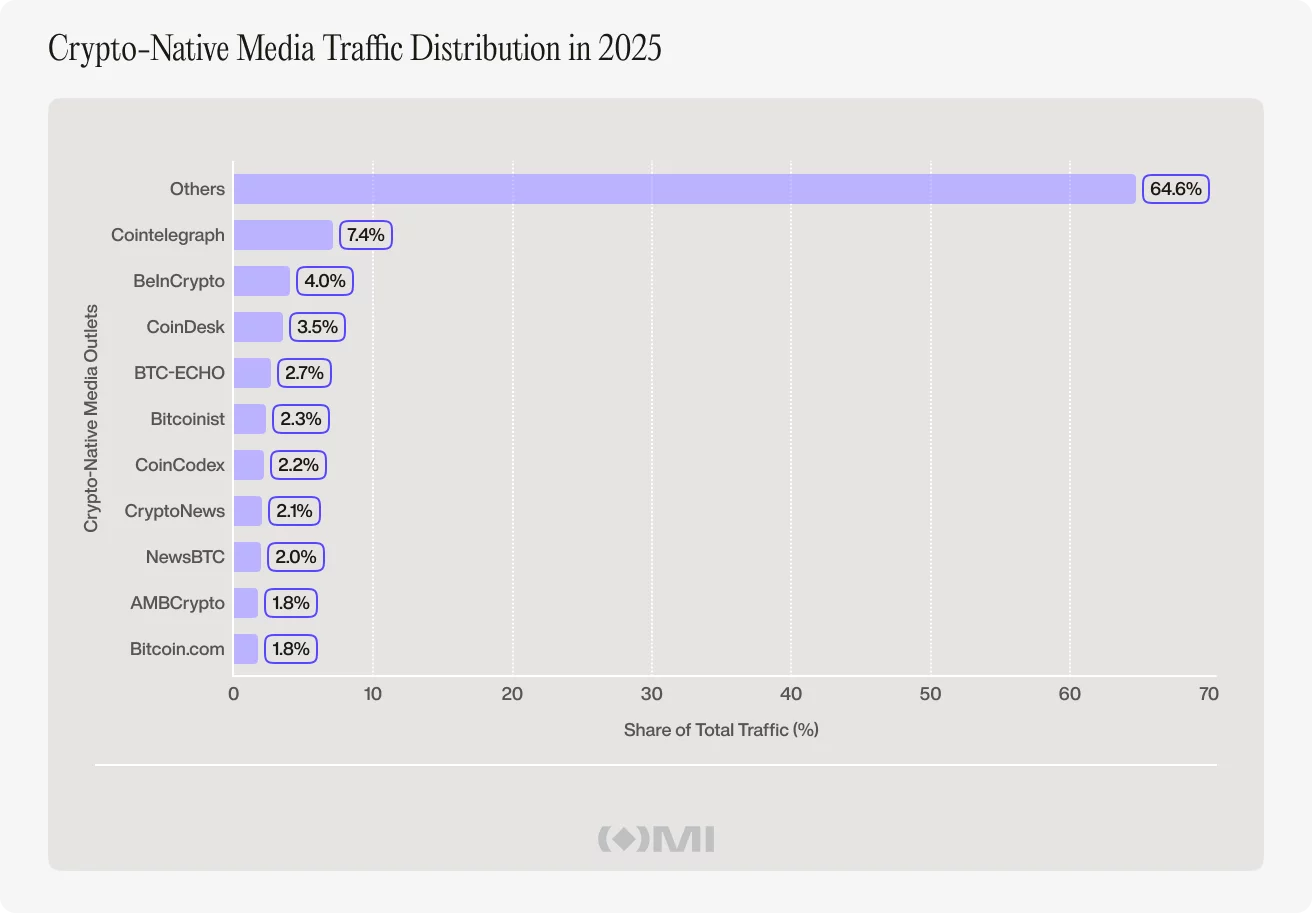
Crypto-native media lost 33% of traffic in 2025 as crypto became easier to follow without it
Disclosure: The views and opinions expressed here belong solely to the author and do not represent the views and opinions of crypto.news’ editorial.
Last year, traffic to crypto-native media fell even as activity across the crypto economy remained strong: stablecoin liquidity expanded, USDT transfer volume surged, and on-chain trading stayed active.
Rather than pointing to fading interest in crypto, the divergence suggested that people were increasingly following and using the industry through channels beyond specialist media.
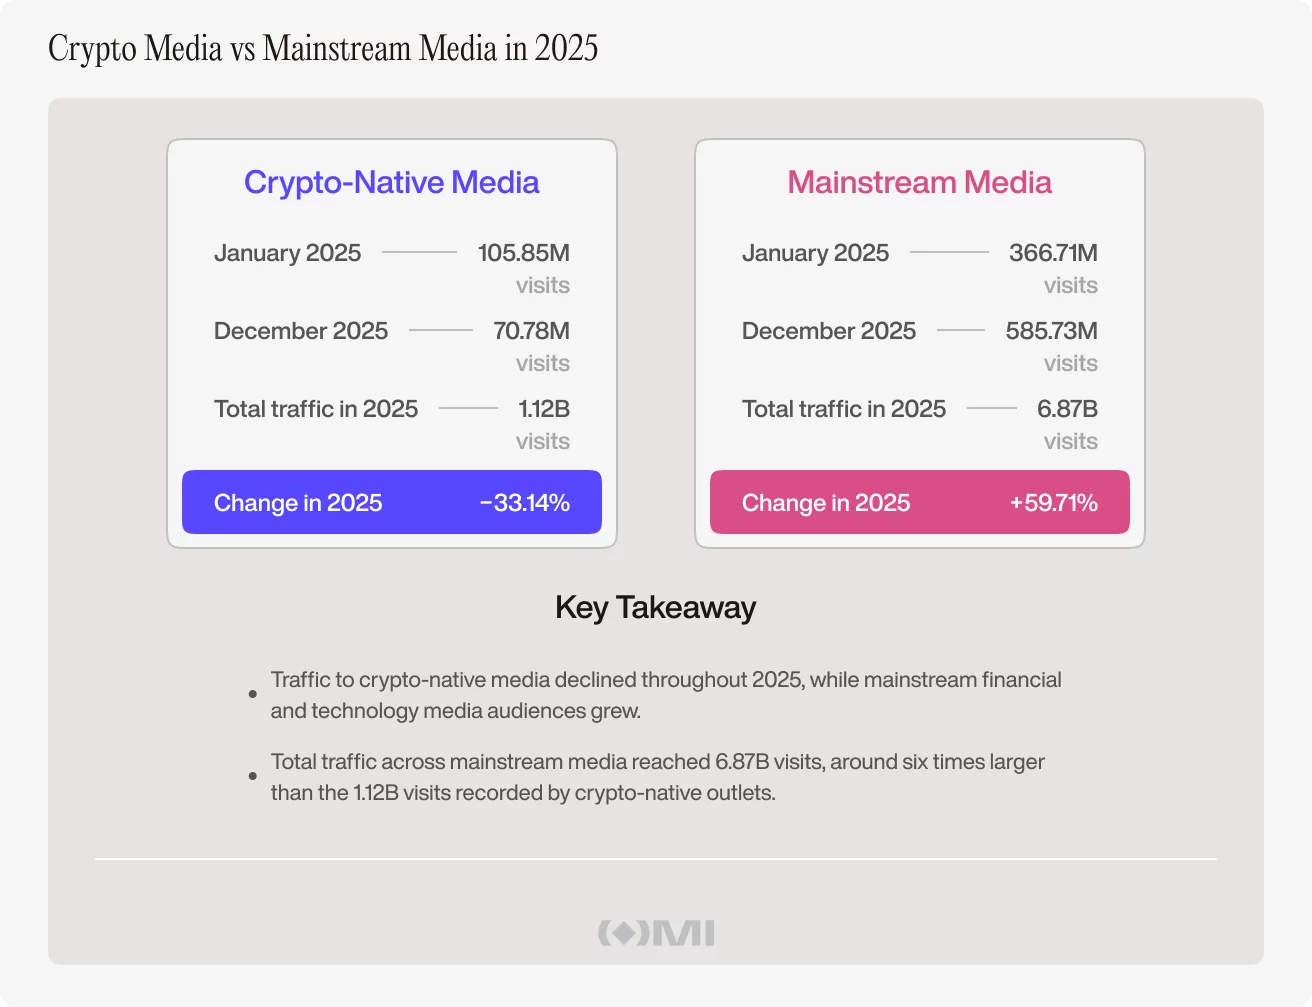
Our recent Outset Data Pulse report, built on traffic data from Outset Media Index, showed that across crypto-native outlets, global visits reached 1.12 billion in 2025, but monthly traffic moved steadily lower as the year progressed. It started at 105.85 million visits in January and ended at 70.78 million in December.
There were temporary rebounds, including a notable jump in July, but not enough to change the broader trend. By the fourth quarter, crypto-native traffic was sitting at its weakest levels of the year.
On-chain growth continued even as media traffic fell
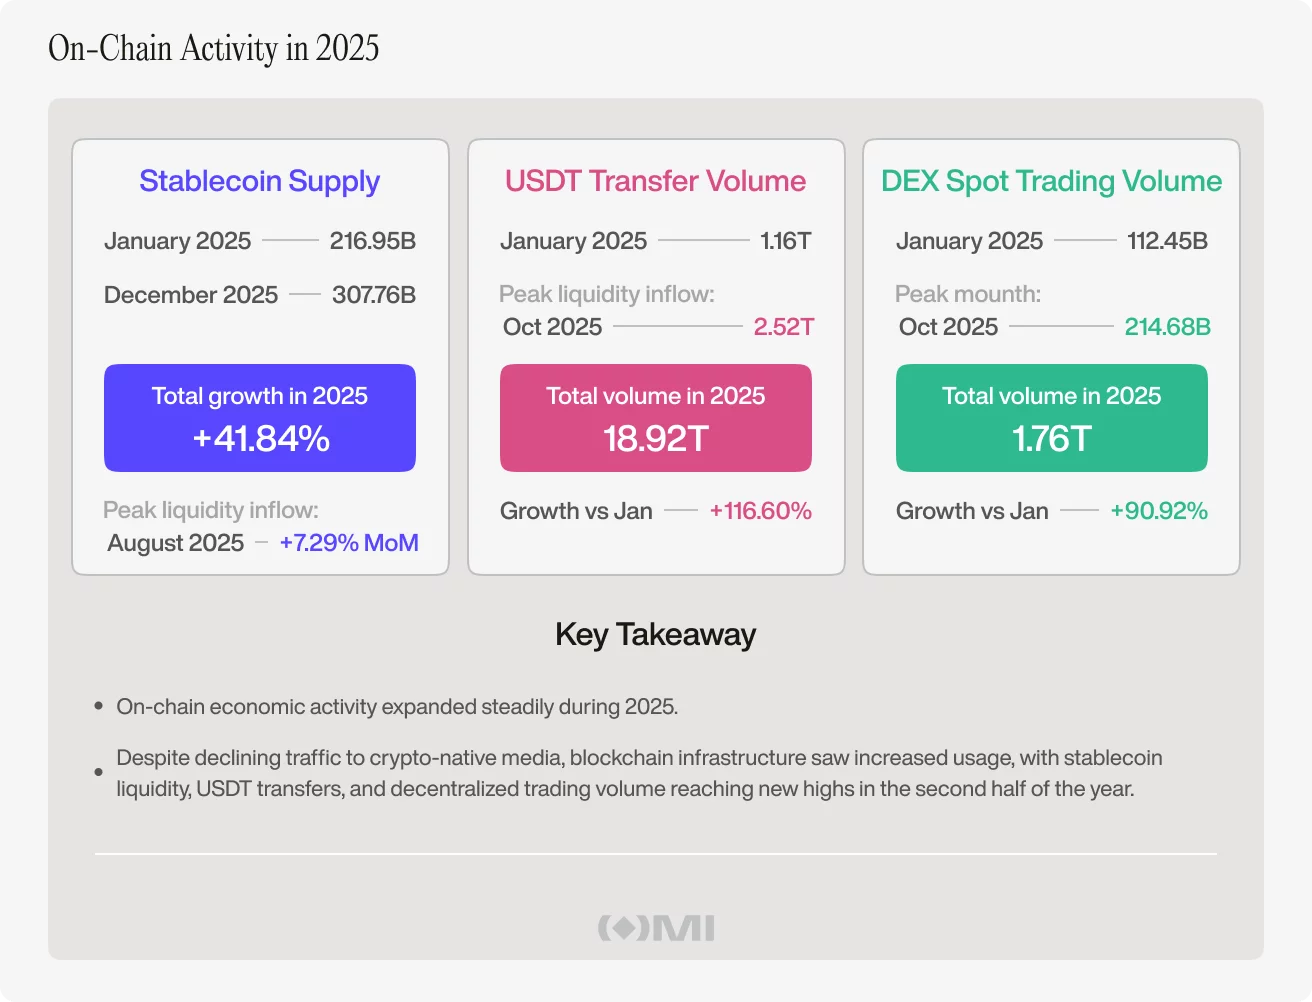
While media traffic declined, there was an expansion of the on-chain economy. Stablecoin supply, one of the cleanest ways of tracking liquidity inside crypto, rose from $216.95 billion in January to $307.76 billion by December.
That disconnect became clearer in the underlying market data. Tether’s USDT transfer volume, a common proxy for how much value is moving across blockchain networks, soared in the second half and reached $18.92 trillion for all of 2025.

Decentralized exchange spot volume also climbed to $1.76 trillion and hit its yearly peak in October, showing that trading activity on-chain remained strong. Taken together, the data pointed to three things rising at once: more liquidity in the system, more money moving through it, and more trading happening directly on-chain.
Taken together, this was an active market, not a shrinking one. In other words, crypto-native media traffic fell when money, settlement activity, and trading continued to move through the crypto ecosystem at scale.
Crypto became easier to follow outside crypto media
Financial technology and general news outlets that include crypto in their coverage generated 6.91 billion visits in 2025. Their traffic also grew sharply during the year, rising from 366.71 million visits in January to 585.73 million in December. That alone suggests crypto lives inside a wider media environment than it once did.
Naturally, it is wrong to assume every mainstream visit was for a crypto story. But it does mean crypto no longer needs its own niche ecosystem in the same way it once did.
A few years ago, specialist crypto publications served as the default entry point into the industry. Articles explained the basics, simplified complex developments, and tracked market sentiment. They helped readers figure out what mattered most. Anyone who wanted to keep up with the sector would typically check out a crypto-native outlet first.
That competitive advantage has weakened, not because crypto got less important, but because crypto got easier to interact with elsewhere.
Today, a reader can follow crypto developments through mainstream finance coverage, follow their favourite projects and individuals on X, watch podcasts and interviews on YouTube, interact with fellow enthusiasts on Telegram, and more.
Crypto participation no longer depends on crypto media traffic
What this means is crypto-native outlets no longer have the monopoly on attention they once enjoyed. The structure of crypto media itself also matters. The top ten crypto-native outlets accounted for just a quarter of total traffic in 2025, with smaller publications making up the rest.
It is a crowded and decentralized landscape where no single player dominates and attention is dispersed across a large number of brands. That fragmentation made sense when crypto media was the centre of the industry’s information flow.
But now it exists alongside far more competition than just other crypto sites. It competes with finance media, tech media, creators, aggregators, trading interfaces, and the networks themselves.
Just as importantly, crypto-native media traffic and blockchain activity did not move together in any clean way. The analysis did not find a consistent one-month lead or lag relationship between the two. Rising on-chain activity did not reliably follow rising media traffic. Nor did rising media traffic reliably predict stronger blockchain usage in the following month.
That suggests crypto media traffic is not a proxy for crypto participation. Traffic is an important metric. But mainstream outlets cover many subjects beyond digital currencies and assets. Their overall audiences are not the same thing as crypto readership.
Monthly data can also miss shorter attention surges that happen over hours or days. But even with that, the divergence is hard to ignore. Crypto-native traffic fell while the broader crypto economy grew.
Crypto-native media still matters, but its role is changing
Crypto-native media has not lost its value but its place in the ecosystem is definitely becoming different. As crypto gets easier to discover, talk about, and use through mainstream platforms, social media, and on-chain apps, specialist outlets matter less as the first stop and more as the place people go when they want to understand what is actually going on.
That change says something bigger about crypto too. If the industry can keep growing while specialist media traffic falls, then attention is no longer the main thing holding it up. Crypto-native media still matters – just in a different way now. Less as the centre of the market, and more as the place that helps make sense of it once the noise settles.
Disclosure: This content is provided by a third party. Neither crypto.news nor the author of this article endorses any product mentioned on this page. Users should conduct their own research before taking any action related to the company.

Ripple on Thursday introduced native digital asset capabilities inside its enterprise treasury management system, letting corporate finance teams hold, view and manage XRP and RLUSD alongside traditional fiat balances for the first time within a single platform.
The two features, called Digital Asset Accounts and Unified Treasury, are built on GTreasury, which Ripple acquired in 2025. That system processed $13 trillion in payments volume last year for clients ranging from small businesses to Fortune 500 companies. The digital asset layer adds to that existing infrastructure rather than replacing it.
Digital Asset Accounts let treasury teams create a Ripple-native digital asset account inside the platform. Balances in XRP, RLUSD, and other supported tokens appear alongside cash positions with real-time fiat valuations using live exchange rates.
Transactions are recorded automatically with native notional amounts, fiat equivalents, and market price at the time of each event, creating an audit trail without manual entry. The system captures balances at 15-decimal precision to match on-chain accuracy and eliminate rounding discrepancies that cause reconciliation problems.
Unified Treasury connects digital asset holdings from multiple external custodians through the same API connectivity layer Ripple Treasury already uses for bank integrations.
“Digital assets have arrived at the CFO’s desk, and the question has shifted from whether to engage to how to do so without disrupting existing operations,” said Renaat Ver Eecke, SVP at Ripple Treasury.
The launch positions Ripple Treasury ahead of competing TMS providers, none of which currently offer native digital asset management.
Ripple said the two features are the first in a broader digital asset framework that will expand to cross-border settlement, intercompany payments, and overnight yield on idle cash through repo markets, all powered by stablecoins.


A key figure allegedly behind the Huione network has been extradited to China, where he will face fraud and money laundering charges.
Summary
- Li Xiong, linked to the Huione network, has been extradited from Cambodia to China to face fraud and money laundering charges.
- Authorities have tied Huione Group to a vast illicit marketplace that processed over $89 billion in crypto tied to scam operations across Asia.
- Despite U.S. enforcement actions, including FinCEN restrictions, the network has continued operating through new domains and active Telegram channels.
A report from Hong Kong-based news outlet Ta Kung Wen Wei noted that Li Xiong, who was part of a group that helped scam rings in Asia launder illicit funds, was escorted back to China from Phnom Penh, Cambodia, citing a statement from China’s Ministry of Public Security on WeChat.
Xiong was a core member of the Chen Zhi criminal syndicate, according to the report, and had previously served as chairman of Huione Group, a network that supported scam centers carrying out “pig butchering” schemes and other investment frauds to extract funds from victims across the globe.
For those unfamiliar, the Huione network has been linked to one of the largest illicit online marketplaces in operation, processing more than $89 billion in cryptoassets.
Xiong’s arrest and extradition come just months after the detention of Chen Zhi, the head of Prince Group, which operated Huione Group. The U.S. Department of Justice had earlier seized over 127,000 Bitcoin tied to Zhi’s operations.
The report added that several other members of Zhi’s criminal syndicate have also been apprehended, according to statements from Chinese public officials.
Efforts to cut off Huione’s financial network have been underway in the U.S. over the past few years.
Last year, the U.S. Department of the Treasury’s Financial Crimes Enforcement Network labelled the group a primary money laundering concern and subsequently directed financial institutions to cut off access linked to its operations.
However, third-party reports suggest that the network has resurfaced under new domains and continues to operate across platforms such as Telegram, maintaining activity despite enforcement pressure.


The crypto market has started tanking once again, dropping 2.6% to 2.37 trillion as US President Donald Trump announced that the U.S. campaign against Iran would be entering a final phase over the coming weeks to end the conflict once and for all.
Summary
- Crypto market fell 2.6% to $2.37 trillion as escalating U.S.–Iran tensions triggered risk-off sentiment across global markets.
- Rising oil prices above $100 fueled inflation fears, reducing expectations of Fed rate cuts and adding pressure on risk assets.
Bitcoin (BTC), the world’s largest crypto asset, fell over 4% to $66,250 amid souring market sentiment over a potential drop to $65,000, which many consider the last line of defense for a potential recovery.
Ethereum (ETH) was down 3.4%, approaching the $2,000 support, while other major crypto assets such as XRP (XRP), BNB (BNB), Solana (SOL), and Dogecoin (DOGE) posted losses between 2% and 6%. The majority of the top 100 crypto assets also shared the downward trend in the red.
As crypto prices fell, they triggered over $420 million in liquidations across leveraged markets as traders unwind their positions. The majority of this tally came from long liquidations, which saw $255 million wiped out, with Bitcoin and Ethereum accounting for around $64 million in long liquidations each, which accelerated the selloff.
The Crypto Fear and Greed Index, which shows market psychology, fell by 5 points to 27, showing increasing fear and anxiety in the market as investors expect more volatility.
Crypto prices began slipping downwards shortly after Trump said in an address to the nation on Wednesday that the U.S. military is going to hit Iran extremely hard over the coming 2 to 3 weeks to try to secure a decisive win in the ongoing war in the Middle East.
Trump warned that the U.S. would target Iranian energy infrastructures if no deal is reached. He also urged Gulf countries like Saudi Arabia, the UAE, and his allies in the region to pressure Tehran to relinquish control over the Strait of Hormuz.
Despite the rhetoric, Trump mentioned that discussions are ongoing for a ceasefire between both sides. Iran, for its part, has demanded a permanent end to the war, compensation for damages during the war, and the full withdrawal of U.S. military presence from the region.
The fresh threat of escalation pushed crude oil prices back above $100, leading to a broad selloff through crypto, stocks, and traditional safe-haven assets such as gold. Gold prices fell 4% to $4,590 today, while silver fell 7.5%. Asian stocks such as Japan’s Nikkei 225 were down 2.5% as investors moved to cash.
Surging oil prices are triggering fears of runaway inflation over the coming months. As such, the market expects the Federal Reserve to continue to hold interest rates steady or even hike them as they combat the inflation spike caused by oil prices.
Lower expectations for Fed rate cuts typically weigh heavily on risk assets like cryptocurrency.
Disclosure: This article does not represent investment advice. The content and materials featured on this page are for educational purposes only.
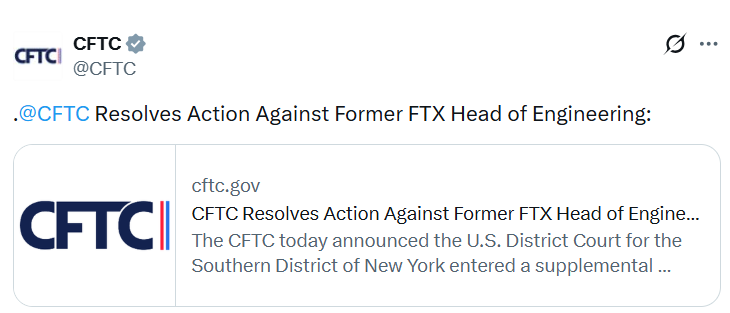
Nishad Singh, the former head of engineering at FTX, will pay $3.7 million to resolve his case with the US commodities regulator over his alleged role in the collapse of the crypto exchange and the misappropriation of user funds.
As part of the supplemental consent order, Singh will be required to pay a disgorgement of $3.7 million and imposes a five-year ban on trading in markets and an eight-year registration ban, blocking him from obtaining a license to operate in the sector, the US Commodity Futures Trading Commission (CFTC) said in a statement on Wednesday.
“The initial consent order and supplemental consent order resolve the CFTC’s enforcement action against Singh,” it added.
FTX’s bankruptcy in November 2022 sent shock waves through the crypto industry, erasing billions in market liquidity, shattering user confidence and prompting authorities to accuse its leadership of fraud.
David Miller, the CFTC’s director of enforcement, ruled out additional restitution or civil monetary penalties for now and said the current penalties reflect Singh’s cooperation with authorities.
“The defendant engaged in, and aided, significant violations of the Act and CFTC regulations as the former FTX head of engineering, and the consent orders reflect the severity of these violations,” Miller said.

“But this resolution also reflects the Commission’s commitment to rewarding and incentivizing material assistance in Division investigations,” he added.
Singh charged by multiple agencies after FTX collapse
Attorneys for Singh said he was grateful this latest matter was at an end, and were “pleased that the CFTC recognized our client’s limited role in the underlying conduct and his extensive cooperation,” according to Bloomberg.
The CFTC accused Singh of personally misappropriating millions of dollars in assets and charged him in February 2023 with two counts: fraud by misappropriation and aiding and abetting fraud committed by former FTX CEO Sam Bankman-Fried.
Related: FTX Recovery Trust to distribute $2.2B to creditors in March
In April 2023, Singh entered into the consent order, was found liable for the charges and agreed to cooperate with the commission’s investigators. The regulator originally sought a range of penalties, including restitution, civil monetary penalties and permanent trading and registration bans.
In a separate case brought by the Securities and Exchange Commission in February 2023, Singh was accused of misusing customer funds and committing fraud by misappropriation, in violation of securities laws. The case was settled in December with Singh receiving an eight-year industry ban.
After FTX collapsed, US prosecutors also indicted Singh and four of his colleagues on charges including fraud and campaign finance violations. He faced decades in prison if found guilty, but after testifying against Bankman-Fried and cooperating with prosecutors, he received time served and three years of supervised release.
Magazine: Ripple joins Singapore sandbox, Bhutan’s big Bitcoin selloff: Asia Express

The U.S. Treasury has proposed its first set of rules to implement the GENIUS Act and has opened a 60-day public comment period to define how stablecoin oversight can be handled at the state level.
Summary
- U.S. Treasury has proposed initial rules under the GENIUS Act, opening a 60-day consultation to define when state oversight of stablecoins is permitted.
- Issuers with less than $10 billion in circulation may fall under state supervision if frameworks meet federal standards, with strict reserve, disclosure, and compliance requirements in place.
Under the proposal, issuers with less than $10 billion in circulating stablecoins may operate under state supervision, provided those frameworks meet a “substantially similar” standard to federal regulations.
The proposal seeks to clarify how regulatory responsibilities will be divided as the regulation begins to take shape.
Stablecoin issuers with less than $10 billion in circulation are eligible for that route, though the flexibility comes with firm guardrails. Treasury has set out non-negotiable conditions, including full 1:1 reserve backing using cash or high-quality liquid assets, along with mandatory monthly disclosures.
Compliance with federal anti-money laundering and sanctions rules remains compulsory across all jurisdictions. The proposal also reinforces a ban on rehypothecation, preventing issuers from reusing reserves to support multiple obligations.
Meanwhile, state regulators are given room to impose stricter oversight, covering liquidity thresholds, reserve requirements, risk management standards, and enforcement mechanisms. Any framework introduced at the state level must deliver outcomes that match or exceed federal protections, rather than offering a lighter alternative.
Regulators are still working through how the GENIUS framework will align with existing money transmission laws and which agencies will oversee different parts of the market. Previous consultations have already covered areas such as digital forensic tools, tax reporting, and data collection.
Concerns remain over stablecoin yields
As previously reported by crypto.news, the legislation, signed into law by President Donald Trump in July, marked a major step in formalizing stablecoin regulation.
However, uncertainty around yield-bearing stablecoins continues to hold back progress on the broader CLARITY market structure bill.
Some industry players argue that yield-generating stablecoins could offer higher returns than traditional savings accounts, while banking groups remain concerned about potential deposit outflows.
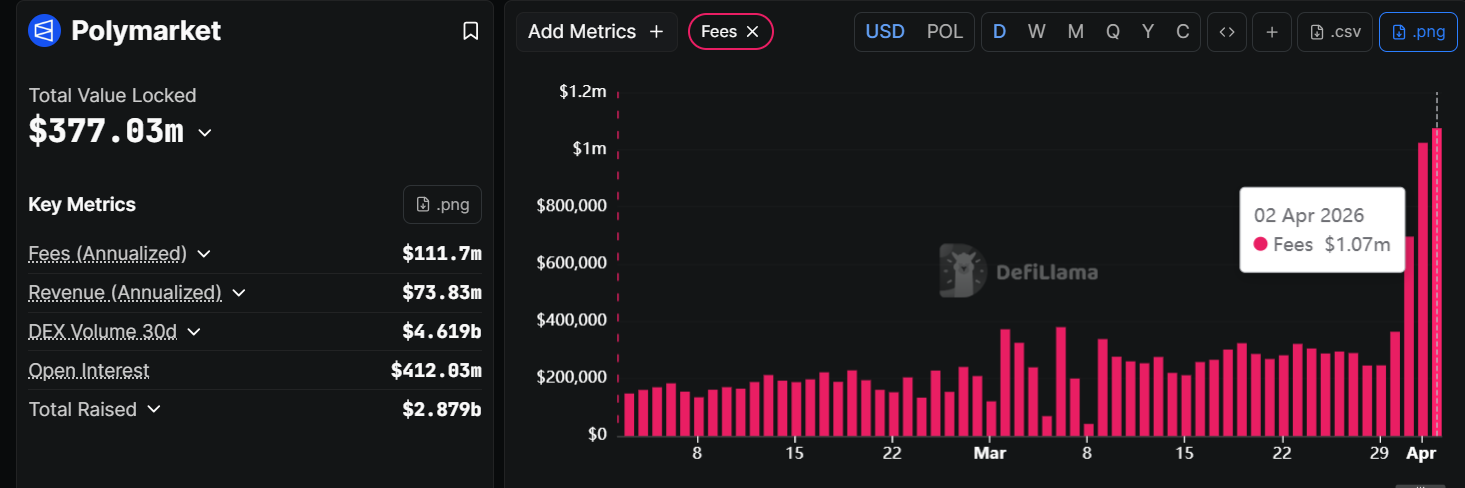
Polymarket’s daily fee revenue crossed $1 million on April 1, just two days after the platform expanded taker fees to nearly all market categories.
The surge, up from $696,000 on March 31, followed the March 30 rollout of variable taker fees across politics, finance, economics, culture, weather, and tech markets.
From Growth Play to Revenue Machine
Polymarket previously charged fees only on crypto and sports contracts. The updated structure applies a dynamic, probability-based model in which fees peak at 50% probability of the outcome and drop near the extremes.
Crypto markets carry the steepest rate at 1.80%, while sports remain the lowest at 0.75%.
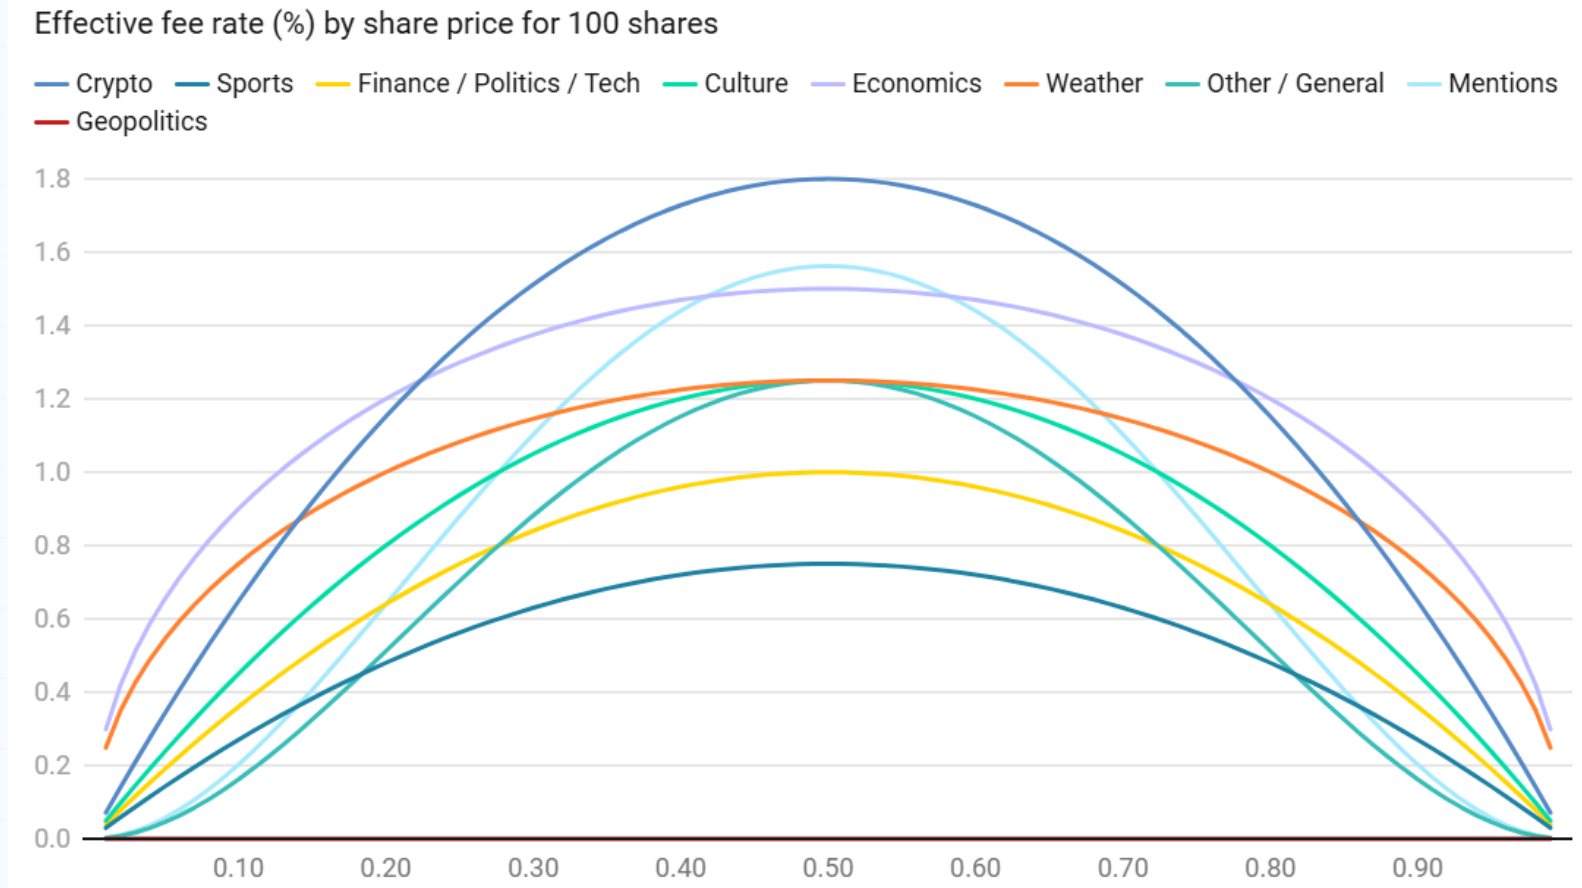
Makers pay nothing. Instead, they receive daily USDC rebates of 20% to 25% of collected fees, depending on the category. Geopolitics and world events remain entirely fee-free.
On-chain analyst DefiOasis noted that April 1 fees reached $927,000 on Dune Analytics, translating to an annualized run rate of roughly $338 million.
“The latest full single-day fee on April 1 was $927,000, and it is expected that single-day fees could exceed $1 million in the coming days. Based on the April 1 single-day fee, Polymarket’s annualized equivalent reaches $338 million,” the analyst noted.
DefiLlama data placed the figure even higher, at $1.07 million.
Competition Heats Up Across Chains
The fee shift arrives as prediction markets draw new entrants. Binance Wallet began beta-testing an in-app prediction feature through Predict Fun (Predict.fun), a BNB Smart Chain protocol that saw $7.68 million in net inflows on a single day after the integration.
Predict Fun’s open interest rebounded to $23 million, according to DefiOasis.
Monthly prediction market volume now exceeds $20 billion industrywide.
The sector’s rapid monetization, from Polymarket’s fee expansion to Kalshi’s reported $1.5 billion annualized run rate, signals a broader transition from subsidized growth to sustainable revenue.
Whether Polymarket can sustain above $1 million in daily fees will depend on trading volume resilience as takers adjust to the new cost structure.
The post Polymarket’s Fee Overhaul Pushes Daily Revenue Past $1 Million appeared first on BeInCrypto.


Bitcoin price drifted closer to a key support zone near $65,000 after Donald Trump signaled that military action in the Middle East is set to continue over the coming weeks.
Summary
- Bitcoin slipped toward the $65,000 support zone after Trump signaled continued military action in the Middle East.
- Oil prices climbed back above $100, adding pressure on risk assets as traders reacted to renewed geopolitical tensions.
Addressing the nation from the White House on Wednesday, Trump said U.S. forces are nearing the final stages of “Operation Epic Fury,” describing it as a campaign that has already crippled large parts of Iran’s nuclear and naval infrastructure.
Even so, the tone of the address left little room for de-escalation in the short term.
“We are on track to complete all of America’s military objectives shortly,” he said, before adding that the U.S. would “hit them extremely hard over the next 2 to 3 weeks.”
Markets reacted quickly. Oil prices reversed earlier softness and climbed back above the $100 mark, reflecting renewed concern over supply disruptions tied to the Strait of Hormuz. The move fed into broader unease, with equities and digital assets slipping as traders reassessed geopolitical risk.
Bitcoin (BTC), which had shown signs of stabilizing earlier in the week, extended its decline, dropping over 2% since Trump took the stage. Price action hovered just above $66,500 at last check, with buyers attempting to hold the $65,000 region that has repeatedly acted as a near-term floor.
A sustained break below it would weaken the current structure and open the door toward the $60,000 range, an area that previously drew in demand during earlier pullbacks. Market participants have treated this zone as a key inflection point, where downside momentum either stalls or accelerates.
At the same time, diplomatic channels have not been fully shut. Trump has acknowledged that discussions are ongoing, even as military pressure builds.
Washington has continued to push for Iran to dismantle its nuclear program and allow greater oversight of its facilities, alongside restoring open commercial shipping routes. Tehran, on the other hand, has called for a permanent ceasefire, compensation for damages, and a complete withdrawal of U.S. forces from the region.
Looking ahead, Trump maintained that the disruption to global energy flows may not last indefinitely. He argued that Iran would eventually ease restrictions on oil movement as it looks to rebuild.
“When this conflict is over, the strait will open up naturally,” he said, adding that oil would resume flowing and gas prices would fall as economic activity picks up again.
Any meaningful de-escalation could offer relief to risk assets, including Bitcoin, as lower energy costs and reduced geopolitical tension tend to support liquidity conditions. Until then, markets remain sensitive to headlines, with crypto trading closely tied to shifts in oil prices and broader macro signals.
Crypto World
XRP Price Holds $1.35 as ETF Outflows Hit $31 Million While Pepeto Presale Fills Past $8 Million Before Listing
The xrp price holds at $1.35 with seven spot ETFs but March posting first monthly outflows at $31 million. Bitcoin flushes and altcoins struggle to find real support. The market is being reminded that volatility exposes more than just weak hands. It exposes weak infrastructure.
Pepeto is a meme coin exchange aiming to bring zero fee trading to three chains, extending meme culture with real exchange tools instead of chasing short term rotations. Today is the day that matters. The entry available right now does not exist next week, and every person who entered early in crypto made one choice: they moved today.
XRP spot ETFs posted their first monthly outflows in March at $31 million despite holding $1 billion in combined assets across seven funds, according to Bankless Times. RLUSD stablecoin growth slowed after reaching $1.3 billion market cap.
CoinDesk confirmed the xrp price is also shaped by the CLARITY Act stablecoin compromise reaching the Senate Banking Committee by mid April, with commodity classification confirmed for 16 crypto assets that could accelerate institutional flows.
Where a Meme Exchange Extends Trading With Real Tools While the XRP Price Waits
Why Pepeto Brings Zero Fee Trading to Three Chains Instead of Chasing XRP Price Rotations
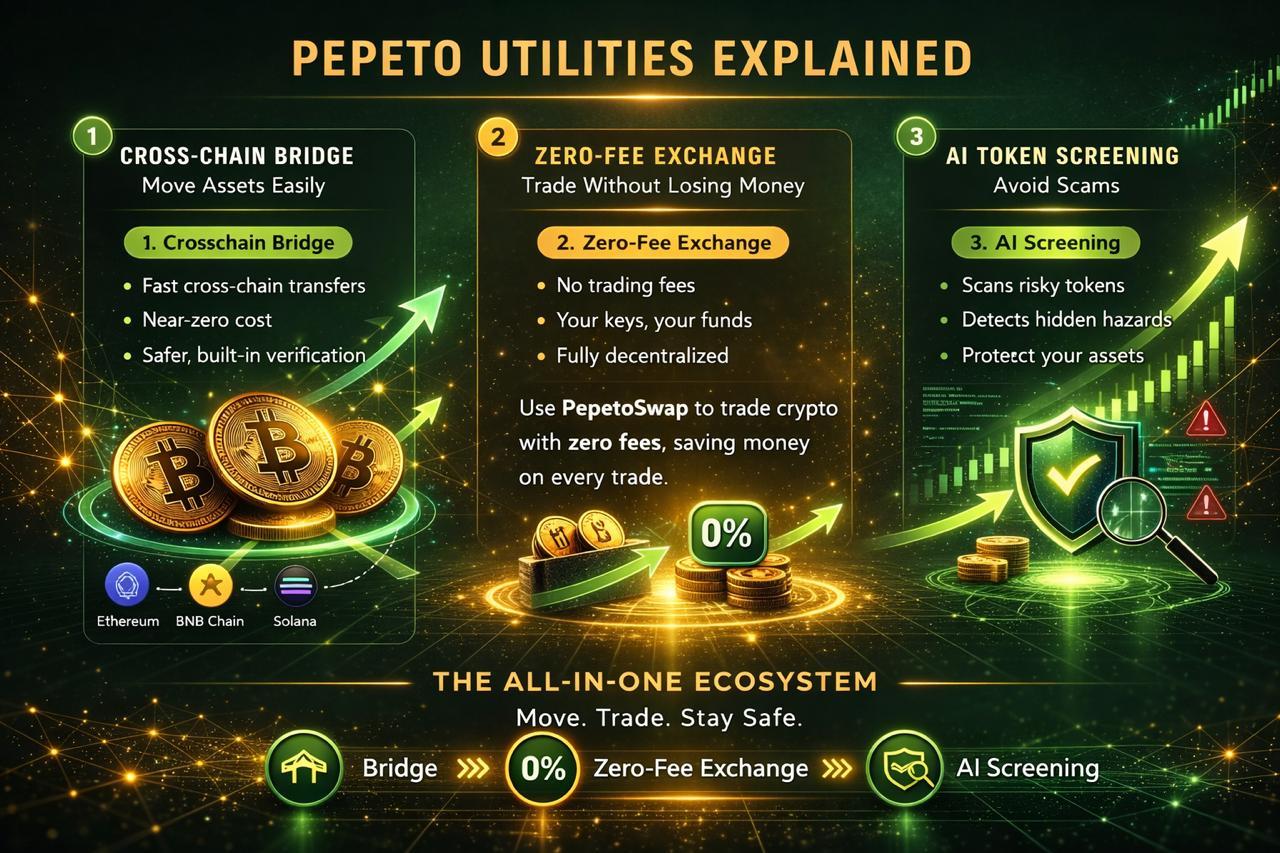
Pepeto is built around one reality: volatility exposes weak infrastructure, and exchange tools that work across three chains do not depend on any single asset’s price direction. Instead of chasing short term rotations, Pepeto extends meme culture with real exchange tools: PepetoSwap for zero fee trading, a contract screener for wallet protection, and a bridge connecting Ethereum, BNB Chain, and Solana at zero cost. The architect behind the original $11 billion Pepe coin partnered with a former Binance expert to build this.

Staking at 189% APY adds a yield component XRP cannot offer during periods of stress. The SolidProof audit proves the contracts are safe, and $8 million entering at $0.000000186 while the index read 8 adds a conviction signal that XRP ETF outflows cannot match. The 420 trillion supply matches what took PEPE to $11 billion.
Today is the day that matters. The entry available right now does not exist next week. Every person who entered early in crypto made one choice: they moved today instead of planning to come back tomorrow. Analysts project 100x from presale to Binance listing, and one day of hesitation means one day closer to the listing price replacing what is available.
XRP Price Prediction: Targets, Levels, and CLARITY Act Impact for 2026
XRP trades at $1.35 on April 1 according to CoinMarketCap, locked between $1.29 and $1.60 after March’s first monthly ETF outflows at $31 million. RLUSD passed $1.3 billion market cap but growth stalled.
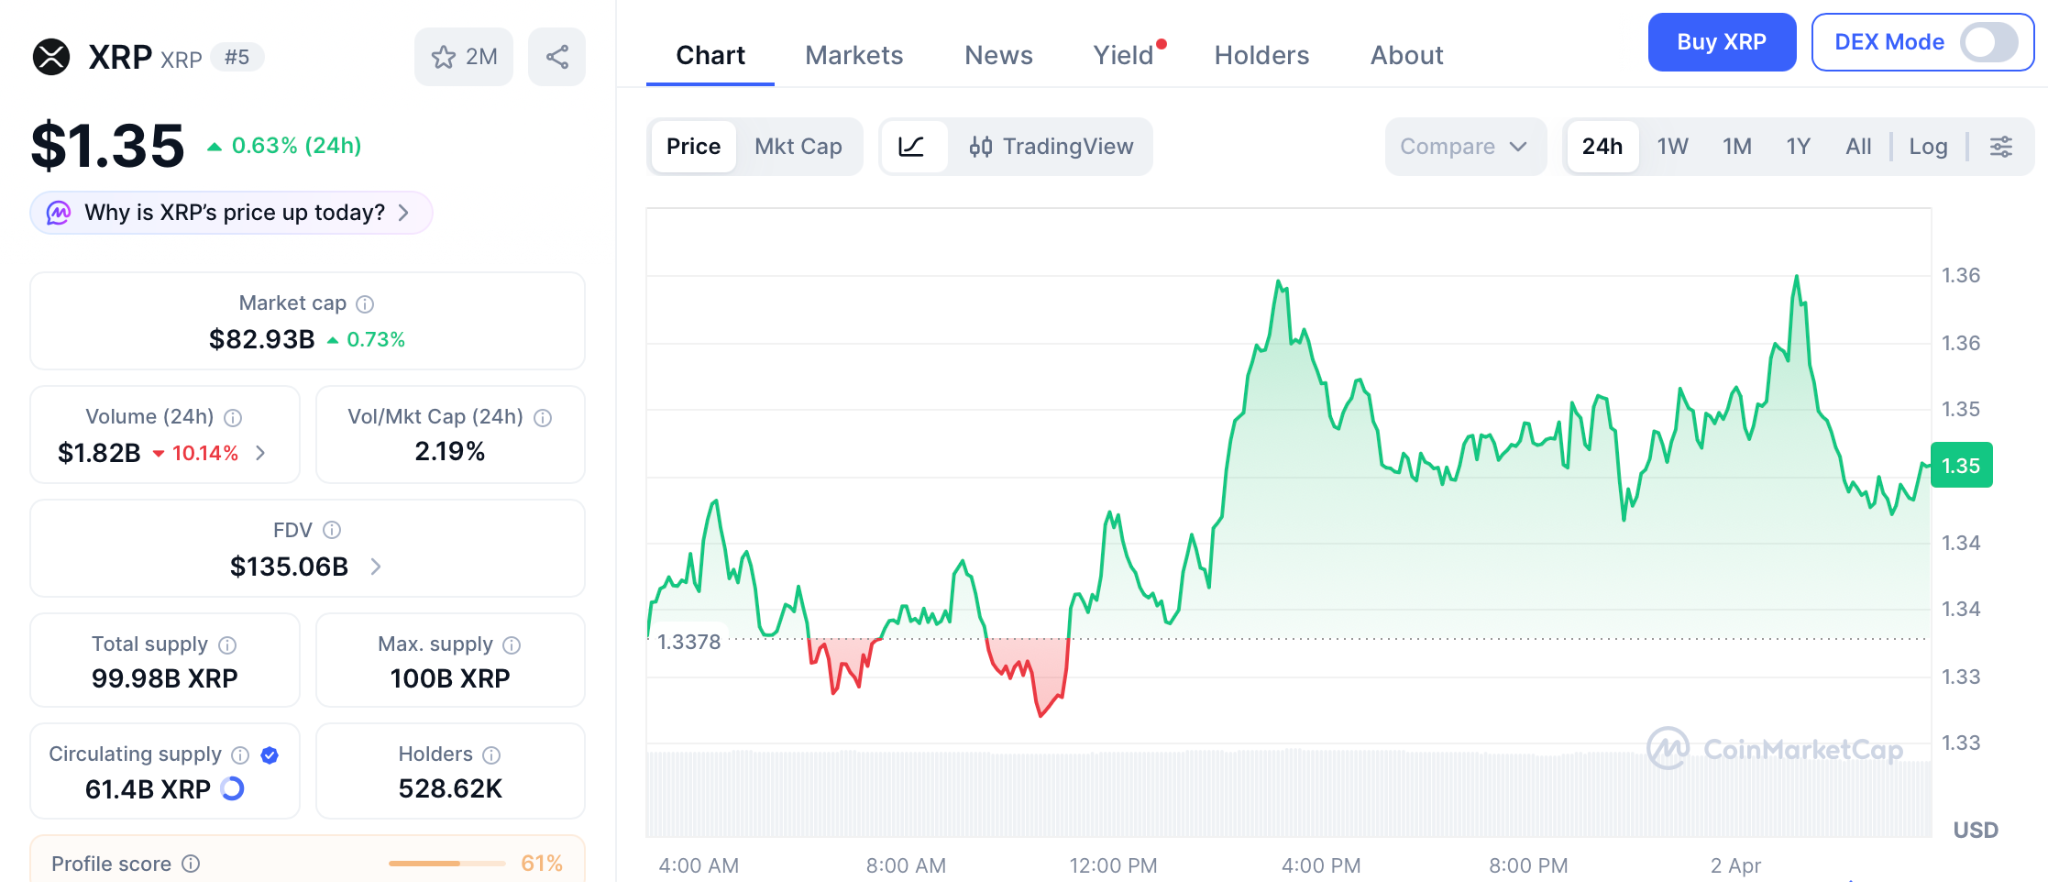
The CLARITY Act stablecoin compromise targets a Senate markup by mid April, and passage could give XRP full commodity status alongside BTC and ETH. Support sits at $1.29, and a break below opens $1.10. Resistance at $1.60 needs to break for the rally toward $2 to begin.
Standard Chartered maintains its $8 year end target. From $1.35, reaching $5 gives 275% and reaching $8 gives 500%, both over quarters that depend on legislative timing nobody controls while the presale compresses 100x into one listing.
The XRP Price Waits for Legislation, but Today Is the Day That Matters for the Presale
Today is the day that matters. The entry available right now does not exist next week. The xrp price waits for the CLARITY Act and ETF flows to reverse, but Pepeto does not wait because exchange tools earn from every trade in every condition. The Pepeto official website shows more than $8 million with stages filling faster each round.
Entering today while the Binance listing approaches is how the one decision that separates winners gets made, and choosing to come back tomorrow could mean the stage is full, the price is higher, and the cost of one day becomes the number that echoes through the rest of this cycle.
Visit Pepeto today before this presale stage closes and the Binance listing erases the entry that only exists right now.
Click To Visit Pepeto Website To Enter The Presale

FAQs
What is the xrp price on April 1 2026?
XRP trades at $1.35 with support at $1.29 and resistance at $1.60. Standard Chartered targets $8 year end if the CLARITY Act passes mid April.
How do ETF outflows affect the xrp price?
March posted first monthly outflows at $31 million. The Pepeto official website shows capital entering during fear while XRP ETFs face redemptions.
Is Pepeto a better entry than XRP right now?
XRP targets 275% to 500% over quarters. Pepeto targets 100x from presale to listing with zero fee exchange tools and a SolidProof audit behind the same cofounder.
Disclaimer: This is a Press Release provided by a third party who is responsible for the content. Please conduct your own research before taking any action based on the content.


Bitcoin fell 2.2% to $66,609 on Wednesday, giving back Tuesday’s gains after Trump’s primetime address to the nation promised to hit Iran “extremely hard” over the next two to three weeks rather than offering the de-escalation markets had priced in.
Every major token in the top 10 dropped. Ether slid 2.2% to $2,056, BNB fell 3.9% to $591, XRP lost 2.5% to $1.31, and solana’s SOL led losses at 5.2%, extending its weekly decline to 13%.
The selloff reversed a sharp global rally that had built through Tuesday on Trump’s earlier comments that the war could end within weeks and that a deal with Tehran was not a prerequisite. Asian stocks had surged 4%. S&P 500 futures had jumped. The mood was the most optimistic since the conflict began five weeks ago.
Then the speech happened. In nearly 20 minutes, Trump did not outline any shift in Iran policy, did not provide specifics on how operations would proceed, and did not signal any pathway to a ceasefire.
The Strait of Hormuz, the critical oil shipping lane that has been effectively shut since mid-March, would reopen “naturally” once hostilities subside, he said, without offering a timeline.
Brent crude jumped 5% to above $106 a barrel. Asian shares fell 2.1%. U.S. and European equity futures dropped more than 1.2%. The dollar strengthened. Treasuries dropped on inflation concerns.
The crypto-specific picture is now familiar to the point of numbness. Bitcoin has spent five weeks bouncing between roughly $60,000 and $73,000, selling on every escalation headline, rallying on every de-escalation headline, and ending up roughly where it started.
The Fear and Greed Index sits at 8, deep in extreme fear territory, where it has been stuck between 8 and 14 for the past month.
There is a seasonal argument for optimism. April has historically been one of bitcoin’s strongest months, finishing green 10 out of 15 years with an average gain of 20.9% versus an average decline of 8.8% in down years. Bitcoin also bounced firmly off its two-month uptrend support near $60,000 last week and is attempting to reclaim the 50-day moving average.
But seasonality doesn’t trade against a war. The pattern of the past five weeks — hope, headline, reversal — shows no sign of breaking until the conflict itself does.

Liverpool injury update: Jeremie Frimpong, Mohamed Salah, Alexander Isak, Alisson Becker latest news and return dates

Users Are Paying Increasing Attention To These Factors When Choosing an Online Gaming Platform

Crypto-native media lost 33% of traffic in 2025 as crypto became easier to follow without it

Smart energy pays enters the US market, targeting scalable financial infrastructure

Why Israel is blocking foreign journalists from entering

Bitcoin: We’re Entering The Most Dangerous Phase

Explained: 7 financial changes from April 1 | Income tax | ATM withdrawals | PAN rules | STT hike

Krypto: Wenn Du im Minus bist, dann schau Dir das an.

New Financial Year, New Rules: New Financial Year Changes | New Income Tax Rules 2026 | BIG TV
-

 Business6 days ago
Instagram, YouTube Found Responsible for Teen’s Mental Health Struggle in Historic Ruling
-
 Tech7 days ago
Intercom’s new post-trained Fin Apex 1.0 beats GPT-5.4 and Claude Sonnet 4.6 at customer service resolutions
-

 NewsBeat5 days ago
The Story hosts event on Durham’s historic registers
-

 Sports5 days ago
Sweet Sixteen Game Thread: Tide vs Michigan
-
Entertainment3 days ago
Fans slam 'heartbreaking' Barbie Dream Fest convention debacle with 'cardboard cutout' experience
-
 Entertainment4 days ago
Lana Del Rey Celebrates Her Husband’s 51st Birthday In New Post
-
Crypto World2 days ago
Dems press CFTC, ethics board on prediction-market insider trades
-

 Crypto World11 hours ago
Gold Price Prediction: Worst Month in 17 Years fo Save Haven Rock
-

 Tech3 days ago
The Pixel 10a doesn’t have a camera bump, and it’s great
-

 Sports2 days ago
Tallest college basketball player ever, standing at 7-foot-9, entering transfer portal
-

 Tech2 days ago
EE TV is using AI to help you find something to watch
-

 Tech3 days ago
Apple will hide your email address from apps and websites, but not cops
-

 Tech2 days ago
Flipsnack and the shift toward motion-first business content with living visuals
-

 Tech2 days ago
How to back up your iPhone & iPad to your Mac before something goes wrong
-

 Fashion7 days ago
En Vogue in Brown Leather and Tailored Neutrals by Atelier Savoir, Styled by J Bolin
-

 Politics2 days ago
Should Trump Be Scared Strait?
-

 Crypto World2 days ago
U.S. rule change may open trillions in 401(k) funds to crypto
-

 Fashion7 days ago
What Are Your Favorite T-Shirts for the Weekend?
-

 Fashion6 days ago
Weekly News Update, 3.27.26 – Corporette.com
-
 Crypto World3 days ago
Bitcoin’s Six-Month Losing Streak: What On-Chain Data Says About the Market’s Next Move
You must be logged in to post a comment Login