

Crypto World
Anthropic Mythos Found Cracks in the Government’s Most Guarded Systems


Anthropic’s Mythos artificial intelligence (AI) model reportedly needed only hours to find certain security vulnerabilities in highly sensitive US government computer systems during an intelligence test, a US official told the Associated Press.
Still, that speed does not mean it could exploit them in the same window, the official said, speaking anonymously to discuss the sensitive matter.
Anthropic Mythos Mapped the Weak Spots in Secure Government Systems
The official said the testing was conducted under Project Glasswing. Anthropic opted against a public release for Mythos.
Instead, it granted a select group of more than 50 technology firms early access to the unreleased model, allowing them to identify and remediate critical software vulnerabilities.
Senator Mark Warner of Virginia referenced the tests on June 11. He spoke before the Senate Committee on Banking, Housing, and Urban Affairs.
“This tool broke into almost all of our classified systems, not in weeks but in hours,” he said.
Warner attributed the account to the head of the National Security Agency (NSA) and US Cyber Command, Gen. Joshua Rudd.
Follow us on X to get the latest news as it happens
Mythos already carries a track record of finding flaws. The UK’s AISI (AI Security Institute) tested Mythos Preview on expert-level capture-the-flag challenges. The model succeeded 73% of them. No model had cleared that bar before April 2025.
In April, Mozilla credited the AI model with surfacing 271 vulnerabilities in Firefox. The browser maker patched them in Firefox 150.
Anthropic then launched Claude Fable 5 in early June. It billed the model as a general release version of its Mythos tier, with added safeguards.
The opening was brief. On June 12, the US government issued an export control directive citing national security. The order required the firm to bar every foreign national from Fable 5 and Mythos 5.
Subscribe to our YouTube channel to watch leaders and journalists provide expert insights
The post Anthropic Mythos Found Cracks in the Government’s Most Guarded Systems appeared first on BeInCrypto.

Crypto World
Bitrue Becomes the First to Launch AI Tokenized Stocks Earn: Beating Dividends With a Flat 7% Return


Global exchanges are gearing up for AI stocks’ financial report release season, as Nvidia, Microsoft, Amazon, Alphabet, and Meta all move toward reporting earnings that the entire market will be watching. Bitrue is adding one more thing to that story: it is the first exchange to launch AI Tokenized Stocks Earn, offering a flat 7% annualized yield on tokenized shares of the same AI-era names investors are already watching this earnings season.
Owning a share of Apple, Tesla, or Nvidia has traditionally meant collecting whatever dividend the company decides to pay, often little, sometimes nothing at all. Bitrue is changing that equation, becoming the first exchange to offer a flat 7% annualized yield across its full “ON” tokenized stock lineup: NVDAON, SPCXON, TSLAON, GOOGLON, AAPLON, MSFTON, AMZNON, and METAON.
Bitrue’s own track record in this space isn’t new: it was the first crypto exchange to offer 3x leveraged exposure to AMD, and the first platform anywhere to offer 3x leveraged SpaceX exposure in either direction. The 7% flat yield extends that first-mover pattern from price exposure into the yield layer itself, and the timing, right as this earnings season kicks off, puts the AI Tokenized Stocks Earn launch directly in the path of the market’s attention.
Why this is a bigger deal than it sounds
Tokenized stocks have spent the last two years mostly solving one problem: letting people trade real equity exposure 24/7, without a broker, in fractional amounts. What they haven’t solved, until now, is the yield problem. A tokenized share of a stock was still just a wrapper, it moved in price the same way the real thing did, but it sat there earning nothing unless the underlying company happened to pay a dividend, and even then, the payout was often negligible.
By attaching a flat 7% yield directly to the token itself, Bitrue is turning tokenized stocks from a pure price-tracking instrument into something closer to an interest-bearing asset, a distinction that matters because it changes why someone would choose to hold the tokenized version instead of just buying the real stock through a broker. It’s the difference between a wrapper that copies a stock’s price and an asset that pays you for holding it.
The gap this closes
Traditional dividend yields on these names are thin, and in some cases nonexistent:
Stock
Traditional Dividend Yield
Bitrue Tokenized Yield (ON)
Yield Uplift
Apple (AAPLON)
0.32%
7%
~22x
Microsoft (MSFTON)
0.92%
7%
~7.6x
Alphabet (GOOGLON)
0.25%
7%
~28x
Nvidia (NVDAON)
~0.1-0.5%
7%
14-70x
Tesla (TSLAON)
No dividend
7%
Yield where none existed
Amazon (AMZNON)
No dividend
7%
Yield where none existed
Meta Platforms (METAON)
~0.3-0.4%
7%
~18-23x
SpaceX (SPCXON)
Not publicly traded, no dividend possible
7%
The only yield this exposure has ever offered
For names like Tesla and Amazon, the traditional version of the stock has never paid a cent in dividends, the tokenized version is the first version of that asset to generate any return beyond price movement at all. SpaceX is the clearest case of all: it isn’t even a public company, so there has never been a way for retail holders to earn yield on that exposure before now.
Why this matters
Owning a tokenized stock through Bitrue means the same underlying price exposure investors already look for, plus a fixed annualized return that doesn’t depend on a company’s dividend policy, its board’s decisions, or whether it’s even public in the first place. That combination, real-world equity exposure plus a flat, exchange-backed yield that beats the dividend on nearly every name in the lineup, is the kind of structural upgrade that’s difficult to replicate in a traditional brokerage account.
Get started
AI Tokenized Stocks Earn is live now on Bitrue.
Holders of NVDAON, SPCXON, TSLAON, GOOGLON, AAPLON, MSFTON, AMZNON, and METAON can start earning a flat 7% annualized yield today, no lockups beyond the product’s stated terms, no dependence on dividend announcements. Visit Bitrue’s Earn page to opt in before this earnings season’s biggest reports land.
Disclaimer: This product is not available to users in restricted jurisdictions, including but not limited to the US, UK, EU/EEA, Canada, Australia, and sanctioned countries. Tokenized products confer no shareholder rights in the underlying equity. Not financial advice. Full list of restricted jurisdictions
The post Bitrue Becomes the First to Launch AI Tokenized Stocks Earn: Beating Dividends With a Flat 7% Return appeared first on BeInCrypto.

Bitcoin (BTC) is “finally showing signs of a bottom,” but the next bull market will have a different source.
Key points:
- TradFi integrations, particularly Hyperliquid and Robinhood, will drive the next crypto bull market, says Bitwise’s Matt Hougan.
- The resulting tide should “lift” the largest cryptocurrencies with it, including Bitcoin and Ether.
- Apparent demand for BTC is already showing signs of reversal, per Bitwise data.
Hyperliquid, Robinhood catalyst to “lift most of” crypto sector
In a blog post on Wednesday, Matt Hougan, chief investment officer at crypto asset manager Bitwise, revealed his picks for what will “lift” BTC price action going forward.
BTC/USD is gaining ground against US stocks, Hougan notes, but investors should look elsewhere for the next long-term crypto comeback.
“So how should you start positioning for the new bull market?” he queried.
“By looking at two entities that are leading this convergence from opposite sides: Hyperliquid (HYPE) and Robinhood (HOOD).”
For Hougan, the bull market will depend on crypto-focused integrations that bring the market’s inherent benefits, such as 24/7 trading, to the TradFi realm.
“Today, nearly half the volume on Hyperliquid is in conventional assets like oil, silver, and the S&P 500. It’s expanding into spot commodities, prediction markets, and options,” he said about Hyperliquid.
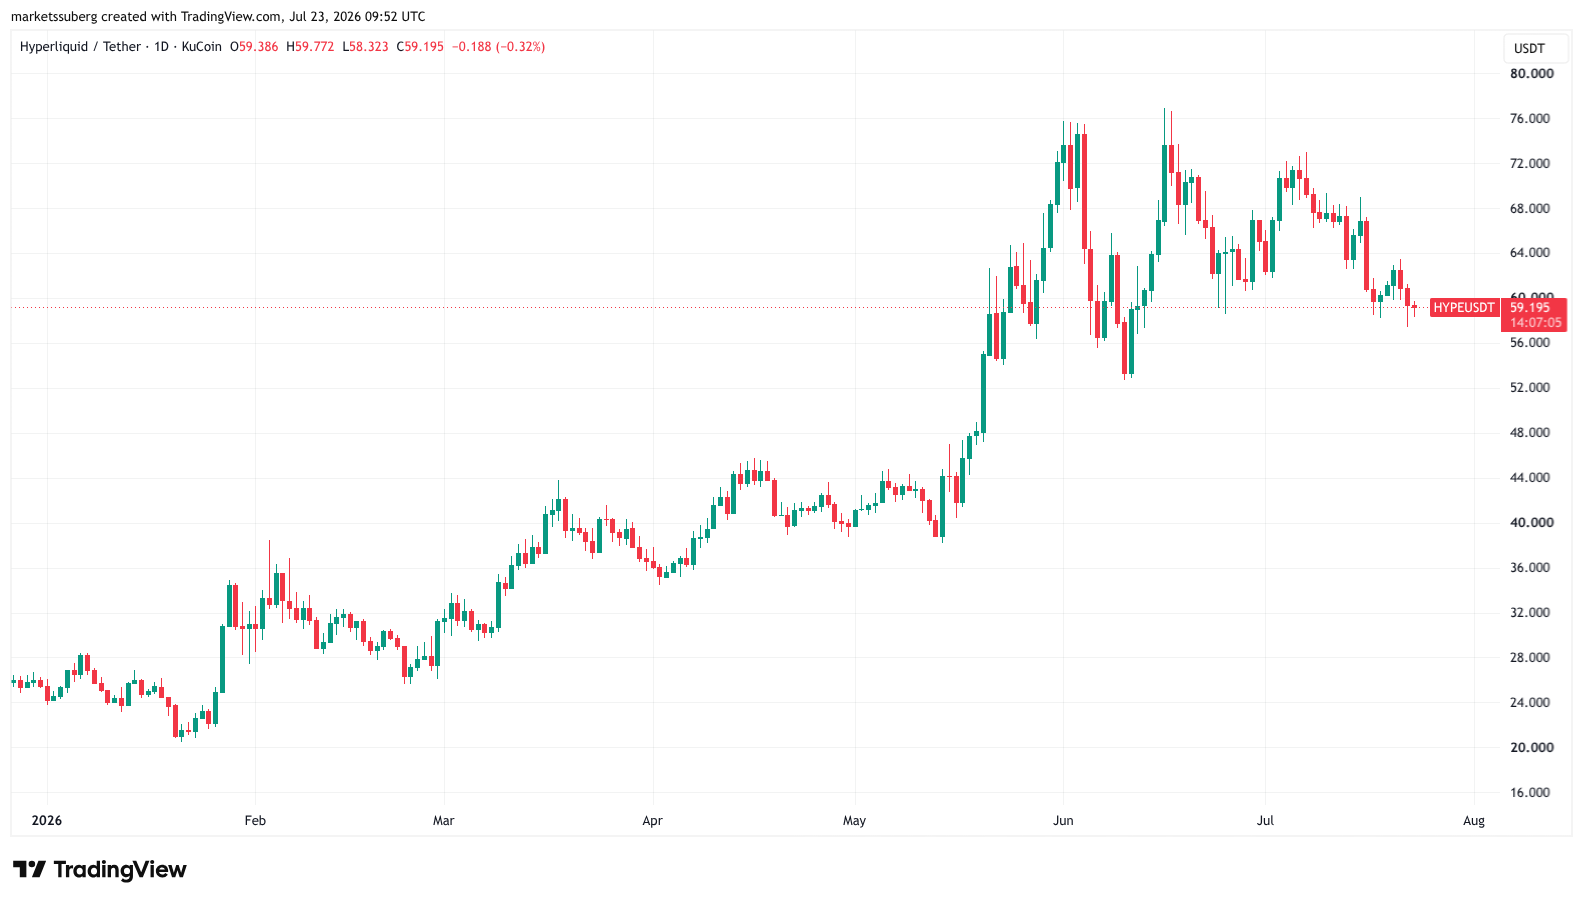
HYPE/USDT one-day chart. Source: Cointelegraph/TradingView
Hougan also sees competition from traditional financial players, like the Robinhood Chain layer-2 network, as a key catalyst to bring about a broader crypto renaissance.
“I suspect the coming bull market will be big enough to lift most of the sector,” he said.
“I’m bullish on the majors—Bitcoin, Ethereum, Solana, etc.—and on crypto equities. But there are two types of investments I think are particularly well positioned.”
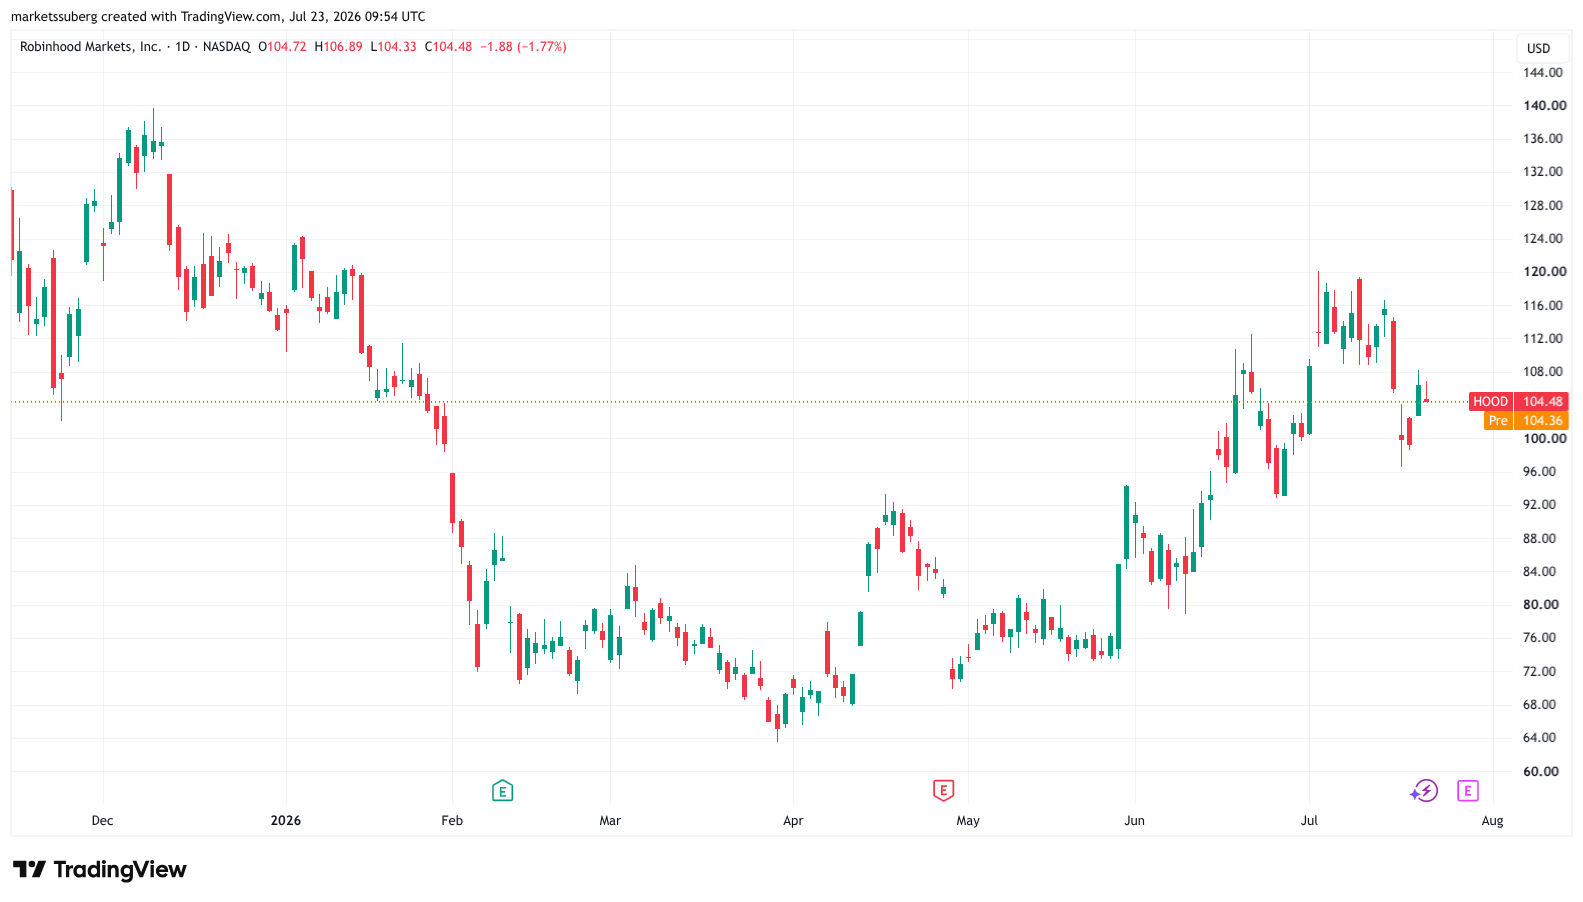
HOOD/USD one-day chart. Source: Cointelegraph/TradingView
The Bitwise executive has remained optimistic on Bitcoin and the wider market throughout 2026, in February predicting that the end of crypto winter would come “sooner rather than later.”
“Here’s the good news: We’re closer than you think,” he wrote at the time.
Bitcoin apparent demand reverses higher
As Cointelegraph reported, Bitcoin traders broadly agree that while some bottom signals are already flashing, the bear market has several months or more left to run.
Related: Bitcoin analysis eyes ‘serious volume’ after Binance sees 9K BTC daily outflow
Spot demand remains weak and has become a key talking point, even on shorter time frames. Here, however, Bitwise also sees a potential shift underway.
In an X post on Thursday, European head of research, Andre Dragosch, described “re-accelerating” apparent demand.
Apparent demand measures the difference between newly-mined BTC and the supply inactive for at least one year.
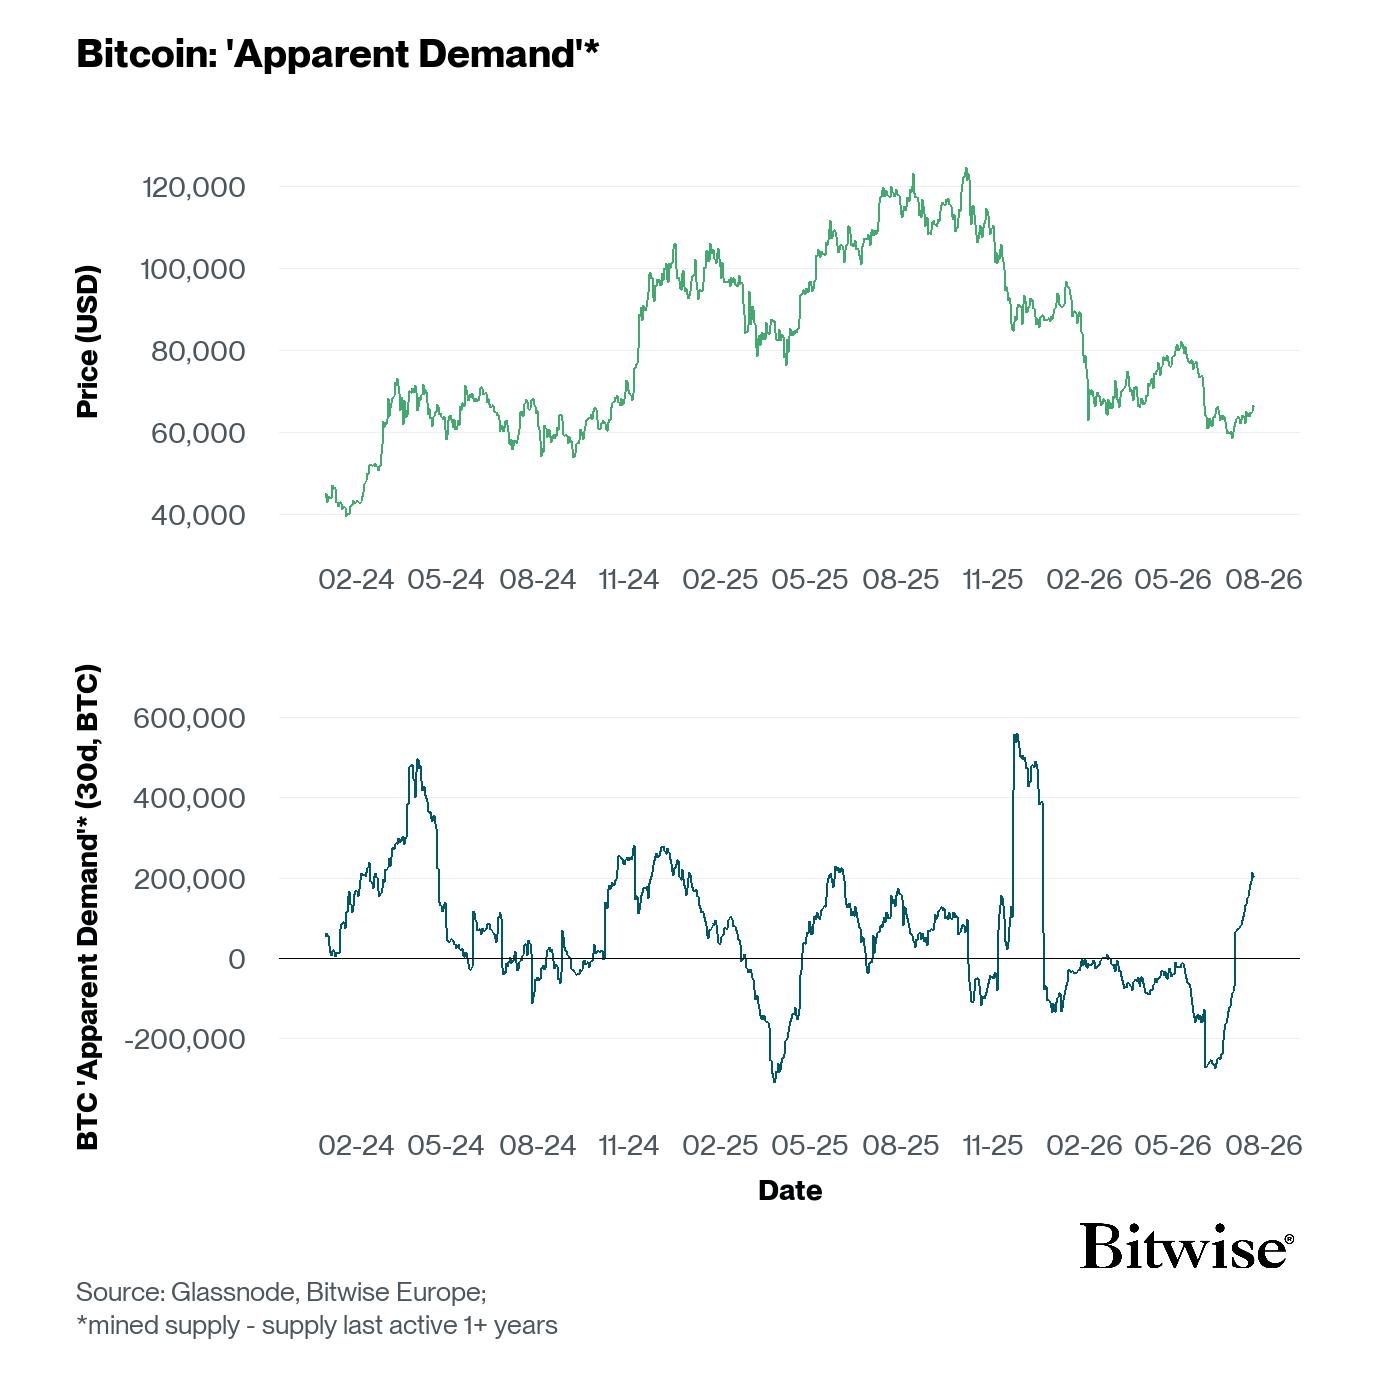
Bitcoin apparent demand data. Source: Andre Dragosch on X.com
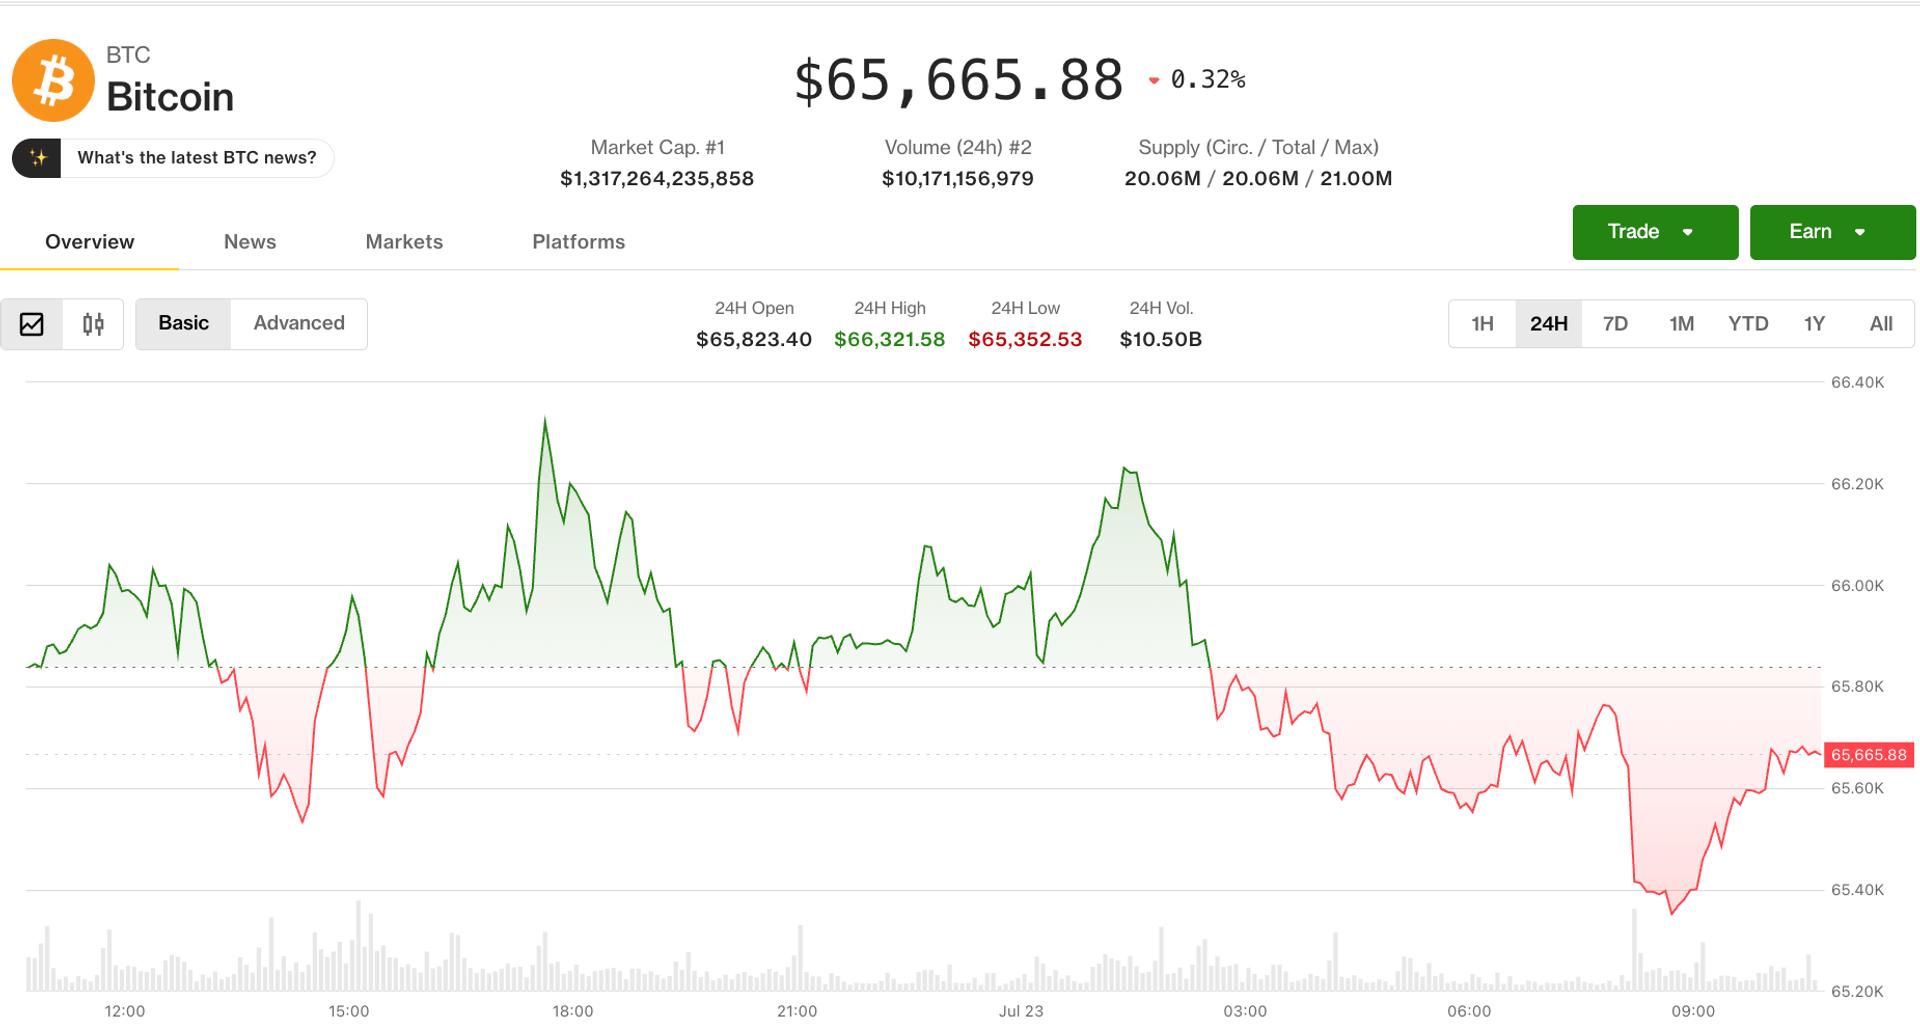

The crypto market is consolidating on Thursday, with bitcoin a modest 0.62% lower since midnight UTC at $65,674 as it settles into a range between $64,000 and $66,800 that has held for the past week.
The price action reflects a market catching its breath. Bitcoin has rallied more than 13% since its July 1 low of $57,750, and after failing to convincingly break above the $66,000 level of resistance on Tuesday, the path of least resistance in the short term appears to be sideways rather than sharply in either direction.
Traditional markets are offering little direction. Nasdaq 100 and S&P 500 futures are both marginally lower by around 0.3%, the dollar index (DXY) is broadly flat, and gold and silver are both pulling back after yesterday’s safe haven rally, leaving crypto without a clear macro catalyst to lean on in either direction.
Derivatives positioning
- Period of stasis: The crypto futures market appears to be in a state of stasis, with 24-hour trading volumes down just 1% at $147 billion and open interest (OI) holding steady around $111 billion. The 24-hour long-short ratio, which tracks taker volume, is nearly balanced. Taker volume refers to buy and sell trades executed immediately at ongoing market prices, and the current equilibrium suggests a lack of aggressive directional conviction among traders.
- Open interest shifts in major assets: Bitcoin’s futures open interest has slipped back to 743K BTC from the highs of over 760K BTC seen early this week. This decline indicates an unwinding of existing bets as the price rally stalls and valuations pull back slightly. A potential silver lining for bulls is that the drop in OI suggests the price weakness is being driven by long liquidations rather than the entry of fresh shorts betting on a deeper decline. In contrast, ETH’s OI has ticked up during the overnight price drop. However, the price action is still being led by buyers using market orders rather than passive limit orders, as evidenced by ETH’s positive 24-hour OI-adjusted cumulative volume delta (CVD).
- Mixed sentiment in altcoins: The broader market shows a split in aggressive leadership. Several coins, including ZEC, HBAR, LTC, AVAX, and SUI, are currently posting positive CVDs, indicating taker-buy pressure. However, there are just as many prominent names on the opposite side of the fence showing negative CVDs, including BTC, XLM, DOGE, and SHIB, signaling that aggressive sellers remain active in those specific markets.
- Rising volatility signals potential caution: Bitcoin’s 30-day implied volatility index, BVIV, has now increased for the fifth straight day. Traders may want to keep a close eye on this metric because, since the launch of spot ETFs, the correlation between Bitcoin’s spot price and the BVIV has been consistently negative. Under this regime, an upswing in the BVIV often serves as a warning of an impending price drop. Meanwhile, ether’s volatility index, EVIV, remains relatively stable.
- Options flows and evaporating fear: Flows across the Deribit exchange and the OTC desk Paradigm featured notable demand for the BTC $70,000 call option expiring Aug. 7. While some traders were positioned for upside, others simultaneously picked up longer-duration puts as a downside hedge. Ethereum options have also seen a general demand for upside exposure. Broadly speaking, market fear appears to be evaporating as put-call skews for both BTC and ETH slip toward zero. Notably, ETH’s one-week skew briefly turned negative yesterday, marking a temporary bullish shift in sentiment where calls became more expensive than puts.
Token talk
- was the standout mover on Thursday, surging 12.18% to $0.063. The Donald Trump family-linked token has now recovered to a $2 billion market cap, though it remains deep in the red from its all-time high.
- extended its recent run, rising nearly 4% to $1.989, keeping it among the more consistent AI outperformers of the past fortnight.
- Ethena (ENA) added 2% to $0.092, continuing a quiet rehabilitation that has seen it outperform most DeFi peers over the past week despite sitting more than 90% below its September 2025 peak.
- Lighter (LIT) continued to slide, falling 2.96% as profit-taking weighs on the token for a third consecutive session following its 200%-plus rally between May and early July.
- CoinMarketCap’s altcoin season indicator holds at 51/100 as the market waits for bitcoin to make a decisive move.


Mirae Asset Consulting has become Korbit’s largest shareholder after completing its acquisition, with the exchange saying trading and customer asset protections are unchanged.


Bitget, the world’s largest Universal Exchange (UEX), has been registered as a Financial Services Provider on New Zealand’s Financial Service Providers Register (FSPR).
The registration supports Bitget’s financial services framework and covers registered service categories including foreign currency exchange, domestic and cross-border money transfers, client asset custody, portfolio and money management, and the execution of financial product or foreign exchange transactions on behalf of clients.
Bitget has also joined the New Zealand Insurance and Financial Services Ombudsman (IFSO) Dispute Resolution Scheme. The independent scheme provides an external channel for eligible customers to raise and resolve disputes relating to participating financial service providers.
The registration forms part of Bitget’s work to build the operational and compliance infrastructure required for its expanding range of financial products, including traditional market instruments, foreign exchange services and tokenized real-world assets.
“Financial platforms need compliance structures that can support a wider mix of assets and services,” said Gracy Chen, CEO at Bitget. “The registration adds another layer to our international financial services framework as the platform continues connecting digital assets with established markets.
The Universal Exchange model brings crypto assets, tokenized stocks, commodities, foreign exchange and other financial products into a single trading platform. The company continues to develop its services through registered entities and qualified partners across different jurisdictions.
Disclaimer: Product availability remains subject to applicable laws, local requirements and regional eligibility. Registration on the FSPR does not constitute an endorsement, approval, or guarantee by the New Zealand Government, the Financial Markets Authority (FMA), or the Registrar of Financial Service Providers.
About Bitget
Bitget is the world’s largest Universal Exchange (UEX), serving over 125 million users and offering access to over 2M crypto tokens, 500+ tokenized stocks, ETFs, commodities, FX, and precious metals such as gold. The ecosystem is committed to helping users trade smarter with its AI agent, which co-pilots trade execution. Bitget is driving crypto adoption through strategic partnerships such as MotoGP™. Aligned with its global impact strategy, Bitget has joined hands with UNICEF to support blockchain education for 1.1 million people by 2027. Bitget currently leads in the tokenized TradFi market, providing the industry’s lowest fees and highest liquidity across 150 regions worldwide.
For more information, visit: Website | X | Telegram | LinkedIn | Discord
Risk Warning: Digital asset prices are subject to fluctuation and may experience significant volatility. Investors are advised to only allocate funds they can afford to lose. The value of any investment may be impacted, and there is a possibility that financial objectives may not be met, nor the principal investment recovered. Independent financial advice should always be sought, and personal financial experience and standing carefully considered. Past performance is not a reliable indicator of future results. Bitget accepts no liability for any potential losses incurred. Nothing contained herein should be construed as financial advice. For further information, please refer to our Terms of Use.
The post Bitget Registers as a New Zealand Financial Services Provider appeared first on BeInCrypto.

Ethereum price prediction has turned more cautious after the Verus Ethereum bridge suffered a $7.5 million exploit, raising fresh security concerns across the ecosystem. The attack did not compromise Ethereum itself. It targeted the bridge’s off-chain infrastructure instead.
According to security reports, the attacker exploited weaknesses in the Verus Ethereum bridge and drained roughly $7.54 million in assets. The breach affected the bridge’s infrastructure rather than Ethereum’s base layer. The incident renewed concerns over the risks tied to cross-chain protocols, even though Ethereum’s core network remained secure.
— Coin Bureau (@coinbureau) July 23, 2026
 ALERT: Verus Ethereum Bridge exploited AGAIN for another $7.53 million.
Blockaid reports the attacker exploited the bridge's import mechanism to trigger unbacked payouts, draining ETH, tBTC, USDC, USDT, EURC, MKR, and scrvUSD from bridge reserves using the same failure mode… https://t.co/mU3o9QeXL8
The Verus exploit was not an isolated event. Within roughly six hours, AFX on Arbitrum lost about $24.15 million, while Bitcoin scaling network B² suffered another $3.86 million exploit. The three attacks resulted in nearly $35 million in losses, making it one of the biggest waves of crypto security breaches this week.
Ethereum was not directly compromised, but repeated exploits across projects in its ecosystem have weakened market confidence. Most of the losses came from vulnerable off-chain components instead of broken cryptography. That has kept pressure on sentiment, leaving traders cautious even as Ethereum’s base layer continues to operate normally.
Discover: The Best Token Presales
Ethereum Price Prediction: Hold Its Key Support Level Amid the Hack Fallout?
Ethereum trades at $1,935 at press time, well below the most optimistic long-term forecasts. Standard Chartered still projects ETH could reach $7,500 by year’s end, while Arthur Hayes has suggested a cycle peak between $10,000 and $20,000. Those targets reflect bullish expectations, although near-term risks continue to dominate sentiment.
Before the latest security incidents, Ethereum had already entered a key consolidation phase after recovering from recent lows. The Verus bridge exploit added fresh uncertainty to the market, as security headlines often trigger short-term selling pressure. Traders are now watching whether buyers can defend support around current levels.

The bullish case remains intact if spot demand absorbs the latest wave of fear and institutional buying returns near major moving averages. That could keep Ethereum on track toward the next resistance zone above $2,000. A steady recovery would also reinforce confidence that recent ecosystem exploits have not damaged the network’s long-term outlook.
The base case points to sideways trading while markets digest the latest security news. A second major exploit involving Ethereum-based projects could spark another round of selling and threaten nearby support. Trading volume will be the key signal. Heavy selling would strengthen the bearish case, while muted volume could suggest the market is already moving past the latest shock.
Trade Ethereum on Bybit and Get a Chance to Win Our $1,000 USDT Airdrop
Bitcoin Hyper Positions for Early-Stage Upside While Ethereum Absorbs the Risk Narrative
When Ethereum takes headline risk from ecosystem hacks, capital that was rotating into ETH-adjacent plays tends to pause, or rotate entirely. That creates a window that early-stage infrastructure projects with differentiated positioning can absorb. The question is whether the upside runway justifies the early-stage risk.
Bitcoin Hyper ($HYPER) is positioning itself as the first Bitcoin Layer 2 with full Solana Virtual Machine (SVM) integration. It is targeting the performance ceiling that Bitcoin’s base layer structurally cannot reach. The pitch is direct: bring programmable, fast, low-cost smart contracts to Bitcoin’s security model without sacrificing the trust layer.
The presale has raised $32.9 million at a current token price of $0.0136835, with staking available at a high APY for early participants.
Two features stand out technically: the Decentralized Canonical Bridge for native BTC transfers and SVM-powered execution that the project claims outperforms Solana itself on latency benchmarks. For traders who track ecosystem rotation, infrastructure plays at sub-$33 million raise levels with genuine technical differentiation have historically offered the asymmetry that large-cap entries at cycle highs cannot.
Research Bitcoin Hyper’s full presale terms before sizing any position.
Discover: The Best Crypto to Diversify Your Portfolio
The post Ethereum Price Prediction: Another Protocol Hacked for $7.5 Million appeared first on Cryptonews.


Galaxy Digital has launched a planned $3.5 billion high-yield bond sale to help finance the expansion of its Helios data center campus in West Texas.
Summary
- Galaxy Digital is raising about $3.5 billion through its first junk bond sale to expand its Helios AI data center campus in Texas.
- The financing is backed by long term CoreWeave contracts that Galaxy expects to generate more than $1 billion in annual revenue.
- The bond sale adds to Galaxy’s growing investments in AI infrastructure alongside its digital asset and institutional businesses.
According to a Bloomberg report, the digital assets and AI infrastructure company intends to use the proceeds from its first junk bond offering to finance part of the Helios Data Center Campus in Dickens County, Texas, while also funding debt service reserves tied to the project.
The planned issuance adds Galaxy to a growing list of infrastructure developers using the U.S. high-yield debt market to fund large artificial intelligence projects. Bloomberg data shows developers have already raised about $28 billion through U.S. junk bond offerings this year to finance AI-focused data center construction.
The transaction is expected to price on July 23, according to a person familiar with the matter cited by Bloomberg. Morgan Stanley and Goldman Sachs are leading the sale, while the source said the offering consists of five-year notes issued by a Galaxy subsidiary.
Under the proposed structure, the issuing entity will begin repaying 4% of the original principal each year starting 10 months after construction is completed, according to the same source, who requested anonymity because the information is not public.
CoreWeave contract supports long-term expansion
Earlier this month, Galaxy said CoreWeave had signed 15-year agreements to lease computing capacity at the Helios campus. According to the company’s previous announcement, those contracts are expected to generate more than $1 billion in annual revenue once operational.
The company also said the first phase of the Helios project has already been completed. Construction on the next phase is expected to begin in 2027 as Galaxy continues expanding the campus for artificial intelligence and high-performance computing workloads.
Located in Dickens County, roughly 60 miles east of Lubbock, the Helios campus has regulatory approval for up to 1.6 gigawatts of power dedicated to AI and high-performance computing, according to Galaxy’s previously released figures.
The financing plan follows another large AI infrastructure transaction completed last month. Bloomberg data shows an Applied Digital subsidiary raised approximately $1.59 billion in the U.S. junk bond market to expand computing capacity for CoreWeave at a North Dakota facility.
Before pursuing the current bond offering, Galaxy had primarily relied on convertible note offerings to raise capital for its operations.
AI infrastructure becomes a larger part of Galaxy’s business
Originally known for its digital asset businesses, Galaxy has steadily increased its investment in artificial intelligence infrastructure during 2026 alongside its cryptocurrency operations.
The Helios campus has become one of the company’s largest long-term infrastructure projects as demand for AI computing capacity continues to grow. Its partnership with CoreWeave places the site among several facilities being developed to support large-scale AI training and cloud computing services.
Galaxy has also tied the project to regional partnerships in West Texas. Last week, the company signed a 15-year agreement with Texas Tech University to rename the school’s football venue Galaxy Stadium beginning with the 2026 season.
According to Galaxy’s announcement at the time, the agreement also made the company Texas Tech Athletics’ official digital assets and data center partner. Besides stadium naming rights, both parties said they plan to collaborate on artificial intelligence initiatives, workforce training programs and opportunities involving student-athletes’ names, images and likenesses, although financial terms were not disclosed.
The university partnership links Galaxy’s existing data center operations in Dickens County with one of the region’s highest-profile athletic programs, further strengthening its presence in West Texas as development of the Helios campus continues.
Crypto business continues expanding alongside AI
Even as Galaxy increases spending on AI infrastructure, it has continued expanding other parts of its digital asset business.
Earlier this week, the company introduced a $5 million Bitcoin Quantum Readiness Initiative to support developers working on technologies designed to prepare the Bitcoin network for future quantum computing risks.
According to Galaxy, the grant program will fund research into quantum-resistant signature schemes, wallet migration tools and independent security audits. The company also said it hopes universities, companies and other institutions will contribute funding and technical expertise to accelerate work on post-quantum cryptography.
Galaxy cited research from CryptoQuant estimating that about 6.9 million Bitcoin, worth roughly $461 billion at current prices, could become exposed if future quantum computers become capable of breaking Bitcoin’s existing cryptographic protections. While the company acknowledged that such machines are not expected to pose an immediate threat, it argued that preparing the ecosystem would require years of coordination across developers, exchanges, wallet providers and infrastructure operators.
The company has also expanded its regulated financial services business this year. In May, Galaxy secured both a BitLicense and a Money Transmission License from the New York State Department of Financial Services through its subsidiary GalaxyOne Prime NY, allowing it to provide regulated digital asset trading and custody services to institutional clients in New York.
Earlier in 2026, Galaxy also announced plans to launch a $100 million hedge fund focused on cryptocurrency tokens alongside financial services companies expected to benefit from digital asset adoption and regulatory developments.
With the planned $3.5 billion bond sale, Galaxy is adding another financing milestone to its expanding AI infrastructure business while continuing to invest across digital assets, institutional services and Bitcoin network development.


Crypto exchange BitMEX will shut down on September 23, 2026, at 04:00 UTC. The team announced the closure on Thursday, saying the decision was made after a strategic review of the business and the market.
The Seychelles-based firm immediately halted all new account registrations. It told users to close positions and withdraw funds well before the deadline.
What the BitMEX Shutdown Means for Users
BitMEX set a phased wind-down before the final date. From August 26, 04:00 UTC, it will block new positions and allow only reductions.
The exchange will then force-close any open trades. Any positions left open at closure will be automatically closed.
“All users are on notice that BitMEX may force close positions as described above at its sole discretion, and takes no responsibility for any trading losses that result from users’ inability to close their positions between now and the Closure Time,” the blog read.
Unwithdrawn balances also carry a cost. Users who have completed Know Your Customer (KYC) verification but do not withdraw their assets before the platform’s closure deadline will be subject to a fee. The monthly fee will be based on whichever is higher: $50 equivalent or 1% per year of the remaining account balance.
BitMEX unstaked all BMEX Token (BMEX) holdings and returned them to accounts. It also warned traders about scams tied to the news.
Follow us on X to get the latest news as it happens
A Pioneer of Crypto Derivatives Winds Down
The board of HDR Global Trading Limited, owner of the exchange, decided to close it after “strategic review of the business and and the broader crypto industry.”
“We continue to take pride in our robust security posture, which, unlike many of our peers, has resulted in BitMEX experiencing zero funds lost to hacks during its entire operating history of over 11 years,” the team added.
Nonetheless, the exchange carries a heavy legal record. Founders Arthur Hayes, Ben Delo, and Samuel Reed pleaded guilty in 2022 to Bank Secrecy Act violations for “willfully failing to establish, implement, and maintain an anti-money laundering program at BitMEX.
The company itself pleaded guilty in July 2024. BitMEX was fined $100 million and ordered 2 years of probation in January 2025.
President Trump pardoned the company, its three founders, and former executive Gregory Dwyer in March 2025.
Subscribe to our YouTube channel to watch leaders and journalists provide expert insights
The post BitMEX Exchange Announces Shut Down, Ending 11-Year Run appeared first on BeInCrypto.
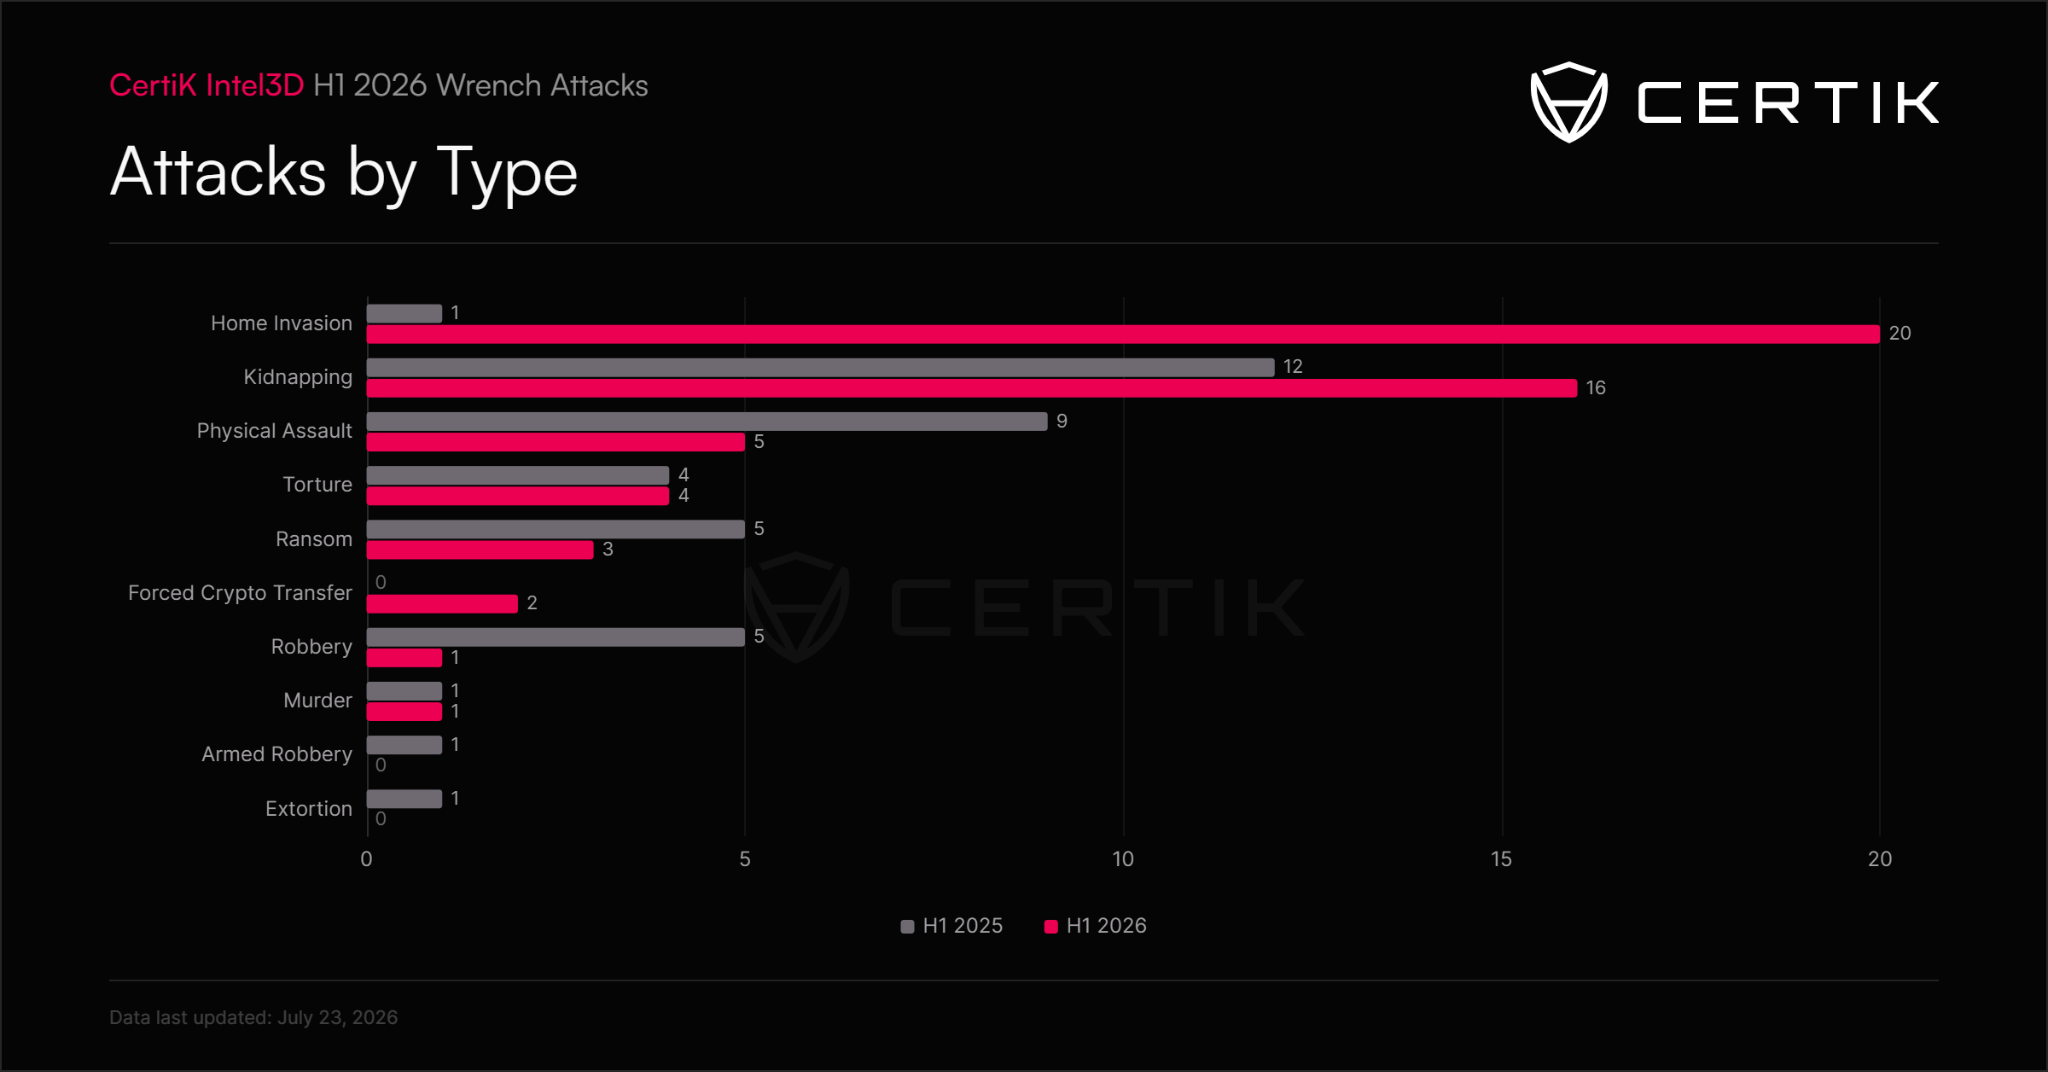
Home invasions became the most common form of crypto wrench attacks during the first half of 2026, rising to 20 publicly reported incidents from just one a year earlier, according to blockchain security firm CertiK.
On Thursday, CertiK said it verified 52 wrench attacks worldwide in the first half of 2026, up 33.3% from 39 incidents during the same period in 2025. Kidnappings rose to 16 from 12, while robberies declined from five incidents to one.
CertiK said the recorded financial exposure linked to the attacks reached about $124.1 million, up from $10.5 million a year earlier. The figure is not limited to confirmed thefts and may include ransom demands, victim transfers, frozen or recovered assets and failed ransom demands.
The increase in home invasions suggests criminals are increasingly bypassing digital safeguards by physically coercing crypto holders and their families.

Attack type year-on-year, H1 2025 vs. H1 2026. Source: CertiK
France remains center of crypto wrench attacks
Europe accounted for 39 of the 52 verified incidents, while France alone accounted for 33, or nearly two-thirds of the global total. CertiK said it used a narrower methodology than French authorities, counting only publicly reported incidents it could independently verify.
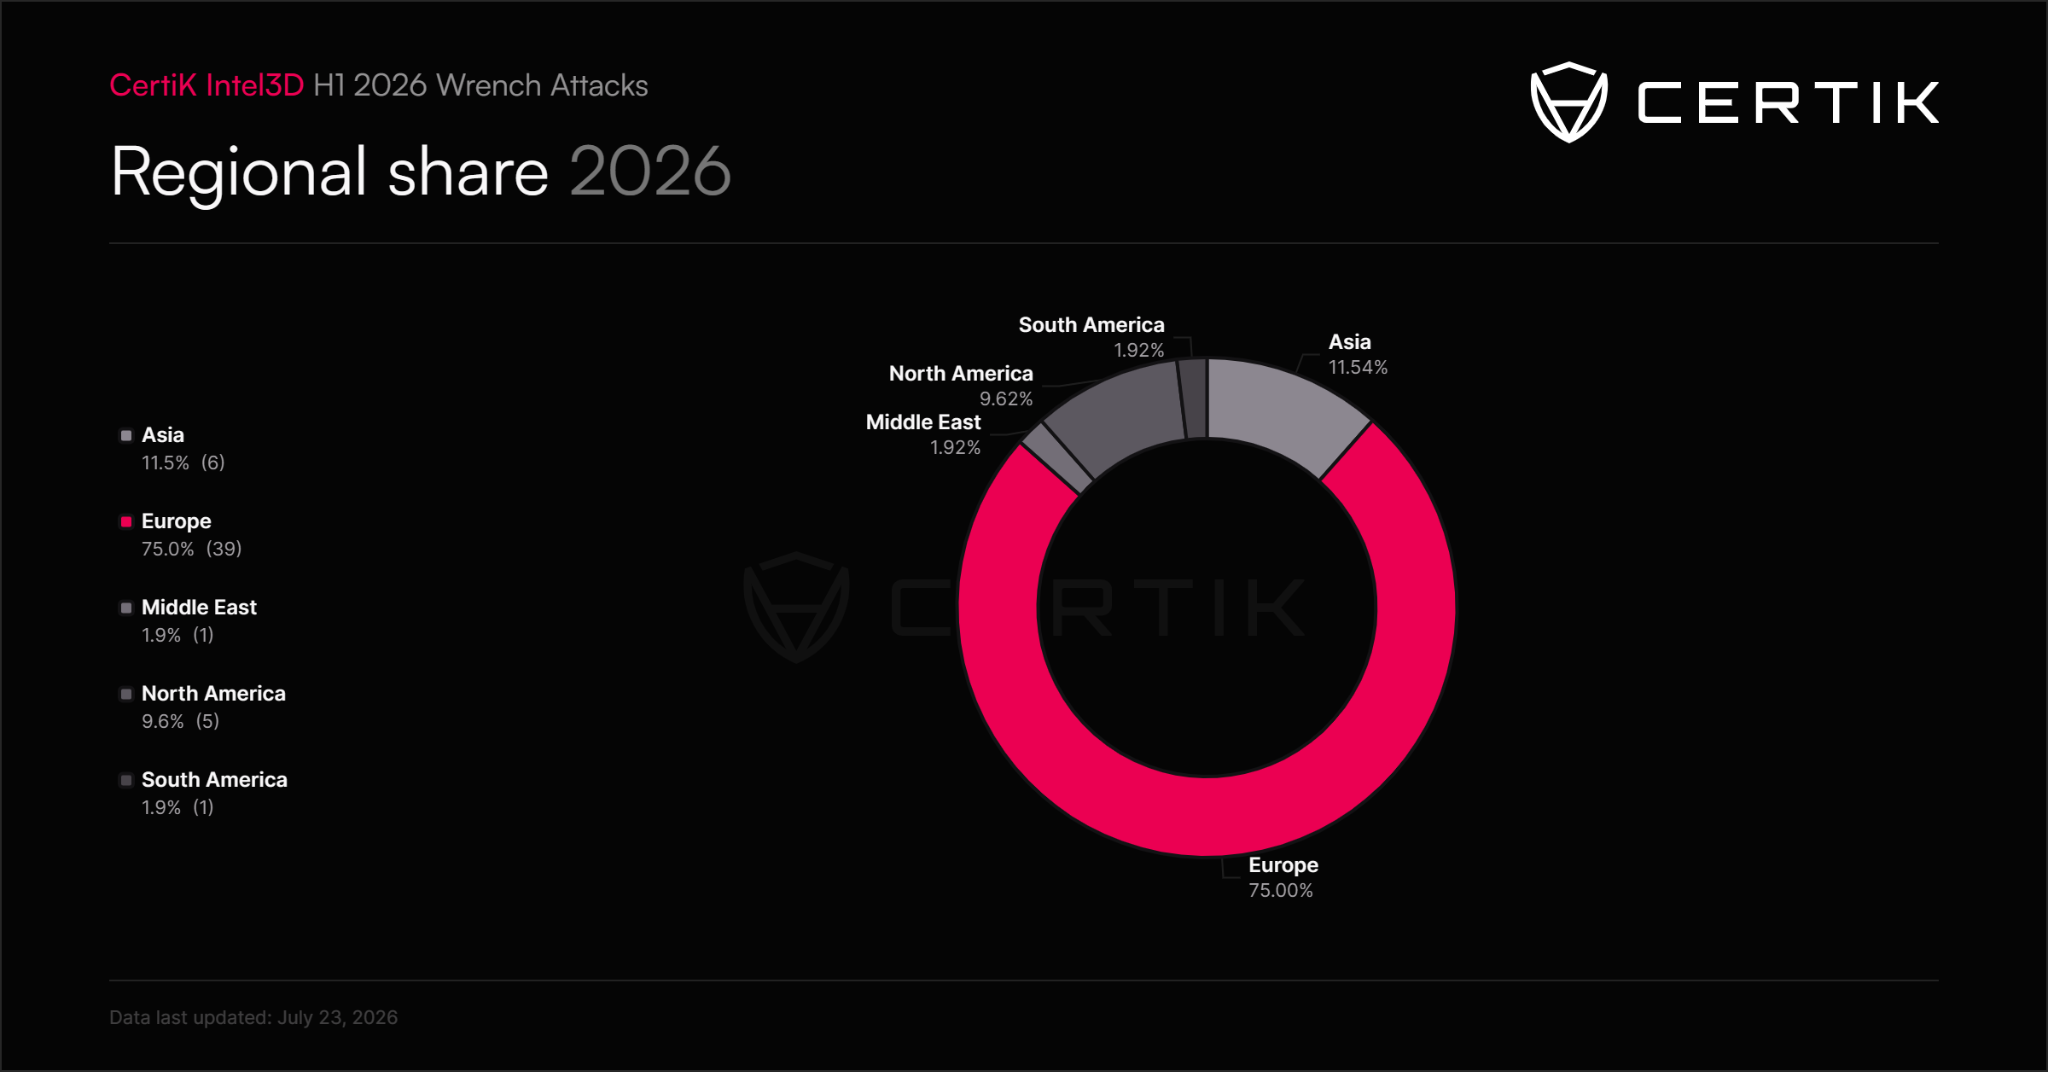
Share of wrench attacks by region. Source: CertiK
On July 2, French Interior Minister Laurent Nuñez said authorities had recorded 77 crypto-linked kidnappings, extortion cases or attempted extortion cases during the first half of 2026, up from 45 in the entire year of 2025.
CertiK said the concentration may reflect France’s more visible crypto ecosystem, with data breaches and information connecting identities and home addresses with perceived crypto wealth.
Related: US seeks forfeiture of $25M in crypto tied to romance, investment scams
In response, French authorities launched a dedicated prevention platform and a rapid-alert system for crypto holders and professionals. Nuñez said that emergency measures have resulted in 200 arrests.
CertiK said the rise in physical coercion challenges conventional self-custody advice. The company recommended multisignature or multiparty computation arrangements, withdrawal delays, spending limits and geographically separated signers so one threatened person cannot immediately release all available assets.
Magazine: Inside the ‘fake police raid’ that forced a $1M Bitcoin transfer
Bitcoin’s price ascent from earlier this week couldn’t continue in the past 36 hours or so, and the asset even dipped toward $65,000, where it found some support.
Most larger-cap alts have remained sideways on a 24-hour scale, aside from WLFI, which has rocketed by double digits.
BTC Calms Below $66K
The end of the previous business week saw another rejection for BTC, which had pumped to $65,600 a few days prior after the favorable US CPI data for June. After the bears stepped up, though, the asset slipped to $62,500 on Friday. Nevertheless, this was a short-term decline, and the cryptocurrency rebounded to $64,000 over the weekend.
It even challenged $65,000 on Monday morning before it was stopped again. This time, the retracement was a lot more modest, taking bitcoin south to $63,750.
The bulls intervened at this point and initiated a couple of consecutive leg-ups that culminated on Tuesday morning with a surge to $67,000. This became bitcoin’s highest price tag in over a month. However, it couldn’t breach that level and dipped to $65,600 yesterday and $65,300 earlier today. The latter provided the necessary support, and BTC has now calmed at just under $66,000.
Its market capitalization has stalled below $1.320 trillion, while its dominance over the alts has fallen to 56.5% on CG.

The 360% Gainer
The top 100 alts by market cap have a new rep as of today, and it’s also the most significant gainer (on CoinGecko). Blockchain Capital’s BCAP has skyrocketed by over 360% in the past 24 hours to a price tag of $106. However, CG reports $0 trading volume, while the market cap has neared $1 billion.
WLFI has jumped the most from the proven altcoins, pumping by over 11% to $0.063. STABEL follows suit, while HBAR and UNI are up by around 4% each. Meanwhile, most other larger-cap alts have marked gains of up to 2%, including XMR. BCH, XLM, CC, and TRX, on the other hand, are slightly in the red.
The total crypto market cap has remained sideways at just over $2.3 trillion on CG.

The post WLFI Pumps by Double Digits as Bitcoin (BTC) Settles Below $66K: Market Watch appeared first on CryptoPotato.
IND vs ZIM: Who is Ashok Sharma? Farmer’s son makes India debut after 154.2 kmph IPL breakthrough | Cricket News

New msaRAT malware uses Chrome, Edge browsers to route C2 traffic
JJ Gabriel plan and injury blow during training – Manchester United Academy Notebook


-
 NewsBeat7 days ago
London Mayor Sadiq Khan handed a peerage by Keir Starmer alongside 15 other Labour figures… just days before the PM leaves No10
-

 Fashion6 days ago
Weekend Open Thread – Corporette.com
-

 Politics5 days ago
The House | The City of London can help the new chancellor deliver growth in every postcode
-
 Crypto World5 days ago
Ripple Payments Joins MiCA With 14 Firms, Does It Mean Anything For XRP?
-
 Crypto World6 days ago
Two July Windows Left: The CLARITY Act’s Senate Fight and What Failure Means
-

 Politics4 days ago
Democrats look to World Cup watch parties to register thousands of voters
-

 Crypto World6 days ago
Ripple wins EU-wide access as ESMA adds it to MiCA register
-

 Crypto World2 days ago
Grayscale Files For Worldcoin ETF, WLD Registers Sharp Rise
-

 NewsBeat3 days ago
Unregistered fitter used Gas Safe logo on business flyers
-
 Tech2 days ago
Sail Virtually Aboard The “Itanic” With IA-64 Emulator
-

 Crypto World7 days ago
Injective Submits SEC Transfer-Agent Registration to Onchain Ownership Records
-
 Tech2 days ago
Turtle Beach Command Series KB7 review: a nifty screen-equipped gaming keyboard
-

 NewsBeat6 days ago
Registration is now open for March for Men with Kev 2026
-
 Business1 day ago
New Jersey voter registration controversy explained: How 6,600 noncitizens got on the rolls, and what happens next
-
 Crypto World7 days ago
Claude Fable 5 Slips to Second in AI Coding Leaderboard
-

 News Videos6 days ago
Money | Class 12 Economics | CBSE Board Exam 2026-27
-

 Business6 days ago
Banco Bilbao Vizcaya Argentaria, S.A. (BBVA) Discusses Global Macro Environment and Economic Outlook for Core Markets Transcript
-

 Crypto World5 days ago
Kaspersky exposes OkoBot’s 20-module crypto wallet attack
-

 News Videos4 days ago
Big Money Is Entering XRP
-

 NewsBeat5 days ago
Durham County Council to send out electoral registration emails
You must be logged in to post a comment Login